LTIMindtree Ltd (LTIM) — 21-Jun-2026 Technical & Rank View: Long-Term Leadership, Short-Term Pressure
LTIMindtree Ltd (LTIM) enters this update with a clear cross-horizon split: long-duration KGNAI ranks remain positioned near the top of the tracked INDIA universe, while short-term readings show meaningful deterioration. The yearly rank sits at #4 out of 1220 and the 6-month rank at #11, signaling persistent longer-term relative strength. In contrast, the daily rank at #1135 flags near-term weakness that can override tactical timing. Technical structure is also strained: the framework reads Close vs MA50 = Bearish and MA50 vs MA200 = Bearish, while the 18-signal confluence score is -0.333 and the blended technical score is -0.451, both labeled Bearish. Volatility conditions appear contained with Bollinger bandwidth at 0.1306, elevating the importance of confirmation around key decision zones: support ~3892.0250 and resistance ~4430.5500. News sentiment is modestly positive on aggregate, but is not instrument-specific in the provided data.
- Rank stance: Short-term Bearish | Mid-term Bullish | Long-term Bullish (Yearly #4, 6-Month #11)
- Technical confluence: Overall Technical Score -0.451 Bearish
- Key levels: Support 3892.0250 | Resistance 4430.5500
- News sentiment bias: Slightly positive aggregate backdrop (avg 0.051; Positive 25%, Neutral 69%, Negative 6%)
- Confirmation / invalidation: A break above 4430.5500 with volume supports continuation; a close below 3892.0250 increases deterioration risk.
KGNAI evaluates assets using large cross-sectional datasets built from millions of structured data points. Inputs incorporate fundamental metrics, technical structures, and systematically processed news sentiment. Statistical models, machine learning, and AI frameworks are used to assess relative positioning, signal alignment, and probabilistic behavior across broad universes.
- Ranks are comparative across the tracked universe, not absolute price targets.
- Confluence reflects alignment among independent signal groups.
- Support/resistance levels are probabilistic decision zones, not guarantees.
- Sentiment provides contextual bias within the broader analytical framework.
1) KGNAI AI Analysis
Region: INDIA
Total universe size: 1220 ranked instruments
- Daily rank: #1135 out of 1220 — Bearish
- Weekly rank: #98 out of 1220 — Bullish
- Monthly rank: #25 out of 1220 — Bullish
- 3-Monthly rank: #61 out of 1220 — Bullish
- 6-Monthly rank: #11 out of 1220 — Bullish
- Yearly rank: #4 out of 1220 — Bullish
The rank stack presents a classic regime mismatch: LTIM remains in the top decile on longer horizons (notably #4 yearly and #11 over 6 months), while the daily rank of #1135 signals near-term stress versus the broader universe. When this type of dispersion appears, KGNAI typically treats it as a timing problem rather than a thesis replacement: longer-horizon strength can persist, but entry/position management becomes highly sensitive to short-term price structure and confirmation.
The mid-horizon ranks are constructive—#25 monthly and #61 3-month—suggesting the longer-term leadership has not fully unwound. The weekly rank at #98 supports that the weakness is not uniformly distributed across all shorter frames. This mixed distribution often coincides with a market that is repricing the instrument in the short run while still recognizing its longer-term relative quality.
Interpreting these ranks alongside the technical dashboard later in the report is critical because the AI rank system is comparative and probabilistic. In this update, the declared term view remains: Short-term Bearish, Mid-term Bullish, Long-term Bullish. The practical implication is that tactical signals (support/resistance, MA alignment, RSI/MACD structure) carry more weight for risk control, while the longer-horizon ranks argue against over-interpreting any single short-term downdraft as a definitive trend break.
2) Price & trend overview
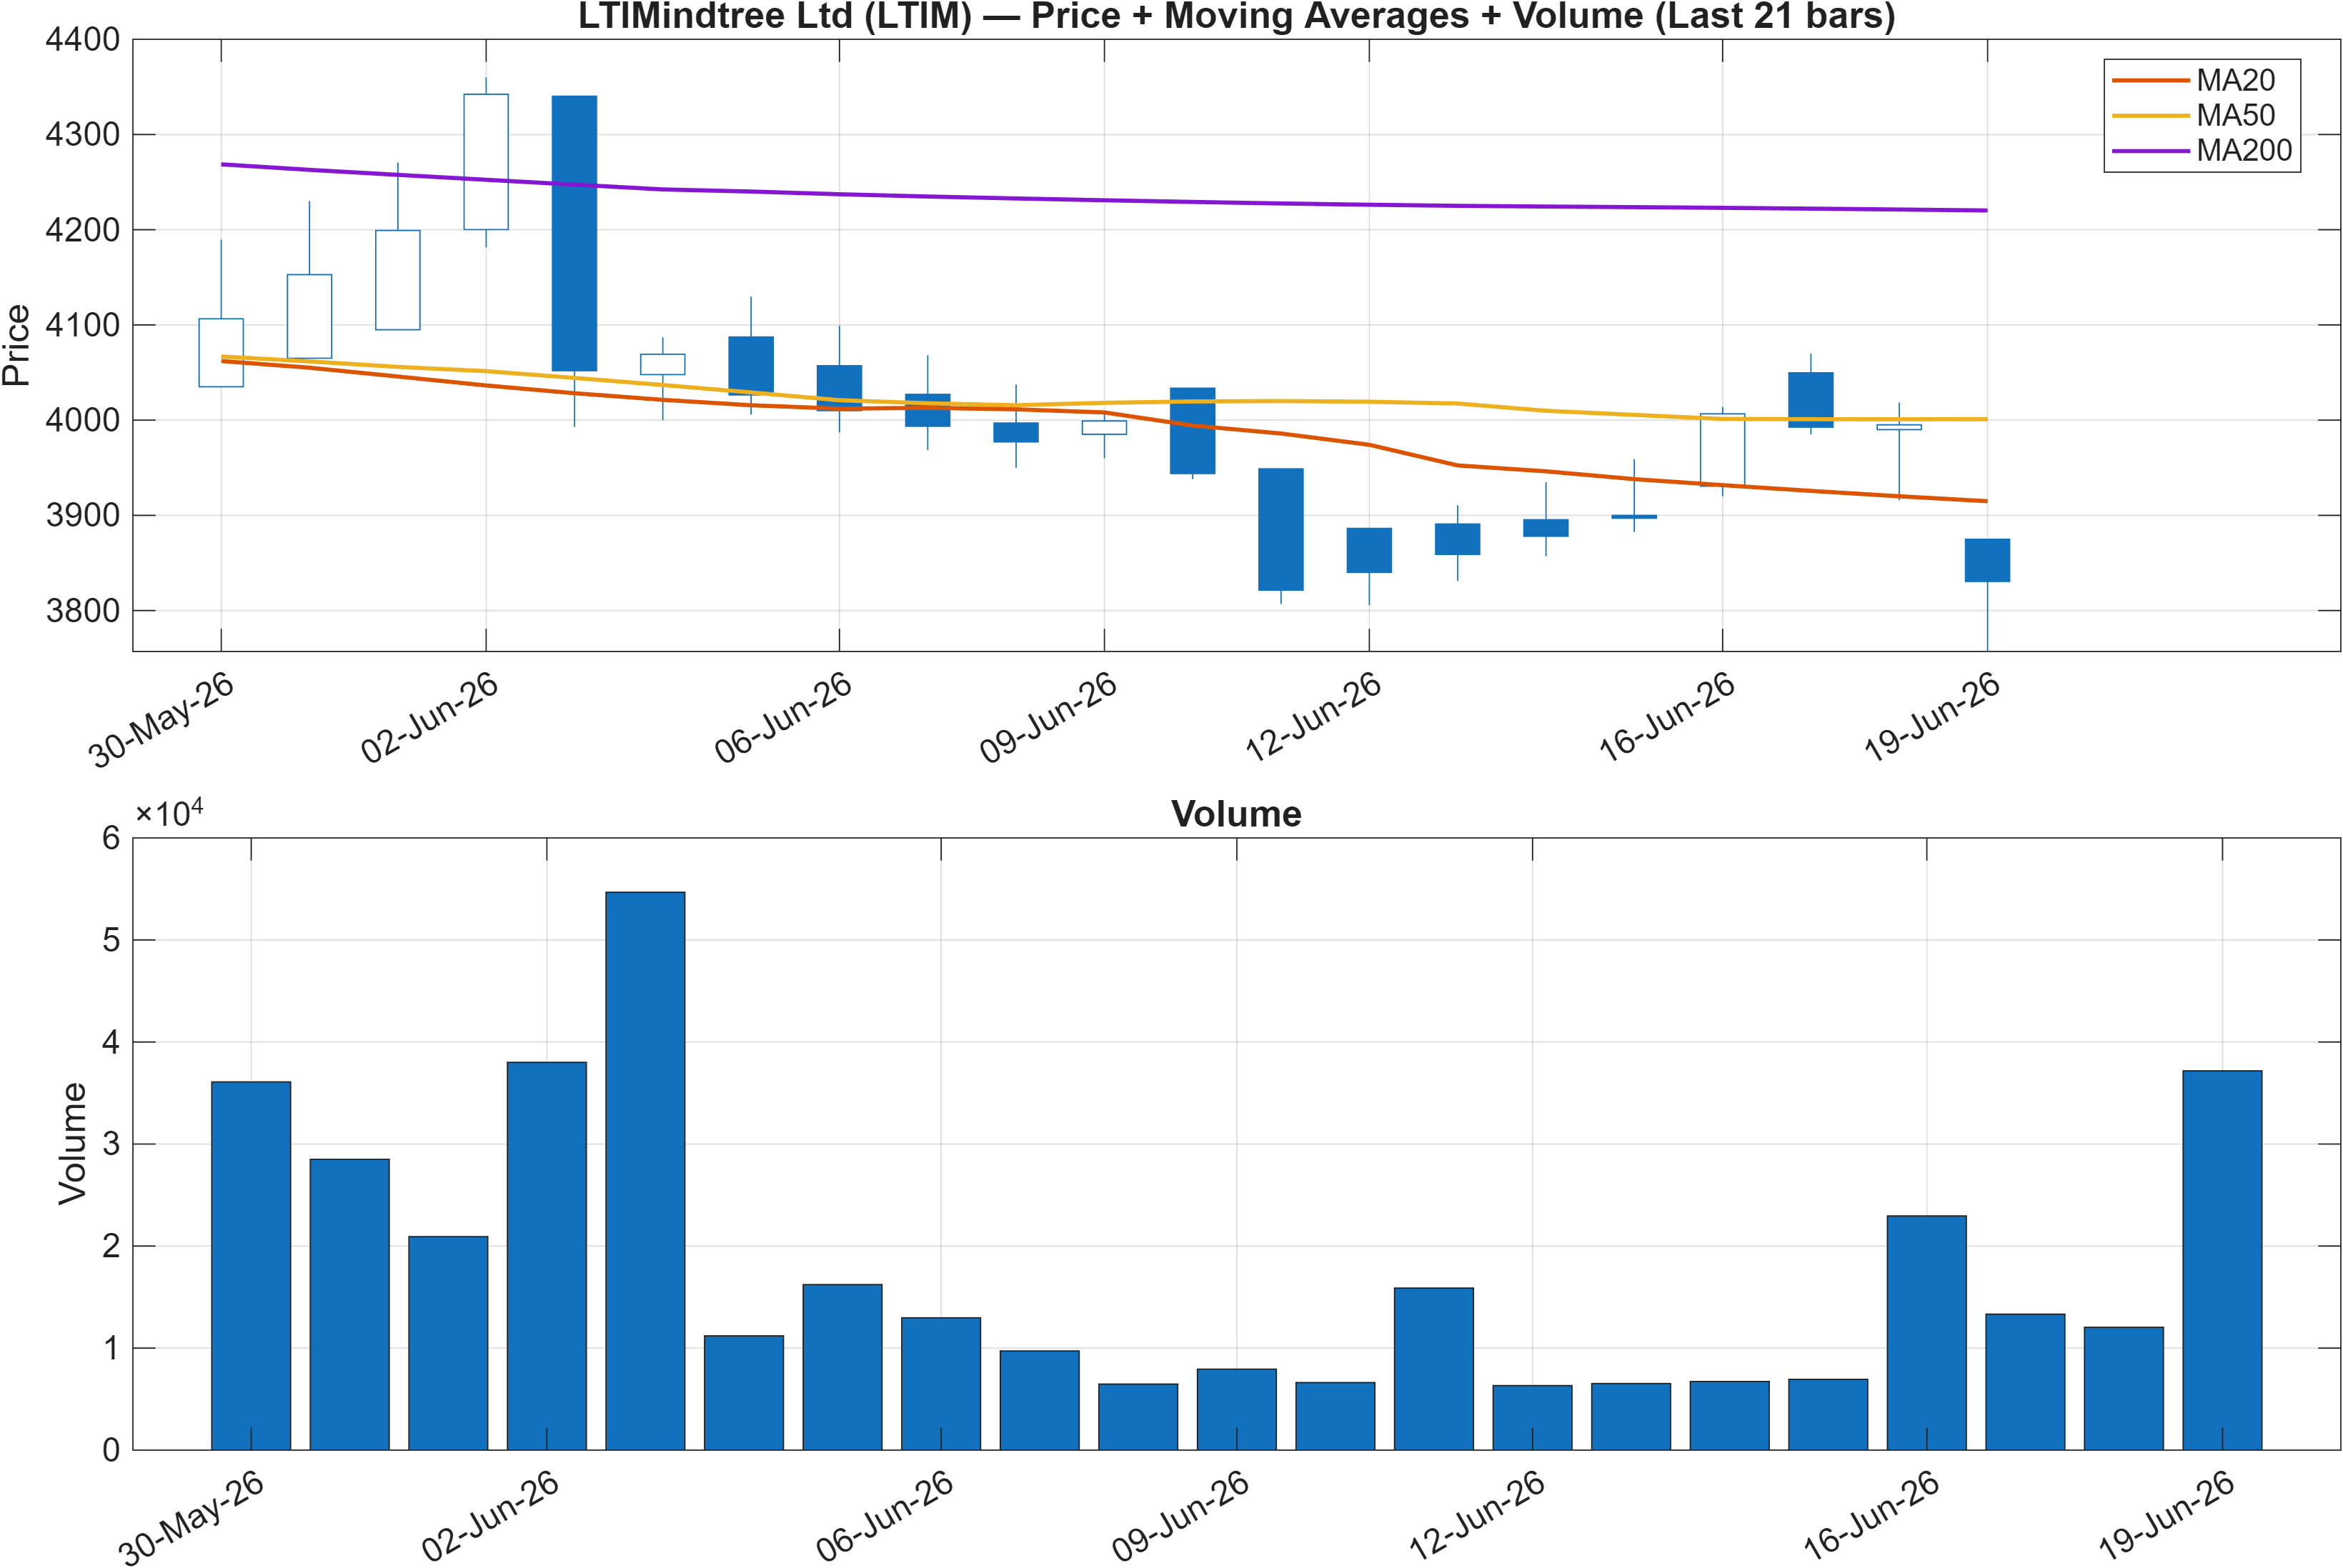
Interpretation: Close vs MA50 = Bearish, MA50 vs MA200 = Bearish.
The trend layer is currently defined by dual bearish moving-average conditions: price is below the 50-day average (Close vs MA50 = Bearish) and the 50-day average is below the 200-day average (MA50 vs MA200 = Bearish). This combination typically indicates that weakness is not only present in the most recent tape, but has also filtered into intermediate trend structure—an environment where rallies can be more likely to encounter supply until proven otherwise.
The key analytical tension is that these bearish trend signals sit alongside strong longer-horizon ranks (for example, #4 yearly). That is a form of trend vs. relative-strength divergence: LTIM may still compare well to the broader universe over longer windows, yet the current price structure suggests the market is demanding new confirmation before re-accelerating.
In this context, the most informative behavior is often not the slope of the averages alone, but whether price can reclaim and hold above key reference zones with participation. The report’s scenario framing later ties this to resistance ~4430.5500 and support ~3892.0250. Given that the technical confluence is also bearish (overall -0.451), trend-following interpretation remains cautious until the chart demonstrates a shift from distribution to accumulation. Absent that, the moving-average structure argues that rebounds may behave more like mean-reversion moves than a confirmed trend resumption.
3) Momentum & volatility dashboard
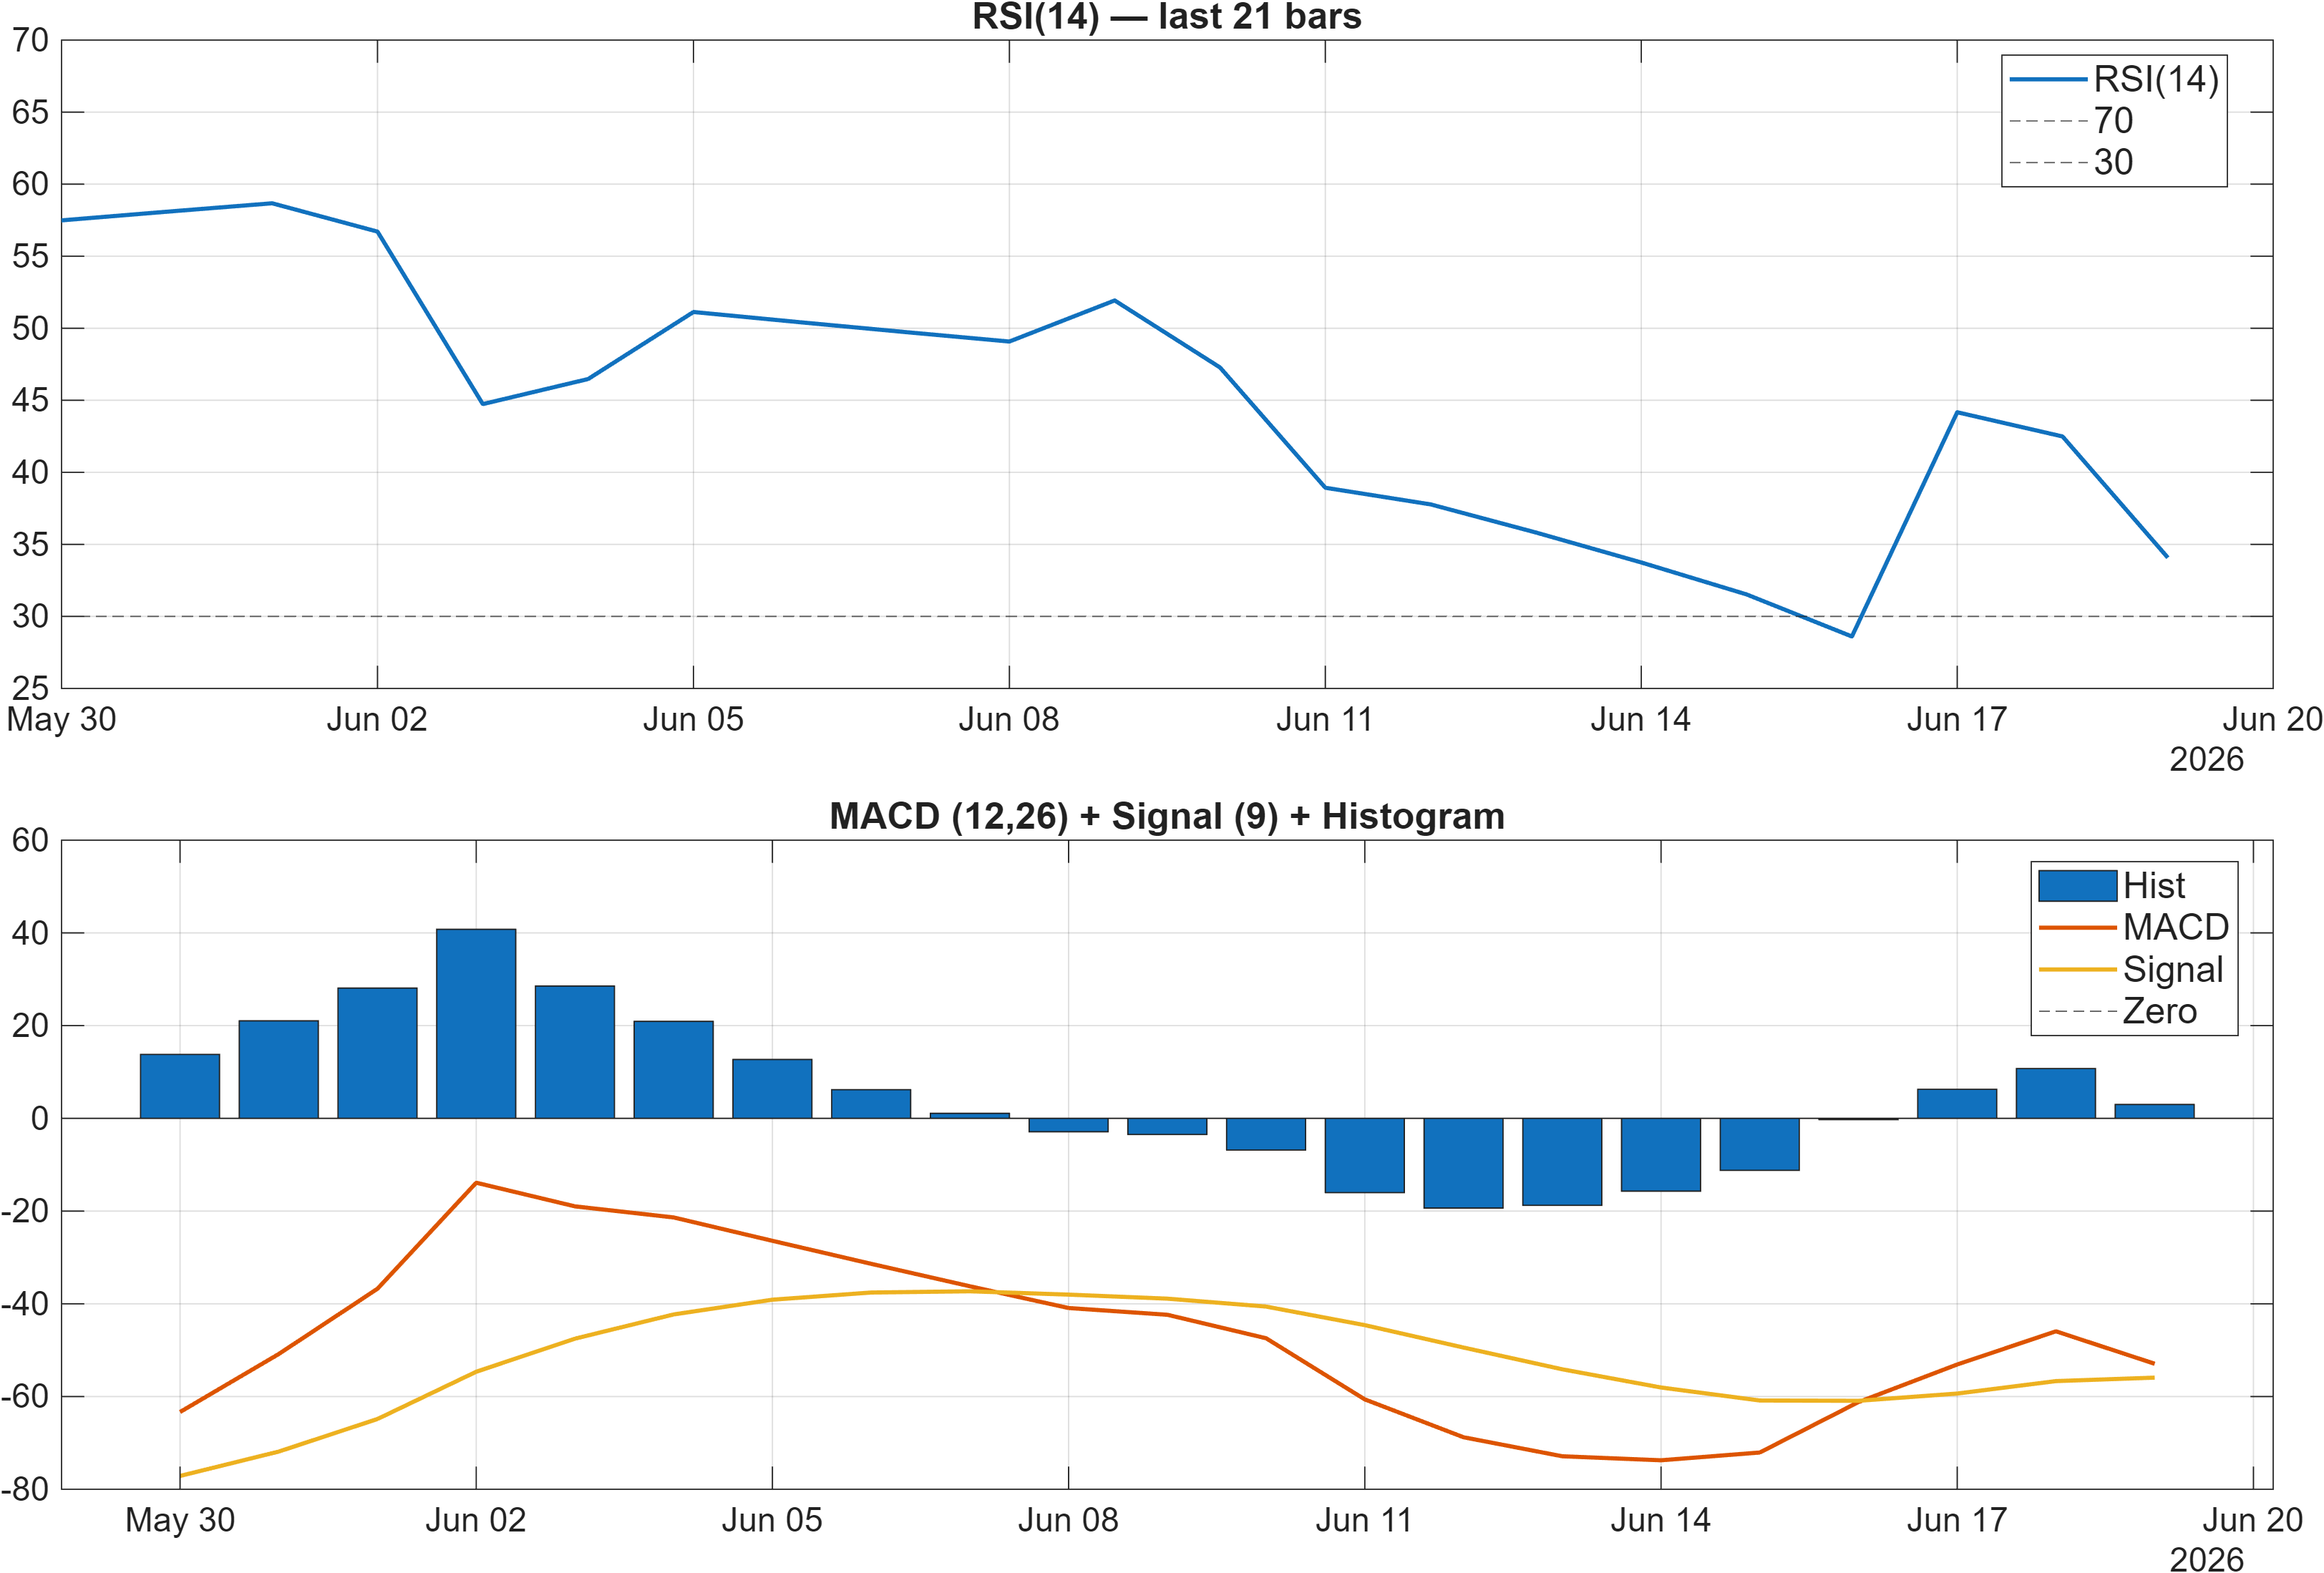
Interpretation: RSI bias = Bearish, MACD hist = 2.9931.
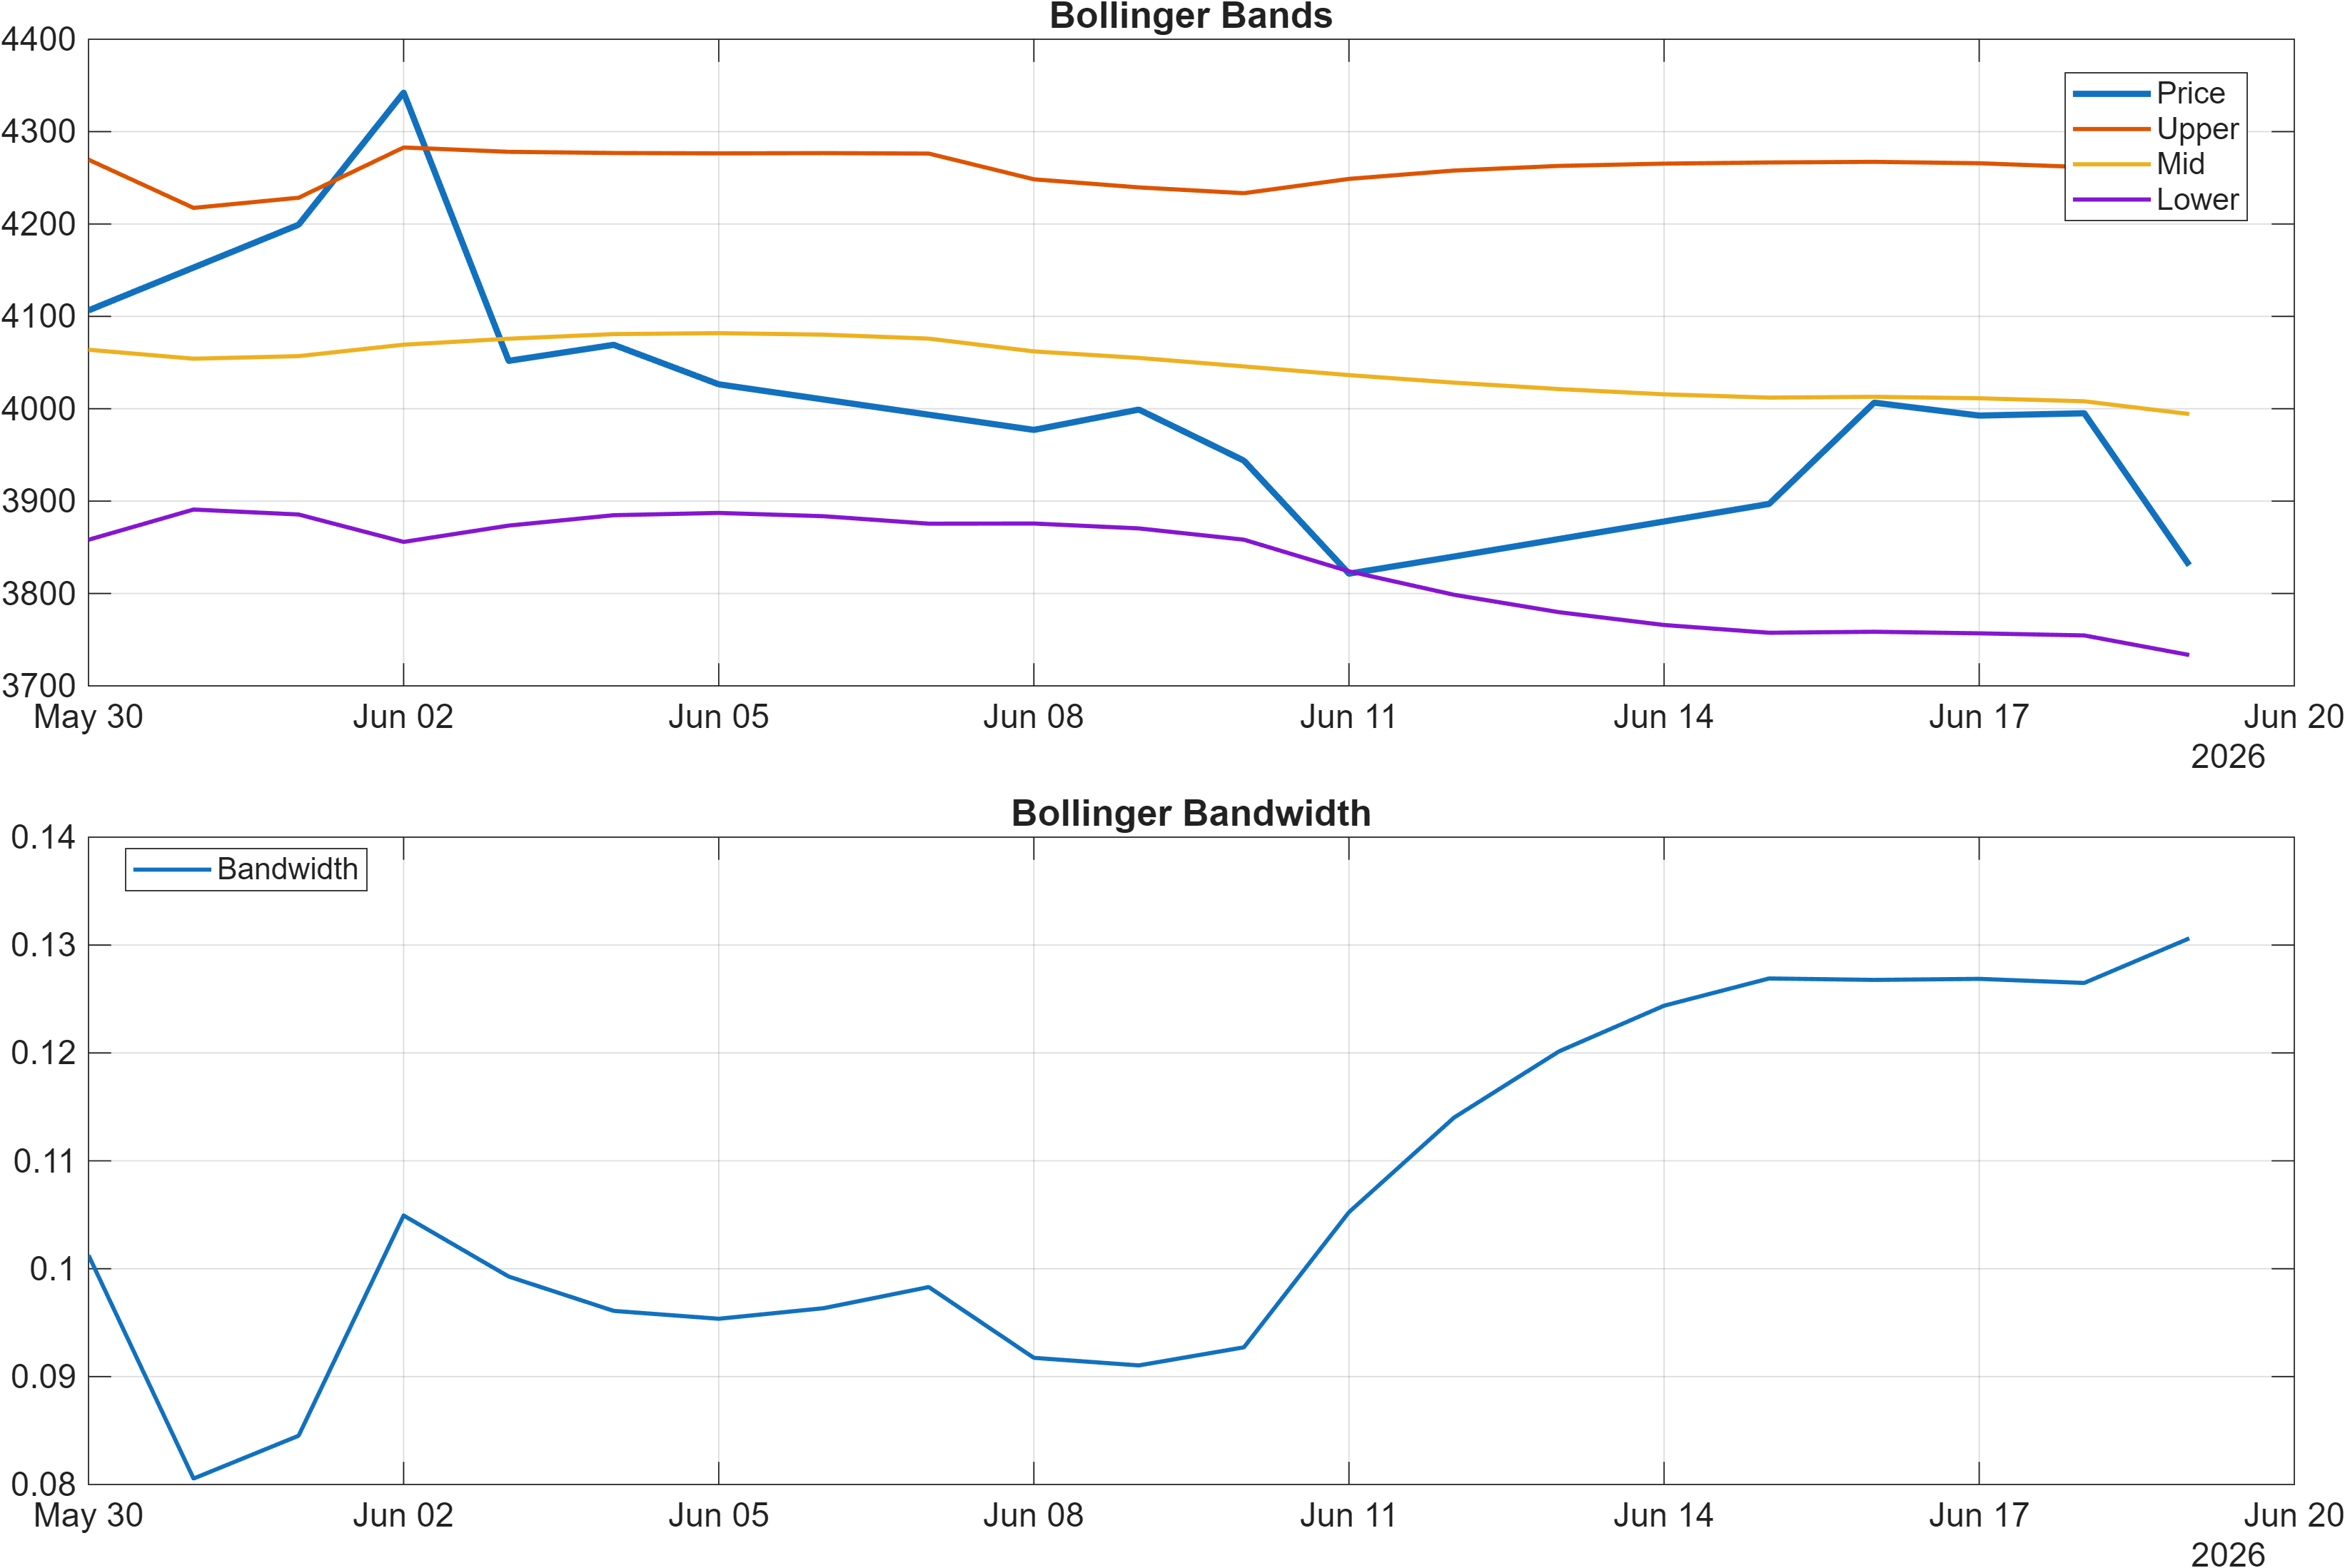
Interpretation: Bandwidth (volatility regime) latest = 0.1306.
Momentum is currently internally mixed. RSI carries a bearish bias and the RSI(14) value is 34.08, which places the indicator in a weaker momentum zone rather than a neutral balance area. At the same time, the MACD histogram is 2.9931, a reading that can align with improving momentum conditions depending on context and recent inflection behavior. This is a meaningful divergence: one momentum lens is still describing weakness, while another can be consistent with a nascent stabilization attempt.
Volatility conditions are relatively contained, with Bollinger bandwidth at 0.1306. A tighter bandwidth regime often coincides with compression where direction is not resolved by volatility alone. In such regimes, confirmation tends to come from price action around defined levels and whether momentum indicators transition in a coordinated manner (e.g., RSI recovering from depressed territory while MACD structure remains supportive).
The key question is whether the momentum split resolves via trend continuation (RSI staying weak as price remains under trend filters) or mean-reversion (RSI lifting while price reclaims important structure). Given that broader technical confluence is bearish (18-signal score -0.333; blended -0.451), the burden of proof remains on the tape: momentum improvement is more credible when it arrives alongside level breaks and evidence of participation rather than indicator readings in isolation.
4) Support / Resistance zones
Support ~ 3892.0250 | Resistance ~ 4430.5500
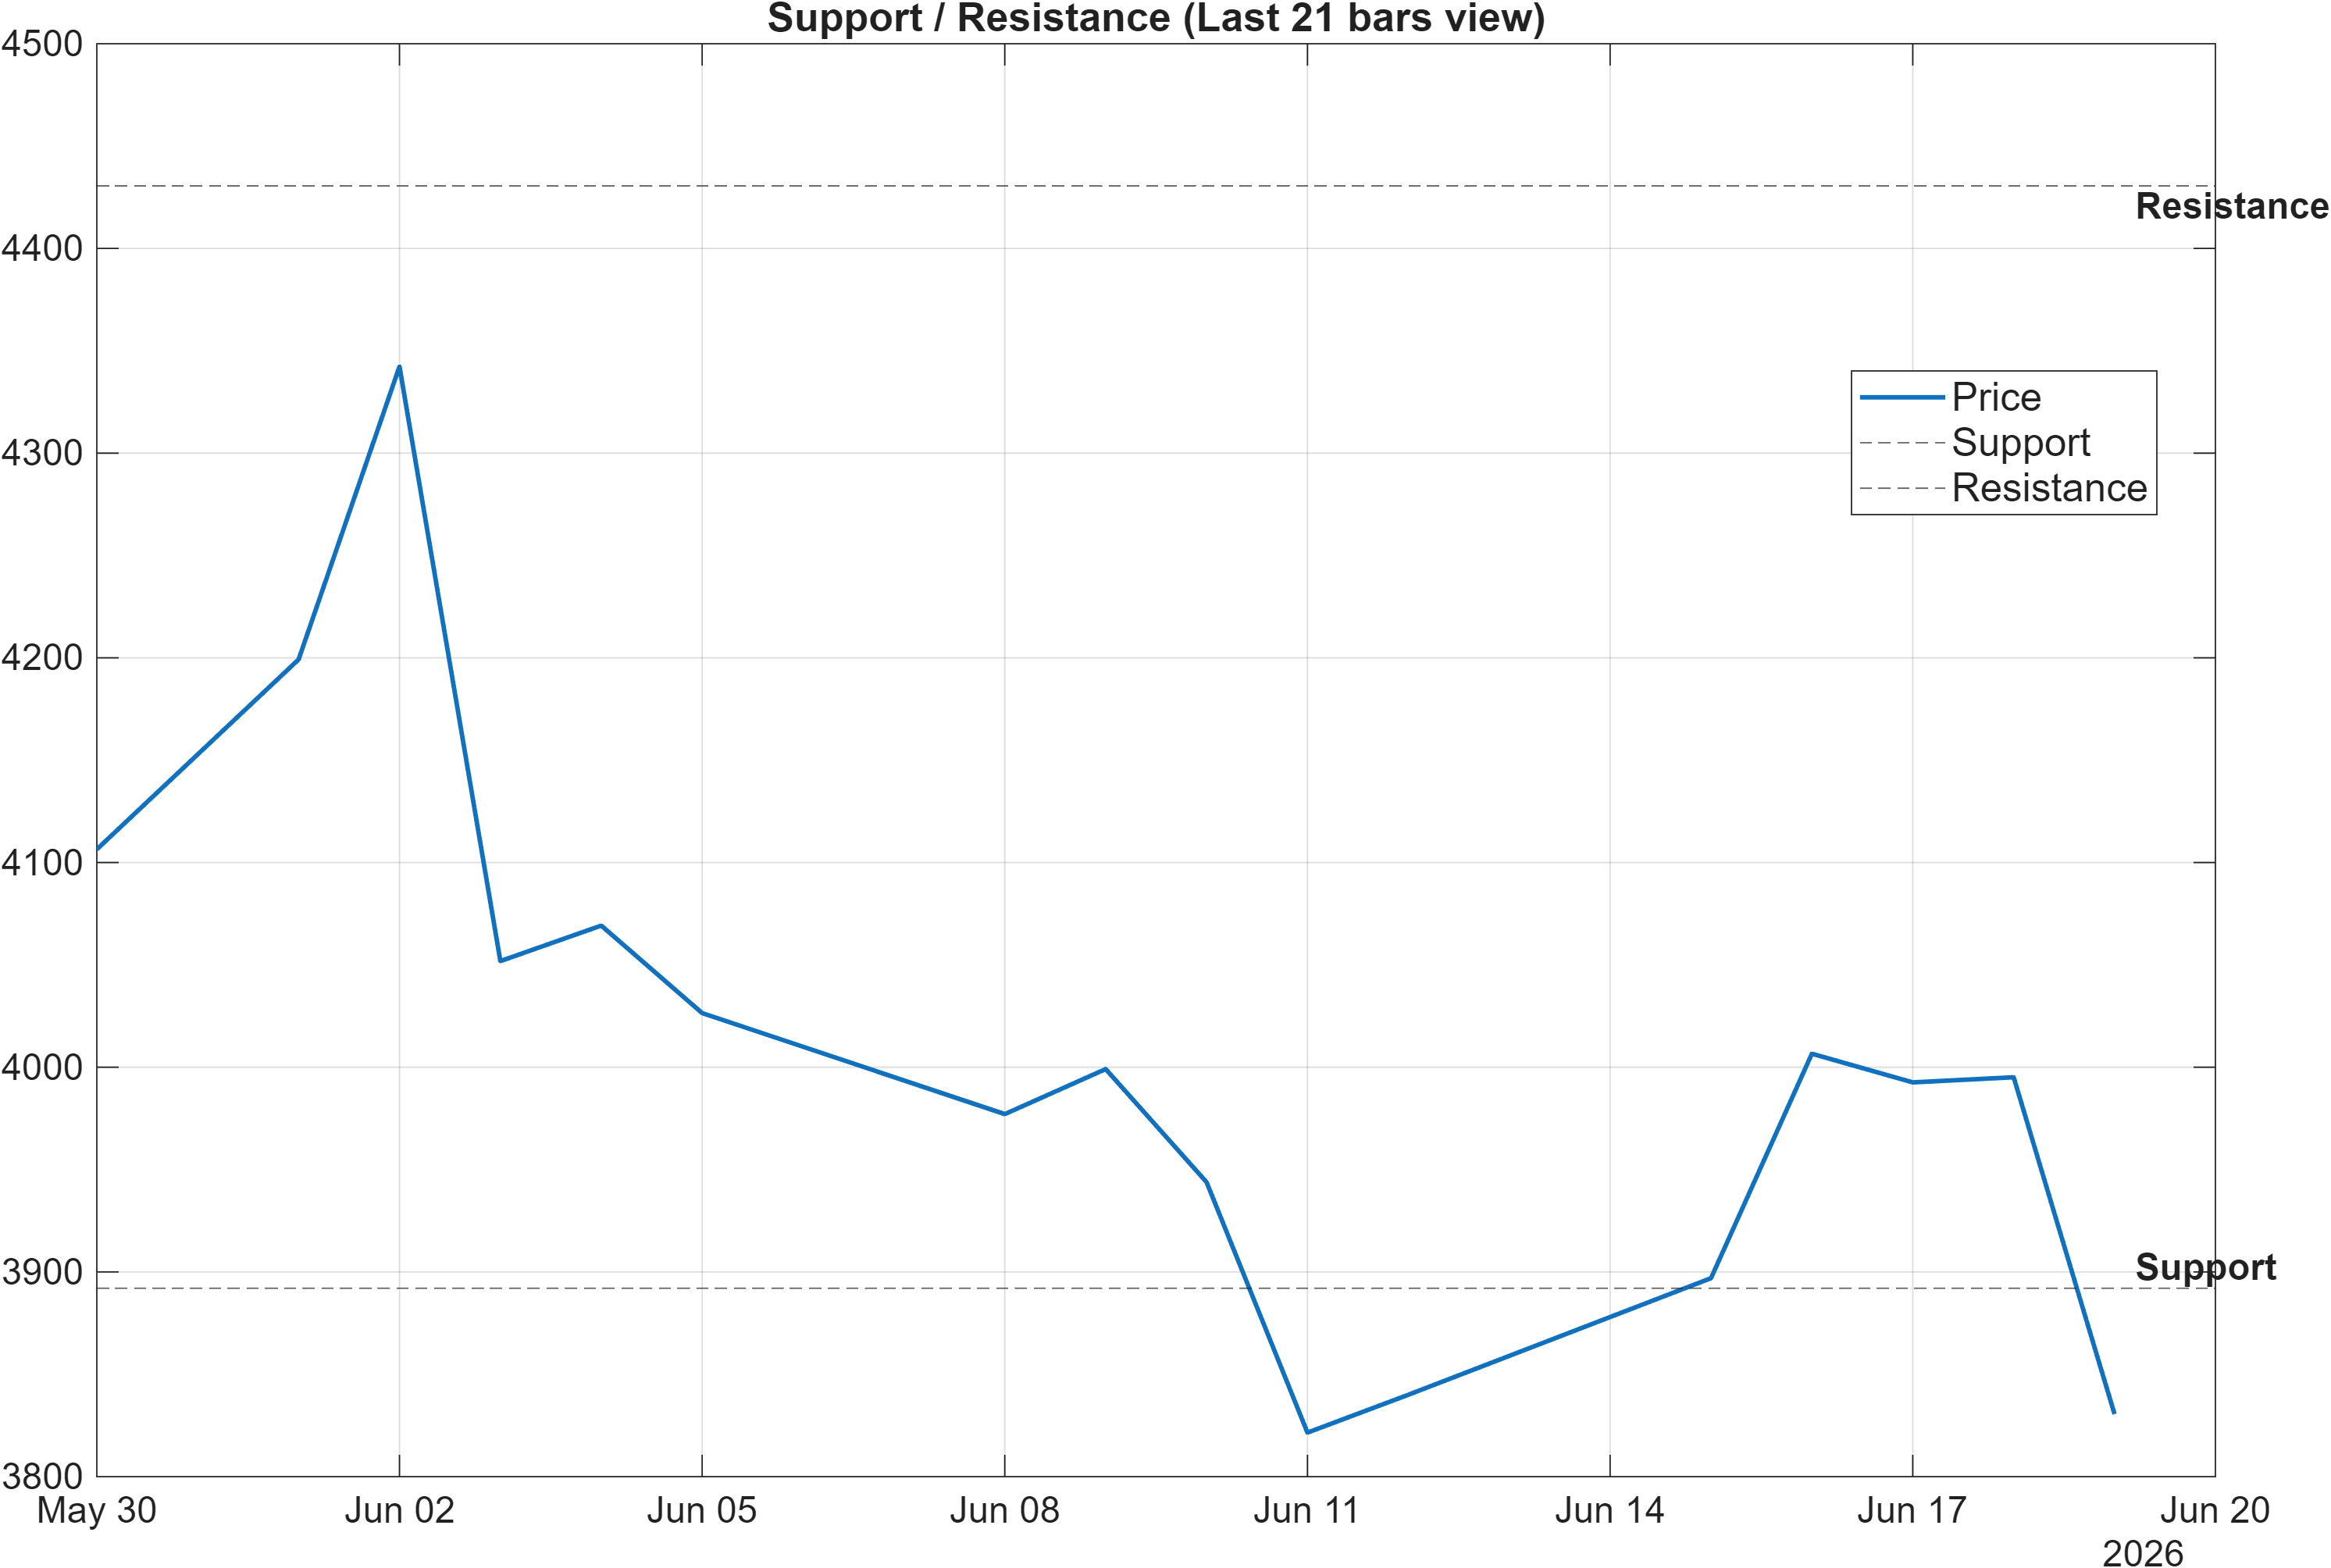
Scenario view: Break above resistance with volume → continuation. Close below support → signal deterioration risk.
The support/resistance framework is the primary decision scaffold when trend and momentum signals are not fully aligned. With support near 3892.0250, the market has a defined zone where downside follow-through would begin to validate the bearish short-term rank profile (daily #1135) and the bearish moving-average posture. A close below support is framed here as deterioration risk, because it would weaken the probability that current weakness is merely a pullback within a longer-horizon leadership profile.
On the upside, resistance near 4430.5500 becomes the principal confirmation gate. The report explicitly calls for a break above resistance with volume to support continuation. That condition matters because volatility is not elevated (bandwidth 0.1306), so level breaks without participation can be prone to reversal. A credible reclaim of resistance would also be more consistent with the longer-term ranks (notably #11 over 6 months and #4 yearly) asserting themselves in price.
Practically, this creates a two-zone regime test: holding above support keeps mean-reversion and stabilization pathways viable, while a sustained move through resistance would reduce the weight of the bearish trend filters. Until one of those conditions is met, the level structure argues for patience and disciplined confirmation, rather than interpreting small moves within the range as durable signals.
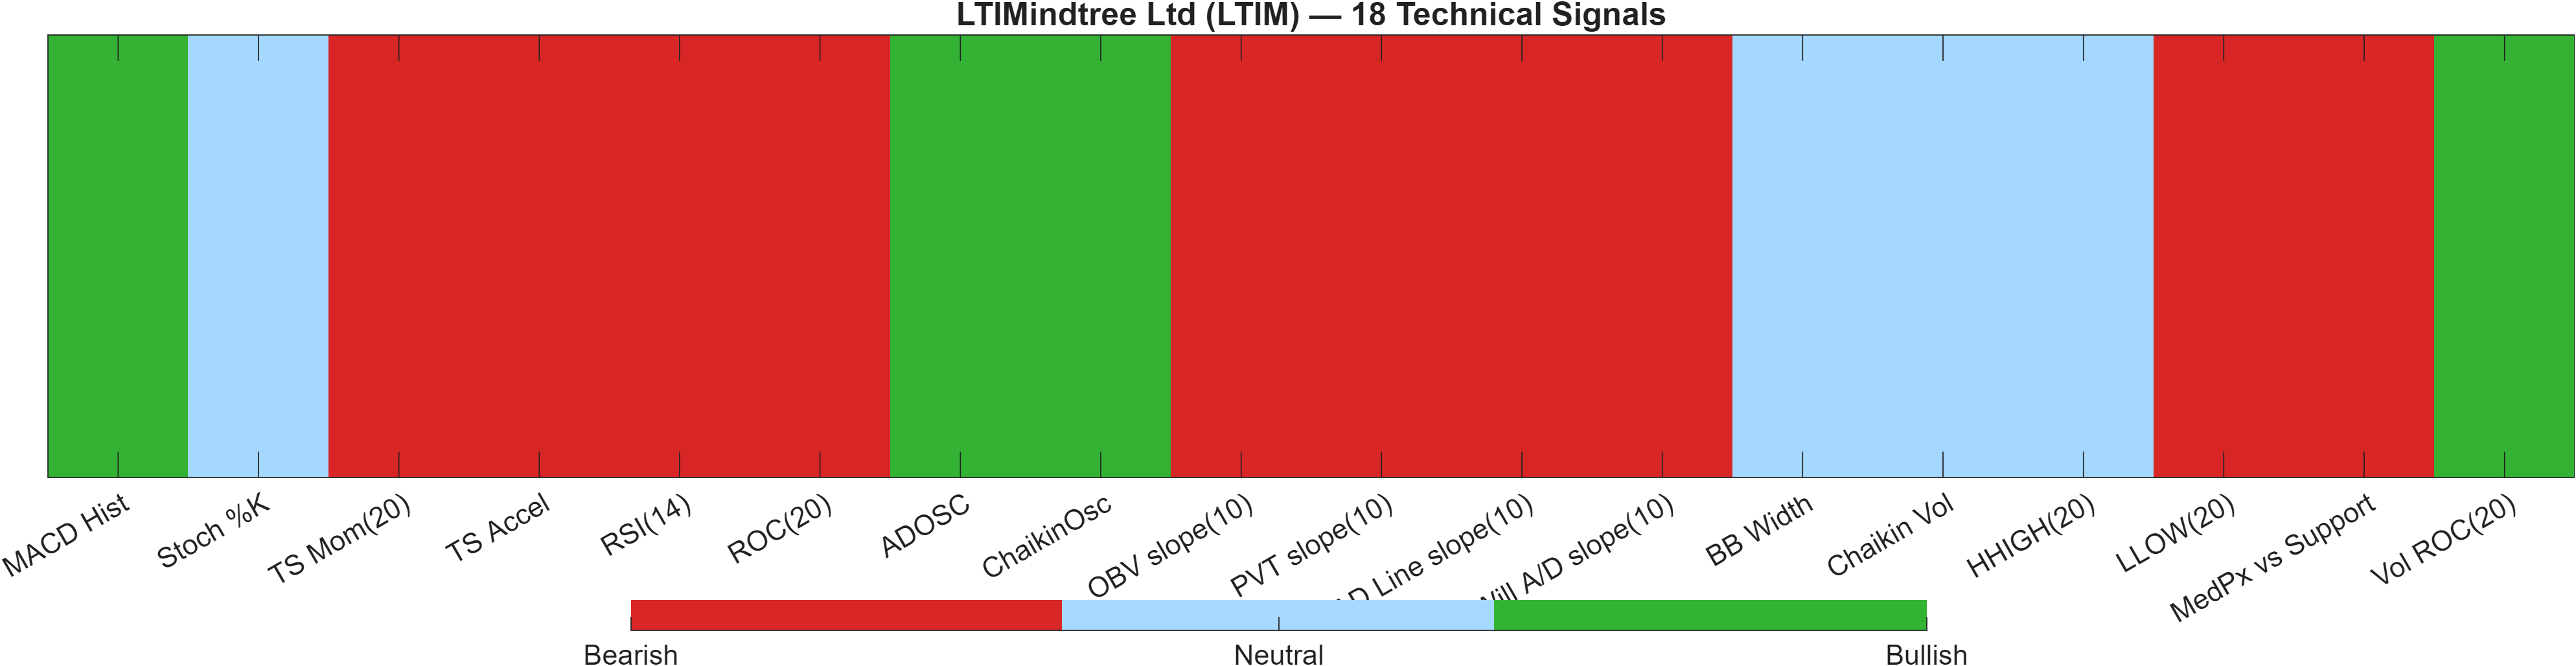
5) Quant Technical Dashboard (18 Signals)
KGNAI AI Technical Analysis Score (Deep Reinforcement Learning): Rank #1052 out of 1220 (Rank 1 represents the strongest technical positioning and a higher probability of favorable price behavior. As ranks increase toward the maximum, the probability of favorable outcomes weakens and bearish positioning becomes more dominant.) | Label: Bearish | Score: -0.725
18-Signal Technical Confluence Score: -0.333 (Bearish)
Overall Technical Score (18-signal confluence + DRL rank blend): -0.451 (Bearish)
Note: The blended score reflects signal strength weighted against broader AI technical ranking, which may temporarily diverge.
Blended technical score breakdown: -0.451 (Bearish | Bull 4 / Bear 10 / Neutral 4)
Signal table (Bull/Bear/Neutral)
| Indicator | Value | Signal |
|---|---|---|
| MACD Hist | 2.993 | Bullish |
| Stoch %K | 23.5 | Neutral |
| TS Mom(20) | -322.3 | Bearish |
| TS Accel | -332.1 | Bearish |
| RSI(14) | 34.08 | Bearish |
| ROC(20) | -7.761 | Bearish |
| ADOSC | 31.2 | Bullish |
| ChaikinOsc | 1399 | Bullish |
| OBV slope(10) | -1.149e+04 | Bearish |
| PVT slope(10) | -1379 | Bearish |
| AD Line slope(10) | -4556 | Bearish |
| Will A/D slope(10) | -168.3 | Bearish |
| BB Width | 0.1306 | Neutral |
| Chaikin Vol | -11.6 | Neutral |
| HHIGH(20) | 4360 | Neutral |
| LLOW(20) | 3757 | Bearish |
| MedPx vs Support | -76.1 | Bearish |
| Vol ROC(20) | 30.41 | Bullish |
Interpretation: Indicator-level signals form the base confluence, which is then adjusted using a separate AI-driven technical ranking model. The final technical score summarizes this combined view.
The technical dashboard is decisively net-bearish by construction: the Deep Reinforcement Learning technical rank is #1052 out of 1220 with score -0.725, while the 18-signal confluence is -0.333 and the blended score is -0.451. Importantly, the blend shows a breadth profile of Bull 4 / Bear 10 / Neutral 4, indicating that weakness is not coming from a single factor but from multiple signal families acting in the same direction.
Within that, there are pockets of constructive behavior that help frame what “reversal evidence” would look like. For example, MACD Hist is flagged bullish (value 2.993) and volume momentum (Vol ROC(20) 30.41) is also bullish—conditions that can support stabilization if price structure confirms. Against that, several momentum and rate-of-change components remain bearish (RSI(14) 34.08, ROC(20) -7.761), and multiple participation/flow slopes are negative (e.g., OBV slope(10) -1.149e+04), which is consistent with fragile demand.
The most actionable takeaway is the alignment problem: bullish sub-signals are present, but they are currently outvoted and outweighed in the composite. That raises the bar for upside follow-through—ideally requiring not just indicator improvement, but confirmation through the level framework (4430.5500 overhead) and a measurable shift in the bearish trend filters described earlier.
6) News sentiment + extractive gist
Note: Instrument-specific news matches were not found, so the digest includes broader market/sector headlines. Links are provided for verification.
Sentiment score (avg): 0.051 | Positive: 25% | Neutral: 69% | Negative: 6%
KGNAI AI News Sentiment Score (normalized -1 to +1): 1.00 (as of 2026-02-05) | Label: Bullish | Overall news score: 0.96
Positive Developments
Recent coverage across major financial outlets indicates a generally constructive risk backdrop for India’s capital-markets narrative, with attention on large potential listings and balance-sheet actions among marquee issuers. In sentiment terms, the aggregate distribution leans calm-to-positive (0.051 average; 25% positive versus 6% negative), which can reduce headline friction for IT and large-cap names when market breadth is stable. For LTIM specifically, this does not replace instrument-level fundamentals (not available in the provided data), but it can influence short-horizon positioning when technicals are near decision points. A noteworthy feature of this report is that the normalized news sentiment gauge is 1.00 with an overall news score of 0.96 (dated 2026-02-05), suggesting the news model’s regime read is supportive even while price-based signals remain bearish. That kind of split can matter: supportive narrative conditions may help any technical recovery travel farther once price confirms.
Neutral / Mixed Developments
The same coverage also highlights a mixed macro-structure message: calmer volatility alongside policy-communication uncertainty can translate into two-way price action rather than a clean trend. This fits the technical state shown here—Bollinger bandwidth at 0.1306 suggests compression, while support/resistance levels (3892.0250 / 4430.5500) become the practical map for confirmation. With 69% of items classified neutral, the broader news flow appears more informational than catalytic, which typically shifts the burden of evidence back to price, volume participation, and momentum alignment (RSI bias bearish; MACD histogram 2.9931). For readers, the key point is not to treat the sentiment read as a trade trigger, but as context that can amplify or dampen technical follow-through when a breakout or breakdown is already underway.
Negative / Risk Signals
Risk framing in the broader news set remains present even if not dominant, with cautionary narratives around valuation sensitivity and the potential for sharper corrections in crowded themes. While the negative share is only 6% in the provided distribution, risk items can still matter when the instrument’s short-term rank is weak (#1135 daily) and the blended technical score is bearish (-0.451). In that setup, downside narratives can act as accelerants if price breaks below 3892.0250, because a technical breach can make markets more responsive to risk headlines. Conversely, if price confirms above 4430.5500 with volume as the report outlines, the same risk items often fade in influence. Net: the news layer is better treated as a volatility modifier rather than a primary driver in this specific update.
- What to monitor next: Whether price reacts cleanly at 3892.0250 (support) or starts to accept below it.
- What to monitor next: Any improvement in momentum alignment—RSI recovering from 34.08 while maintaining constructive MACD behavior.
- What to monitor next: A confirmed breakout above 4430.5500 with volume, consistent with the scenario framework.
Sources referenced: Reuters, Bloomberg, Yahoo Finance, MarketWatch, Investing.com
Snapshot: AI Rank (Short–Mid–Long): Mixed (Bullish tilt) (Bearish–Bullish–Bullish) · Technical Confluence: Bearish · Key Levels: Support ~3892.02 | Resistance ~4430.55 · News Sentiment: Neutral
7) Sources
Not available in the provided data.
You may also like: How KGNAI AI ranks instruments across global markets
Disclaimer: KGNAI provides AI-generated analytics and educational market commentary only. This is not financial advice. Markets involve risk. Always do your own research.