VEDL (Vedanta Limited) — Neutral-to-Bearish Technical Alignment as of 19-Jun-2026
Vedanta Limited (VEDL) sits in a mixed cross-horizon posture where near-term relative ranking is steadier than the mid-term profile. In the KGNAI universe of 1220 India-region instruments, the Daily rank (#370) is materially stronger than the Monthly rank (#1013), suggesting short-horizon stabilization without confirming a durable regime shift. Trend structure remains challenged: the provided interpretation flags Close vs MA50 = Bearish and MA50 vs MA200 = Bearish, consistent with a market that is still working through a broader downtrend. Momentum readings also carry tension: RSI(14) at 39.85 is bearish, while MACD histogram at 1.5379 is positive—often a sign of early-cycle repair attempts rather than confirmed upside persistence. Volatility is neither compressed nor extreme, with Bollinger bandwidth at 0.1671. Meanwhile, the news layer is constructive (sentiment score avg 0.395; KGNAI normalized score 0.97), creating a meaningful sentiment-versus-price structure to watch around key levels.
- Rank stance: Short-term Neutral (Daily #370) | Mid-term Bearish (Monthly #1013) | Long-term Neutral (Yearly #681)
- Technical confluence: 18-signal score -0.278 and blended overall -0.077, both Neutral
- Key levels: Support ~ 271.3038 | Resistance ~ 358.0917
- News sentiment bias: Bullish (normalized 0.97; positive 80%)
- Confirmation / invalidation: A break above 358.0917 with volume supports continuation; a close below 271.3038 increases deterioration risk.
KGNAI evaluates assets using large cross-sectional datasets built from millions of structured data points. Inputs incorporate fundamental metrics, technical structures, and systematically processed news sentiment. Statistical models, machine learning, and AI frameworks are used to assess relative positioning, signal alignment, and probabilistic behavior across broad universes.
- Ranks are comparative across the tracked universe, not absolute price targets.
- Confluence reflects alignment among independent signal groups.
- Support/resistance levels are probabilistic decision zones, not guarantees.
- Sentiment provides contextual bias within the broader analytical framework.
1) KGNAI AI Analysis
Region: INDIA | Total universe size: 1220 ranked instruments
- Daily rank: #370 out of 1220 — Neutral
- Weekly rank: #611 out of 1220 — Neutral
- Monthly rank: #1013 out of 1220 — Bearish
- 3-Monthly rank: #904 out of 1220 — Neutral
- 6-Monthly rank: #536 out of 1220 — Neutral
- Yearly rank: #681 out of 1220 — Neutral
Across KGNAI’s 1220-instrument India universe, VEDL’s ranking profile is best described as short-horizon resilience against a weaker medium-term backdrop. The Daily rank (#370) sits in the upper portion of the distribution versus the Monthly rank (#1013), which falls into the lower tail and is explicitly labeled Bearish. This spread is meaningful because it often appears when an instrument is attempting to stabilize tactically while remaining structurally out of favor in medium-term cross-sectional comparisons.
The intermediate reads—Weekly #611, 3-Monthly #904, and 6-Monthly #536—cluster in neutral territory, which reduces the probability that the monthly weakness is purely noise. Instead, it suggests a regime where relative strength is not persistent across horizons, and any improvement needs repeated confirmation.
Alignment vs divergence across timeframes
The term view provided is Short-term: Neutral, Mid-term: Bearish, Long-term: Neutral. That combination typically implies the asset is not uniformly trending in relative terms. For readers focused on process, the practical implication is to treat near-term improvements as conditional until they translate into stronger multi-week ranks (for example, the weekly and 3-month ranks moving meaningfully closer to the daily profile). Conversely, if the daily rank deteriorates toward the weaker monthly placement, it would indicate the market is resolving the current ambiguity to the downside rather than transitioning to a sustained repair phase.
Not available in the provided data.
2) Price & trend overview
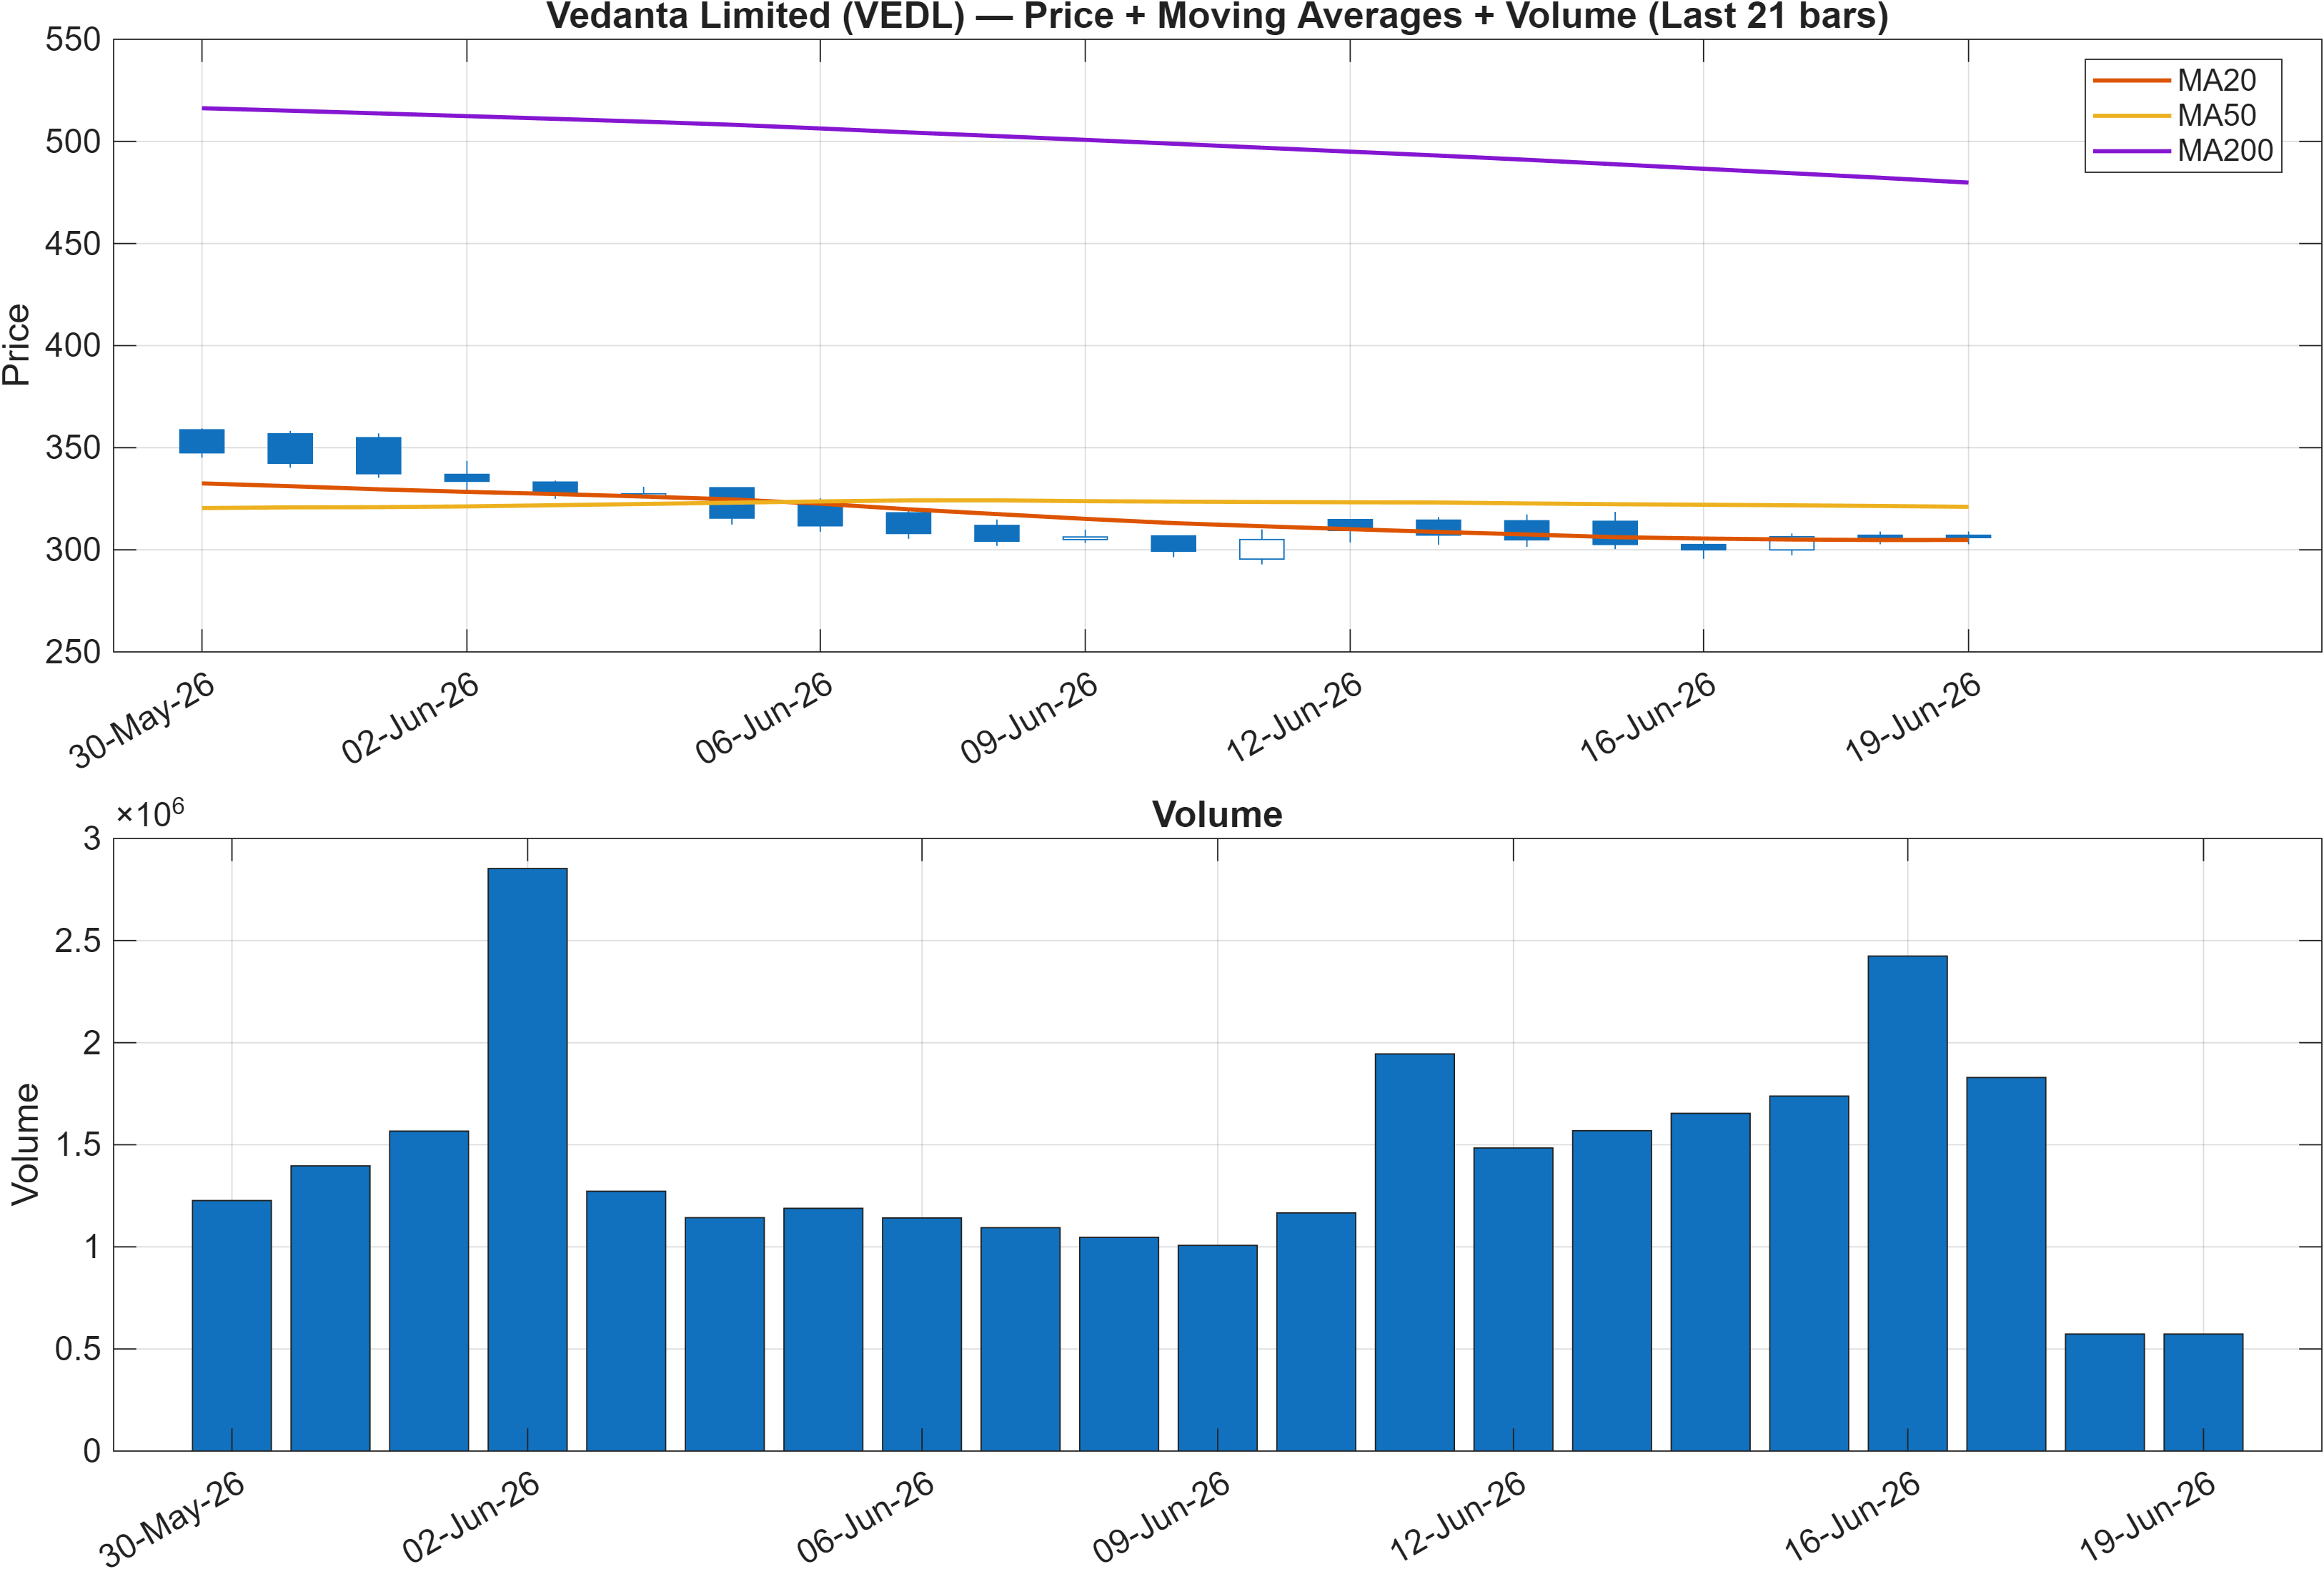
Interpretation: Close vs MA50 = Bearish, MA50 vs MA200 = Bearish.
Trend persistence vs repair attempts
The moving-average configuration points to a market that remains in a downtrend-defined structure. With Close vs MA50 = Bearish, price is not yet reclaiming the intermediate trend proxy. The additional condition MA50 vs MA200 = Bearish reinforces that the broader trend regime still leans negative rather than transitioning into a sustained bullish alignment.
This matters for signal quality: in many equities, tactical rallies can occur while these relationships remain bearish, but those moves often behave as mean-reversion within a larger trend unless accompanied by improving participation and follow-through. The later sections add context: several volume/flow measures are mixed (for instance, ADOSC is bullish while OBV slope(10) is bearish), which is consistent with a market that has not fully resolved whether accumulation is strong enough to change the regime.
Price structure framed by nearby decision zones
Even without restating the chart, the report’s key zones provide an operational frame: support ~ 271.3038 and resistance ~ 358.0917. When the trend state is bearish on MA signals, the resistance zone often acts as the area where trend repair must prove itself—ideally through acceptance above it rather than brief intraday excursions. Conversely, the support zone functions as a critical reference for whether the market is merely consolidating or restarting deterioration.
From a risk-management perspective, the MA alignment and wide rank dispersion (Daily #370 versus Monthly #1013) argue for patience: trend confirmation typically requires price action to improve while cross-sectional ranks stop signaling medium-term weakness.
3) Momentum & volatility dashboard
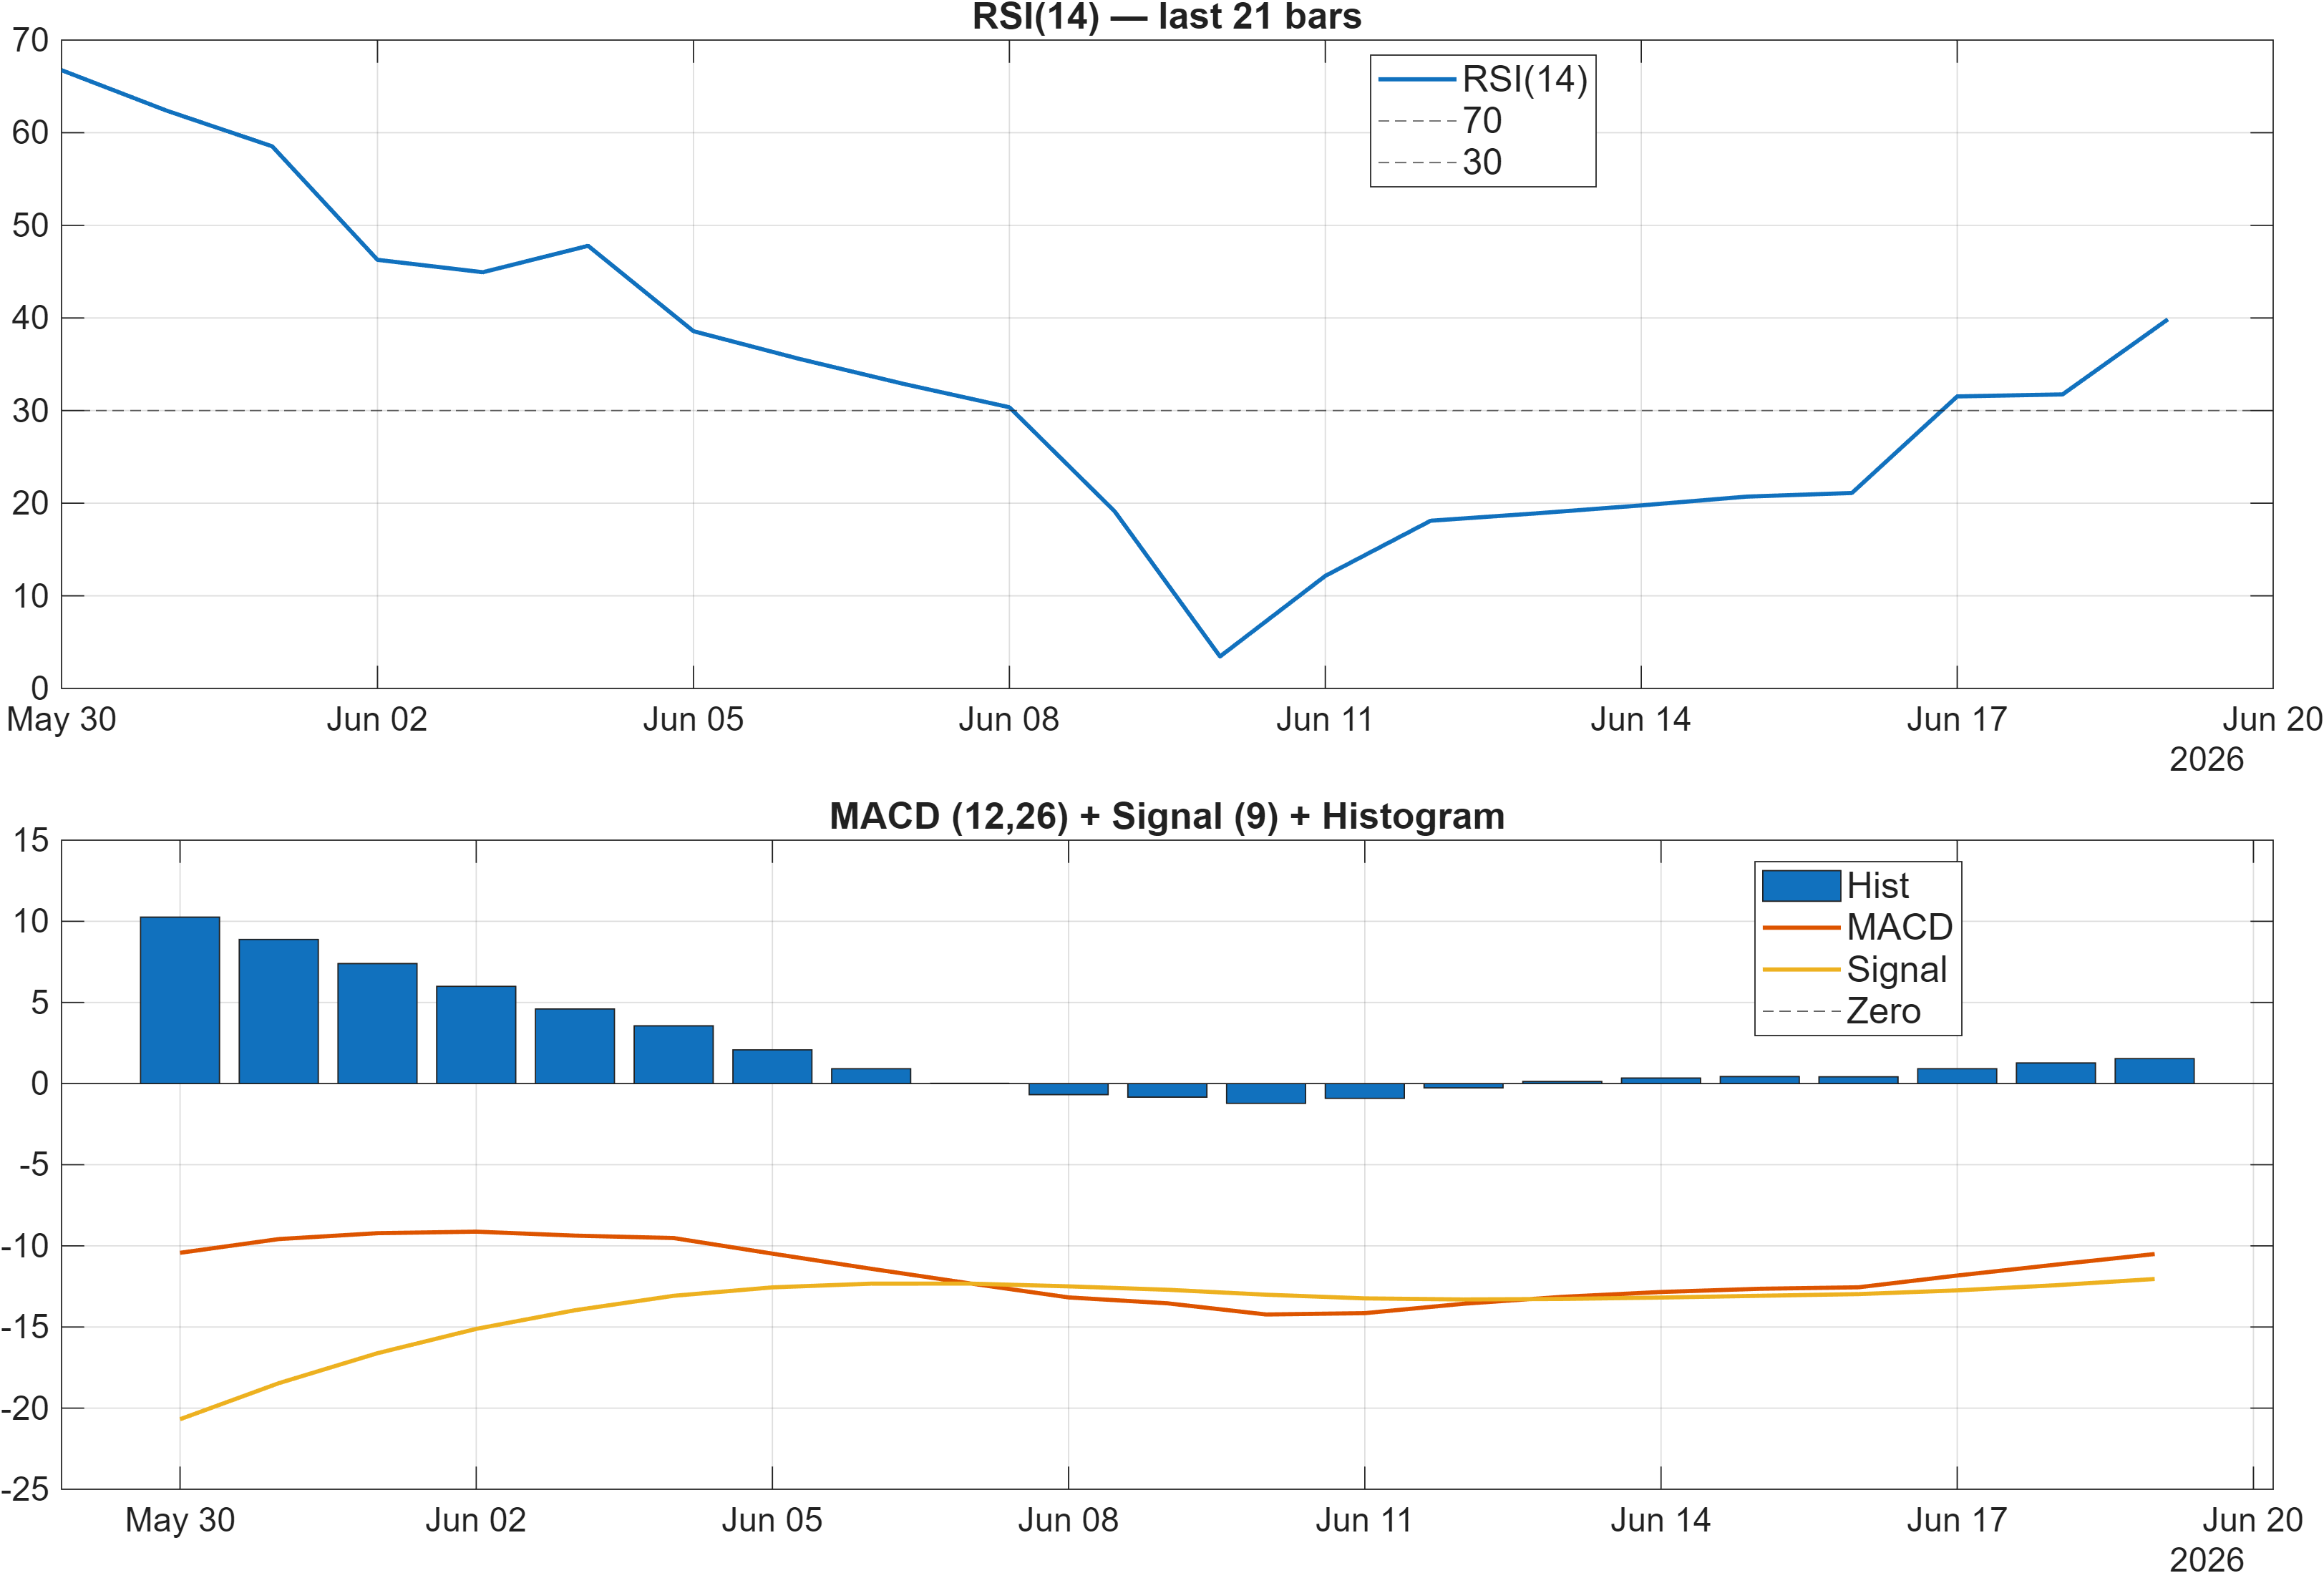
Interpretation: RSI bias = Bearish, MACD hist = 1.5379.
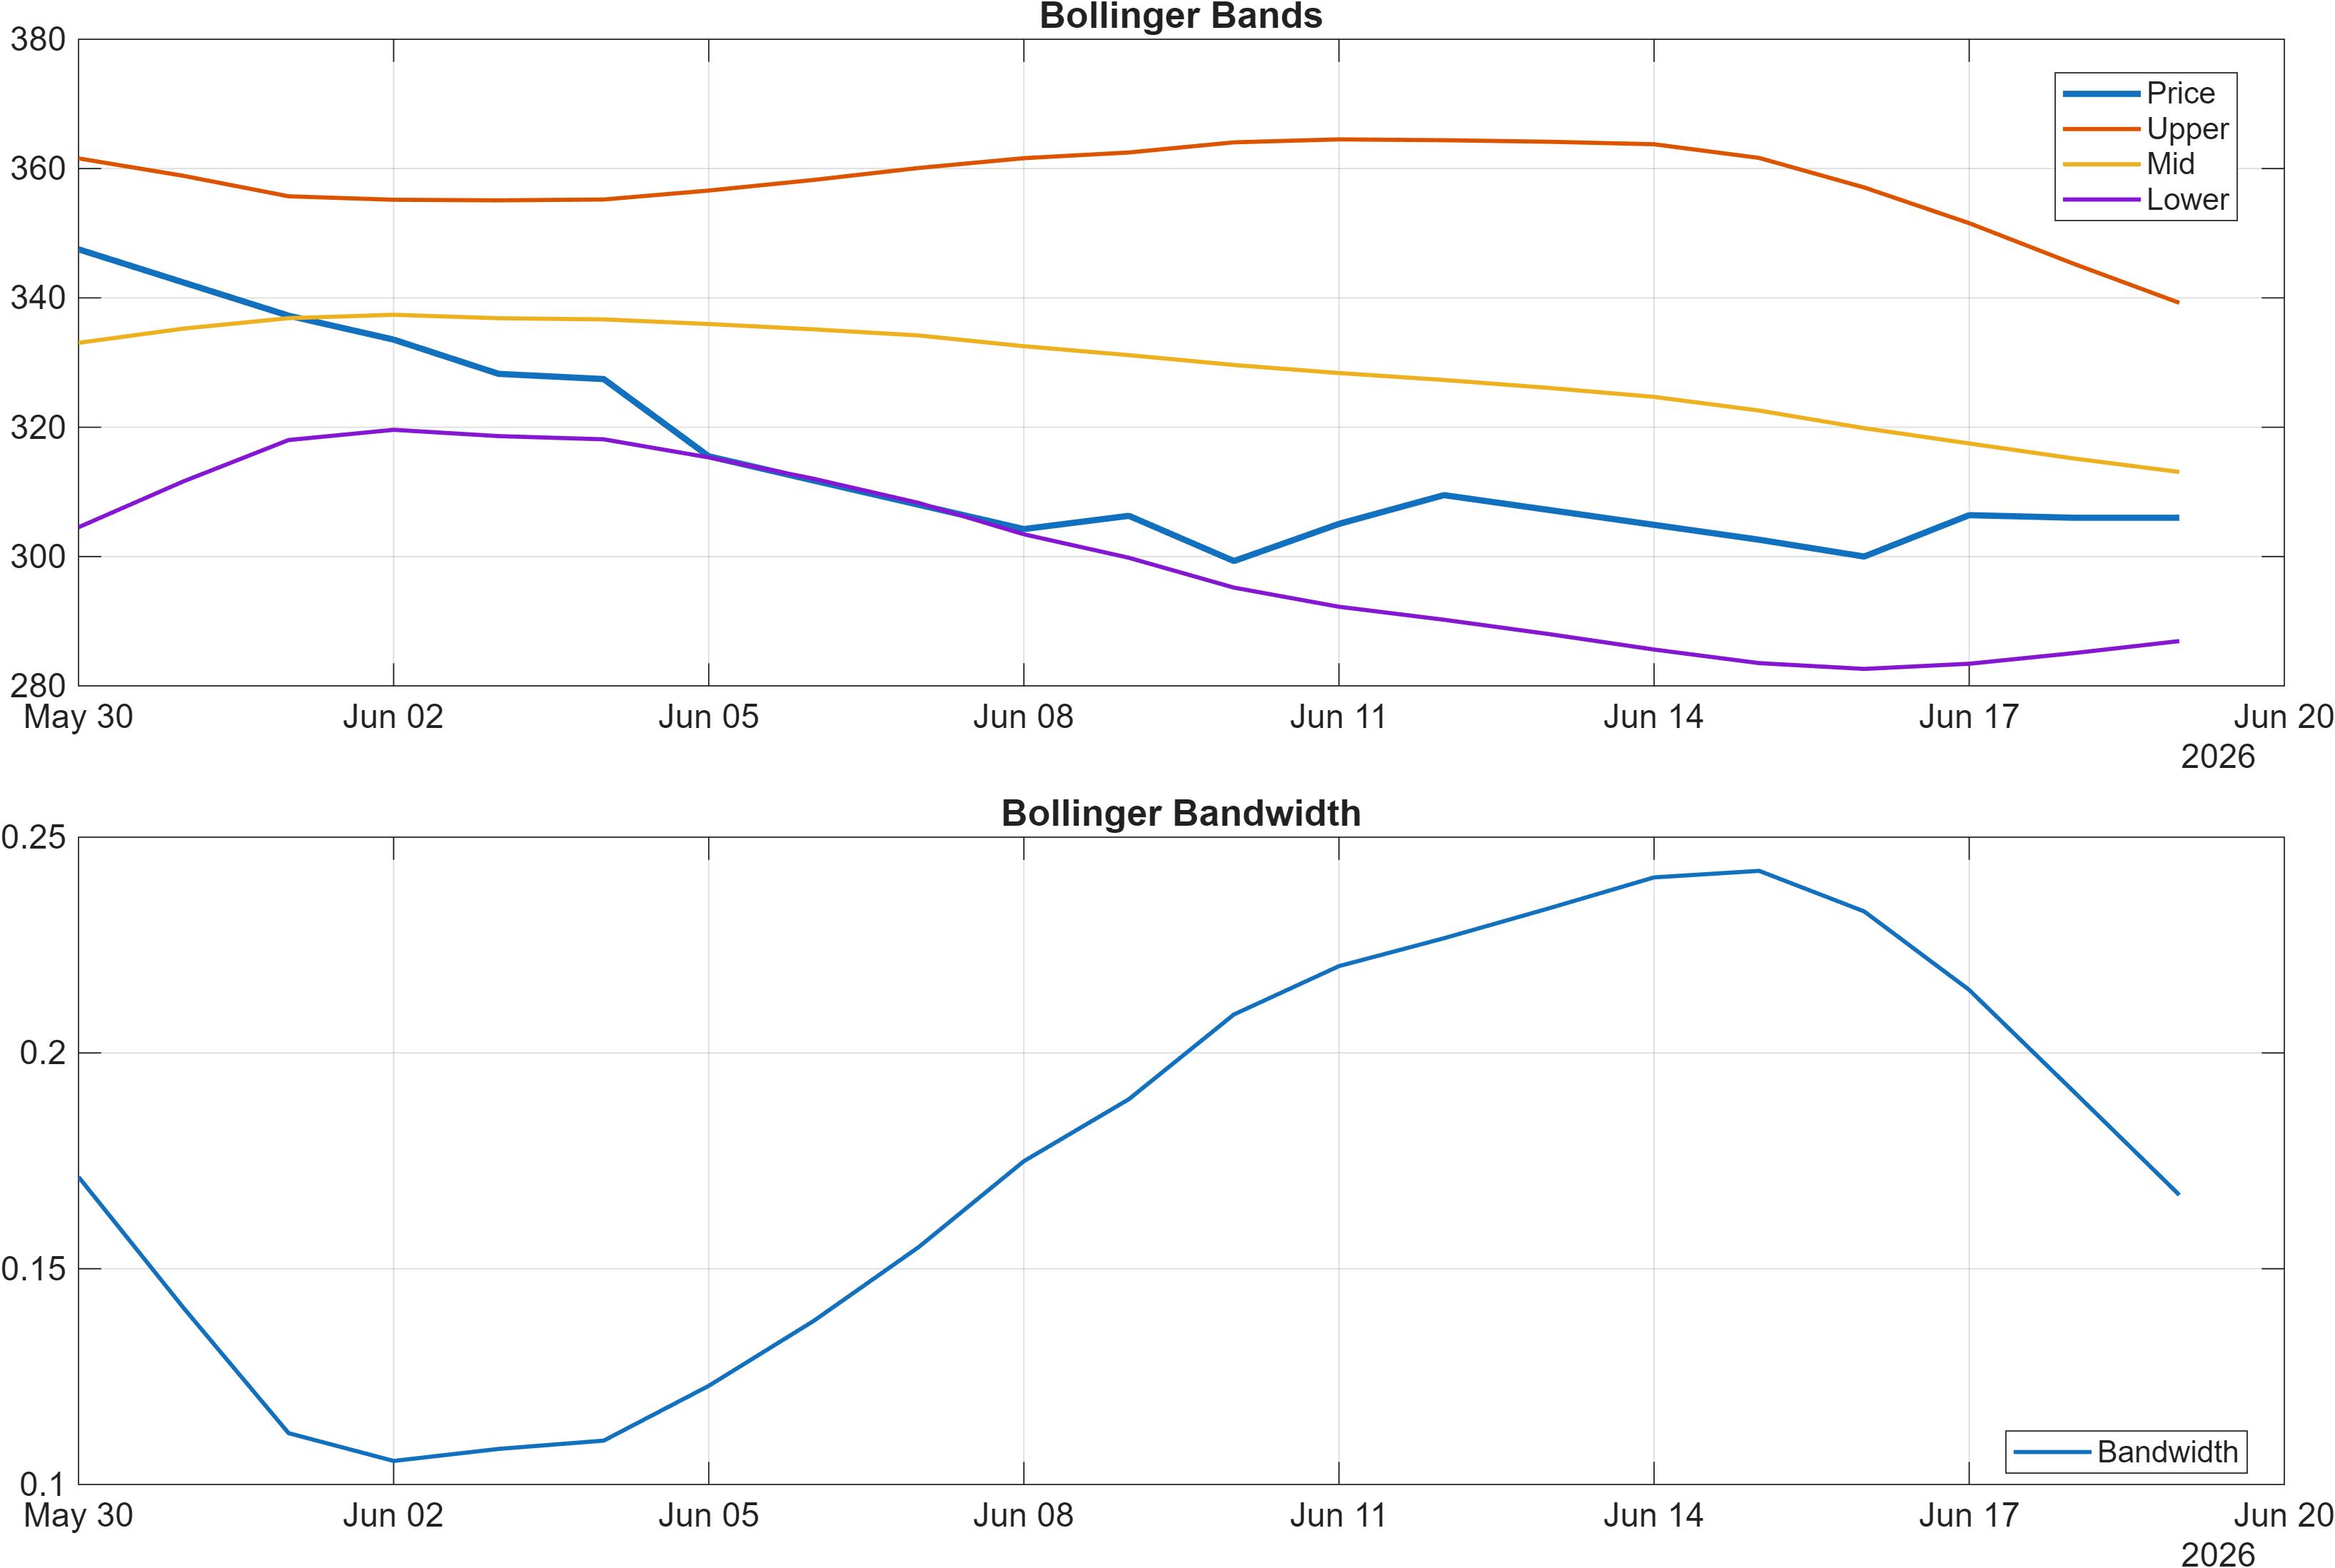
Interpretation: Bandwidth (volatility regime) latest = 0.1671.
Momentum divergence: oscillator weakness vs MACD improvement
Momentum signals are not fully synchronized. The report flags RSI bias = Bearish with RSI(14) at 39.85, which is consistent with persistent downside pressure and a market that has not reclaimed the typical neutral-to-bullish RSI zone. At the same time, MACD histogram = 1.5379 (and the signal table lists MACD Hist 1.538 as bullish), indicating positive momentum on that specific measure.
This kind of configuration frequently occurs during early stabilization phases: MACD can improve as downside momentum slows, while RSI remains depressed if rebounds are shallow or intermittent. Analytically, it lowers confidence in a single-indicator narrative and shifts attention to confirmation sequencing—whether RSI can recover while MACD remains constructive, rather than MACD turning back down as RSI stays weak.
Volatility regime: neither squeeze nor shock
Volatility context adds a second dimension. With Bollinger bandwidth at 0.1671, conditions do not suggest an extreme contraction (where breakouts can be more abrupt) nor an obvious volatility spike. That middle regime can support range trading around key levels, but it can also precede directional moves if momentum and participation begin to align.
Readers can also tie volatility to support/resistance: bandwidth that is not compressed can still accommodate tests of 271.3038 or 358.0917 without implying a decisive breakout. For that reason, the highest-quality signals tend to emerge when bandwidth behavior changes alongside price acceptance and improving ranks (e.g., daily/weekly ranks moving away from #611 toward the stronger end, not drifting toward #1013).
4) Support / Resistance zones
Support ~ 271.3038 | Resistance ~ 358.0917
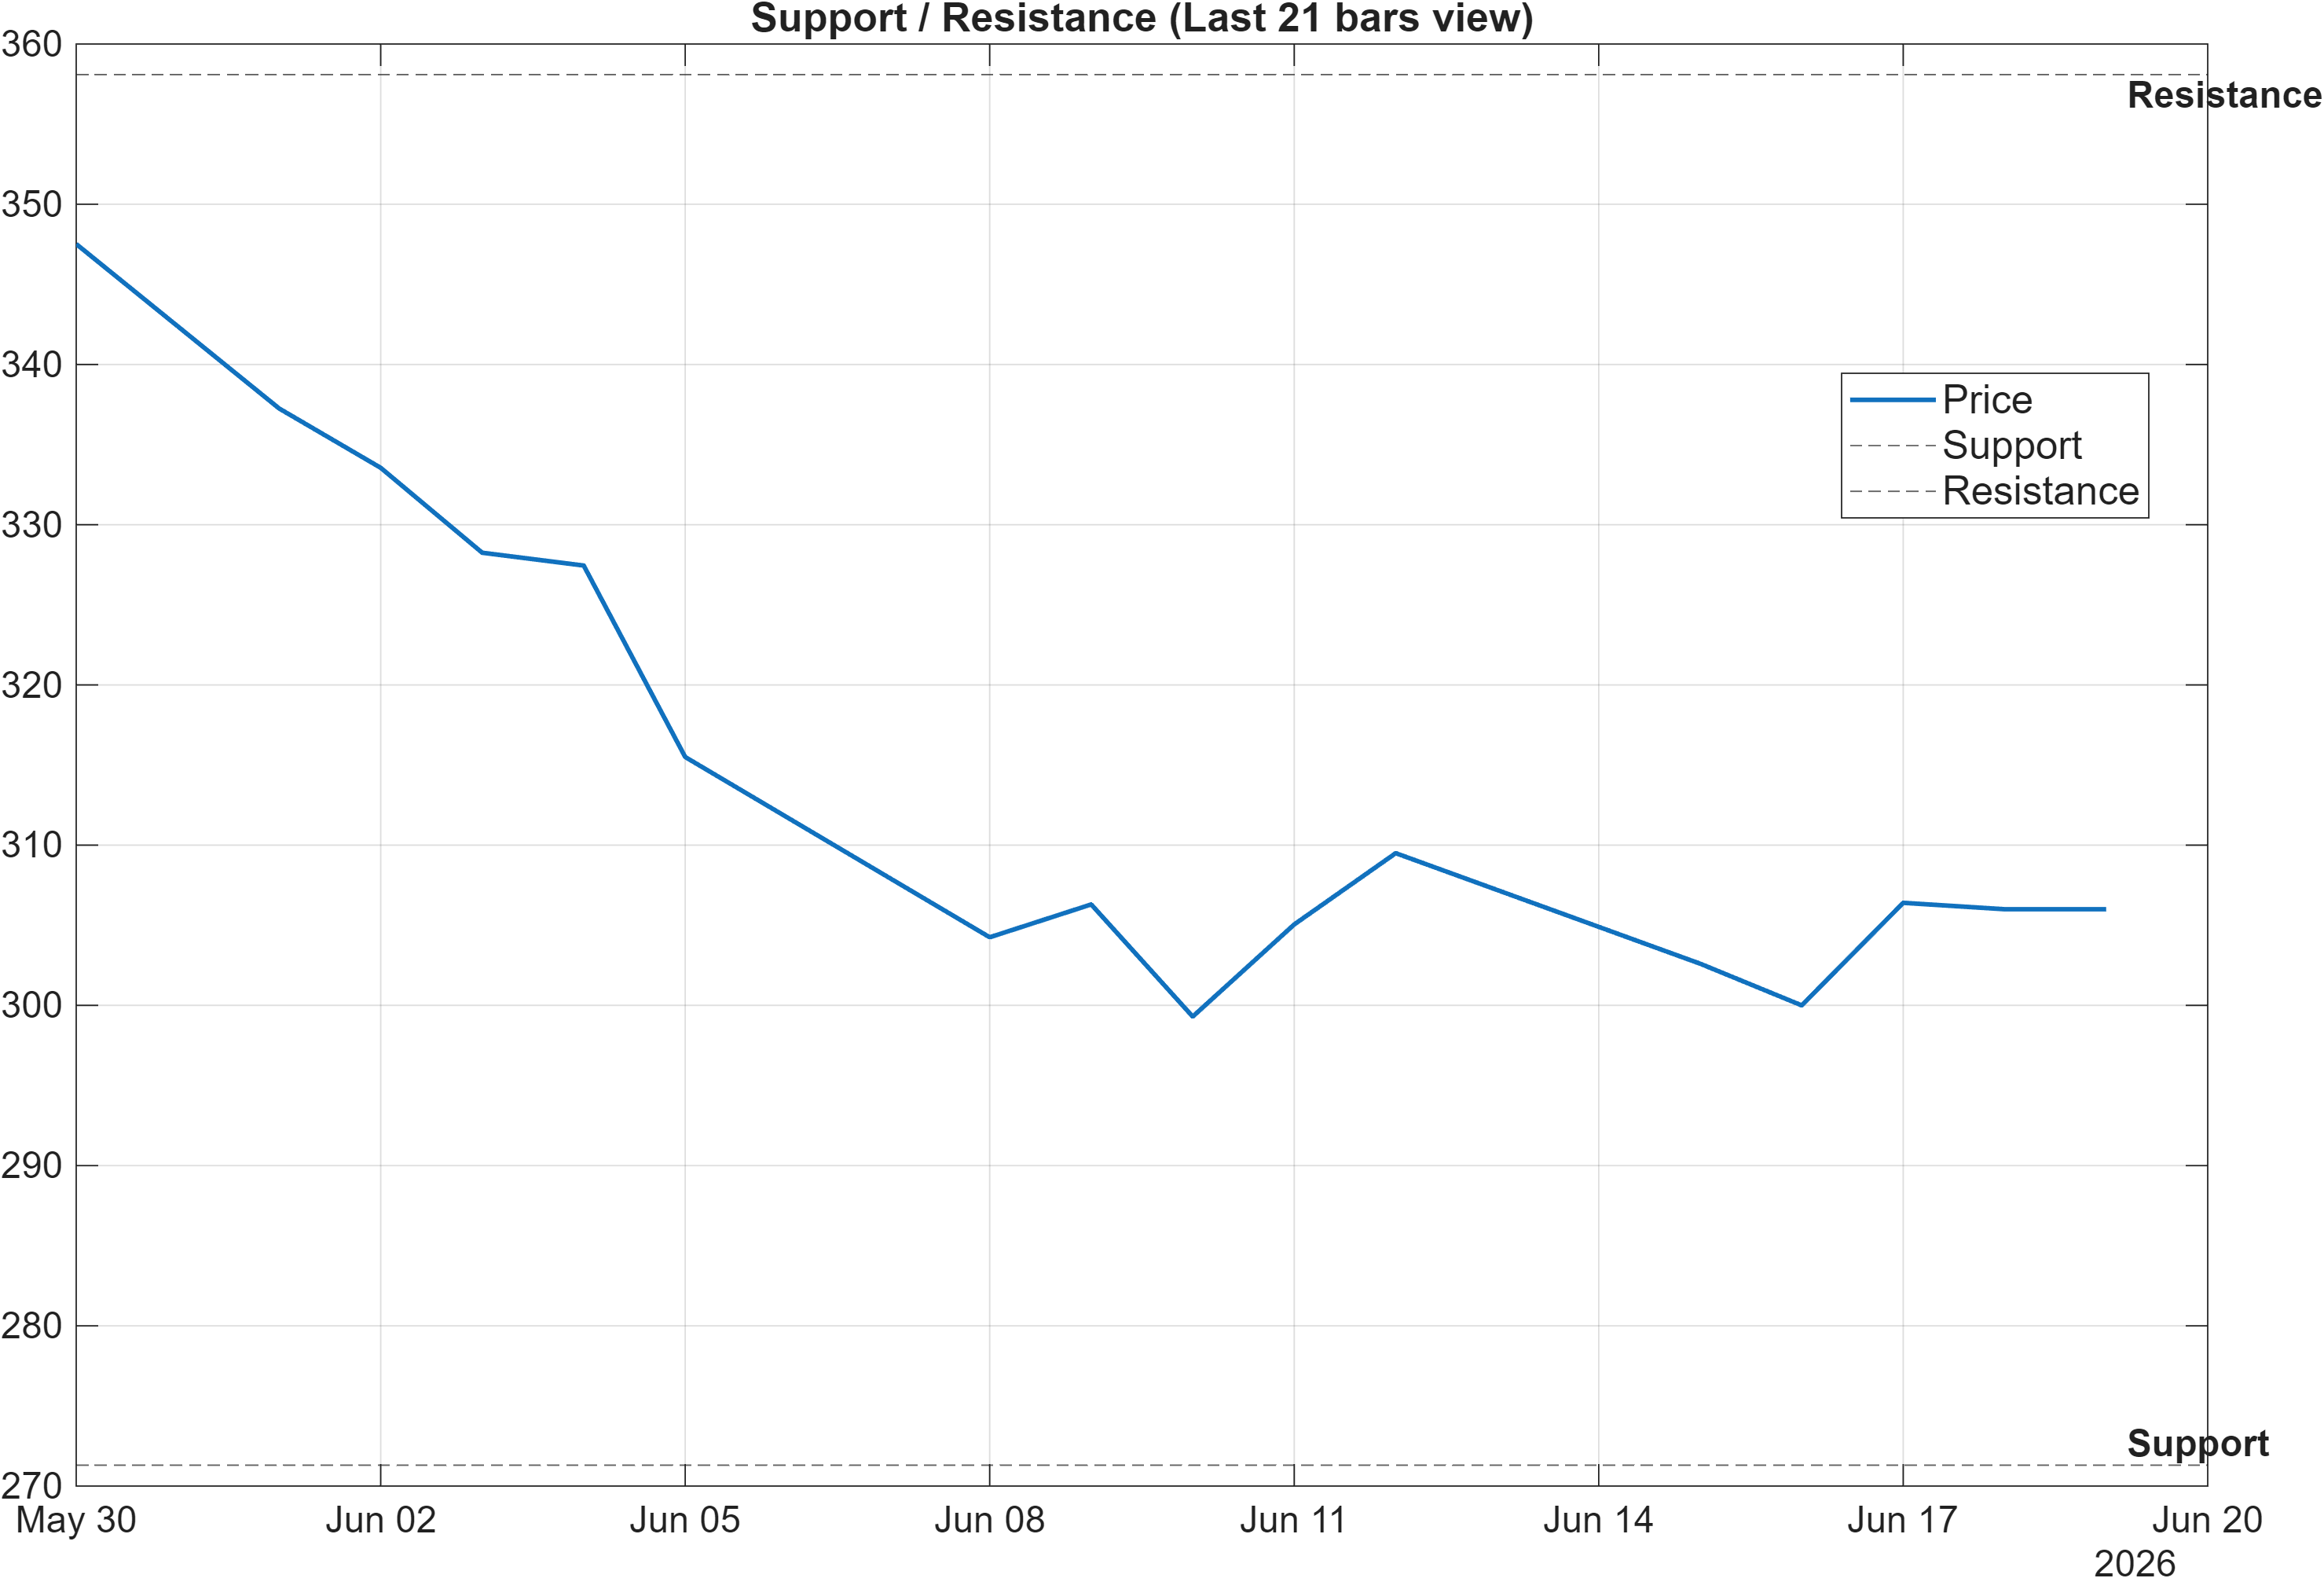
Scenario view: Break above resistance with volume → continuation. Close below support → signal deterioration risk.
Decision-zone quality under bearish trend context
The two-level map—271.3038 as support and 358.0917 as resistance—should be read in the context of the prevailing trend signals. With Close vs MA50 = Bearish and MA50 vs MA200 = Bearish, resistance typically carries more informational weight than support for regime assessment: repeated rejection near resistance often confirms the downtrend’s integrity, while clean acceptance above resistance is one of the clearer ways to invalidate the bearish moving-average narrative.
Continuation vs deterioration conditions
The scenario guidance is explicit: a break above resistance with volume supports continuation. This matters because several participation metrics are currently conflicted. For example, Vol ROC(20) = -58.98 is bearish (suggesting weakening volume dynamics), while ADOSC = 40.8 is bullish (suggesting some accumulation flow). In that environment, a volume-backed move above 358.0917 serves as a practical filter against false breaks.
On the downside, a close below 271.3038 is framed as deterioration risk, which aligns with the broader medium-term ranking weakness (Monthly #1013). A loss of support would therefore not only be a price-level event; it would also represent a resolution in favor of the weaker cross-sectional message.
Range implications and nearby reference points
Within the broader band, the dashboard also provides shorter-window references such as HHIGH(20) = 358.2 and LLOW(20) = 292.9. Without overfitting to any single statistic, these values help contextualize where resistance sits relative to recent extremes and where a “typical” pullback might land before the market tests the deeper support zone.
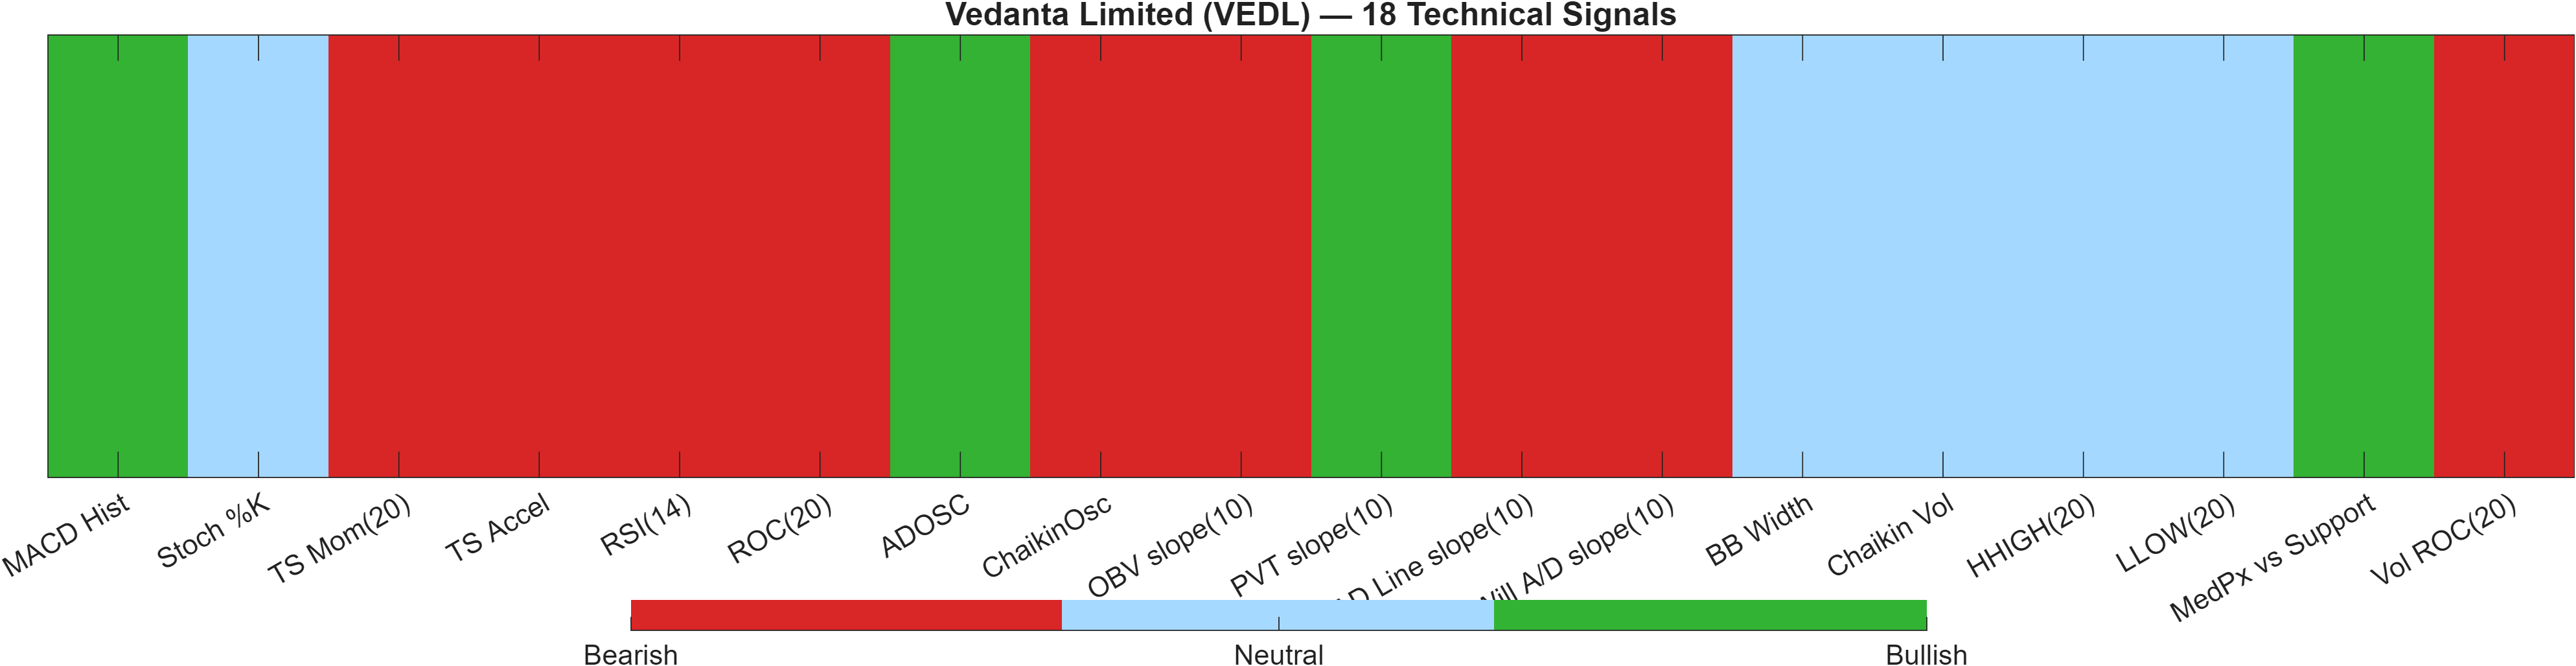
5) Quant Technical Dashboard (18 Signals)
KGNAI AI Technical Analysis Score (Deep Reinforcement Learning): Rank #372 out of 1220 (Rank 1 represents the strongest technical positioning and a higher probability of favorable price behavior. As ranks increase toward the maximum, the probability of favorable outcomes weakens and bearish positioning becomes more dominant.) | Label: Neutral | Score: 0.390
18-Signal Technical Confluence Score: -0.278 (Neutral)
Overall Technical Score (18-signal confluence + DRL rank blend): -0.077 (Neutral)
Note: The blended score reflects signal strength weighted against broader AI technical ranking, which may temporarily diverge.
Blended technical score breakdown: -0.077 (Neutral | Bull 4 / Bear 9 / Neutral 5)
Signal balance: bearish majority with selective bullish pockets
The technical layer is best characterized as neutral overall but with a distribution that leans bearish beneath the surface. The blended breakdown shows Bear 9 / Bull 4 / Neutral 5, while the headline scores remain -0.278 (18-signal confluence) and -0.077 (overall blended), both labeled Neutral. This combination often appears when bearish signals are present but not sufficiently extreme—or not sufficiently consistent with the AI rank model—to warrant a fully bearish composite label.
Where the internal conflict is coming from
Several momentum and rate-of-change components are pointed down: RSI(14) 39.85 is bearish, ROC(20) -10.63 is bearish, and TS Mom(20) -36.38 plus TS Accel -73.77 are bearish—together describing weak impulse and acceleration. At the same time, some measures hint at stabilization/accumulation: MACD Hist 1.538 is bullish, ADOSC 40.8 is bullish, and PVT slope(10) 1.265e+04 is bullish. That is a classic “repair attempt” signature where improvement is present, but not broad-based.
Participation and volatility as the tie-breakers
Volume and participation remain an important constraint. Vol ROC(20) -58.98 is bearish and OBV slope(10) -3.866e+06 is bearish, which can reduce confidence that bullish pockets will persist. Meanwhile, volatility is neutral with BB Width 0.1671, implying the market may require a clearer catalyst (price acceptance above 358.0917 or a break below 271.3038) to resolve the mixed confluence.
Signal table (Bull/Bear/Neutral)
| Indicator | Value | Signal |
|---|---|---|
| MACD Hist | 1.538 | Bullish |
| Stoch %K | 51.07 | Neutral |
| TS Mom(20) | -36.38 | Bearish |
| TS Accel | -73.77 | Bearish |
| RSI(14) | 39.85 | Bearish |
| ROC(20) | -10.63 | Bearish |
| ADOSC | 40.8 | Bullish |
| ChaikinOsc | -4.512e+05 | Bearish |
| OBV slope(10) | -3.866e+06 | Bearish |
| PVT slope(10) | 1.265e+04 | Bullish |
| AD Line slope(10) | -9.457e+05 | Bearish |
| Will A/D slope(10) | -24.8 | Bearish |
| BB Width | 0.1671 | Neutral |
| Chaikin Vol | -11.58 | Neutral |
| HHIGH(20) | 358.2 | Neutral |
| LLOW(20) | 292.9 | Neutral |
| MedPx vs Support | 34.57 | Bullish |
| Vol ROC(20) | -58.98 | Bearish |
Interpretation: Indicator-level signals form the base confluence, which is then adjusted using a separate AI-driven technical ranking model. The final technical score summarizes this combined view.
6) News sentiment + extractive gist
Sentiment score (avg): 0.395 | Positive: 80% | Neutral: 20% | Negative: 0%
KGNAI AI News Sentiment Score (normalized -1 to +1): 0.97 (as of 2025-10-14) | Label: Bullish | Overall news score: 0.86
Positive Developments
Recent coverage across major financial outlets indicates a clearly constructive tone around Vedanta-linked corporate actions and investor positioning. The aggregate metrics reflect that bias: 80% of captured items are positive, with a 0% negative share, and an average sentiment score of 0.395. The normalized KGNAI news score is notably elevated at 0.97 (labelled bullish), alongside an overall news score of 0.86. Qualitatively, the dominant narratives appear oriented toward market interest in newly listed or de-merged entities and the possibility of value-unlocking interpretations. From a market-structure lens, such coverage can support incremental demand and reduce headline fragility, particularly when the technical backdrop is attempting to stabilize. However, because the price trend signals remain bearish on moving averages, the most useful role of positive sentiment here is as a potential tailwind for confirmation—not as a substitute for price acceptance above key resistance.
Neutral / Mixed Developments
Alongside constructive commentary, part of the information flow is routine and operational—results summaries, watchlists, and general market mention—consistent with the 20% neutral share in the dataset. This type of coverage tends to have limited directional impact by itself, but it can matter when it coincides with a technical inflection, because attention can increase liquidity and tighten spreads around key zones. In this report, the neutral news mix sits against a technical profile that is Neutral overall (blended score -0.077) but internally skewed bearish (Bear 9 signals). That contrast suggests the news stream is more likely to act as a context amplifier—helping validate a breakout or breakdown—than as a primary driver.
Negative / Risk Signals
Even with 0% negative sentiment in the captured set, risk should be framed through asymmetry between narrative optimism and technical structure. VEDL’s moving-average interpretation remains bearish (close below MA50 and MA50 below MA200), and several participation metrics are weak (for example, Vol ROC(20) -58.98 and OBV slope(10) -3.866e+06 are bearish). In that setup, a positive news bias can coexist with price underperformance if the market treats favorable developments as already reflected or if liquidity fails to confirm. The clearest technical risk line remains the stated support at 271.3038: a close below that level would align the price structure more closely with the weaker cross-sectional view (notably the Monthly rank #1013). Conversely, persistent inability to clear 358.0917 despite constructive sentiment can signal that the narrative is not translating into durable positioning.
- What to monitor next: Whether price can sustain acceptance above 358.0917 with participation improving versus the bearish Vol ROC(20) reading.
- What to monitor next: Any shift in momentum alignment—particularly RSI remaining below 40 while MACD histogram stays positive (1.5379).
- What to monitor next: Reactions near 271.3038 support, given the medium-term rank weakness (#1013 monthly).
Sources referenced: Reuters, Bloomberg, Yahoo Finance, MarketWatch, Investing.com
7) Sources
The BASE_HTML included a longer list of links. Per publication format, headline lists are not reproduced here.
You may also like: How KGNAI AI ranks instruments across global markets
Disclaimer: KGNAI provides AI-generated analytics and educational market commentary only. This is not financial advice. Markets involve risk. Always do your own research.