Berkshire Hathaway Inc (BRK-B) Technical & Sentiment Report (19-Jun-2026) — Sideways Momentum Persists
Berkshire Hathaway Inc (BRK-B) is displaying a mixed cross-horizon profile as of 19-Jun-2026: short-term positioning screens weak while longer-horizon ranking improves, consistent with a market that is holding trend structure but not accelerating. In the KGNAI universe of 2042 instruments, the daily rank (#1790) sits in the weaker tail, while the 6-month rank (#400) is in a stronger cohort—an alignment often seen when price consolidates after a prior advance. Technically, moving-average structure is constructive (close vs MA50 = Bullish; MA50 vs MA200 = Bullish), while momentum gauges lean neutral (RSI bias Neutral) despite a positive MACD histogram (0.2452). Volatility remains compressed with Bollinger Bandwidth 0.0644, keeping the near-term focus on confirmation around well-defined decision zones: support ~467.1117 and resistance ~492.9417. News sentiment is largely non-committal (89% Neutral) even as the normalized score reads Bullish, suggesting a supportive backdrop without a clear catalyst impulse in the provided digest.
- Rank stance: Short-term Bearish; Mid-term Neutral; Long-term Neutral (notably stronger at 6-month rank #400).
- Technical confluence: 18-signal confluence 0.500 (Bullish) and blended overall technical score 0.341 (Bullish), with a Neutral DRL technical rank #1050.
- Key levels: Support 467.1117 and resistance 492.9417 define the active range.
- News sentiment bias: Mostly Neutral distribution (Neutral 89%, Negative 11%, Positive 0%) with a normalized sentiment score 0.85 (Bullish).
- Confirmation / invalidation: Strength is better confirmed on a break above 492.9417 with volume; deterioration risk increases on a close below 467.1117.
What KGNAI Measures
KGNAI evaluates assets using large cross-sectional datasets built from millions of structured data points. Inputs incorporate fundamental metrics, technical structures, and systematically processed news sentiment. Statistical models, machine learning, and AI frameworks are used to assess relative positioning, signal alignment, and probabilistic behavior across broad universes.
How to Read This Report
- Ranks are comparative across the tracked universe, not absolute price targets.
- Confluence reflects alignment among independent signal groups.
- Support/resistance levels are probabilistic decision zones, not guarantees.
- Sentiment provides contextual bias within the broader analytical framework.
1) KGNAI AI Analysis
Region: USA
Total universe size: 2042 ranked instruments
- Daily rank: #1790 out of 2042 — Bearish
- Weekly rank: #845 out of 2042 — Neutral
- Monthly rank: #1195 out of 2042 — Neutral
- 3-Monthly rank: #983 out of 2042 — Neutral
- 6-Monthly rank: #400 out of 2042 — Bullish
- Yearly rank: #545 out of 2042 — Neutral
BRK-B’s rank curve is characterized by timeframe divergence. The daily placement (#1790) sits in the weaker end of the universe, while the 6-month rank (#400) is materially stronger, and the weekly/monthly windows (#845 and #1195) cluster around neutral. This profile commonly maps to a market that is not currently being rewarded on short-term relative behavior, even if broader trend structure has not broken.
The key analytical point is regime mismatch: short-term tests can be dominated by recent drift, relative underperformance, or muted follow-through—whereas the 6-month window captures the residual strength of earlier trend phases. With the yearly rank at #545, BRK-B remains closer to the middle of the distribution over longer horizons, supporting the “sideways momentum” stance rather than a directional re-rate.
Within KGNAI’s framework, ranks are interpreted probabilistically: lower rank values represent stronger relative positioning across the universe, while higher ranks reflect weaker positioning. Here, the spread from #1790 to #400 is large enough to treat near-term signals as requiring confirmation from independent technical evidence (momentum, volatility, and level behavior) before concluding that the longer-horizon strength is reasserting.
Term view: Short-term: Bearish. Mid-term: Neutral. Long-term: Neutral.
Want the full universe and complete rank tables? Unlock full access on KGNAI: https://www.kgnai.com/pricing
2) Price & trend overview
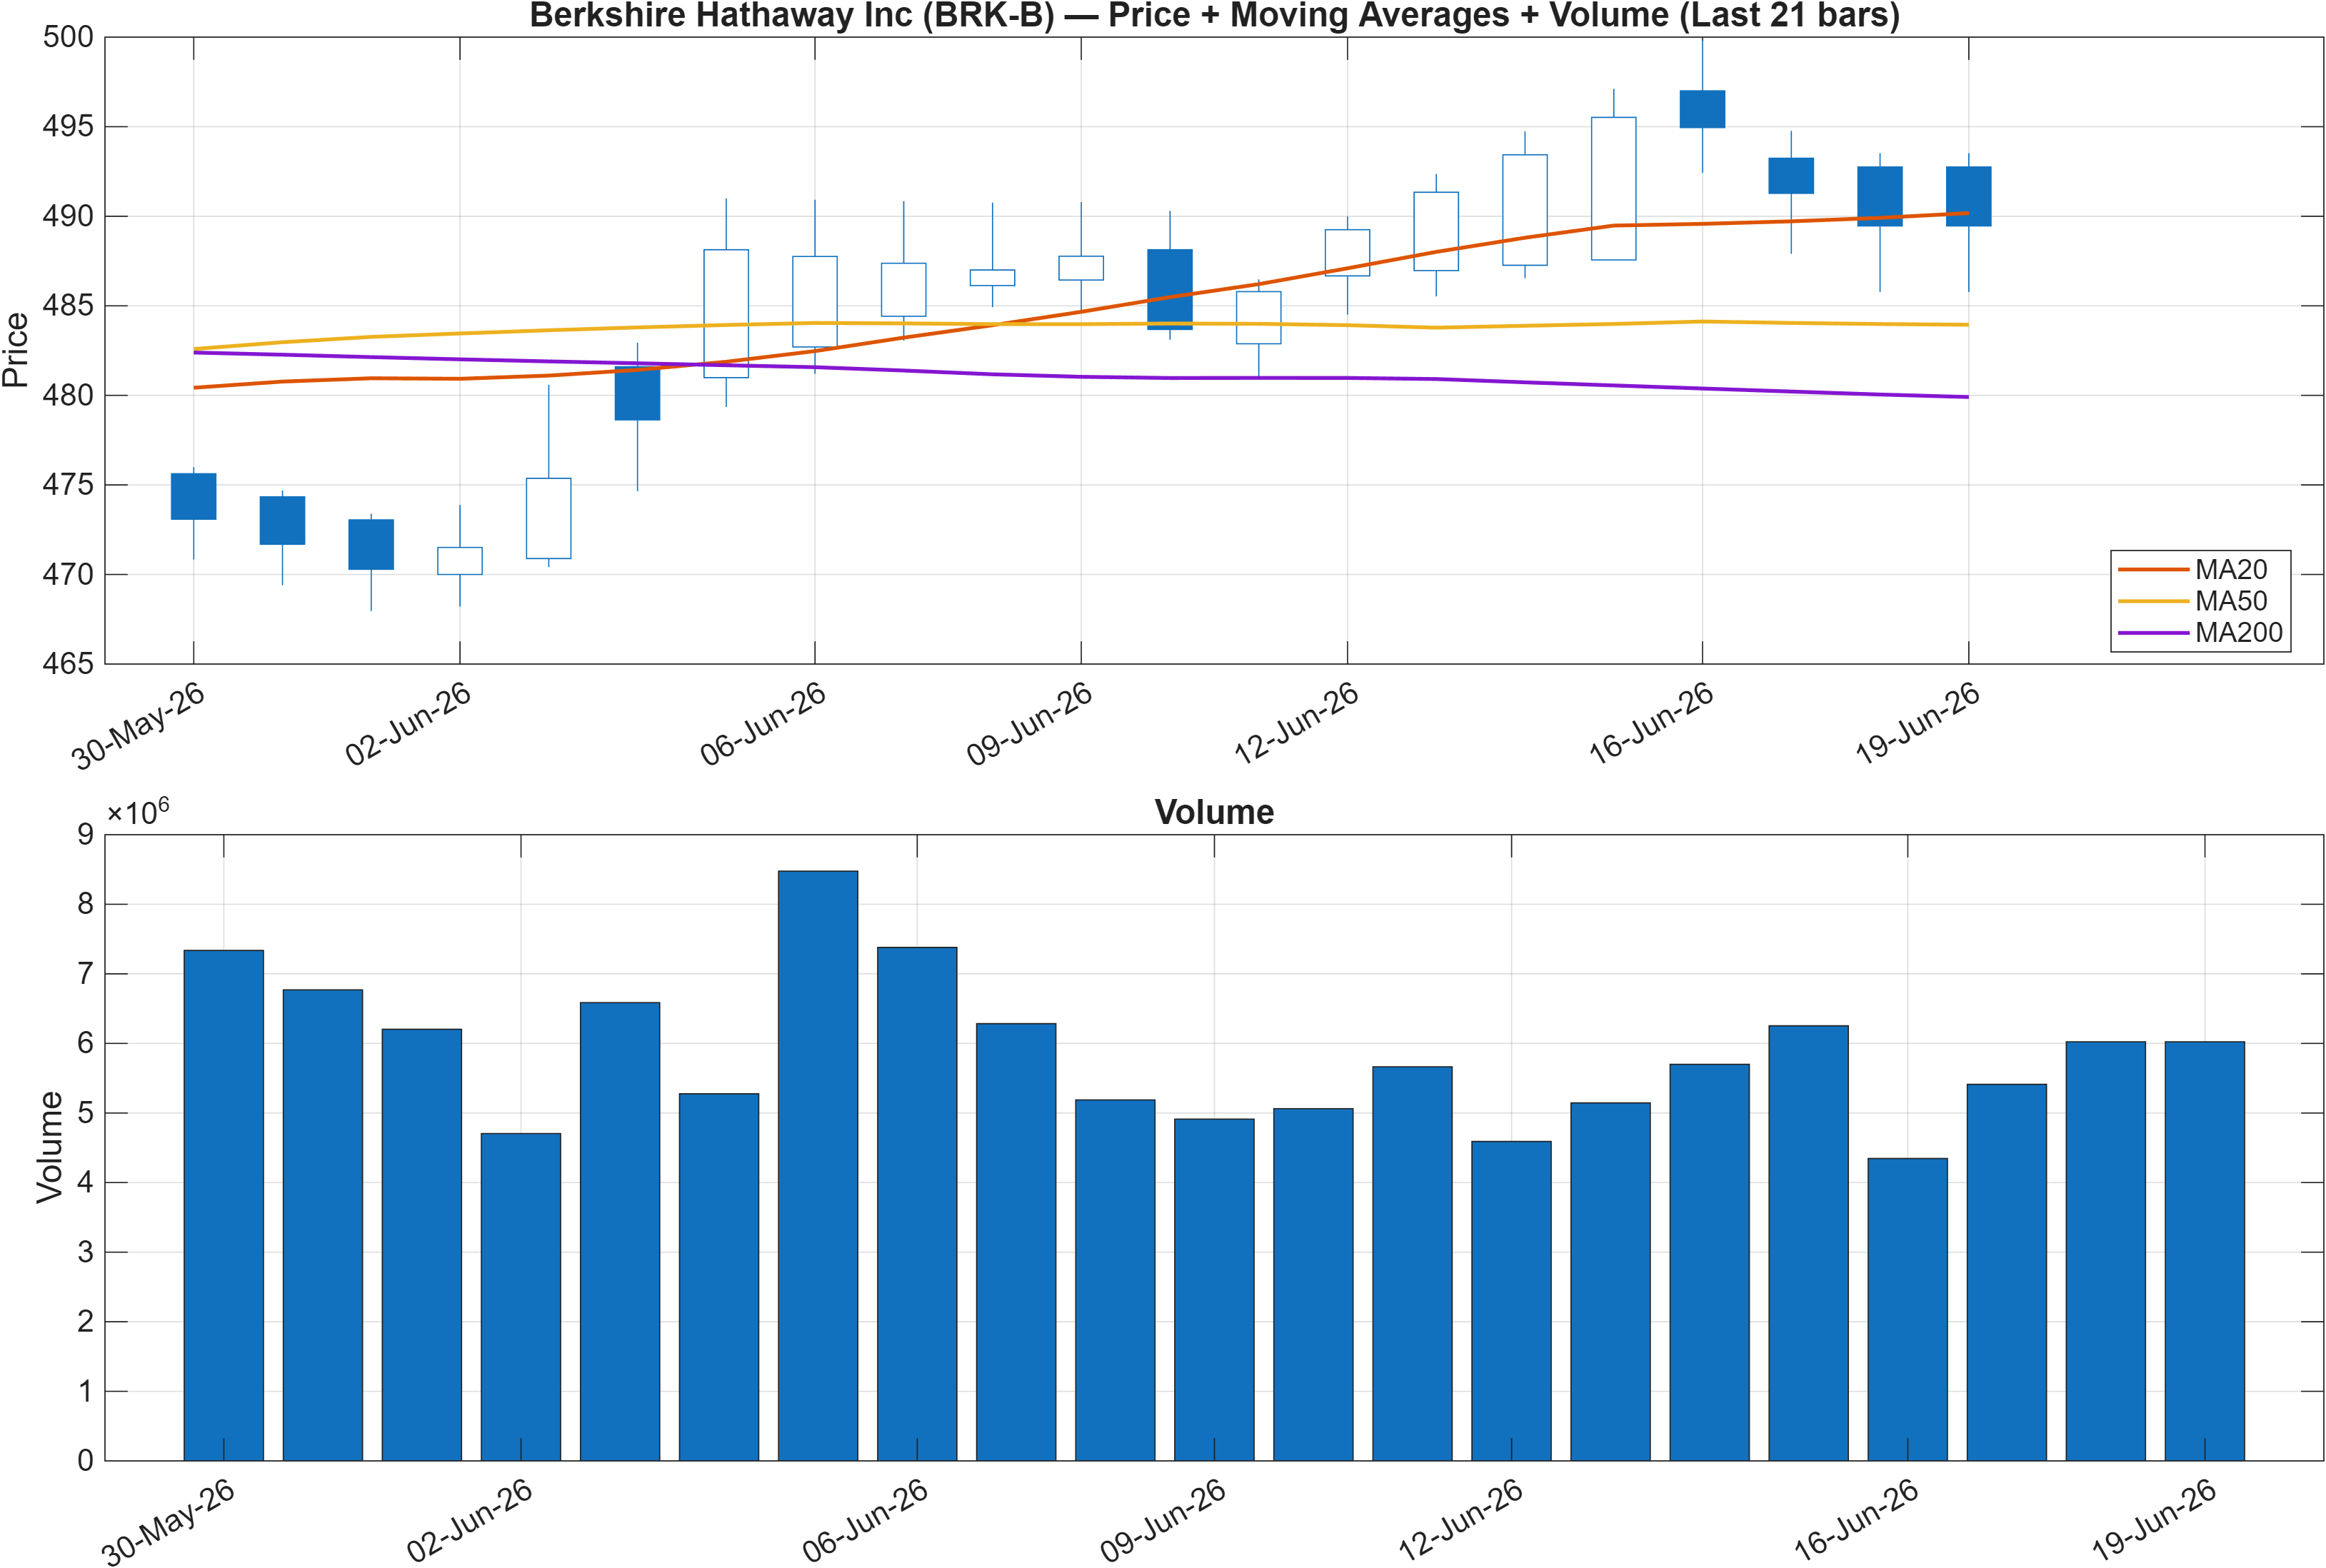
Interpretation: Close vs MA50 = Bullish, MA50 vs MA200 = Bullish.
The trend stack is constructive on classical moving-average criteria: price relative to the MA50 is Bullish and MA50 versus MA200 is Bullish. That configuration typically signals trend persistence rather than a trend break, even when rank metrics show short-term weakness. The analytical tension is therefore not “uptrend vs downtrend,” but continuation vs stall.
When the moving averages are aligned positively but the short-term rank is weak (daily rank #1790), the market often transitions into a range-building phase—where incremental gains become harder and reversals become more frequent around nearby levels. In this context, volume behavior (as displayed in Figure 1) is used more as a confirmation tool: continuation setups tend to require participation as price challenges the upper end of the active range (see resistance 492.9417 in Section 4).
Practically, this structure makes level discipline more important than broad trend labeling. With support defined at 467.1117, the bullish moving-average profile is better treated as a risk-management anchor (trend intact while above support) rather than a standalone directional signal. Given the compressed volatility regime identified later (bandwidth 0.0644), the trend structure can remain bullish while price oscillates without sustained follow-through—consistent with “sideways momentum persists.”
3) Momentum & volatility dashboard
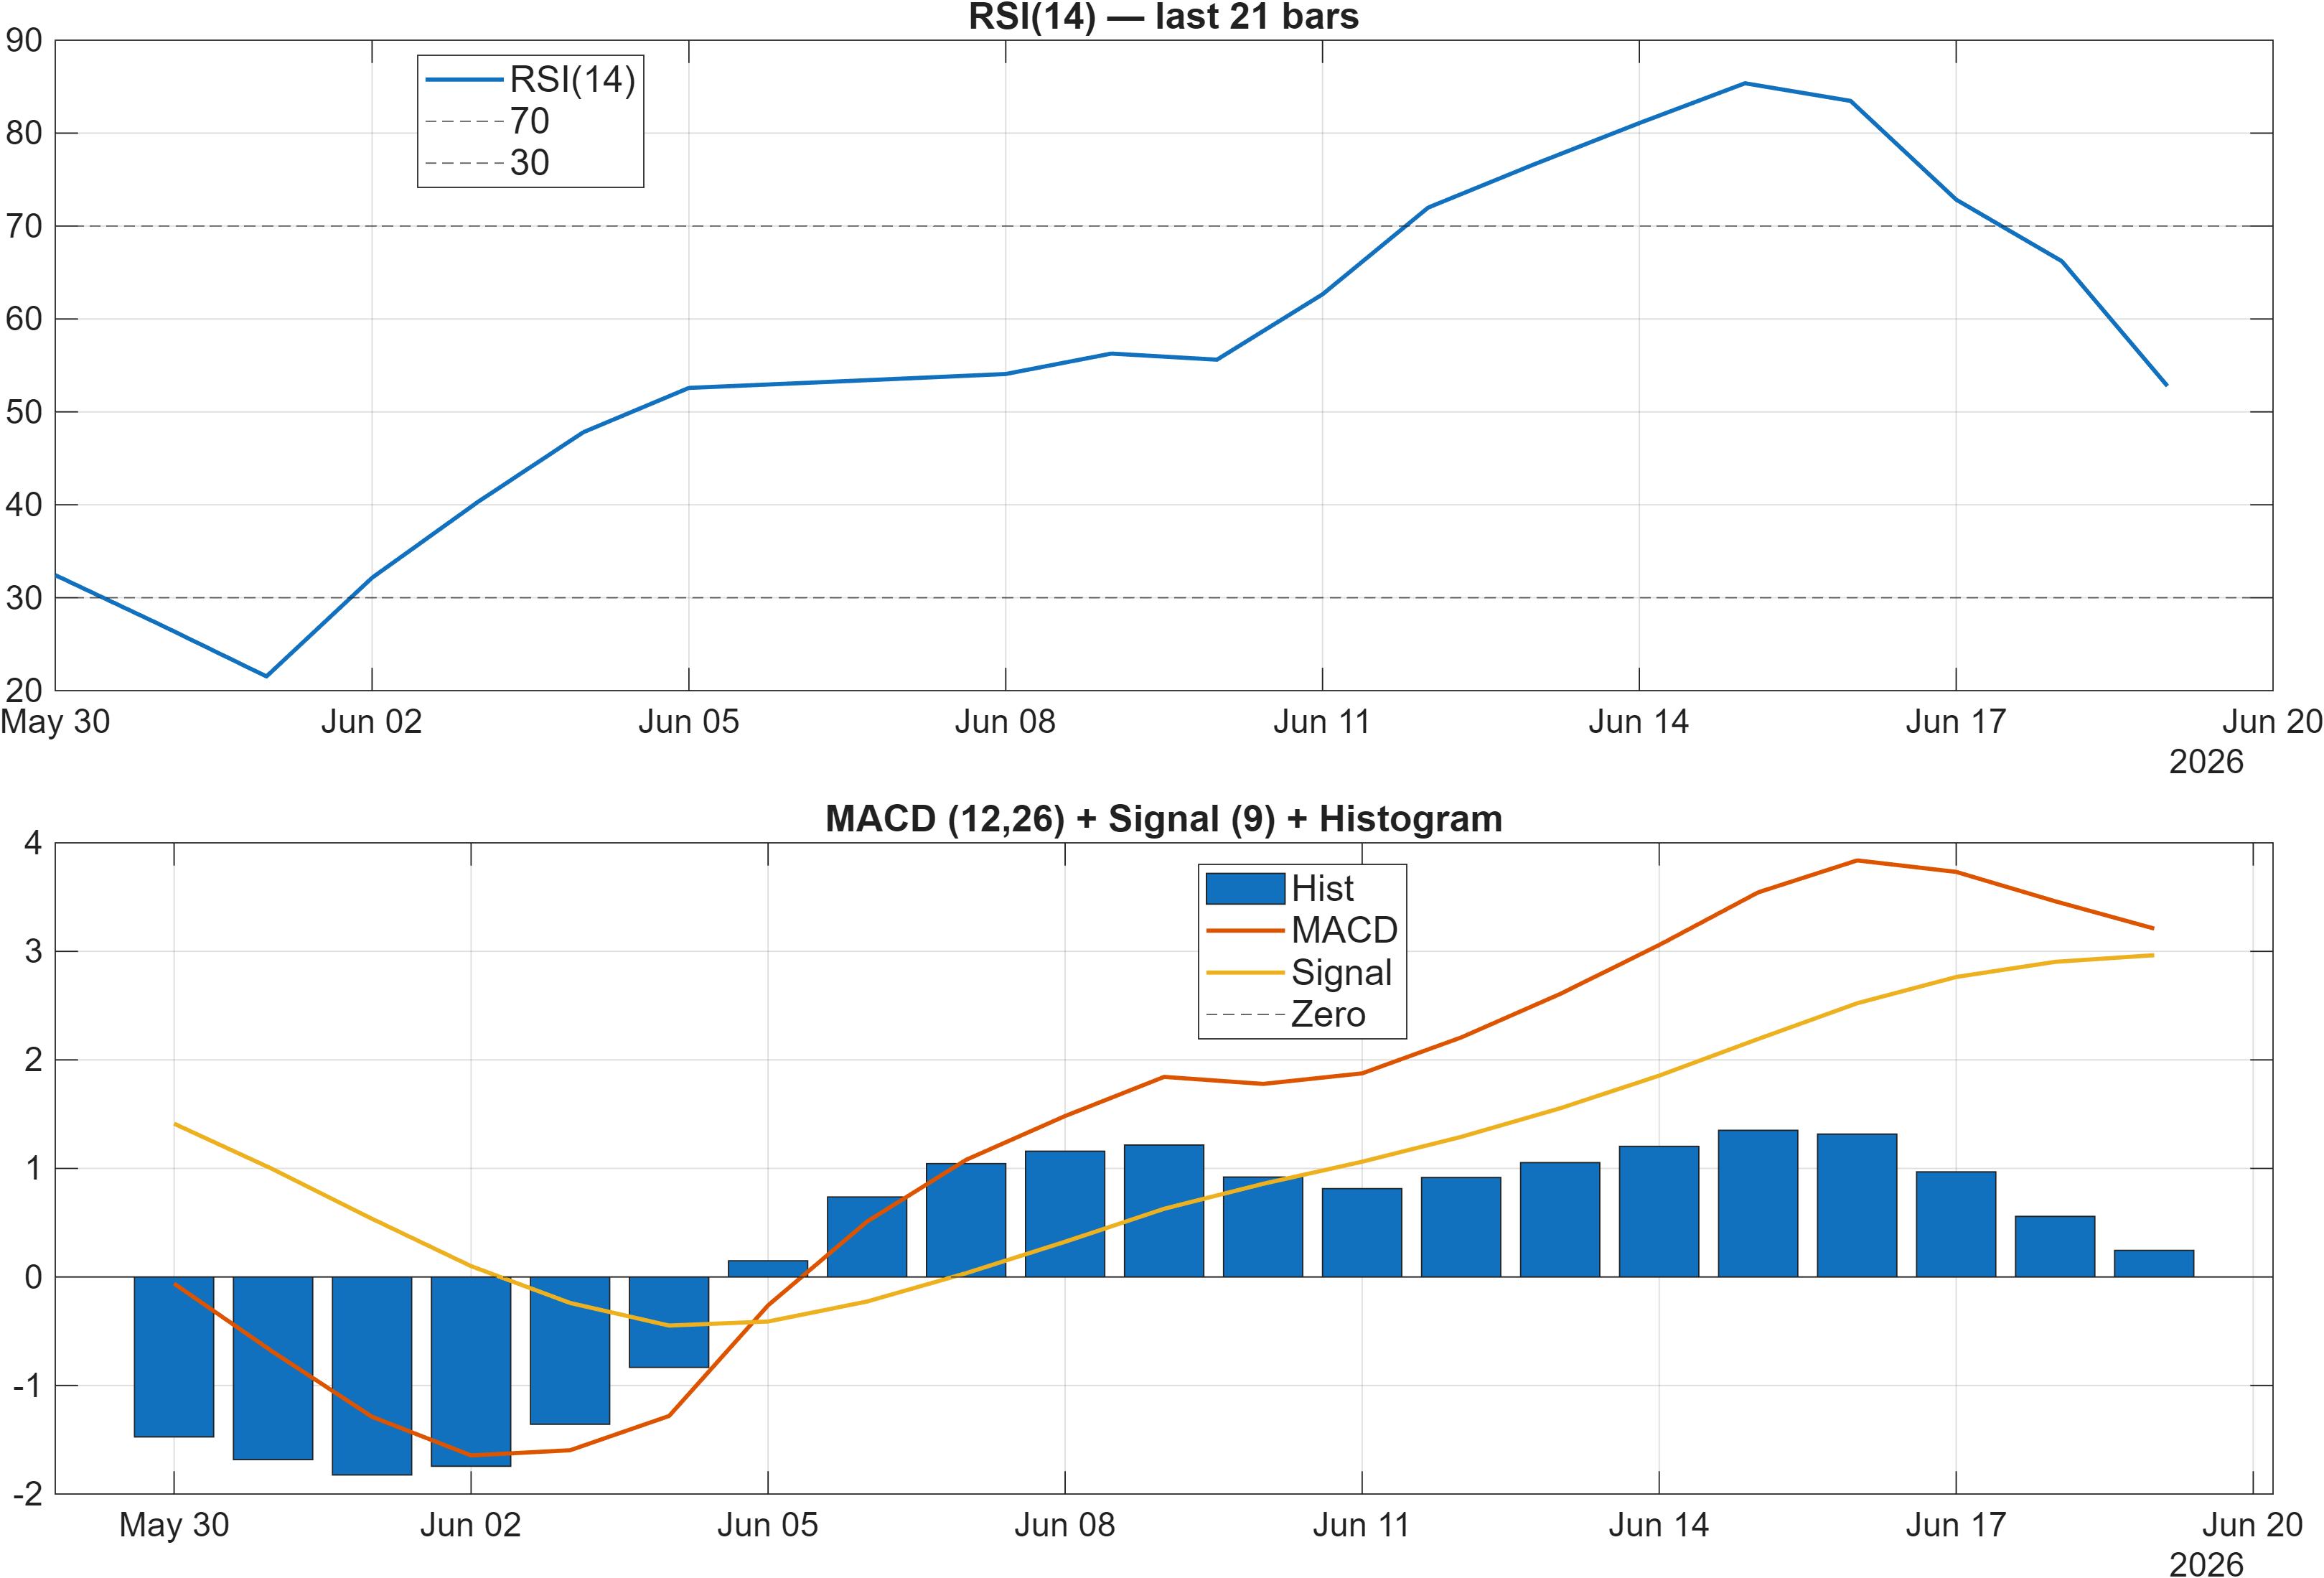
Interpretation: RSI bias = Neutral, MACD hist = 0.2452.
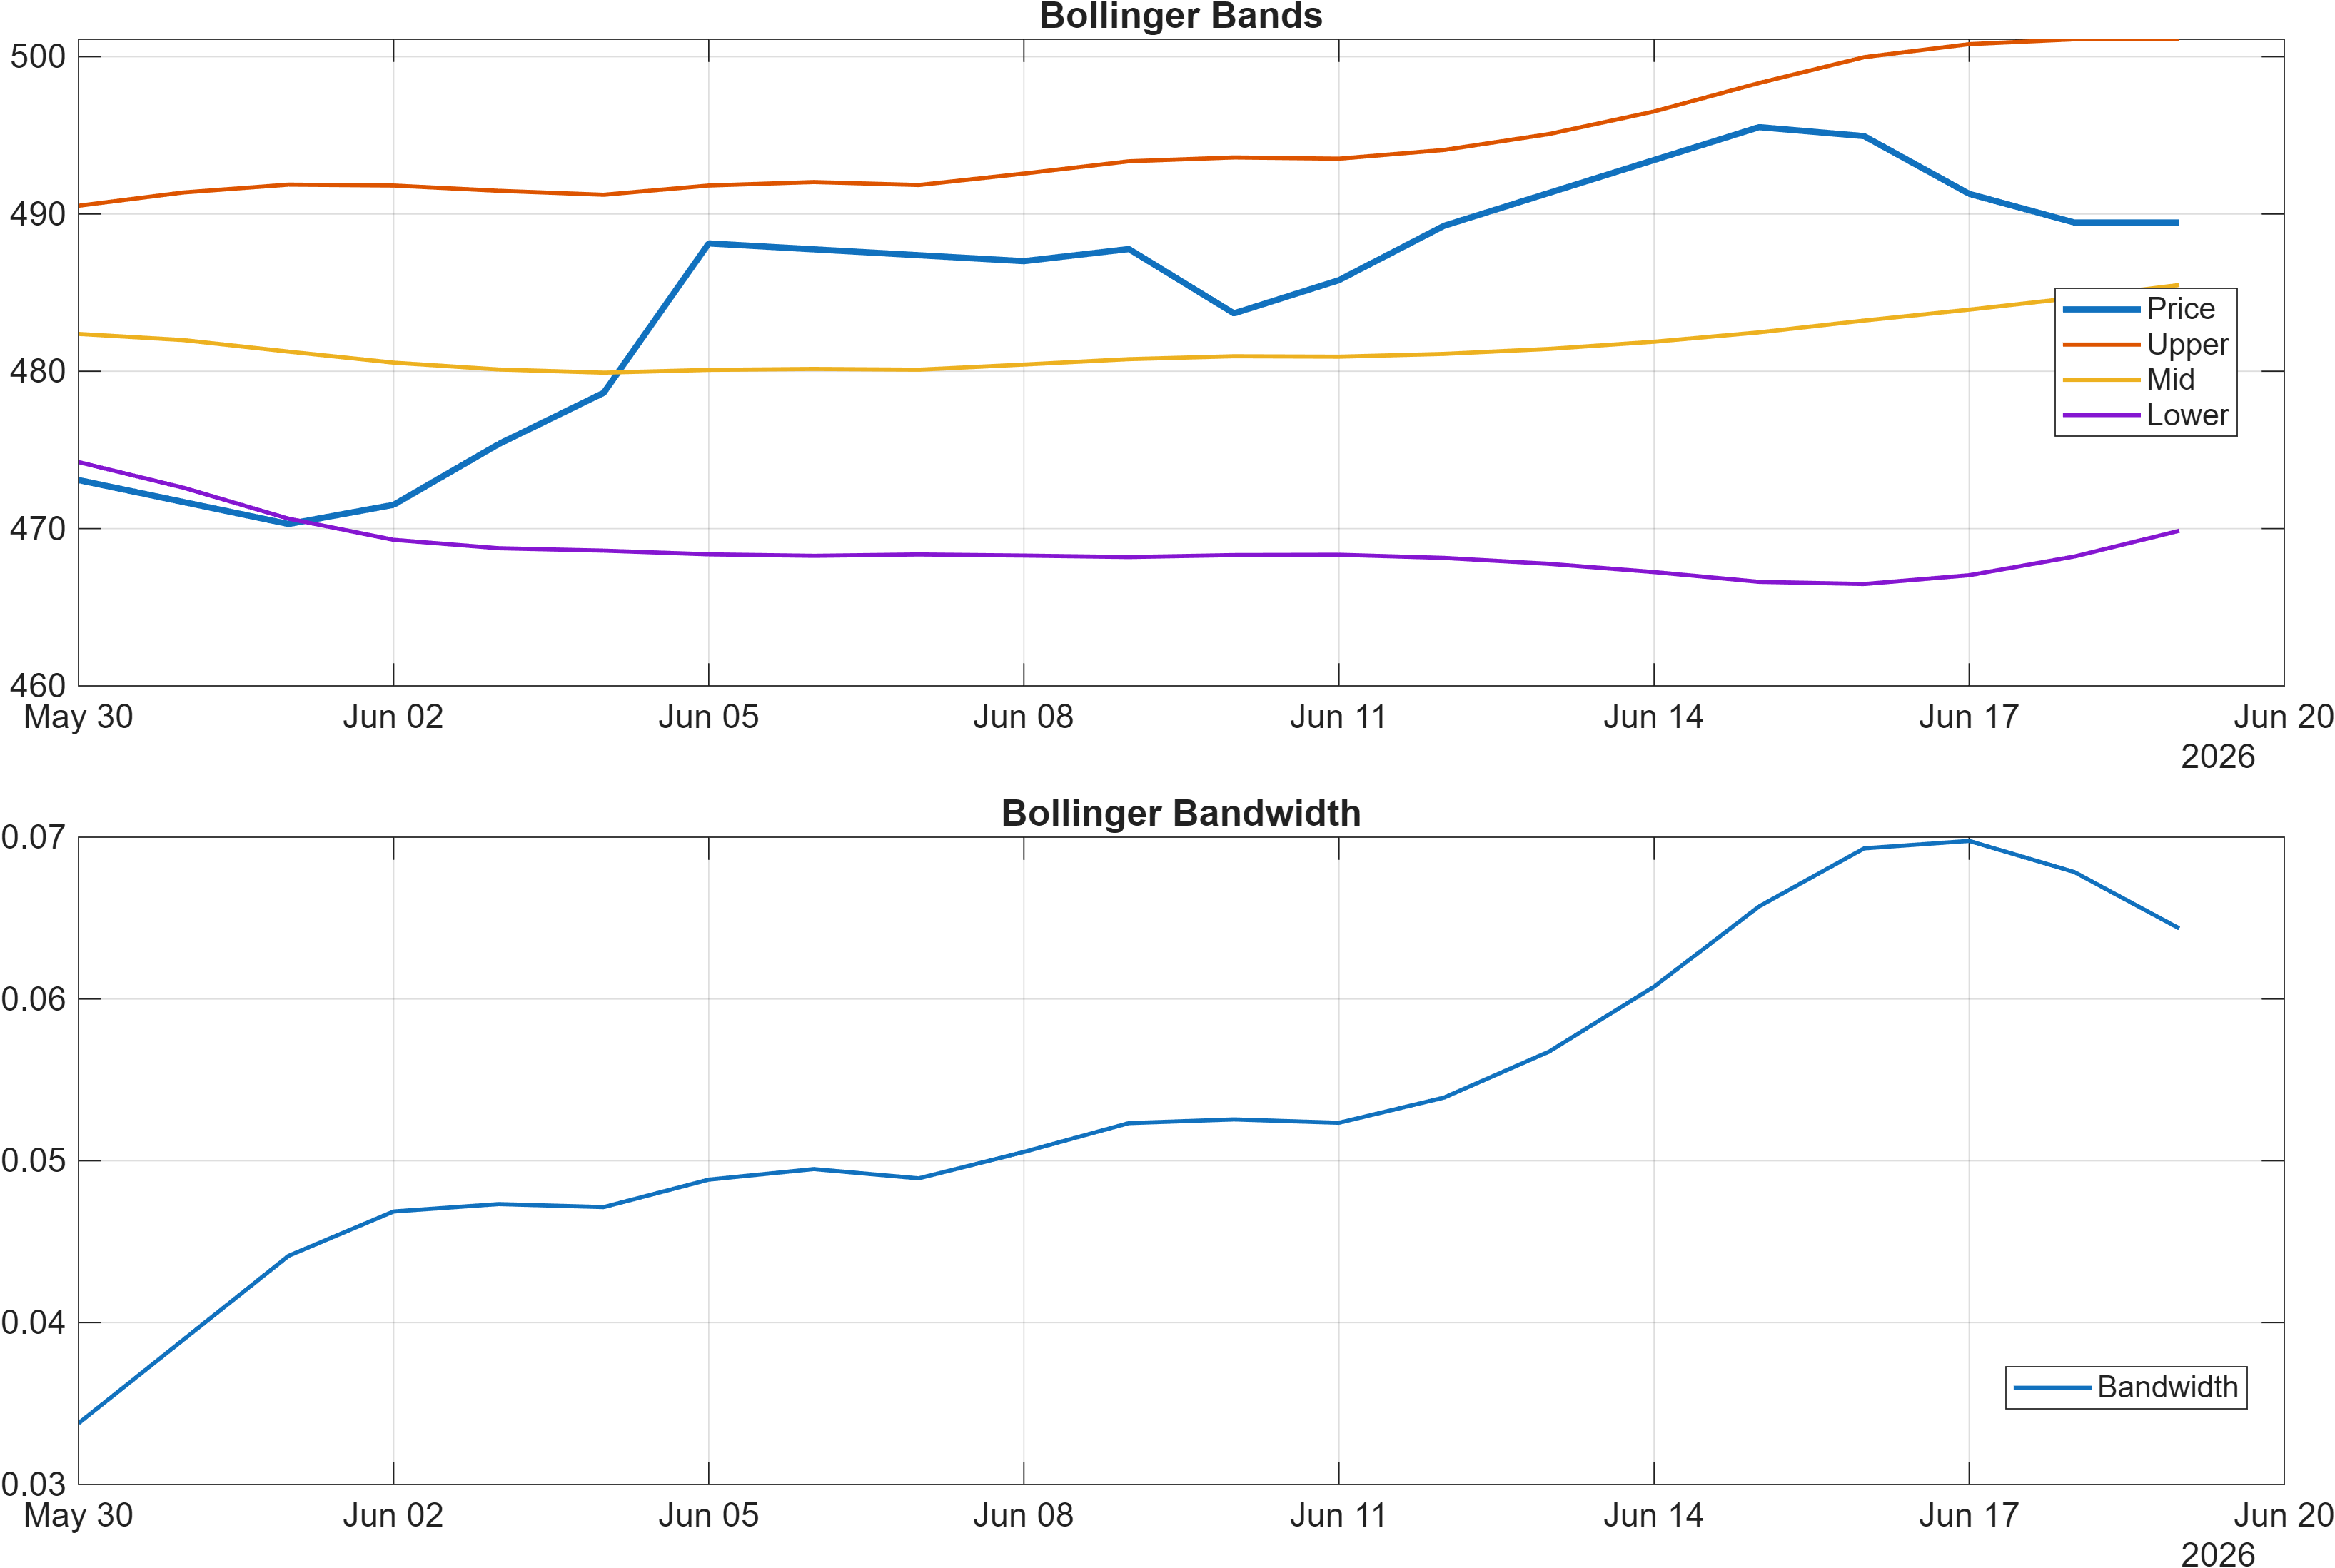
Interpretation: Bandwidth (volatility regime) latest = 0.0644.
Momentum is best described as positive but not forceful. The RSI bias is Neutral with RSI(14) at 52.78, which is consistent with a market hovering near balance rather than trending aggressively. At the same time, the MACD histogram at 0.2452 is positive, indicating upside momentum is present, but it has not translated into an unambiguous overbought condition.
The volatility regime is the other defining feature. Bollinger Bandwidth is 0.0644 (with BB Width also shown as 0.06436 in the signal dashboard), which supports a compression interpretation. Compression regimes often coincide with tighter ranges and more frequent mean-reversion, raising the bar for breakout confirmation. In these environments, momentum signals can register “bullish” readings without delivering extended follow-through, especially if volume participation is inconsistent (see Vol ROC(20) -11.03 flagged Bearish in the signal table).
The combined read is signal compression with mild positive drift: neutral RSI suggests neither exhaustion nor fresh impulse; positive MACD suggests incremental upside bias; low bandwidth suggests the market is coiled but not yet expanding. With the short-term universe rank still weak (#1790 daily), the more robust inference is that BRK-B requires either volatility expansion or a decisive level break to resolve the current sideways momentum.
4) Support / Resistance zones
Support ~ 467.1117 | Resistance ~ 492.9417
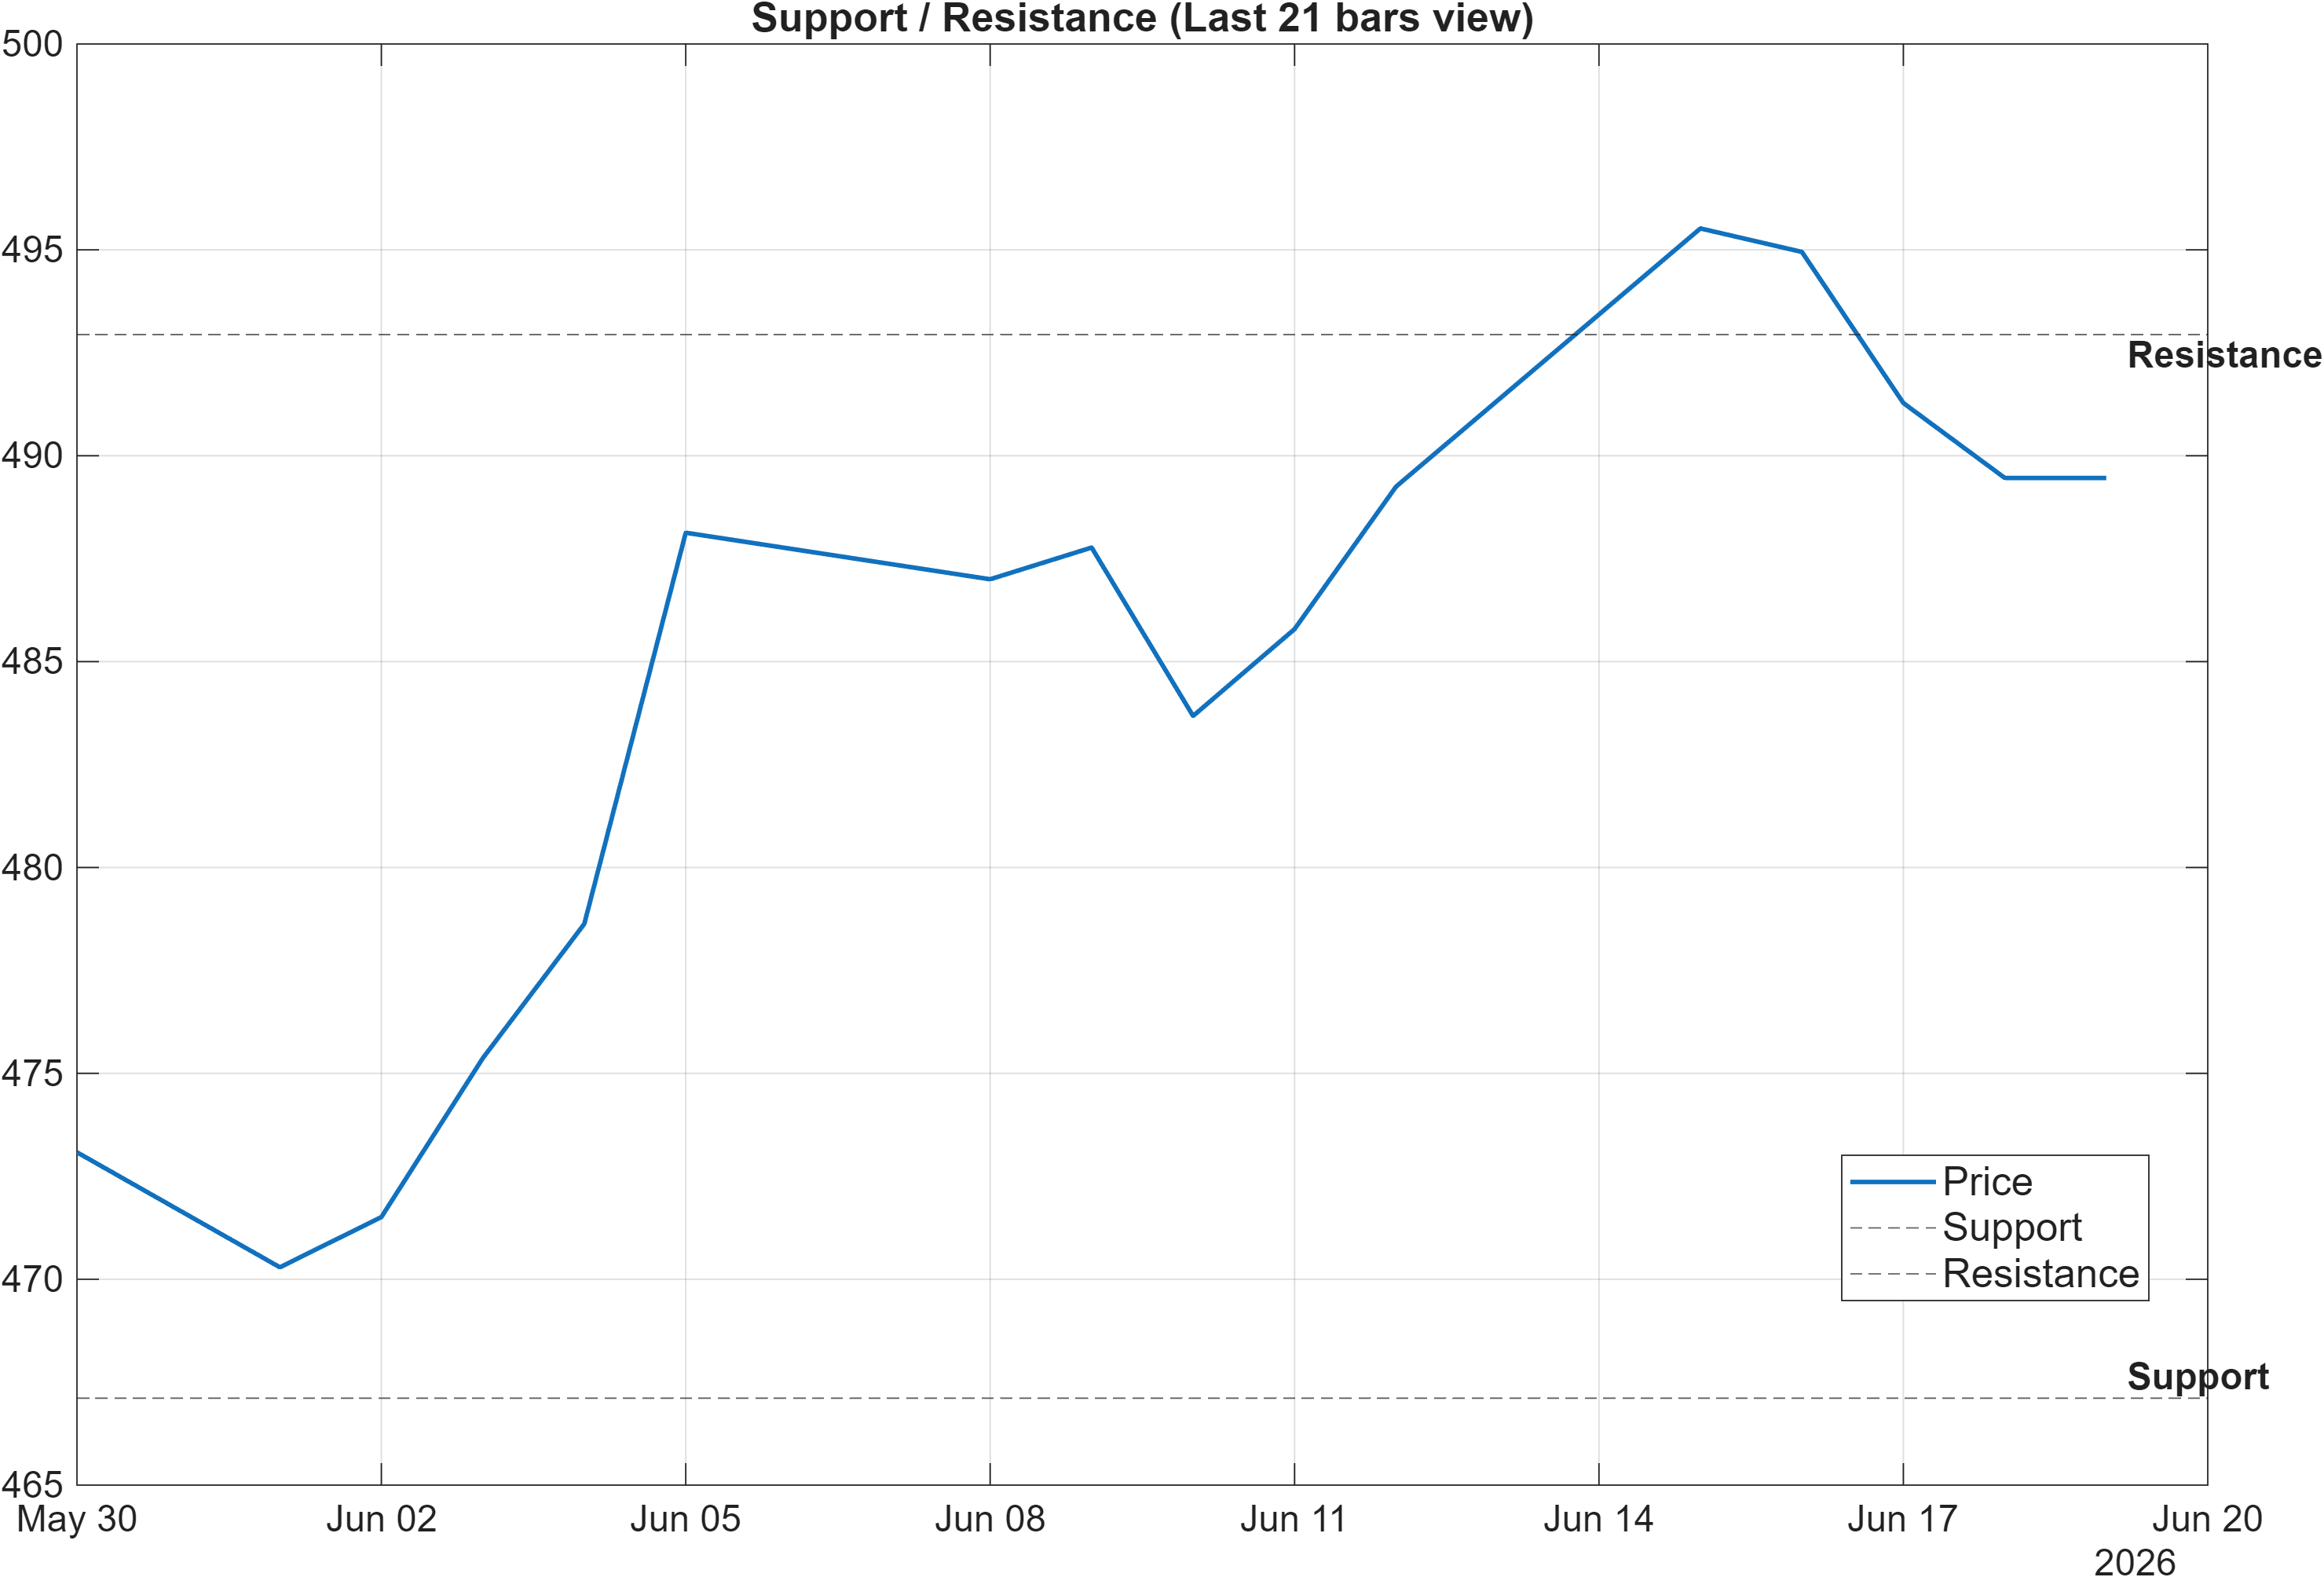
Scenario view: Break above resistance with volume → continuation. Close below support → signal deterioration risk.
The current map is a defined range with support at 467.1117 and resistance at 492.9417. In a compressed volatility backdrop (bandwidth 0.0644), these zones tend to act less like single points and more like decision areas where positioning and liquidity can shift quickly.
A constructive aspect is that the trend structure remains supportive (close vs MA50 Bullish; MA50 vs MA200 Bullish), which typically improves the odds that pullbacks into support are defended—provided the broader technical stack does not deteriorate. However, the short-term KGNAI rank (daily #1790) argues for caution: weak relative behavior can show up as failed tests of resistance or repeated rejections near the top of the range.
Confirmation logic is therefore straightforward and data-consistent: a break above 492.9417 with volume aligns with continuation, and it would also better reconcile the bullish confluence readings (Section 5) with the short-term rank weakness. Conversely, a close below 467.1117 would represent a deterioration condition because it would occur despite positive MACD (0.2452) and a mostly bullish signal stack—suggesting the market is repricing risk rather than merely consolidating.
In range regimes, the “middle” tends to be noisy. The analytically cleaner approach is to treat these two levels as the primary reference points and evaluate whether momentum (RSI neutral at 52.78) and volatility (bandwidth 0.0644) begin to expand in tandem as either boundary is challenged.
5) Quant Technical Dashboard (18 Signals)
KGNAI AI Technical Analysis Score (Deep Reinforcement Learning): Rank #1050 out of 2042 (Rank 1 represents the strongest technical positioning and a higher probability of favorable price behavior. As ranks increase toward the maximum, the probability of favorable outcomes weakens and bearish positioning becomes more dominant.) | Label: Neutral | Score: -0.028
18-Signal Technical Confluence Score: 0.500 (Bullish)
Overall Technical Score (18-signal confluence + DRL rank blend): 0.341 (Bullish)
Note: The blended score reflects signal strength weighted against broader AI technical ranking, which may temporarily diverge.
Blended technical score breakdown: 0.341 (Bullish | Bull 11 / Bear 2 / Neutral 5)
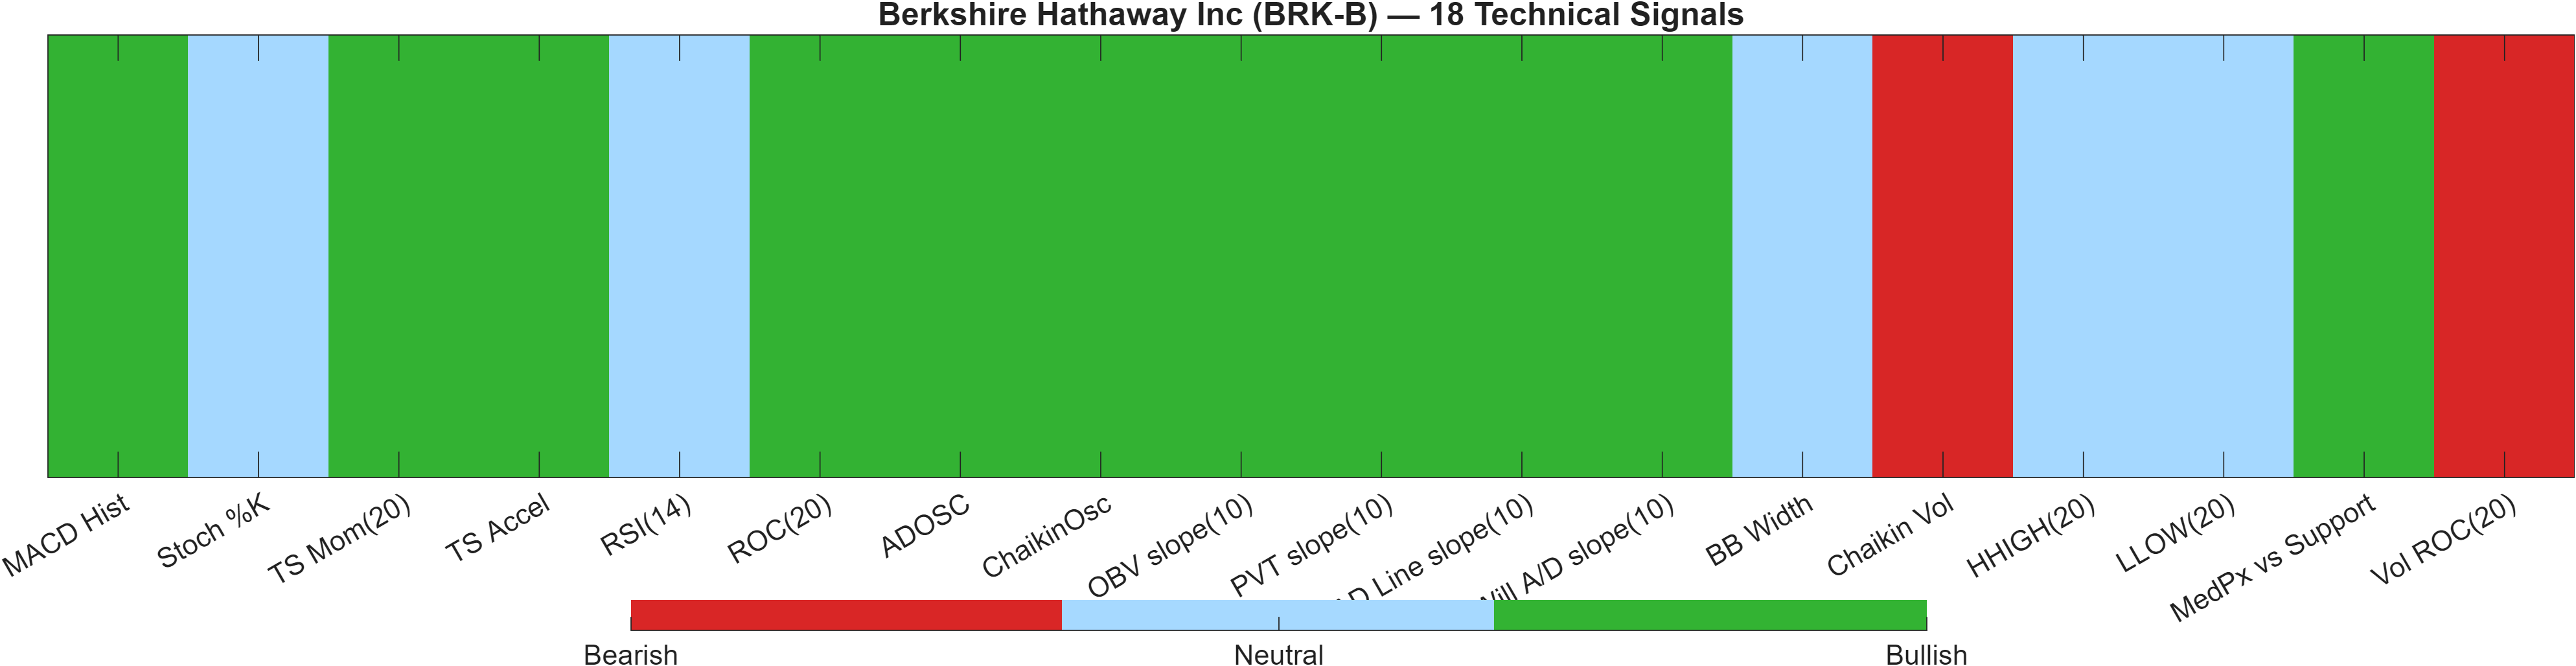
Signal table (Bull/Bear/Neutral)
| Indicator | Value | Signal |
|---|---|---|
| MACD Hist | 0.2452 | Bullish |
| Stoch %K | 44.85 | Neutral |
| TS Mom(20) | 17.77 | Bullish |
| TS Accel | 31.05 | Bullish |
| RSI(14) | 52.78 | Neutral |
| ROC(20) | 3.768 | Bullish |
| ADOSC | 28.77 | Bullish |
| ChaikinOsc | 3.544e+06 | Bullish |
| OBV slope(10) | 6.51e+06 | Bullish |
| PVT slope(10) | 2.023e+04 | Bullish |
| AD Line slope(10) | 1.296e+07 | Bullish |
| Will A/D slope(10) | 10.94 | Bullish |
| BB Width | 0.06436 | Neutral |
| Chaikin Vol | 2.151 | Bearish |
| HHIGH(20) | 499.8 | Neutral |
| LLOW(20) | 468 | Neutral |
| MedPx vs Support | 22.53 | Bullish |
| Vol ROC(20) | -11.03 | Bearish |
Interpretation: Indicator-level signals form the base confluence, which is then adjusted using a separate AI-driven technical ranking model. The final technical score summarizes this combined view.
The dashboard is notable for a bullish-leaning breadth across indicators while the AI technical rank remains mid-pack. The 18-signal confluence score is 0.500 (Bullish) and the blended overall technical score is 0.341 (Bullish), supported by a Bull 11 / Bear 2 / Neutral 5 breakdown. Yet the DRL technical rank is #1050 with a score of -0.028, reflecting that the broader AI ranking model is not fully aligned with the indicator stack.
That divergence is consistent with the broader “sideways” regime: the indicator layer captures near-term internal strength (e.g., ROC(20) 3.768 and TS Mom(20) 17.77 both Bullish, plus MACD hist 0.2452 Bullish), while the AI technical rank can remain neutral when trend quality, stability, or comparative behavior is not sufficiently persistent. The neutral RSI(14) 52.78 reinforces that momentum is present but not stretched.
The two explicit bearish flags—Chaikin Vol 2.151 and Vol ROC(20) -11.03—are important in a compressed volatility environment (BB Width 0.06436). They suggest participation/volatility characteristics are not uniformly supportive, which can lead to stop-start price action near resistance (492.9417) even when many directional indicators read Bullish. Net: the confluence favors the upside, but confirmation is better demanded via a level break or volatility expansion rather than relying on signal count alone.
6) News sentiment + extractive gist
Sentiment score (avg): -0.023 | Positive: 0% | Neutral: 89% | Negative: 11%
KGNAI AI News Sentiment Score (normalized -1 to +1): 0.85 (as of 2026-06-18) | Label: Bullish | Overall news score: 0.84
Positive Developments
Recent coverage across major financial outlets indicates a constructive narrative bias toward Berkshire Hathaway’s positioning and portfolio-related discussion, even if the tone is more analytical than catalyst-driven. The normalized sentiment score reads 0.85 (Bullish) with an overall news score of 0.84, suggesting that the language in the digest skews supportive. At the same time, the distribution is heavily Neutral (89%) with 0% Positive, implying that “bullish” here is more about the absence of strongly adverse framing than an abundance of explicit positive surprises. This backdrop can complement the technical picture where trend structure is constructive (MA relationships Bullish) and MACD momentum remains positive (0.2452), but it does not, by itself, resolve the short-term ranking weakness (daily rank #1790). Overall, sentiment appears supportive as a contextual tailwind rather than a primary driver.
Neutral / Mixed Developments
The dominant characteristic of the digest is information-heavy neutrality: the average sentiment score is slightly negative at -0.023 while most items are classified as Neutral. This mix tends to coincide with “steady-state” investor attention—coverage that revisits positioning, performance context, or familiar themes rather than signaling a sharp shift in expectations. In market terms, that aligns with the current technical regime of compression (Bollinger bandwidth 0.0644) and range reference points (support 467.1117, resistance 492.9417). The result is a plausible environment for incremental moves and mean reversion inside the range, where price confirmation becomes more important than narrative interpretation. In short, the news flow in the provided data reads consistent with consolidation rather than an inflection.
Negative / Risk Signals
Risk signals in the provided digest appear contained but not absent. The classification shows 11% Negative with an overall average sentiment slightly below zero (-0.023), indicating that a minority of coverage carries cautionary framing. Given that the daily KGNAI rank is in the weaker tail (#1790 of 2042), this mild negativity matters because short-horizon relative weakness can be sensitive to incremental adverse framing—especially in a low-volatility setting where breakouts require participation. From a positioning standpoint, the main risk is that narrative caution coincides with technical non-confirmation: if volatility remains compressed and volume indicators remain mixed (e.g., bearish Vol ROC(20) -11.03), resistance tests can fail without a clear fundamental trigger. Monitoring is therefore less about single stories and more about whether coverage tone shifts meaningfully away from neutrality.
- Whether sentiment dispersion changes materially from 89% Neutral toward more directional classification.
- Whether price action confirms the bullish tone via a break above 492.9417 rather than continued range churn.
- Whether volatility/participation measures improve alongside any breakout attempt (bandwidth 0.0644 currently compressed).
Sources referenced: Reuters, Bloomberg, Yahoo Finance, MarketWatch, Investing.com
Snapshot: AI Rank (Short–Mid–Long): Mixed (Bearish–Neutral–Neutral) · Technical Confluence: Bullish · Key Levels: Support ~467.11 | Resistance ~492.94 · News Sentiment: Neutral
7) Sources
The full source list and URLs are provided in the underlying draft. Per publication format, headline lists and links are not reproduced here.
You may also like: How KGNAI AI ranks instruments across global markets
Disclaimer: KGNAI provides AI-generated analytics and educational market commentary only. This is not financial advice. Markets involve risk. Always do your own research.