Sprinklr Inc (CXM) — 10-Jun-2026 Multi-Horizon Ranks Diverge From Bullish Technical Confluence
Sprinklr Inc (CXM) enters 10-Jun-2026 with a split profile: KGNAI’s cross-sectional ranks lean cautious while the 18-signal technical layer reads constructive. In the ranked universe of 2046 instruments, CXM sits in the lower third on the daily view (rank #1675) and near the bottom decile on the monthly view (rank #2017), while the weekly rank (#1330) is closer to the middle of the pack. This mismatch typically reflects a market that is attempting to stabilize tactically, even as broader relative strength remains weak versus peers. Momentum indicators show neutrality at the oscillator level (RSI(14) 54.35) but a negative MACD histogram (-0.0247), suggesting upside attempts may require confirmation through trend structure and follow-through volume. With support near 4.8708 and resistance near 5.6551, the near-term decision set is well-defined: price acceptance above resistance would improve continuation odds, while a decisive close below support would raise deterioration risk.
- Rank stance: Short-term Bearish (daily #1675); Mid-term Bearish (monthly #2017); Long-term: Not available in the provided data.
- Technical confluence: Bullish (18-signal confluence 0.444; overall technical score 0.363).
- Key levels: Support ~ 4.8708 | Resistance ~ 5.6551.
- News sentiment bias: Neutral distribution (Positive 32% / Neutral 68% / Negative 0%), alongside a bullish normalized score of 1.00 (as of 2026-06-08).
- Confirmation / invalidation: Confirmation improves on a break above 5.6551 with volume; risk rises on a close below 4.8708.
KGNAI evaluates assets using large cross-sectional datasets built from millions of structured data points. Inputs incorporate fundamental metrics, technical structures, and systematically processed news sentiment. Statistical models, machine learning, and AI frameworks are used to assess relative positioning, signal alignment, and probabilistic behavior across broad universes.
- Ranks are comparative across the tracked universe, not absolute price targets.
- Confluence reflects alignment among independent signal groups.
- Support/resistance levels are probabilistic decision zones, not guarantees.
- Sentiment provides contextual bias within the broader analytical framework.
1) KGNAI AI Analysis
Region: USA
Total universe size: 2046 ranked instruments
- Daily rank: #1675 out of 2046 — Bearish
- Weekly rank: #1330 out of 2046 — Neutral
- Monthly rank: #2017 out of 2046 — Bearish
- 3-Monthly rank: Not available for this horizon — Not available
- 6-Monthly rank: Not available for this horizon — Not available
- Yearly rank: Not available for this horizon — Not available
Cross-sectional ranking is best read as relative positioning versus the broader universe rather than a stand-alone directional call. For CXM, the short-horizon and intermediate-horizon signals are not aligned: the daily rank (#1675) places the name in the lower third of the 2046-instrument universe, while the weekly rank (#1330) shifts toward a more middle-of-universe profile. The monthly rank (#2017) remains near the bottom decile, indicating that longer swing dynamics have not repaired relative strength.
This configuration often reflects a market attempting a tactical base while still carrying higher “carry risk” versus peers. When weekly stabilizes but monthly stays weak, the probability-weighted interpretation is that rebounds can occur, but they may be more sensitive to failed breakouts and liquidity fade—especially near identified resistance. From a risk-control perspective, the implication is to prioritize confirmation and persistence: a one- or two-session improvement in rank is less informative than sustained stabilization that lifts the weekly and monthly simultaneously.
Term view: Short-term: Bearish. Mid-term: Bearish. Long-term: Not available. Horizons beyond monthly (3M/6M/year) are Not available in the provided data, so the current read is intentionally constrained to the daily–weekly–monthly stack.
KGNAI ranks each instrument across large universes using multiple proprietary AI tests and statistical models (millions of data points). Lower ranks generally indicate stronger probability of favorable performance behavior, while higher ranks indicate weaker probability and more bearish positioning.
2) Price & trend overview
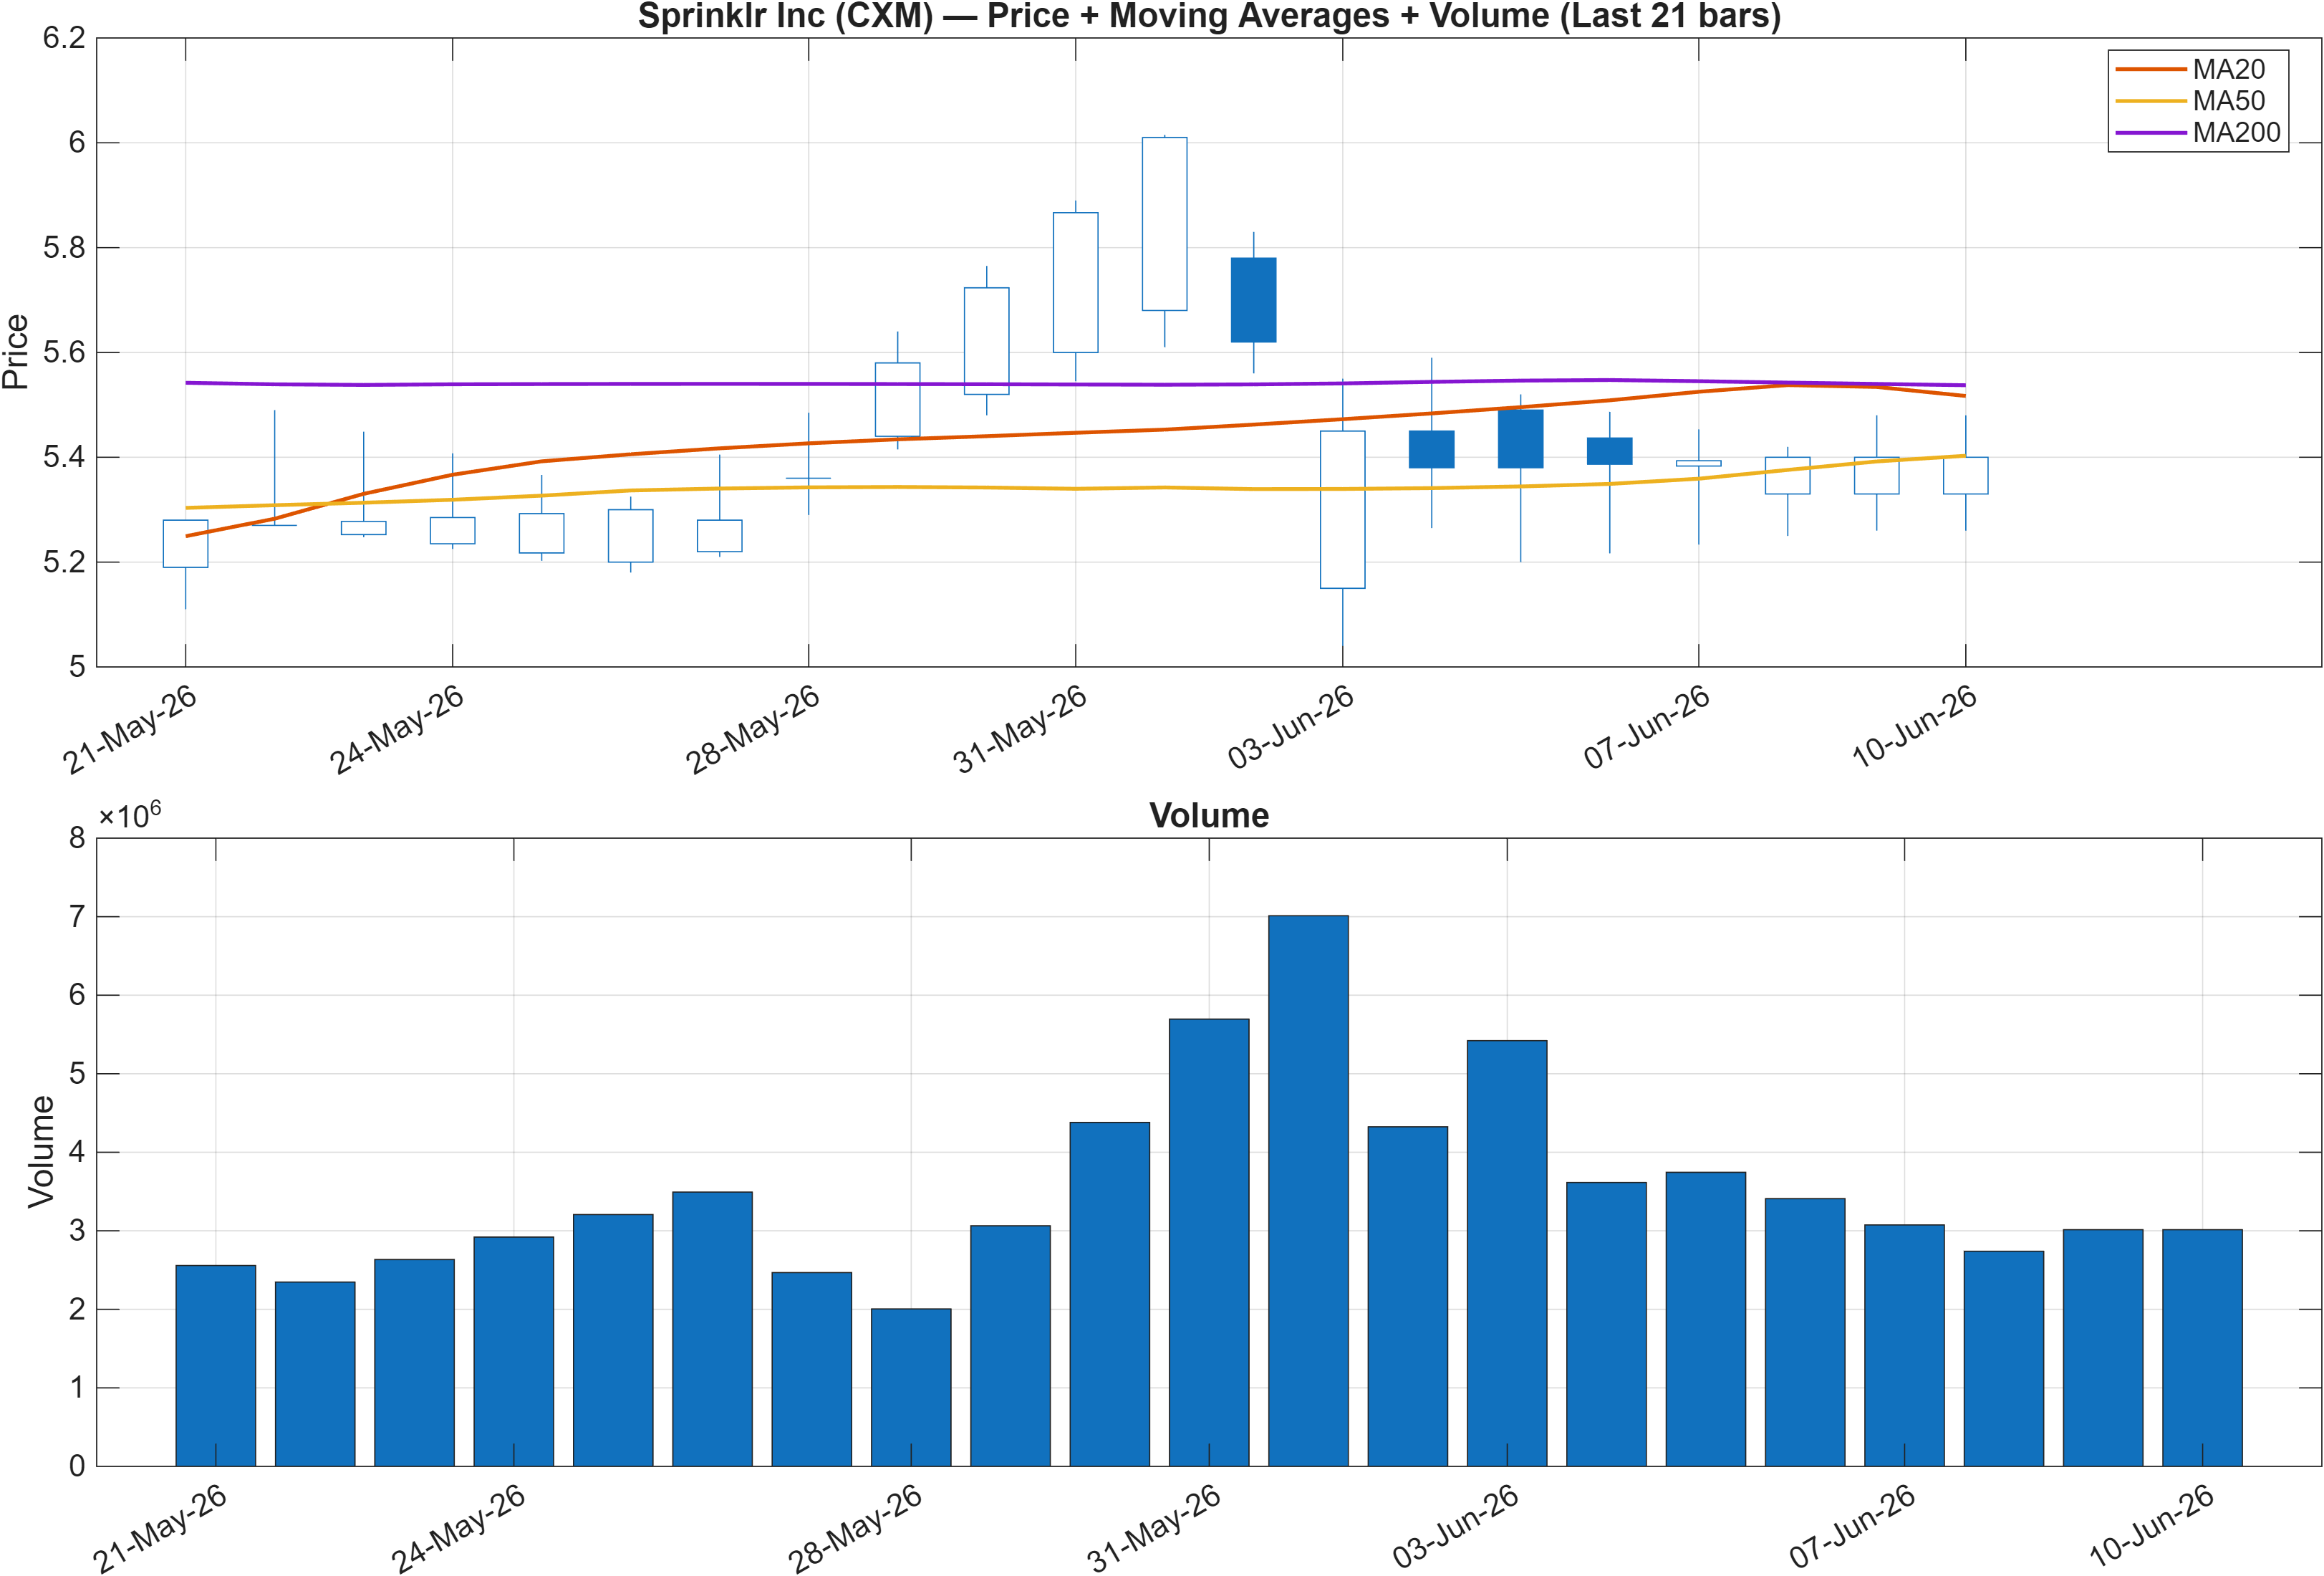
Trend structure is currently the main headwind. The moving-average state is bearish on two key comparisons: close vs MA50 = Bearish and MA50 vs MA200 = Bearish. When both conditions hold simultaneously, the market is typically in a regime where rallies face overhead supply and require stronger evidence (time, volume, and follow-through) to transition into a durable uptrend.
The more interesting element is that this bearish trend scaffold coexists with improving shorter-cycle signals elsewhere in the report. That mix is consistent with early-stage basing dynamics: price action can start to stabilize even before the MA50 turns and before the MA50/MA200 relationship repairs. Practically, that means trend confirmation is likely to be delayed relative to momentum stabilization; false starts are more common during this phase.
With the nearby structural levels later defined at 4.8708 (support) and 5.6551 (resistance), the moving-average bearish bias increases the importance of how price behaves as it approaches resistance. Acceptance above resistance would be the type of evidence that often precedes moving-average improvement; repeated rejection below resistance tends to reinforce the bearish MA configuration.
In this context, the weekly rank near the middle of the universe (#1330) can be interpreted as “less weak” behavior emerging at the margin, but not yet strong enough to reverse the broader monthly positioning (#2017). The trend view remains cautious until that gap narrows.
3) Momentum & volatility dashboard
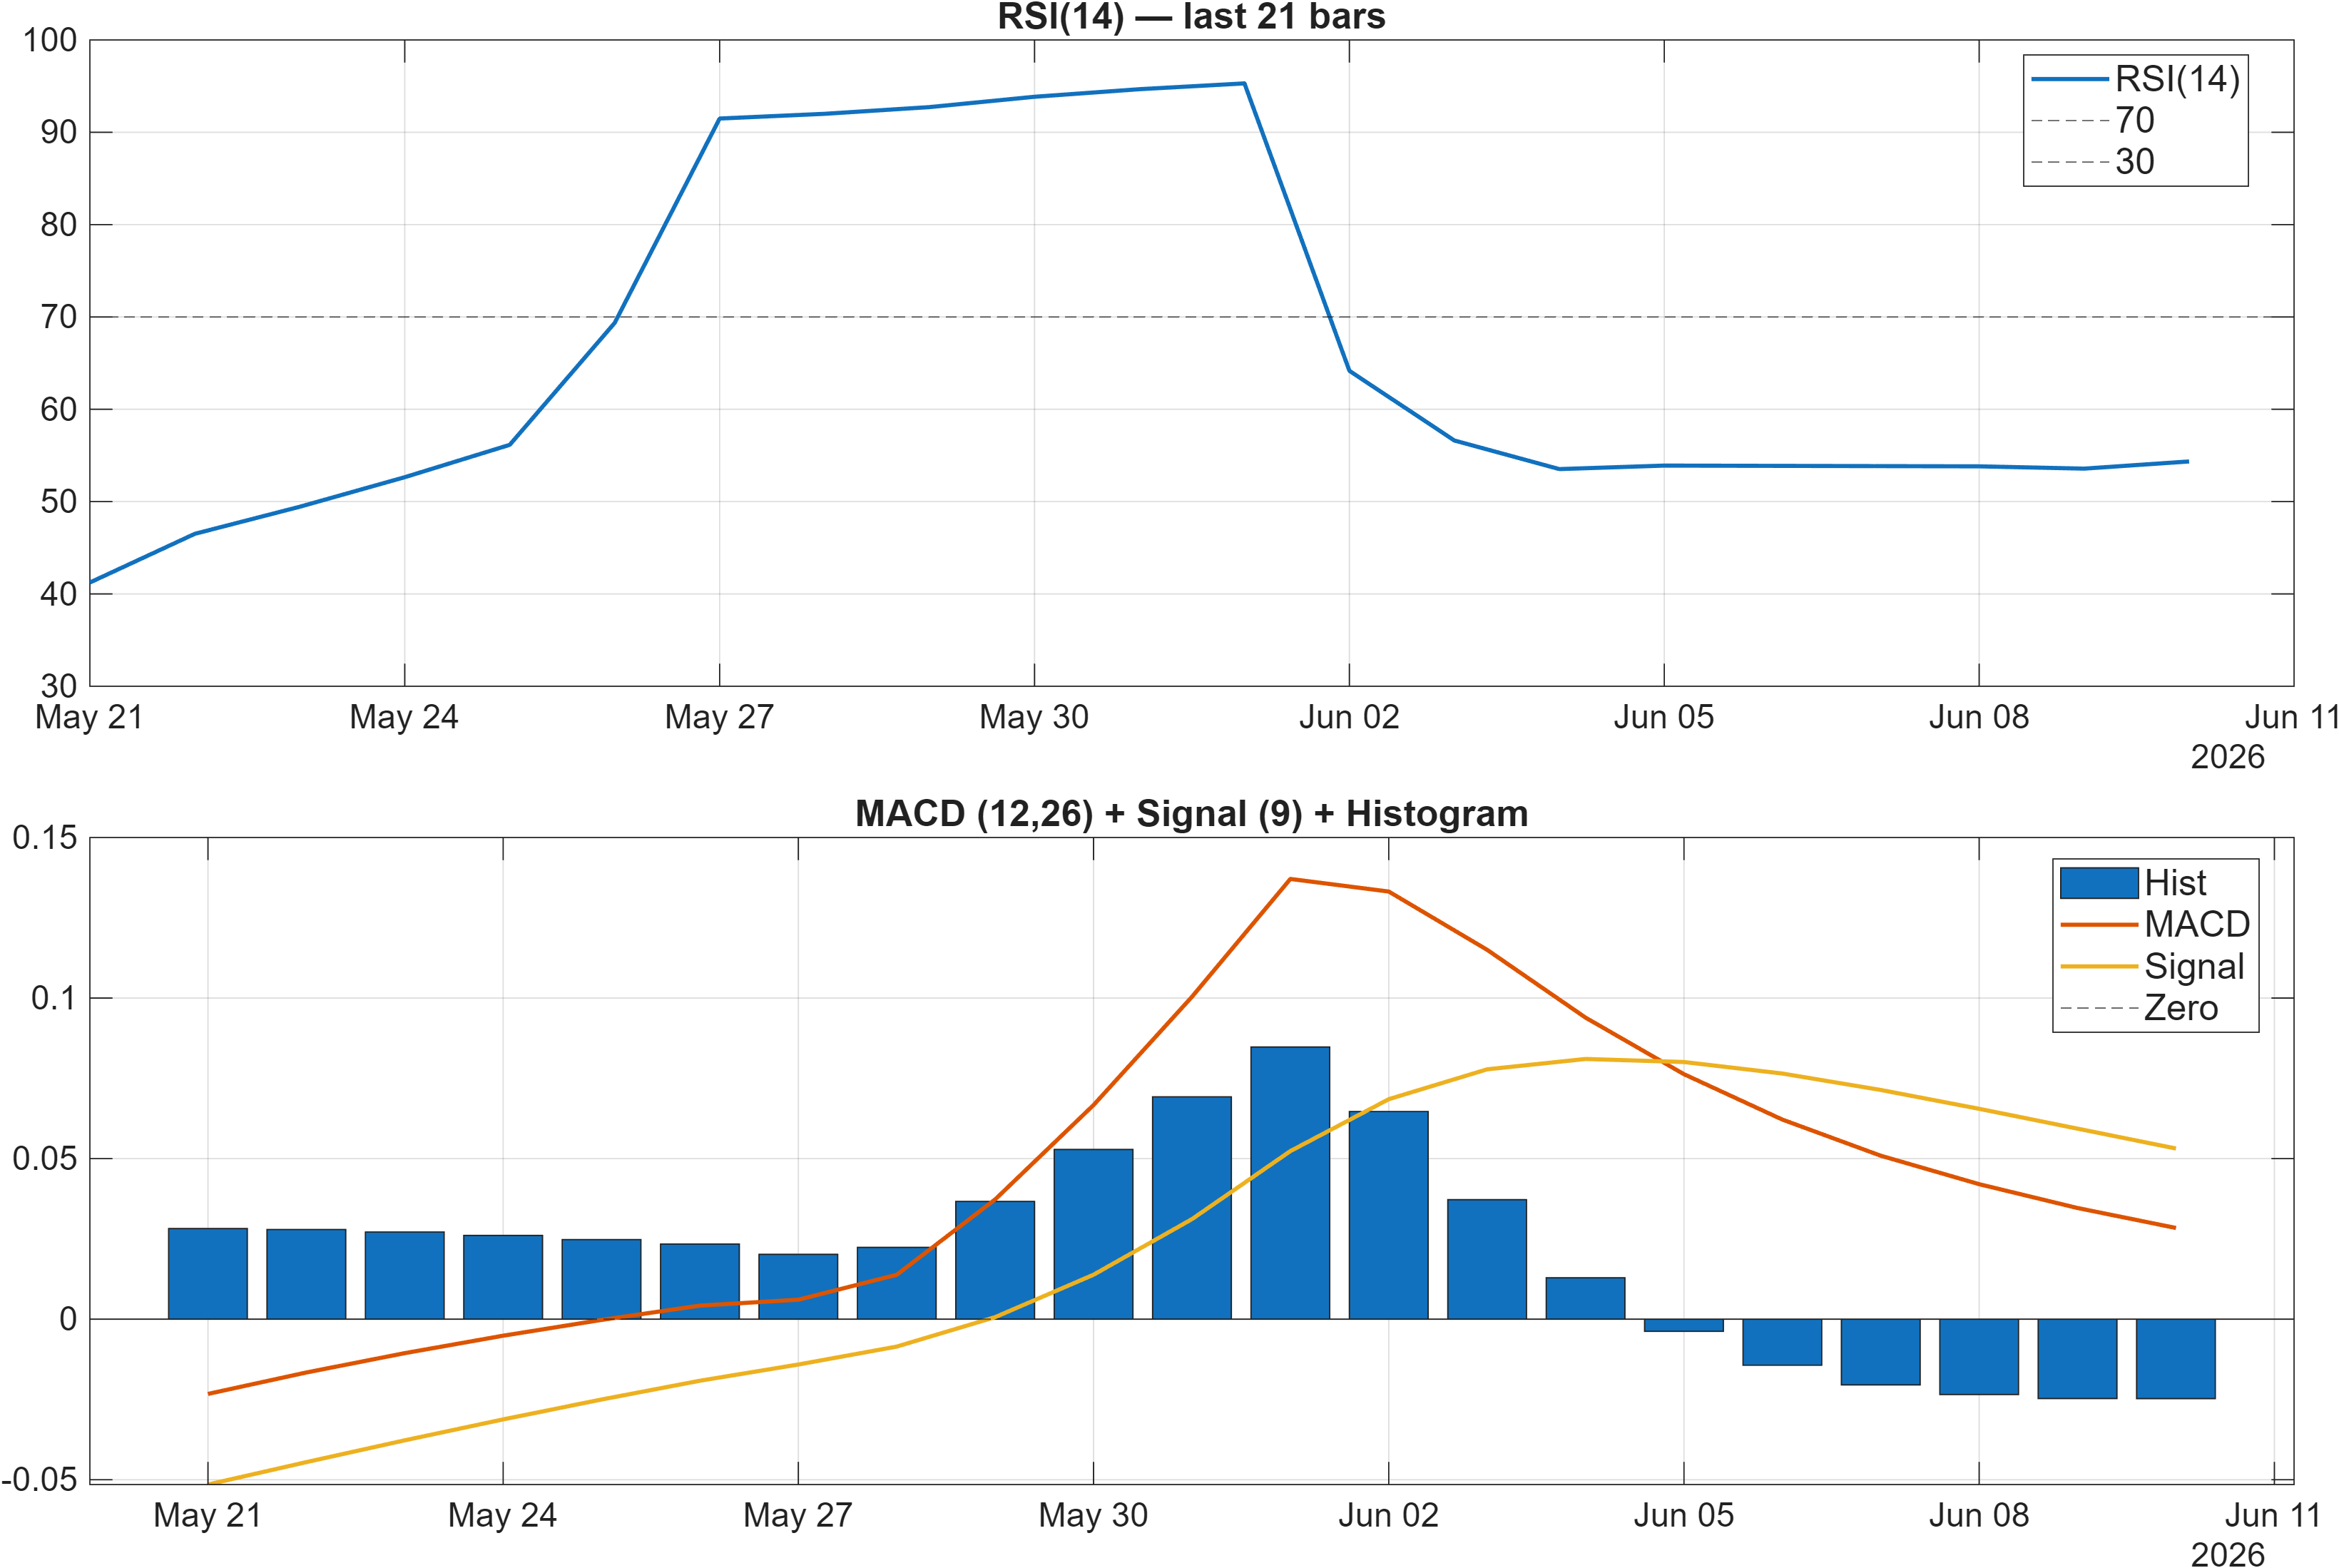
Momentum is showing a controlled, non-extreme profile. The oscillator read is explicitly neutral: RSI bias = Neutral, with RSI(14) at 54.35 (from the signal table), which is consistent with consolidation rather than an overbought/oversold condition. At the same time, the trend-momentum blend remains hesitant: the MACD histogram is -0.0247, a negative reading that often indicates the market has not fully transitioned to positive momentum on a multi-week basis.
This RSI–MACD pairing is a common divergence signature in early stabilization attempts: RSI can drift into neutral as selling pressure eases, while MACD remains negative until the move proves persistent. As a result, momentum “permission” may exist for tactical upside, but the burden of proof sits with follow-through that can turn the MACD histogram sustainably positive.
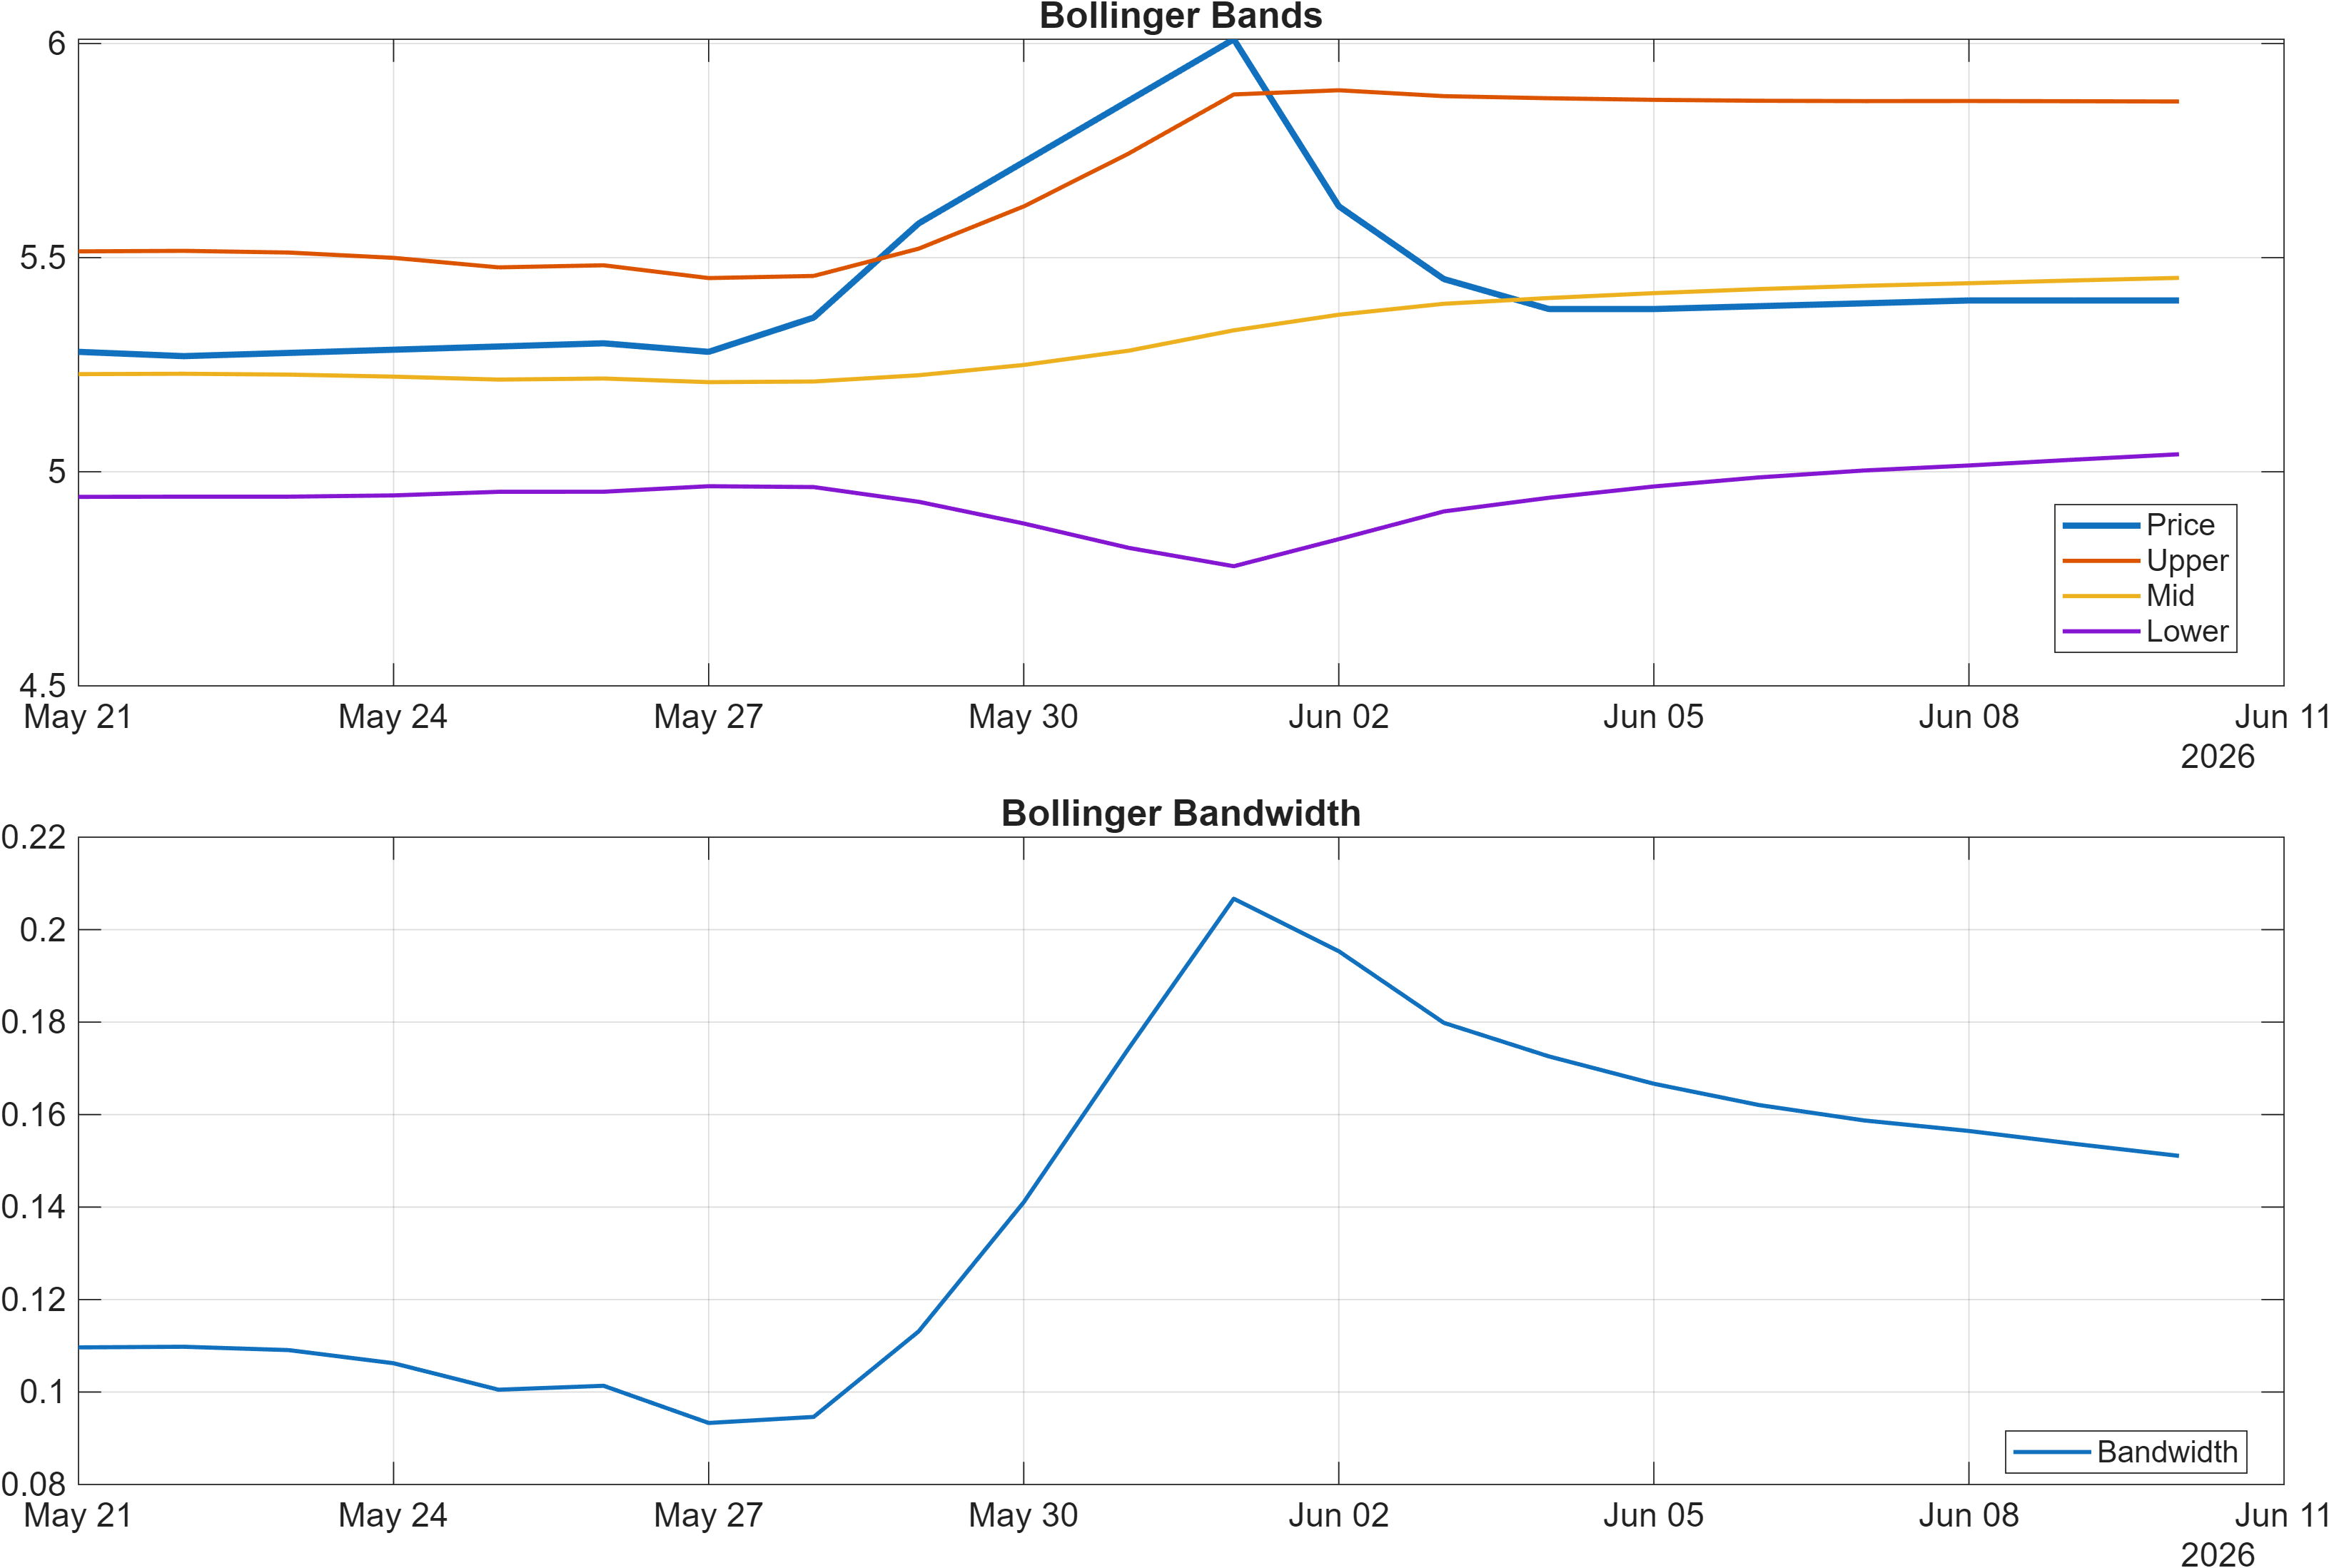
Volatility conditions are also informative. The latest Bollinger Bandwidth is 0.1511, and the dashboard flags the bandwidth regime rather than a directional signal. In practical risk terms, a mid-level bandwidth can support range trading and incremental trend development; sharp expansions in bandwidth often coincide with breakouts or breakdowns, while compressions can precede them.
With ranks still weak on monthly (#2017), a volatility expansion that occurs below resistance can be interpreted as riskier than an expansion that occurs through resistance, because it may reflect downside acceleration rather than constructive breakout behavior.
4) Support / Resistance zones
Support ~ 4.8708 | Resistance ~ 5.6551
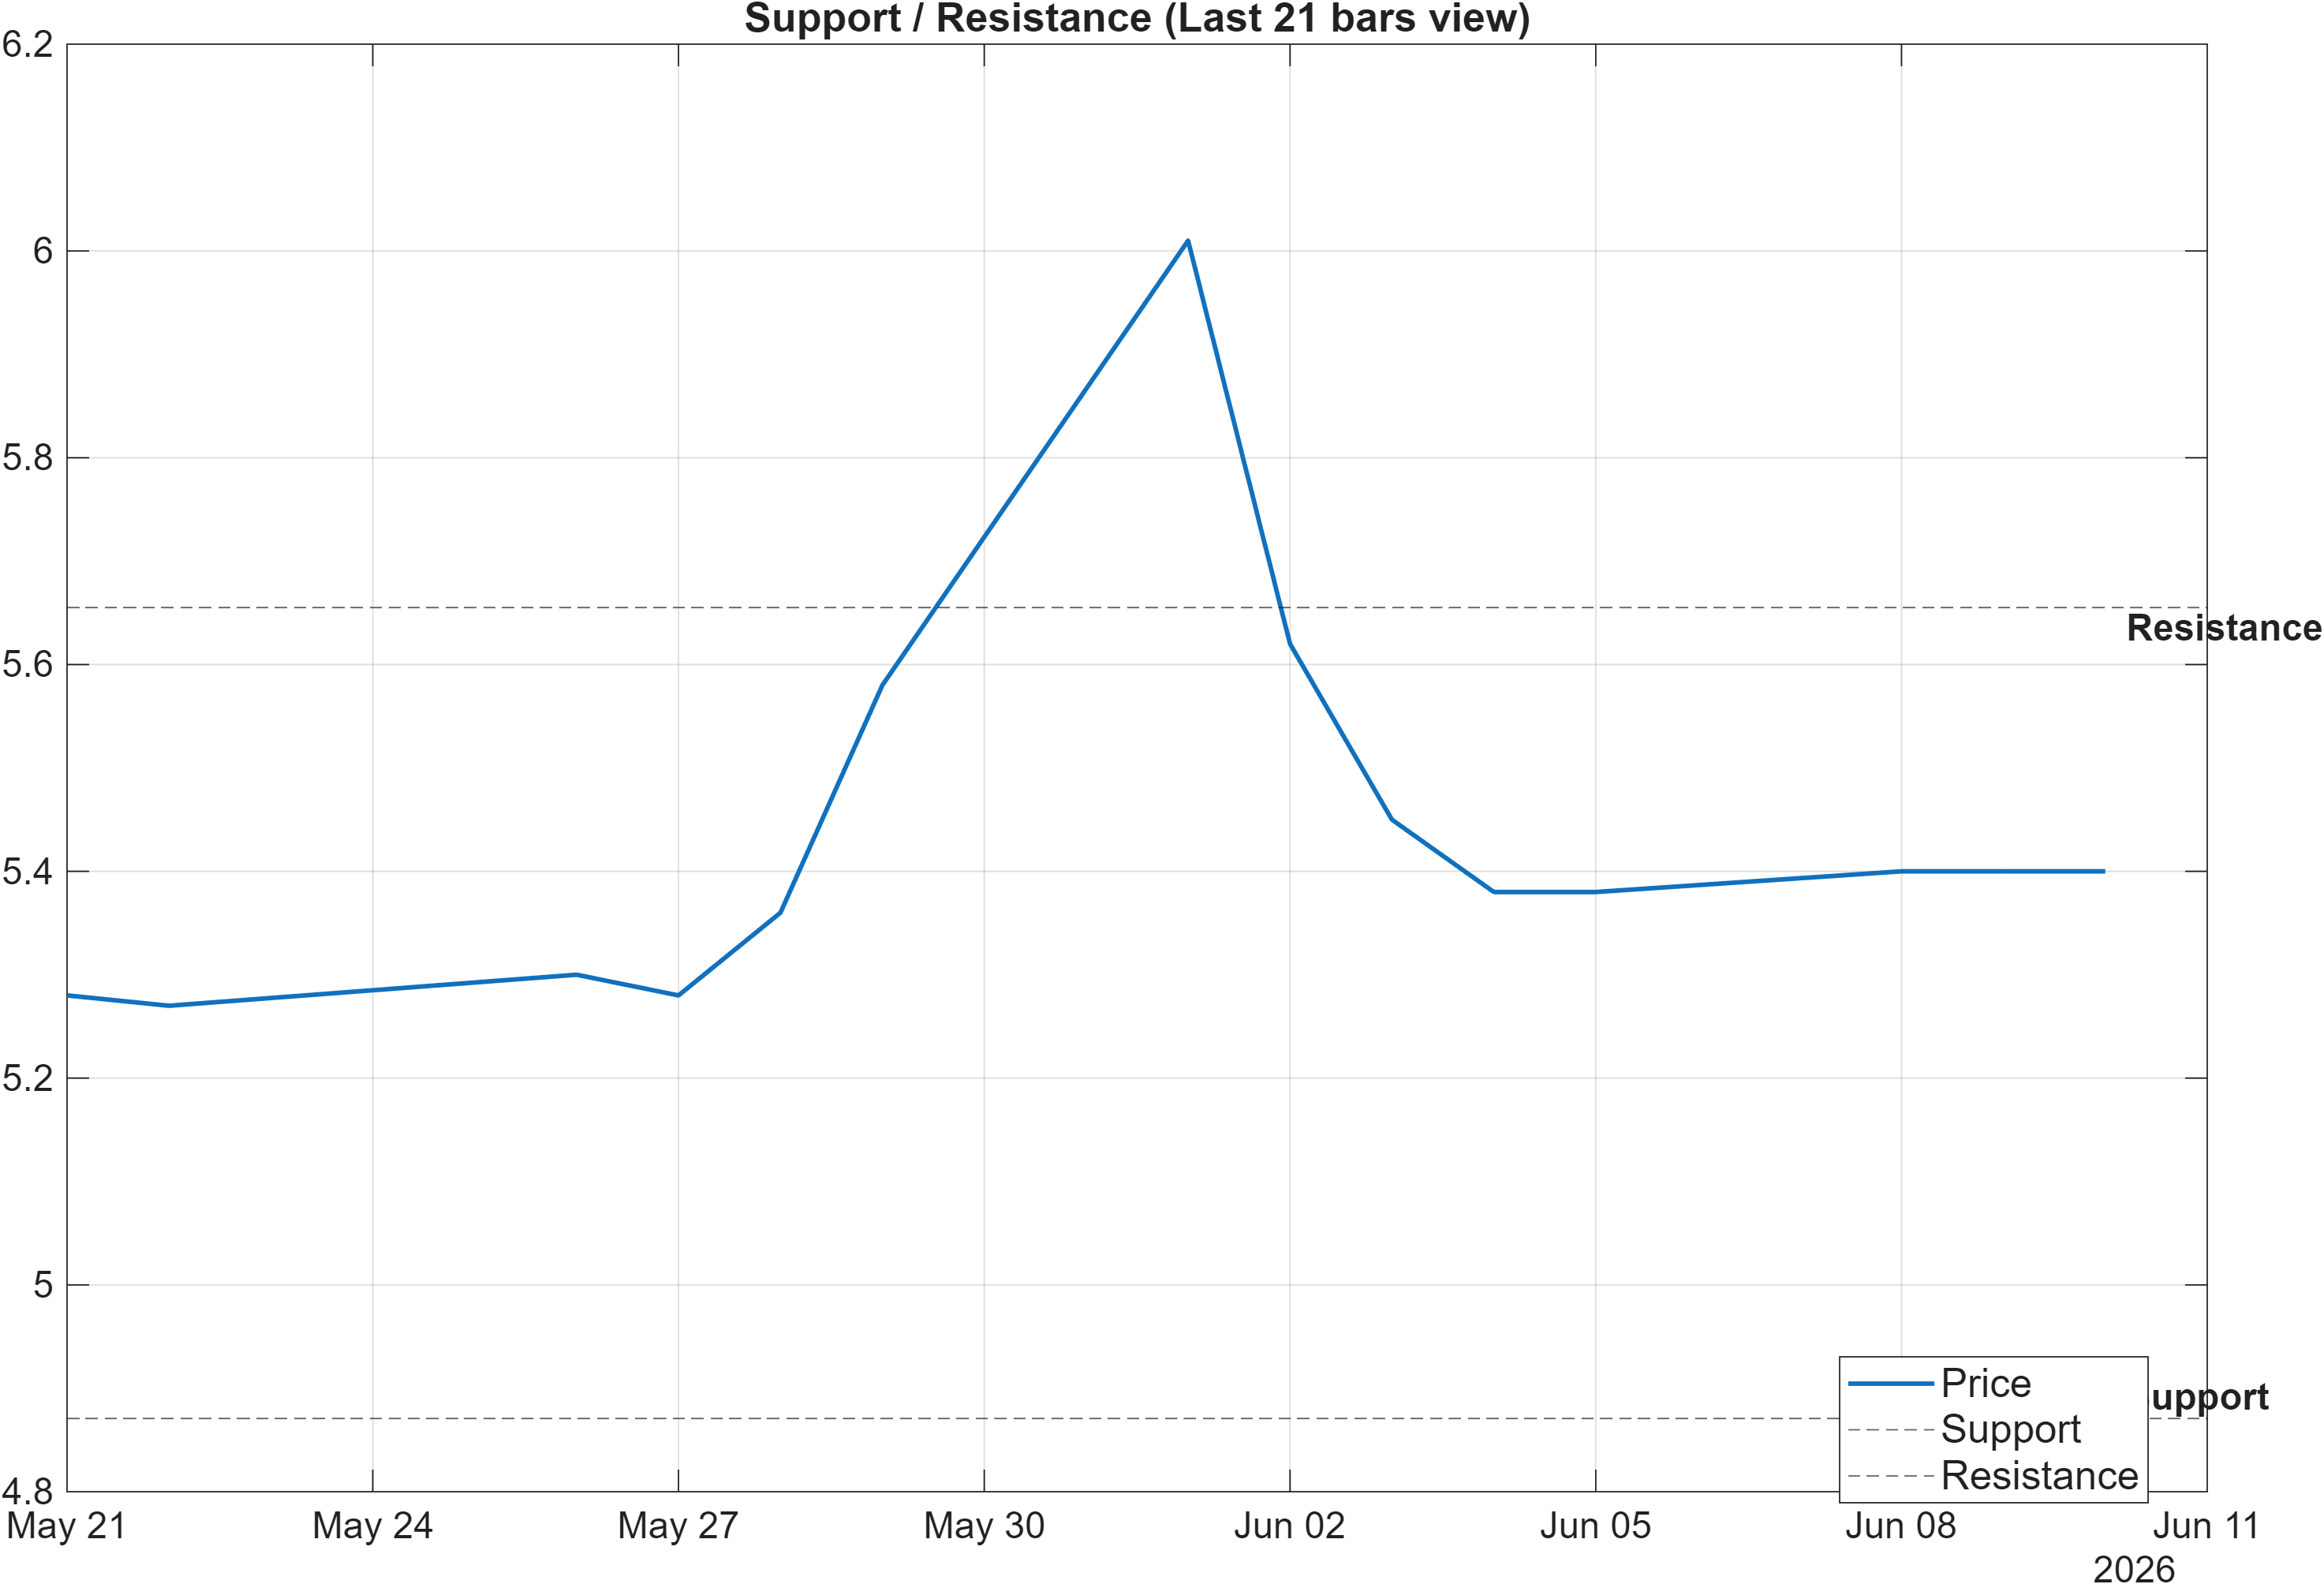
The current setup is unusually “clean” from a market-structure standpoint because the decision zones are tightly specified. 4.8708 represents the key support reference: behavior near and below this level matters more than intraday noise, since a close below support increases the probability of a regime shift toward deterioration. Conversely, 5.6551 is the primary resistance reference: the market must demonstrate acceptance above it to argue for continuation rather than another mean-reversion loop.
Given the bearish moving-average configuration (close below MA50 and MA50 below MA200), resistance has additional weight: it is not only a horizontal level but also typically overlaps with overhead trend supply. In that regime, breakouts that lack volume tend to fail more often than breakouts that show participation. This is consistent with the scenario framing already provided: break above resistance with volume → continuation.
On the other side, the support level interacts with rank weakness on the monthly horizon (#2017). When an instrument is already in the bottom decile monthly, a support failure can quickly translate into continued relative underperformance versus the universe. That does not require a large absolute move; it can simply be weaker “behavior” than peers during normal market fluctuations.
Net: treat 5.6551 as the key confirmation gate for any bullish technical read-through, and 4.8708 as the invalidation boundary for the stabilization thesis.
5) Quant Technical Dashboard (18 Signals)
KGNAI AI Technical Analysis Score (Deep Reinforcement Learning): Rank #845 out of 2046 (Rank 1 represents the strongest technical positioning and a higher probability of favorable price behavior. As ranks increase toward the maximum, the probability of favorable outcomes weakens and bearish positioning becomes more dominant.) | Label: Neutral | Score: 0.174
18-Signal Technical Confluence Score: 0.444 (Bullish)
Overall Technical Score (18-signal confluence + DRL rank blend): 0.363 (Bullish)
Note: The blended score reflects signal strength weighted against broader AI technical ranking, which may temporarily diverge.
Blended technical score breakdown: 0.363 (Bullish | Bull 10 / Bear 2 / Neutral 6)
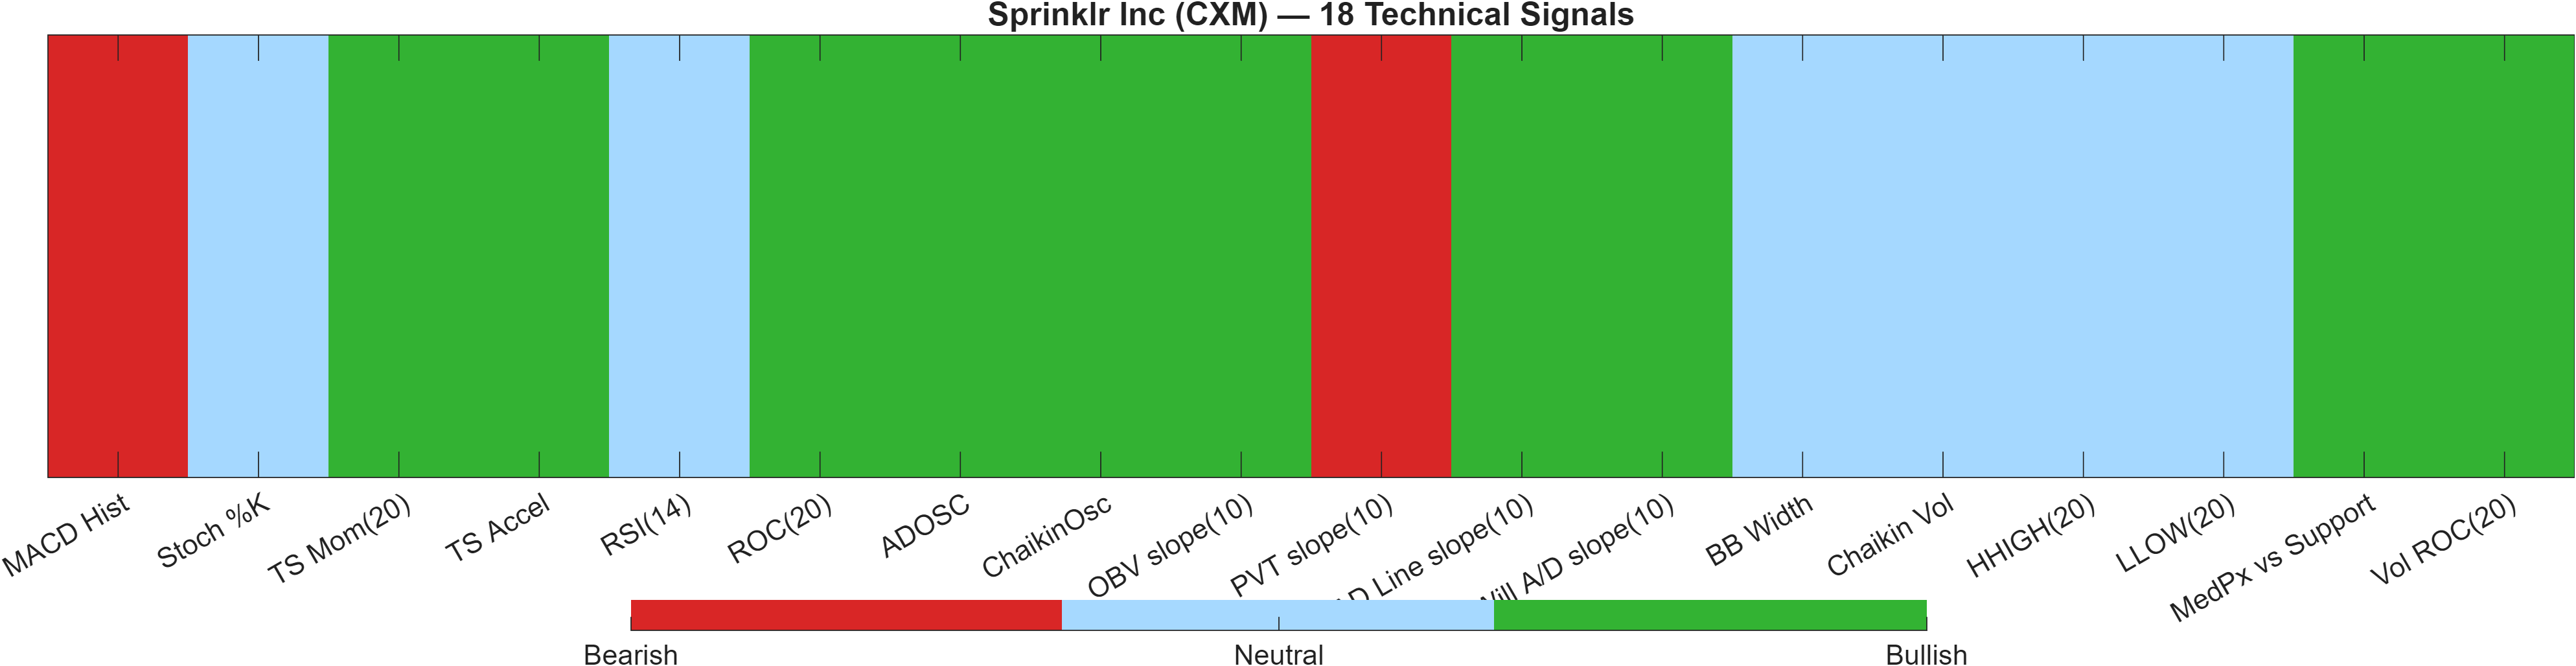
The technical dashboard is where the report’s key divergence emerges. The deep reinforcement learning (DRL) technical rank is #845 out of 2046 with a Neutral label (score 0.174), placing CXM around the upper half of the universe for this specific AI technical lens. Meanwhile, the independent 18-signal layer is Bullish with a confluence score of 0.444, and the blended overall technical score remains Bullish at 0.363.
Interpreting the blend: the confluence score indicates that multiple classical signals are leaning in the same direction (Bull 10 / Bear 2 / Neutral 6), but the DRL rank tempers conviction, consistent with a market that may be improving tactically without fully earning high-quality trend credentials. This is also consistent with momentum readings: RSI(14) is neutral at 54.35, while MACD histogram remains bearish at -0.02474—a combination that often appears during transition phases rather than established uptrends.
The signal mix points to a “participation vs trend” question. Several volume/accumulation proxies are constructive (e.g., ADOSC and OBV slope are bullish in the table), while a key momentum-trend proxy (MACD histogram) remains negative. When participation improves ahead of trend, the next test tends to be whether price can convert that participation into a resistance break (here, 5.6551) without immediately reverting.
Signal table (Bull/Bear/Neutral)
| Indicator | Value | Signal |
|---|---|---|
| MACD Hist | -0.02474 | Bearish |
| Stoch %K | 36.92 | Neutral |
| TS Mom(20) | 0.13 | Bullish |
| TS Accel | 0.1767 | Bullish |
| RSI(14) | 54.35 | Neutral |
| ROC(20) | 2.467 | Bullish |
| ADOSC | 65.91 | Bullish |
| ChaikinOsc | 4.3e+06 | Bullish |
| OBV slope(10) | 2.874e+06 | Bullish |
| PVT slope(10) | -3.083e+05 | Bearish |
| AD Line slope(10) | 1.316e+07 | Bullish |
| Will A/D slope(10) | 0.11 | Bullish |
| BB Width | 0.1511 | Neutral |
| Chaikin Vol | -5.788 | Neutral |
| HHIGH(20) | 6.015 | Neutral |
| LLOW(20) | 5.04 | Neutral |
| MedPx vs Support | 0.4992 | Bullish |
| Vol ROC(20) | 28.4 | Bullish |
Interpretation: Indicator-level signals form the base confluence, which is then adjusted using a separate AI-driven technical ranking model. The final technical score summarizes this combined view.
6) News sentiment + extractive gist
Sentiment score (avg): 0.094 | Positive: 32% | Neutral: 68% | Negative: 0%
KGNAI AI News Sentiment Score (normalized -1 to +1): 1.00 (as of 2026-06-08) | Label: Bullish | Overall news score: 0.98
Positive Developments
Recent coverage across major financial outlets indicates a generally constructive narrative around Sprinklr’s operating cadence and product positioning, with emphasis on AI-related initiatives and updates. The sentiment mix shows 32% positive and 0% negative items in the provided digest, which is consistent with a low-friction news backdrop. Importantly, KGNAI’s normalized news sentiment score registers at 1.00 (as of 2026-06-08), implying that—within the model’s parsing and normalization—language tone and contextual framing have skewed decisively favorable. For market structure, this can matter most when price is near decision levels: supportive narrative flow can help sustain participation on tests of resistance (5.6551), especially when technical confluence is already bullish (18-signal score 0.444). The practical read is not that news “drives” price, but that the absence of negative catalysts can reduce headline-induced volatility around key levels.
Neutral / Mixed Developments
The dominant share of items is still neutral (68%), suggesting much of the information stream is interpretive rather than catalytic. In these regimes, price often responds more to positioning and liquidity than to incremental headlines. That nuance fits the report’s broader split: ranks remain weak on the monthly horizon (#2017) while oscillators are not stretched (RSI(14) 54.35). Mixed news flow can therefore act as “background noise” where technical levels do more explanatory work than narrative. If the market is in a basing attempt, neutral news tends to keep focus on whether follow-through develops (e.g., improving MACD from -0.0247) rather than on one-off announcements. In short, the information environment looks stable, but it does not, by itself, resolve the rank-versus-confluence divergence.
Negative / Risk Signals
The digest shows 0% negative items, but risk cannot be inferred away: neutral-dominant coverage can still coincide with drawdowns if technical structure fails. With the moving-average state bearish (close vs MA50 bearish; MA50 vs MA200 bearish), the primary risk signal is structural rather than narrative—namely, that rallies can be sold into until proven otherwise. A second risk is the potential for sentiment to be directionally optimistic while price behavior remains fragile: the normalized news score (1.00) contrasts with weak cross-sectional ranks (daily #1675, monthly #2017). When sentiment is positive but relative strength is poor, markets sometimes reprice abruptly if execution does not match optimism. As a result, the key “risk lens” is to watch whether constructive headlines translate into acceptance above 5.6551; if not, the path of least resistance can revert toward the 4.8708 support zone.
- Whether price can hold above 5.6551 after any breakout attempt, rather than immediately reverting.
- Whether momentum repairs with MACD histogram improving from -0.0247 while RSI remains constructive.
- Whether support at 4.8708 holds on any volatility expansion (bandwidth 0.1511 as current regime reference).
Sources referenced: Reuters, Bloomberg, Yahoo Finance, MarketWatch, Investing.com
7) Sources
- Sprinklr Introduces LLM Insights to Help Brands Understand and Influence How They’re Represented in AI-Generated Answers — https://finance.yahoo.com/sectors/technology/articles/sprinklr-introduces-llm-insights-help-120000700.html?.tsrc=rss
- Wall Street Analysts Predict a 46.47% Upside in Sprinklr (CXM): Here's What You Should Know — https://finance.yahoo.com/markets/stocks/articles/wall-street-analysts-predict-46-135501598.html?.tsrc=rss
- Sprinklr (CXM) Reports Q1 EPS — https://finance.yahoo.com/markets/stocks/articles/sprinklr-cxm-reports-q1-eps-050801195.html?.tsrc=rss
- Sprinklr (CXM) Reports Q1 Earnings: What Key Metrics Have to Say — https://finance.yahoo.com/markets/stocks/articles/sprinklr-cxm-reports-q1-earnings-220003699.html?.tsrc=rss
- Sprinklr (CXM) Q1 2027 Earnings Transcript — https://www.fool.com/earnings/call-transcripts/2026/06/04/sprinklr-cxm-q1-2027-earnings-transcript/?.tsrc=rss
- Sprinklr (CXM) Q4 2026 Earnings Transcript — https://www.fool.com/earnings/call-transcripts/2026/06/04/sprinklr-cxm-q4-2026-earnings-transcript/?.tsrc=rss
- Sprinklr Inc (CXM) Q1 2027 Earnings Call Highlights: Revenue Growth and AI Expansion Amid ... — https://finance.yahoo.com/markets/stocks/articles/sprinklr-inc-cxm-q1-2027-210058054.html?.tsrc=rss
- Sprinklr Q1 Earnings Call Highlights — https://www.marketbeat.com/instant-alerts/sprinklr-q1-earnings-call-highlights-2026-06-03/?utm_source=yahoofinance&utm_medium=yahoofinance&.tsrc=rss
You may also like: How KGNAI AI ranks instruments across global markets
Disclaimer: KGNAI provides AI-generated analytics and educational market commentary only. This is not financial advice. Markets involve risk. Always do your own research.