CSGP (CoStar Group Inc) — 07-Jun-2026 Technical & Rank Read: Bullish Longer-Horizon Structure, Neutral Near-Term Tone
AI-Based Technical, Rank & Sentiment Analysis | As of: 07-Jun-2026 | Ticker: CSGP
CoStar Group Inc (CSGP) shows a notably constructive multi-horizon setup where longer-term ranking strength and broad technical confluence remain supportive, while the very short-term rank and mixed moving-average framing add a layer of timing risk. Across KGNAI’s 2044-instrument U.S. universe, CSGP is positioned strongly on longer windows (including a 6-month rank of #2), yet the daily rank of #851 keeps near-term conditions in a more neutral bucket. Technically, the 18-signal confluence score of 0.722 and the overall technical score of 0.758 indicate broad agreement among momentum, trend, and participation inputs. Volatility is also relatively contained (Bollinger Bandwidth 0.0753), which often shifts emphasis toward key decision levels: support ~31.9400 and resistance ~39.9700. News tone is modestly constructive by distribution (33% positive, 4% negative) with a high normalized sentiment reading (1.00), but the actionable focus remains whether price confirms above resistance or weakens back through support.
- Rank stance: Short-term Neutral | Mid-term Bullish | Long-term Bullish (notably 6-month #2).
- Technical confluence: Bullish (overall technical score 0.758; Bull/Bear/Neutral = 14/1/3).
- Key levels: Support ~31.9400 | Resistance ~39.9700.
- News sentiment bias: Bullish by normalized score (1.00), with the distribution still mostly Neutral (63%).
- Confirmation / invalidation: A sustained push above 39.9700 with participation supports continuation; a close below 31.9400 increases deterioration risk.
KGNAI evaluates assets using large cross-sectional datasets built from millions of structured data points. Inputs incorporate fundamental metrics, technical structures, and systematically processed news sentiment. Statistical models, machine learning, and AI frameworks are used to assess relative positioning, signal alignment, and probabilistic behavior across broad universes.
- Ranks are comparative across the tracked universe, not absolute price targets.
- Confluence reflects alignment among independent signal groups.
- Support/resistance levels are probabilistic decision zones, not guarantees.
- Sentiment provides contextual bias within the broader analytical framework.
1) KGNAI AI Analysis
Region: USA
Total universe size: 2044 ranked instruments
- Daily rank: #851 out of 2044 — Neutral
- Weekly rank: #243 out of 2044 — Bullish
- Monthly rank: #190 out of 2044 — Bullish
- 3-Monthly rank: #21 out of 2044 — Bullish
- 6-Monthly rank: #2 out of 2044 — Bullish
- Yearly rank: #45 out of 2044 — Bullish
The rank stack for CSGP is best read as a horizon divergence: the short window is neutral while the intermediate and longer windows cluster in the upper tier of the universe. The daily rank (#851) sits in the middle of the distribution, which typically reflects noisier price behavior and a weaker statistical edge for immediate follow-through. In contrast, the weekly (#243) and monthly (#190) ranks shift CSGP into a more constructive relative positioning, consistent with a market that is willing to re-rate the instrument over several weeks rather than several sessions.
The most distinctive feature is the 3-month rank (#21) and especially the 6-month rank (#2), placing CSGP near the very top of the tracked universe on those horizons. When this type of longer-horizon strength persists alongside only a neutral daily read, it often implies that pullbacks and consolidations are being absorbed without invalidating the broader structure—an “uptrend with timing friction” rather than a clean, linear advance.
The yearly rank (#45) adds an additional layer of confirmation that strength is not limited to a single window. Netting the term view given—Short-term Neutral, Mid-term Bullish, Long-term Bullish—the analytical posture is to treat near-term weakness as a regime test, while recognizing that the cross-sectional evidence remains skewed toward constructive longer-horizon behavior.
KGNAI ranks each instrument across large universes using multiple proprietary AI tests and statistical models (millions of data points). Lower ranks generally indicate stronger probability of favorable performance behavior, while higher ranks indicate weaker probability and more bearish positioning.
Term view: Short-term: Neutral. Mid-term: Bullish. Long-term: Bullish.
Want the full universe and complete rank tables? Unlock full access on KGNAI: https://www.kgnai.com/pricing
2) Price & trend overview
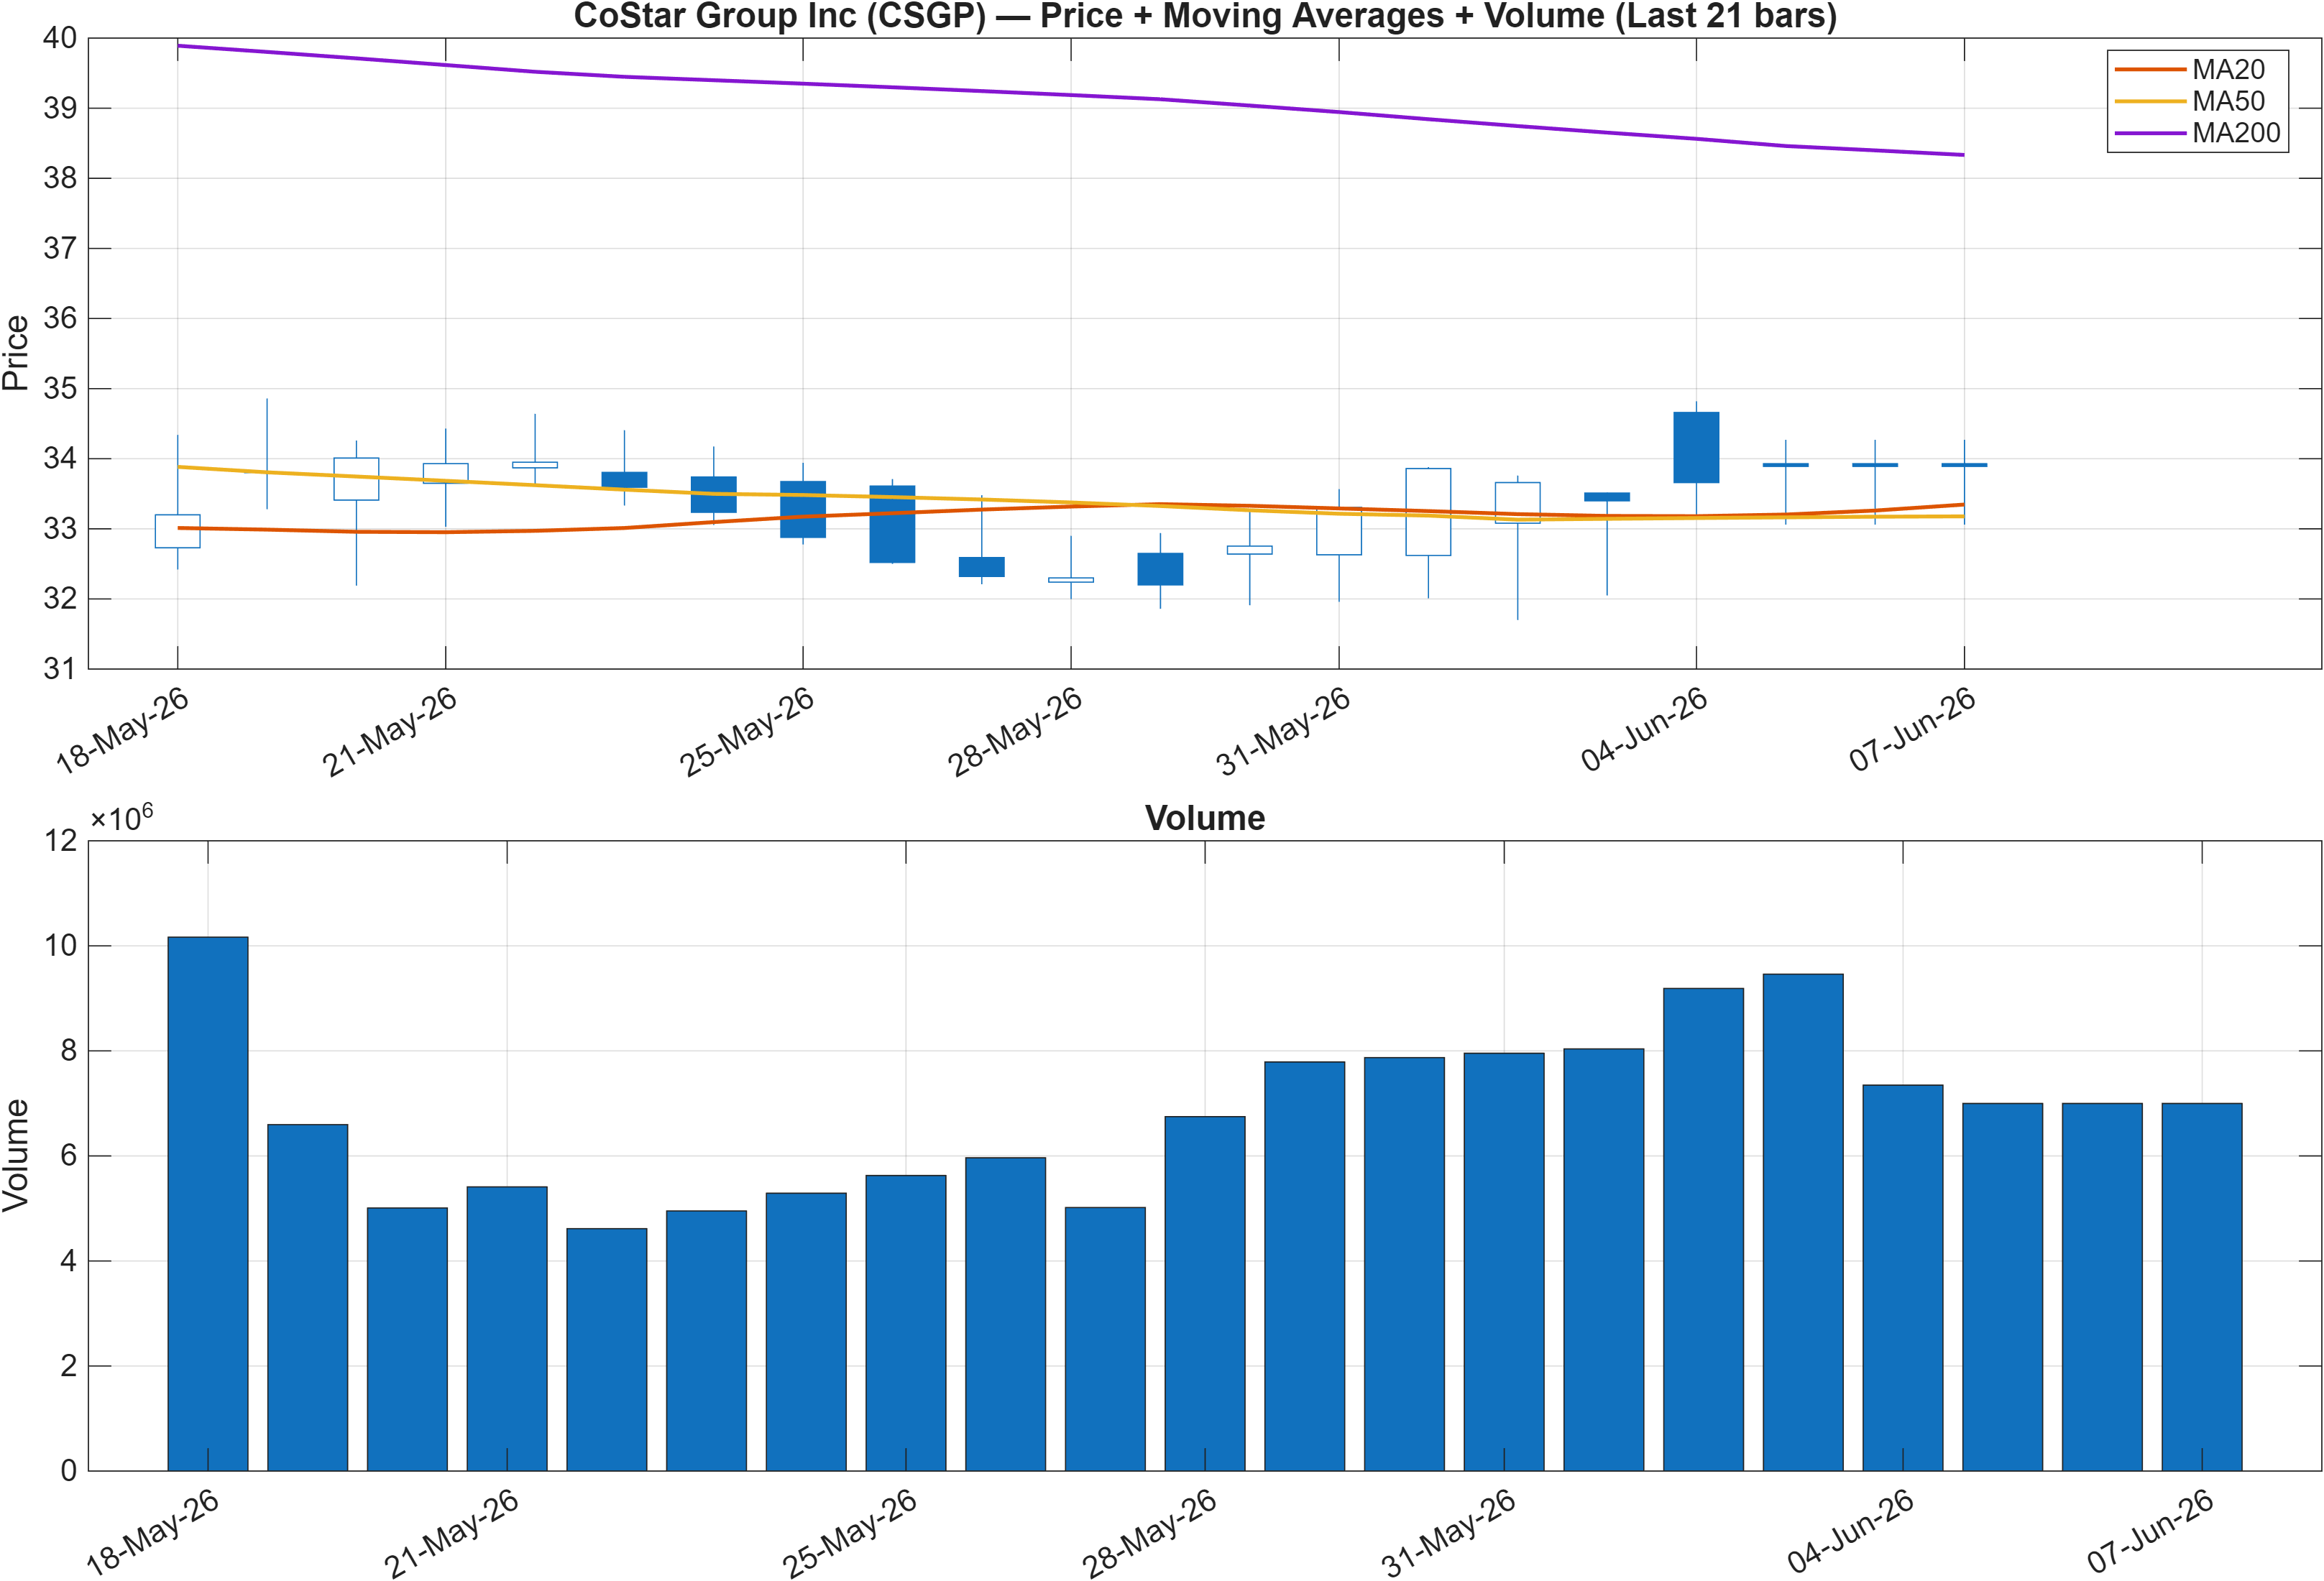
Trend framing is currently split: the close relative to the MA50 is Bullish, while the MA50 vs MA200 is Bearish. This combination typically indicates price has improved enough to reclaim a medium-term reference, but the longer-term trend filter has not fully turned. In practice, that often produces “two-speed” market behavior—shorter swings can extend higher, while the broader tape still contains overhead supply and requires repeated confirmations.
This is where the ranking profile adds context. With a weekly rank of #243 and a monthly rank of #190 (both bullish), the medium-horizon market structure appears to be improving even as the MA50/MA200 relationship remains lagging. That lag is not unusual: longer moving averages update slowly, and they can remain bearish while the instrument re-accumulates. The key risk is that a failed push higher can quickly pull price back into a more range-bound condition, aligning with the daily rank of #851 (neutral) that flags less reliable immediate continuation.
Volume is the crucial validator in this regime because it helps distinguish a durable trend repair from a transient bounce. Later in the report, volume-flow and participation signals are predominantly supportive (for example, OBV slope(10) is bullish in the signal set), which is consistent with improving demand under the surface. Still, the trend filter conflict argues for respecting decision points rather than assuming persistence.
From a structure standpoint, the most analytically consistent stance is to treat the current configuration as a transition state: improvement is visible in medium-term behavior (MA50 reclaim and bullish mid-term ranks), while the longer trend filter (MA50 vs MA200) remains a constraint that can slow momentum and increase whipsaw risk around key levels.
Interpretation: Close vs MA50 = Bullish, MA50 vs MA200 = Bearish.
3) Momentum & volatility dashboard
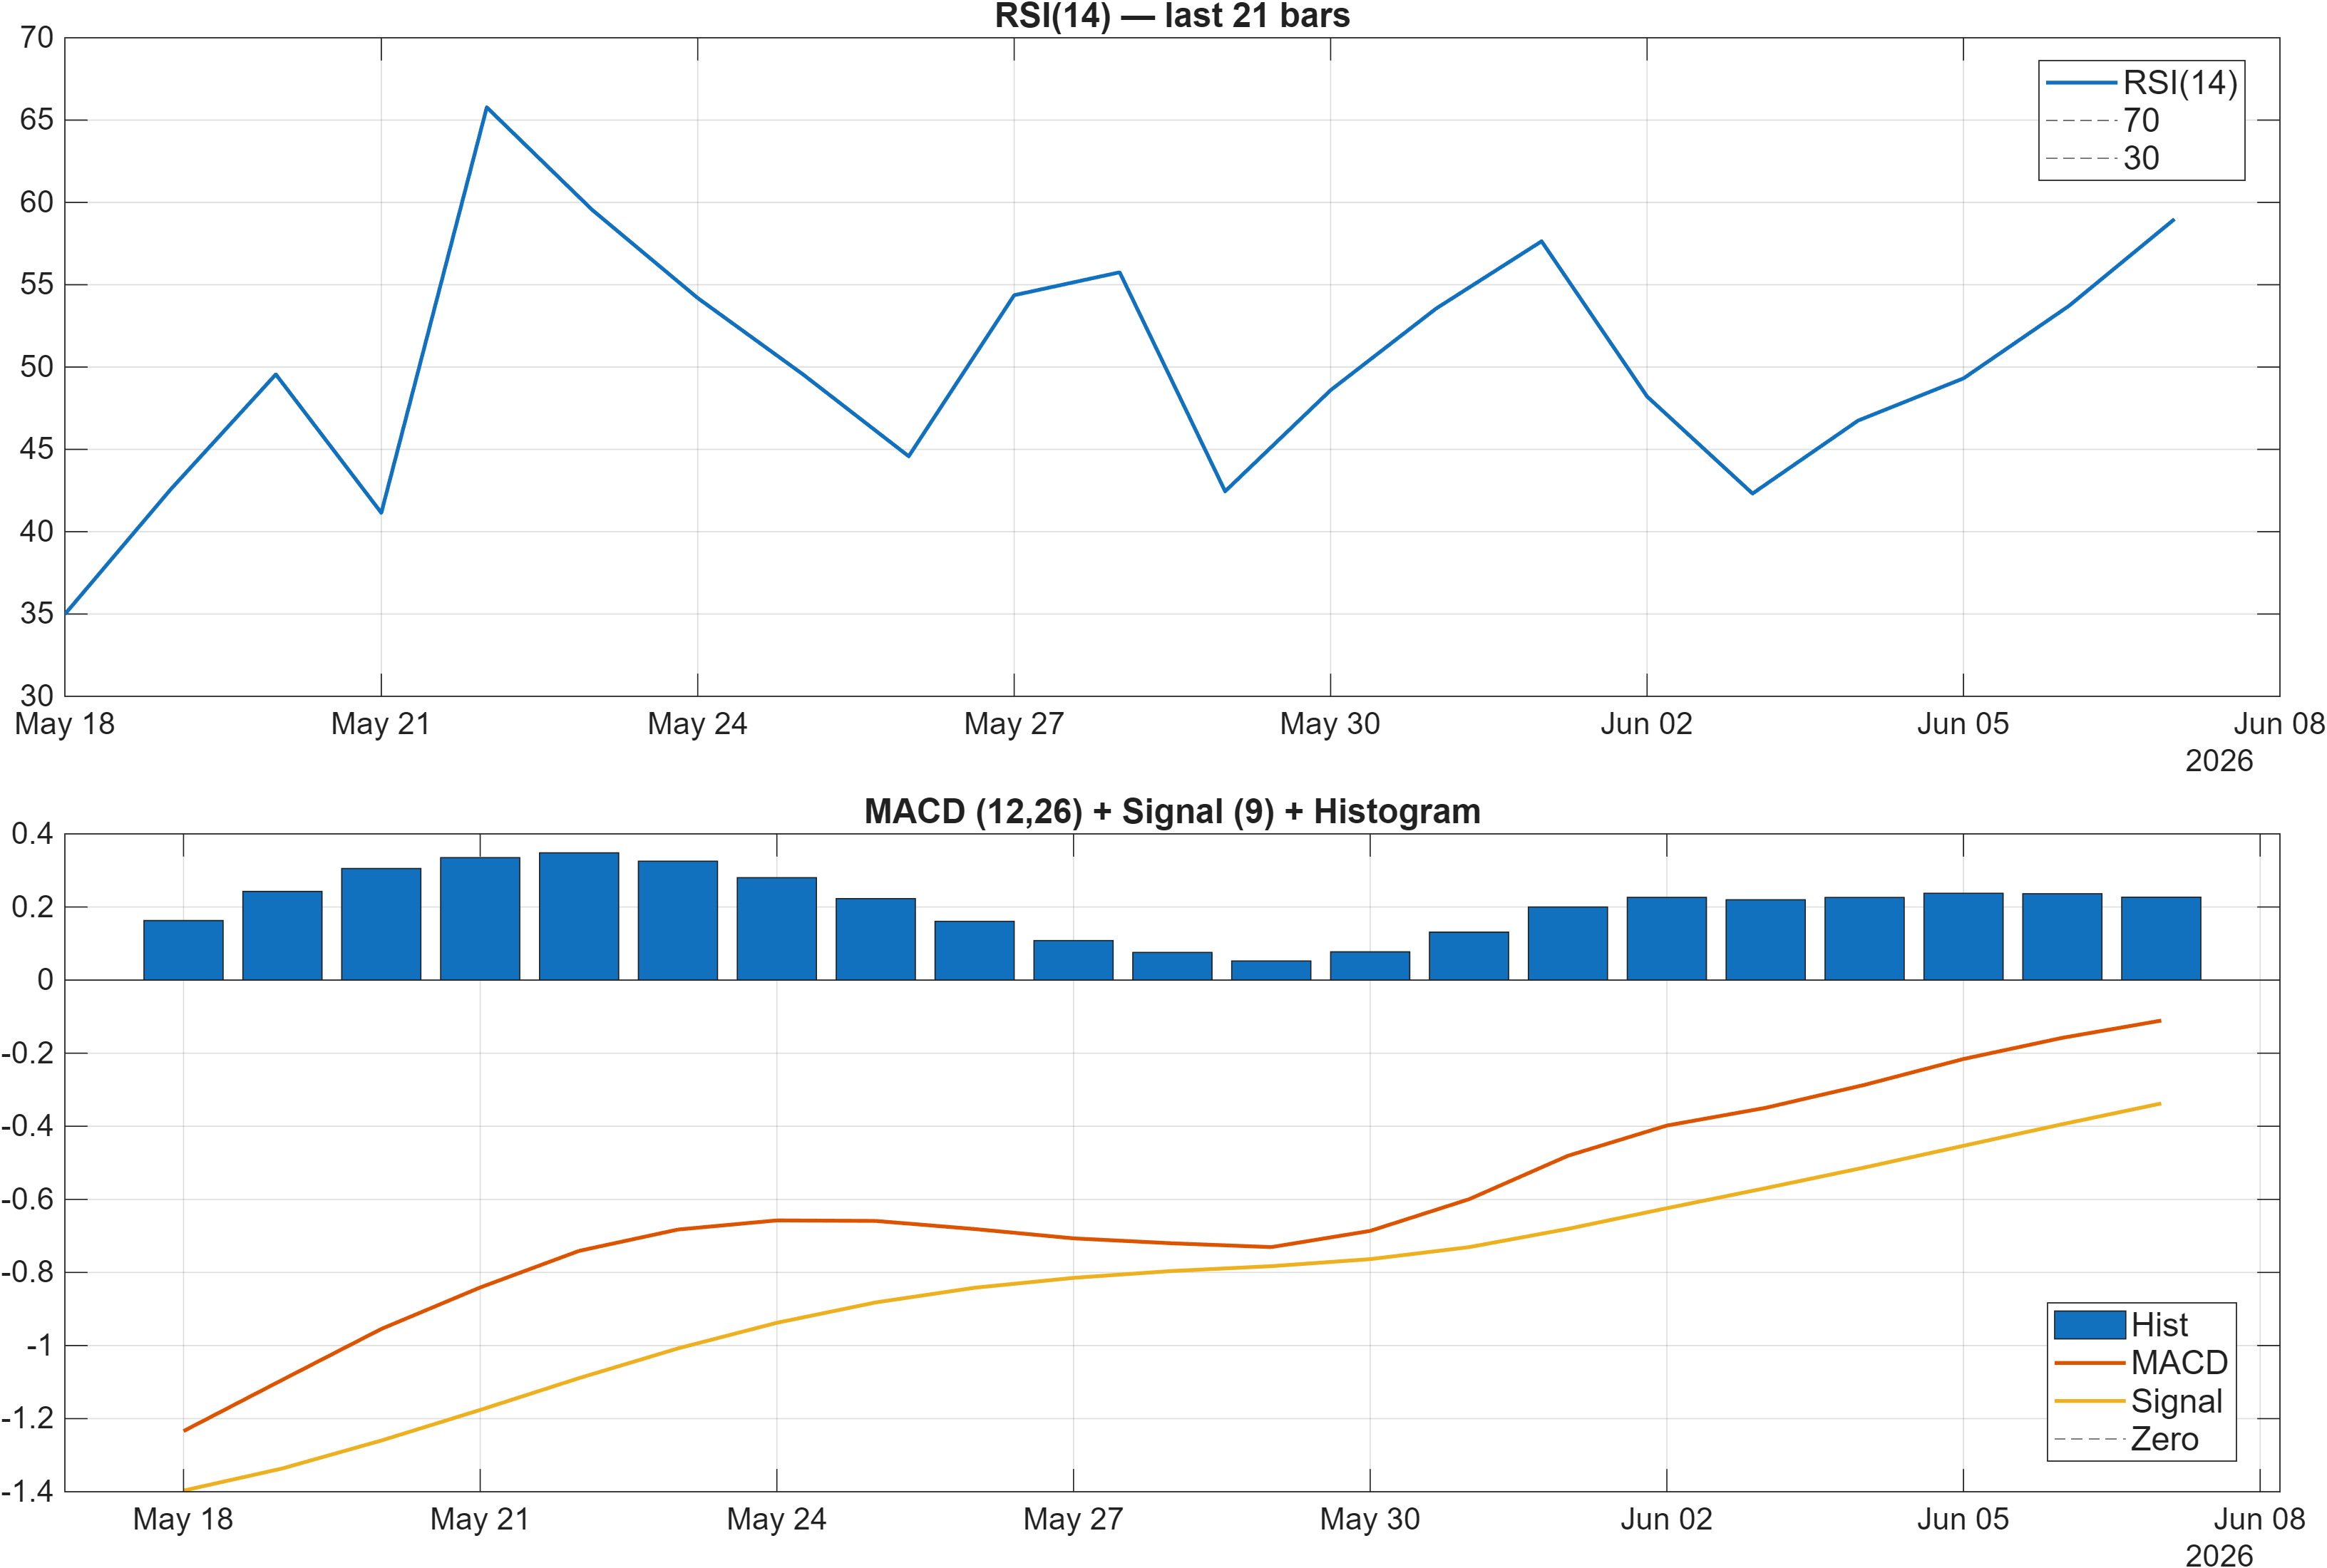
Momentum is skewed constructive but not euphoric. The MACD histogram at 0.2268 supports a positive momentum bias—often consistent with trend continuation attempts—yet the stated RSI bias is Neutral, which argues against reading the move as an already-extended momentum burst. The signal table reinforces that nuance: RSI(14) is 58.98 and marked bullish, while Stoch %K at 70.19 is neutral, a common configuration when upside momentum exists but is not accelerating into an “overheated” condition.
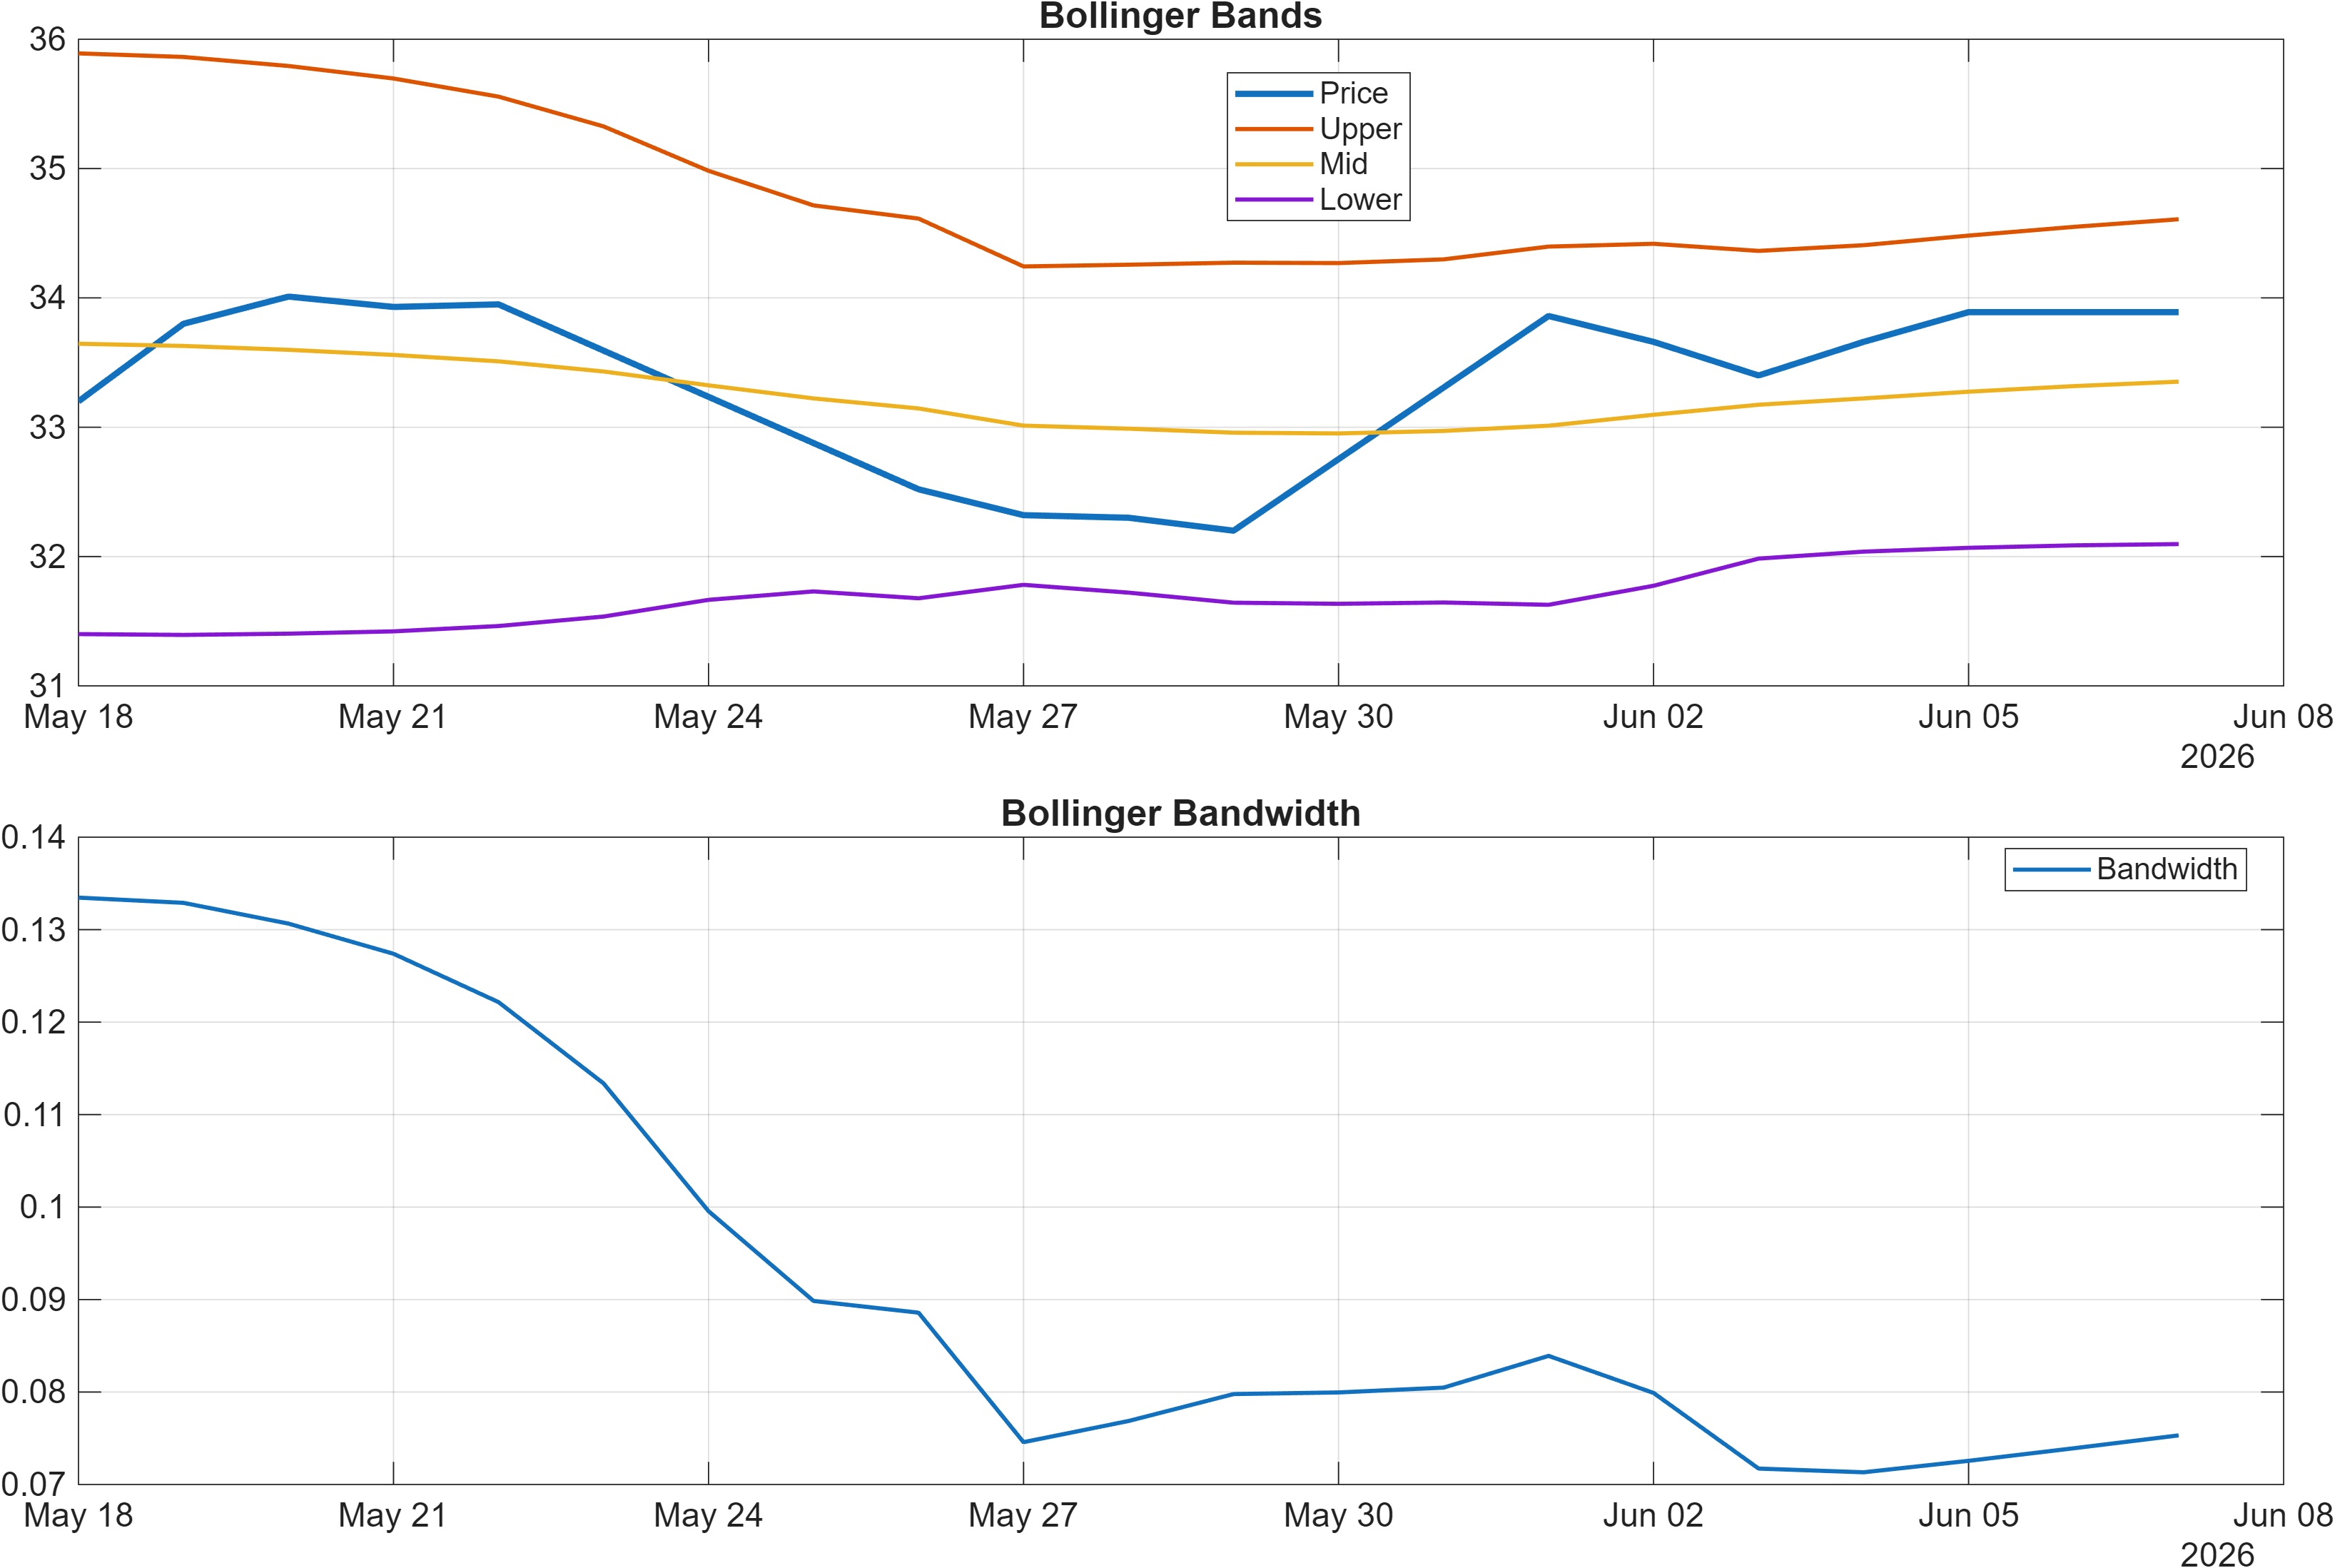
Volatility regime is comparatively contained with Bandwidth at 0.0753 (and BB Width 0.07531 flagged bullish in the dashboard). Low-to-moderate bandwidth frequently coincides with compression phases where breakouts can be more sensitive to confirmation (particularly volume), and false breaks can be more frequent if participation is inconsistent. In this environment, momentum signals like MACD can remain positive for extended periods without producing rapid price expansion.
Participation-linked momentum adds a stabilizing counterweight. The dashboard shows multiple accumulation-style measures in bullish territory, including ADOSC 48.35 and a bullish Vol ROC(20) at 6.097. When volatility is compressed, improving volume/flow readings can matter more than oscillators alone, because they can foreshadow whether a price move is gaining sponsorship.
Netting these components: momentum is constructive (MACD positive; RSI supportive) while volatility remains contained (Bandwidth 0.0753). That combination typically shifts emphasis toward level-based confirmation—price must prove it can extend beyond nearby resistance rather than relying on oscillator strength alone.
Interpretation: RSI bias = Neutral, MACD hist = 0.2268.
Interpretation: Bandwidth (volatility regime) latest = 0.0753.
4) Support / Resistance zones
Support ~ 31.9400 | Resistance ~ 39.9700
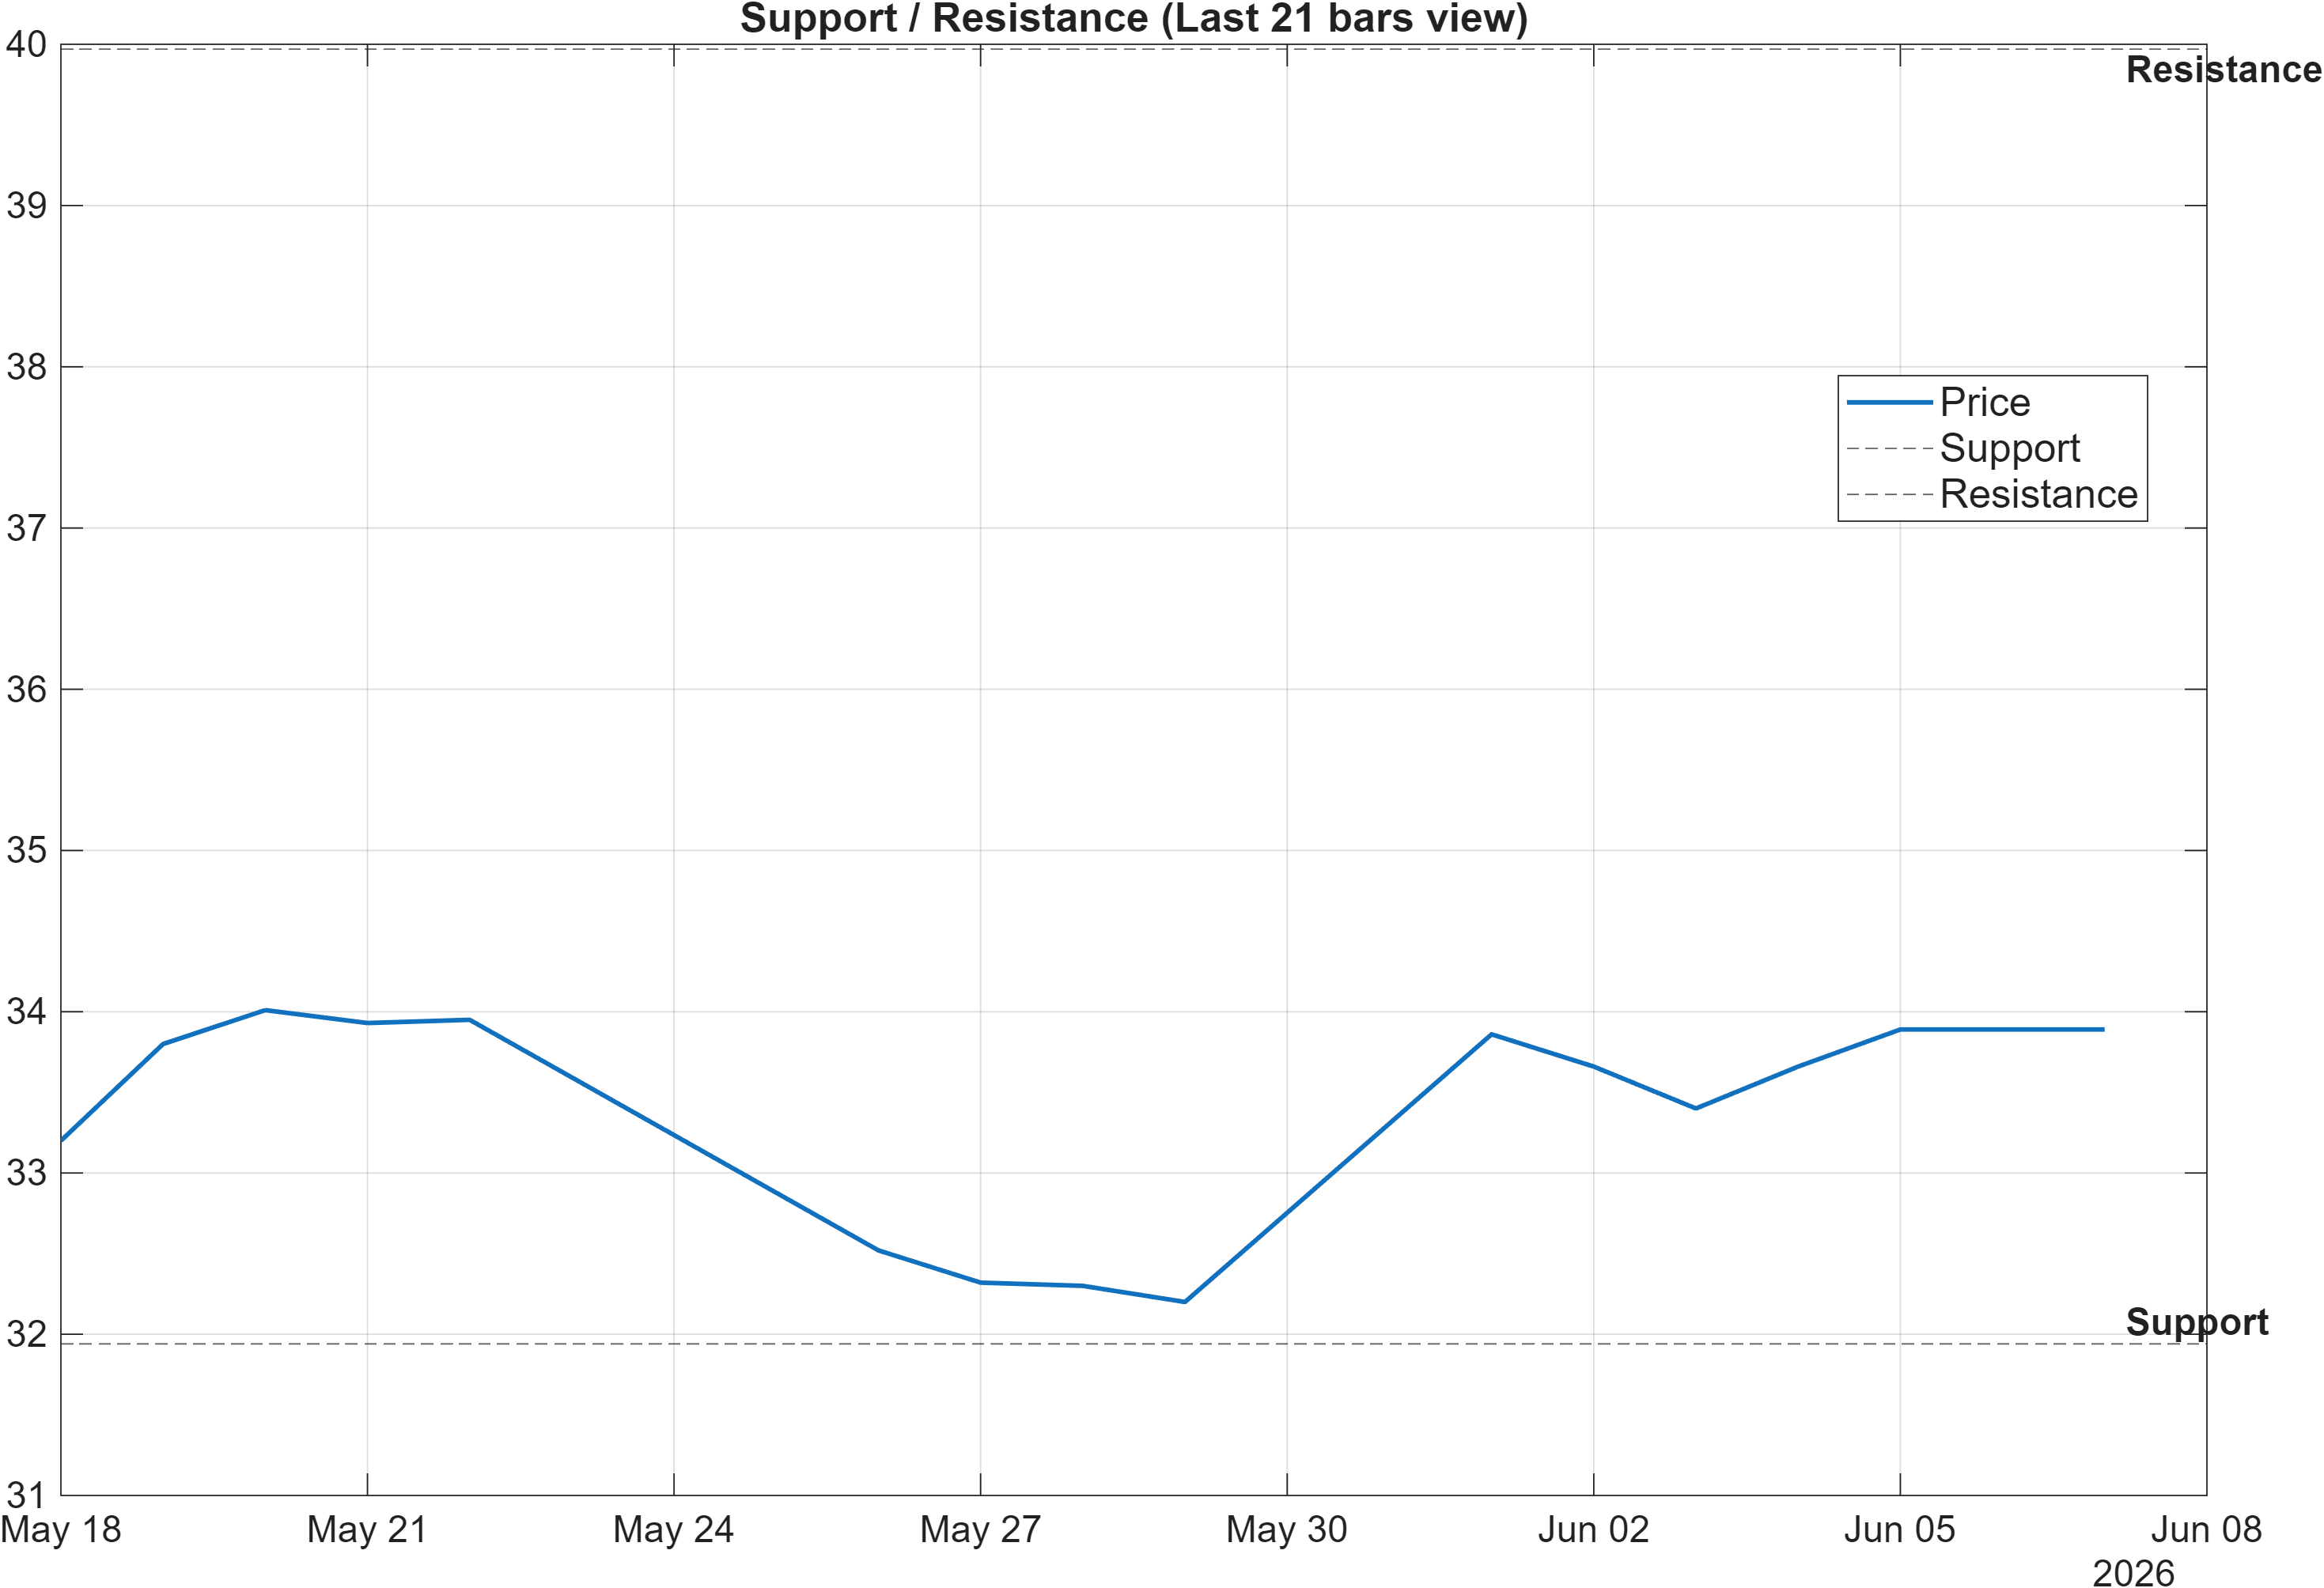
With volatility relatively muted (Bandwidth 0.0753), the 31.9400–39.9700 band becomes the practical operating range for interpreting whether the current bullish longer-horizon profile is being expressed through price. The rank structure (notably 3-month #21 and 6-month #2) suggests the broader tape has been favorable on intermediate horizons, but the daily #851 warns that the path can still be choppy. That makes support/resistance behavior more informative than short-lived indicator flickers.
From a regime perspective, 39.9700 functions as the level that would convert improving momentum into a clearer continuation profile. A clean break accompanied by stronger participation would align well with the bullish technical blend (overall technical score 0.758) and the predominantly bullish signal mix (14 bullish signals against 1 bearish). Without that break, the risk is a return to mean-reversion inside the range, which would be consistent with the neutral short-term rank.
On the downside, 31.9400 is the level where the “bullish but transitional” thesis is most directly challenged. A close below that zone would not merely represent a routine pullback; it would increase the probability that recent accumulation-style readings fail to translate into sustainable price structure. That would also raise the chance that longer-term ranks begin to drift upward (weaken) if the deterioration persists.
In short, this is a decision-zone setup: confirmation is most credibly earned above 39.9700, while risk management logic tightens materially below 31.9400, especially given the still-mixed moving-average backdrop.
Scenario view: Break above resistance with volume → continuation. Close below support → signal deterioration risk.
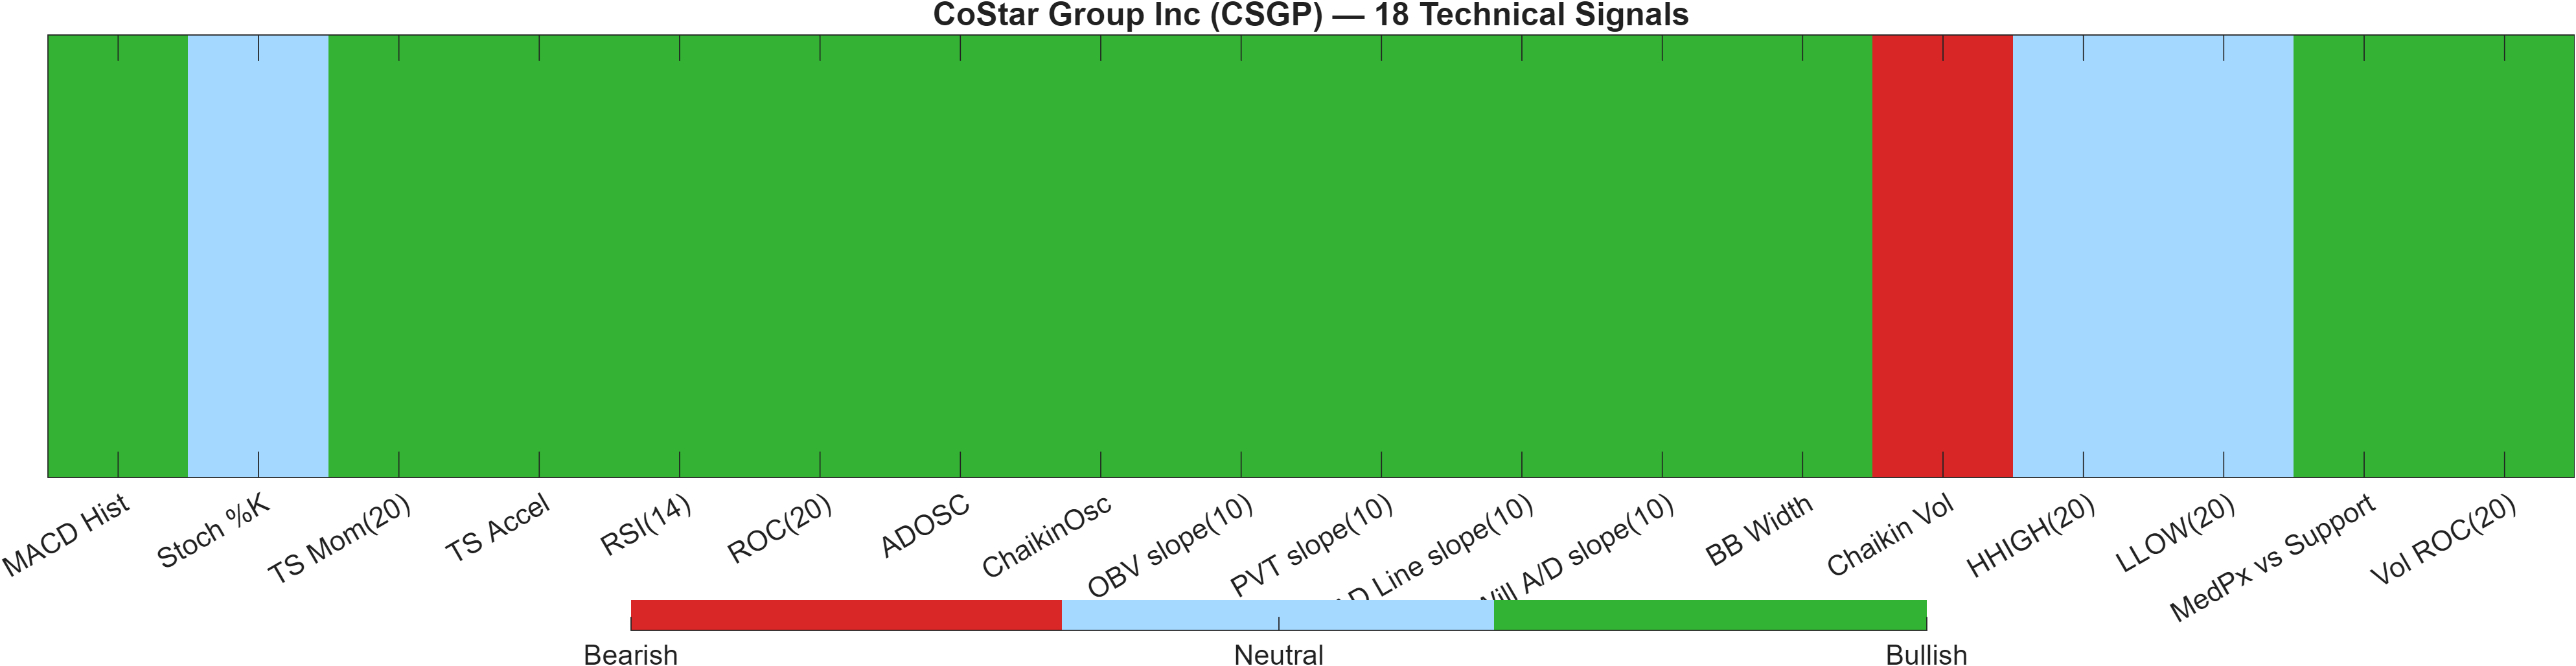
5) Quant Technical Dashboard (18 Signals)
KGNAI AI Technical Analysis Score (Deep Reinforcement Learning): Rank #163 out of 2044 (Rank 1 represents the strongest technical positioning and a higher probability of favorable price behavior. As ranks increase toward the maximum, the probability of favorable outcomes weakens and bearish positioning becomes more dominant.) | Label: Bullish | Score: 0.841
18-Signal Technical Confluence Score: 0.722 (Bullish)
Overall Technical Score (18-signal confluence + DRL rank blend): 0.758 (Bullish)
Note: The blended score reflects signal strength weighted against broader AI technical ranking, which may temporarily diverge.
Blended technical score breakdown: 0.758 (Bullish | Bull 14 / Bear 1 / Neutral 3)
The technical dashboard is notable for its breadth. The Deep Reinforcement Learning technical rank is #163 (bullish) with a score of 0.841, while the 18-signal confluence prints 0.722 and blends into an overall technical score of 0.758. When a model-based rank and a multi-indicator confluence score are both bullish, the interpretation is less about a single “perfect” indicator and more about consistent agreement across independent tests.
The internal composition supports that reading: 14 bullish signals against 1 bearish and 3 neutral. Importantly, the lone bearish item—Chaikin Vol at 16.58—doesn’t invalidate the setup by itself, but it can signal that volatility/participation dynamics are not uniformly supportive across all lenses. In practice, that kind of isolated bearish reading tends to matter most near resistance, where breakouts require cleaner sponsorship.
The bullish cluster is diversified across momentum and participation. Momentum signals such as MACD Hist 0.2268 and ROC(20) 0.2663 support upside bias. Participation measures like ADOSC 48.35 and a bullish OBV slope(10) reading complement that view, implying accumulation pressure is present in the dataset. Meanwhile, the neutral readings—such as HHIGH(20) 34.86 and LLOW(20) 31.7—are consistent with a market that may still be resolving a trading range rather than trending freely.
Overall, the dashboard argues for a continuation-ready technical state that still benefits from price confirmation at the level layer (notably 39.9700). With volatility relatively compressed (BB Width ~0.0753), the quality of the next expansion attempt will likely be determined by whether the bullish participation signals remain intact during any retest behavior.
Signal table (Bull/Bear/Neutral)
| Indicator | Value | Signal |
|---|---|---|
| MACD Hist | 0.2268 | Bullish |
| Stoch %K | 70.19 | Neutral |
| TS Mom(20) | 0.09 | Bullish |
| TS Accel | 0.9 | Bullish |
| RSI(14) | 58.98 | Bullish |
| ROC(20) | 0.2663 | Bullish |
| ADOSC | 48.35 | Bullish |
| ChaikinOsc | 8.335e+06 | Bullish |
| OBV slope(10) | 1.177e+07 | Bullish |
| PVT slope(10) | 3.568e+05 | Bullish |
| AD Line slope(10) | 3.366e+07 | Bullish |
| Will A/D slope(10) | 4.2 | Bullish |
| BB Width | 0.07531 | Bullish |
| Chaikin Vol | 16.58 | Bearish |
| HHIGH(20) | 34.86 | Neutral |
| LLOW(20) | 31.7 | Neutral |
| MedPx vs Support | 1.725 | Bullish |
| Vol ROC(20) | 6.097 | Bullish |
Interpretation: Indicator-level signals form the base confluence, which is then adjusted using a separate AI-driven technical ranking model. The final technical score summarizes this combined view.
6) News sentiment + extractive gist
Sentiment score (avg): 0.109 | Positive: 33% | Neutral: 63% | Negative: 4%
KGNAI AI News Sentiment Score (normalized -1 to +1): 1.00 (as of 2026-06-05) | Label: Bullish | Overall news score: 0.96
Positive Developments
Recent coverage across major financial outlets indicates a constructive narrative around CoStar Group Inc (CSGP), with attention focused on corporate actions and operating updates that the market can map into the company’s data-and-marketplace footprint. The sentiment distribution shows a meaningful positive component (33%) with limited explicit negativity (4%), supporting a modest tailwind rather than an overcrowded optimism signal. Importantly, the normalized news sentiment score is 1.00 (with an overall news score of 0.96), which suggests the language in coverage has skewed supportive even if the average sentiment score remains only slightly positive (0.109). From a market-structure angle, such a setup can reinforce technical continuation attempts when price is challenging key levels, especially when broader technical confluence is already bullish (overall technical score 0.758).
Neutral / Mixed Developments
The dominant share of coverage remains neutral (63%), indicating that a large portion of the news flow is informational rather than catalyst-driven. This matters because neutral-heavy regimes tend to leave price action more dependent on endogenous technical factors—trend structure, volatility compression, and participation—than on one-off headlines. With Bollinger Bandwidth at 0.0753, CSGP is not currently in a high-volatility environment that would typically amplify news shocks; instead, incremental updates may simply add context while the market waits for price confirmation. In that sense, the news mix aligns with the current rank divergence: longer-horizon strength (e.g., 6-month #2) can persist while the shorter window remains timing-sensitive (daily #851).
Negative / Risk Signals
Risk signals in the news flow appear comparatively limited by frequency (4% negative), but they should not be ignored given the still-mixed trend filter in price (MA50 vs MA200 remains bearish). When negative items are sparse, the main risk is less about broad reputational drag and more about event-driven volatility that can emerge around integration, execution, or shifting expectations—particularly if price is near resistance (39.9700) and fails to confirm. Additionally, a high normalized sentiment reading (1.00) can sometimes coincide with elevated attention; if price does not follow through, the unwind can be sharper than the low negative share would suggest. The clean invalidation level remains technical: a close below 31.9400 would increase the probability that the constructive narrative is not being translated into sustained market sponsorship.
- Whether price can establish acceptance above 39.9700 while technical breadth remains supportive (overall technical score 0.758).
- Any shift in the sentiment mix away from 63% neutral toward a higher negative share, especially during volatility expansion from Bandwidth 0.0753.
- Whether short-term rank improves from #851 toward the bullish cluster seen on weekly/monthly horizons.
Sources referenced: Reuters, Bloomberg, Yahoo Finance, MarketWatch, Investing.com
Snapshot: AI Rank (Short–Mid–Long): Mixed (Bullish tilt) (Neutral–Bullish–Bullish) · Technical Confluence: Bullish · Key Levels: Support ~31.94 | Resistance ~39.97 · News Sentiment: Neutral
7) Sources
- Not available in the provided data.
You may also like: How KGNAI AI ranks instruments across global markets
Disclaimer: KGNAI provides AI-generated analytics and educational market commentary only. This is not financial advice. Markets involve risk. Always do your own research.