
PLTR — Palantir Technologies Inc | 12-Jun-2026 — Balanced-to-Bearish Technicals with Mixed Rank Signals
Palantir Technologies Inc (PLTR) enters 12-Jun-2026 with a mixed cross-horizon profile: short-horizon ranks remain Neutral (daily #582; weekly #599 out of 2046), the monthly window is Bullish (#40), while the 3‑month rank is Bearish (#1773). This dispersion matters because it often coincides with regime transition risk—where recent bounce attempts can coexist with weakening intermediate structure. Technically, the multi-signal view leans negative: the 18-signal confluence score is -0.611 (Bearish) and the blended technical score is -0.538 (Bearish), with momentum readings still pressured (MACD histogram -1.8750; RSI bias Bearish). Volatility is not extreme but is measurable (Bollinger bandwidth 0.2906), and decision-making remains anchored to nearby levels: support ~130.3000 and resistance ~152.1800. News sentiment is modestly constructive in aggregate (avg 0.064; normalized score 0.99), creating a notable sentiment-versus-price tension.
- Rank stance: Short Neutral (daily/weekly); Mid Bearish (3‑month); Long Not available.
- Technical confluence: Bearish (18-signal -0.611; blended -0.538).
- Key levels: Support ~130.3000 | Resistance ~152.1800.
- News sentiment bias: Slightly constructive/neutral mix (avg 0.064; Positive 27%, Neutral 64%, Negative 9%; normalized 0.99).
- Confirmation / invalidation: A break above 152.1800 with volume supports continuation; a close below 130.3000 elevates deterioration risk.
KGNAI evaluates assets using large cross-sectional datasets built from millions of structured data points. Inputs incorporate fundamental metrics, technical structures, and systematically processed news sentiment. Statistical models, machine learning, and AI frameworks are used to assess relative positioning, signal alignment, and probabilistic behavior across broad universes.
- Ranks are comparative across the tracked universe, not absolute price targets.
- Confluence reflects alignment among independent signal groups.
- Support/resistance levels are probabilistic decision zones, not guarantees.
- Sentiment provides contextual bias within the broader analytical framework.
1) KGNAI AI Analysis
Region: USA
Total universe size: 2046 ranked instruments
- Daily rank: #582 out of 2046 — Neutral
- Weekly rank: #599 out of 2046 — Neutral
- Monthly rank: #40 out of 2046 — Bullish
- 3-Monthly rank: #1773 out of 2046 — Bearish
- 6-Monthly rank: Not available for this horizon — Not available
- Yearly rank: Not available for this horizon — Not available
The rank structure is best read as a dispersion map rather than a single verdict. PLTR’s monthly placement (#40) sits in the upper tail of the universe, while the 3‑month rank (#1773) is in the lower portion—a configuration that often appears when a prior intermediate trend is still being worked off even as nearer-term behavior stabilizes. Meanwhile, daily (#582) and weekly (#599) ranks both land near the broad middle of the 2046-instrument set, reinforcing a non-committal short-horizon stance.
This cross-horizon divergence is meaningful because it can signal timing mismatch: shorter windows may be responding to a bounce, mean-reversion, or localized improvement, while the 3‑month horizon can remain dominated by earlier drawdown dynamics. The report’s declared term view reflects this tension—short-term Neutral and mid-term Bearish, with long-term horizons Not available in the provided data for 6‑monthly and yearly ranks.
From a process standpoint, the key is to treat PLTR as a relative-positioning problem inside a large opportunity set. When a name shows both a top-tier monthly rank and a weak 3‑month rank, confirmation tends to come from whether technical structure (trend and momentum) can move from conflicted to aligned—particularly around the defined decision zones later in the report.
Term view: Short-term: Neutral. Mid-term: Bearish. Long-term: Not available.
Want the full universe and complete rank tables? Unlock full access on KGNAI: https://www.kgnai.com/pricing
2) Price & trend overview
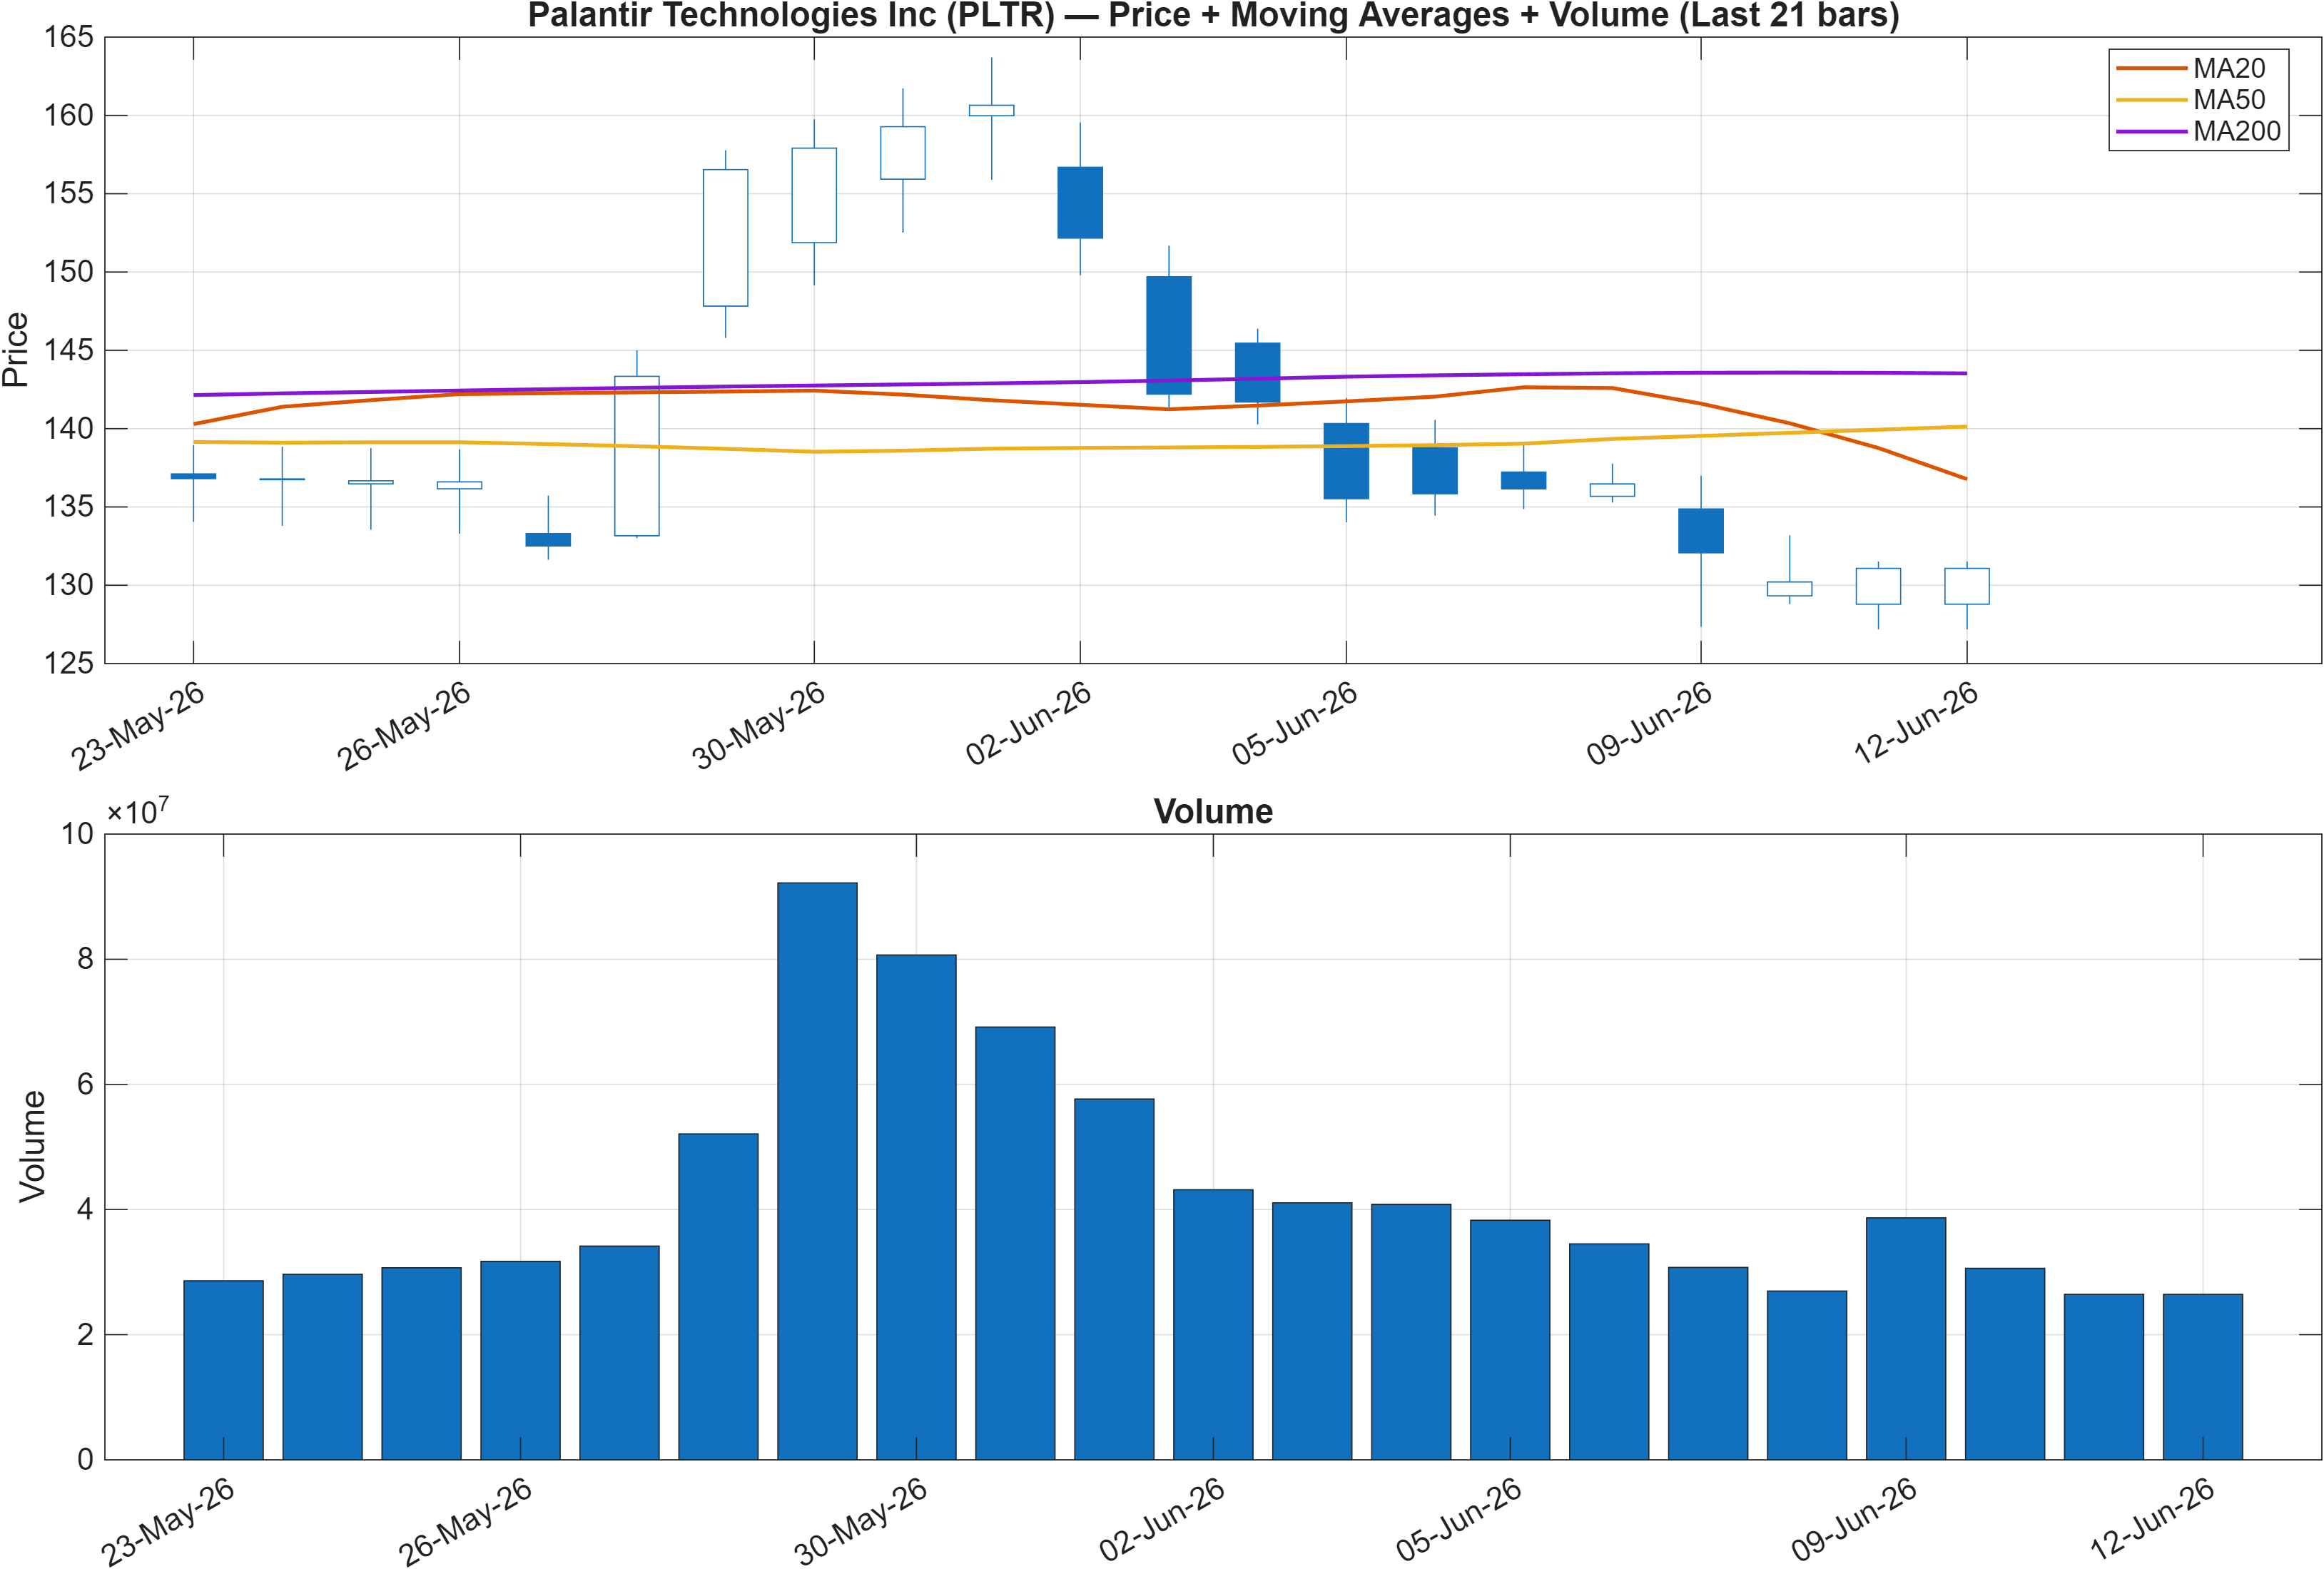
Trend diagnostics remain skewed to the downside: the close relative to the MA50 is marked Bearish, and MA50 vs MA200 is also Bearish. In practical market-structure terms, that combination typically reflects trend persistence rather than a clean reversal—price may stabilize, but the moving-average stack can lag and keep systematic trend filters cautious.
The rank dispersion described earlier (monthly #40 versus 3‑month #1773) fits this picture: monthly strength can emerge from a rebound phase, while intermediate trend frameworks may still classify the tape as weaker until the MA relationships begin to repair. If the market is rotating, the first visible “repair” tends to be price reclaiming faster averages; the second is the compression and eventual turn in the MA50 relative to the MA200.
As a result, PLTR’s trend read is less about calling direction and more about identifying conditions for re-alignment. With a Neutral short-horizon rank (daily #582; weekly #599), trend evidence has not yet converged into a high-conviction profile. Until it does, risk tends to cluster around the report’s defined support/resistance zones, where trend participants and mean-reversion participants often disagree most visibly.
3) Momentum & volatility dashboard
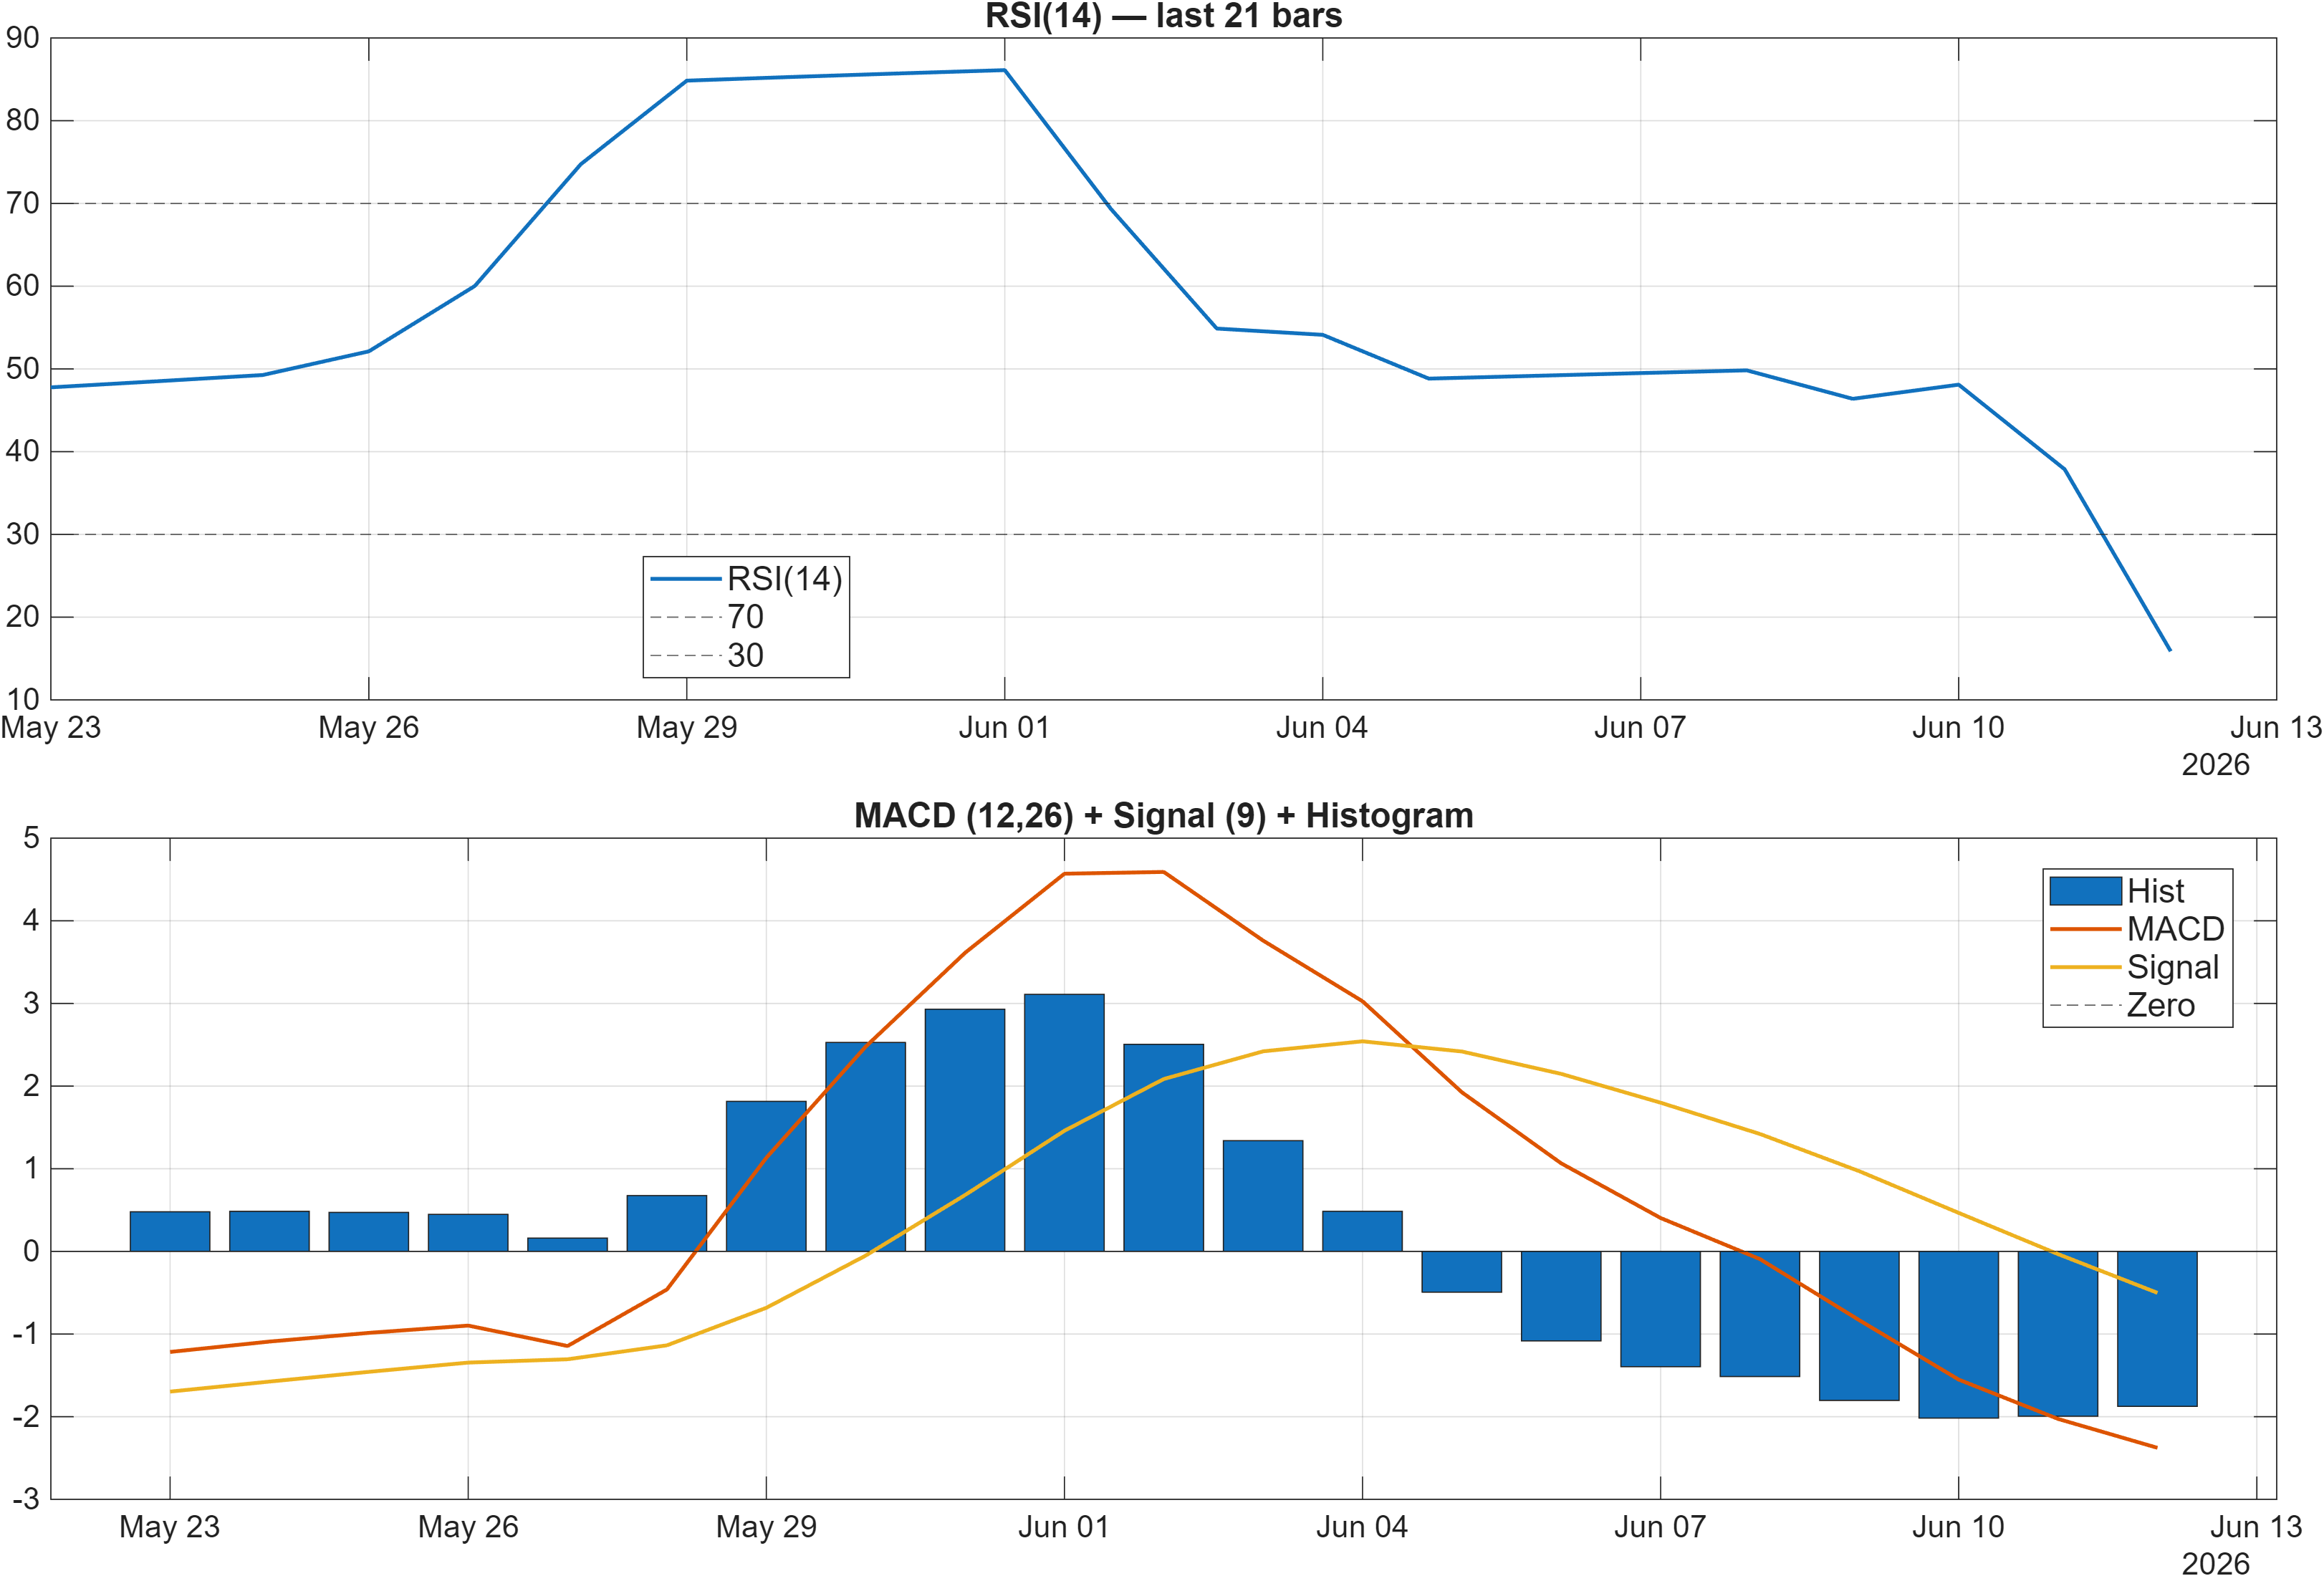
Momentum signals are not uniformly negative, but the center of gravity remains bearish. The RSI bias is flagged Bearish, and the MACD histogram sits at -1.8750, which is consistent with downside momentum still dominating the recent impulse. Even though oversold-type behavior can occur under such readings, this report treats divergence as uncertainty rather than a standalone opportunity—especially when trend filters (MA relationships) are also bearish.
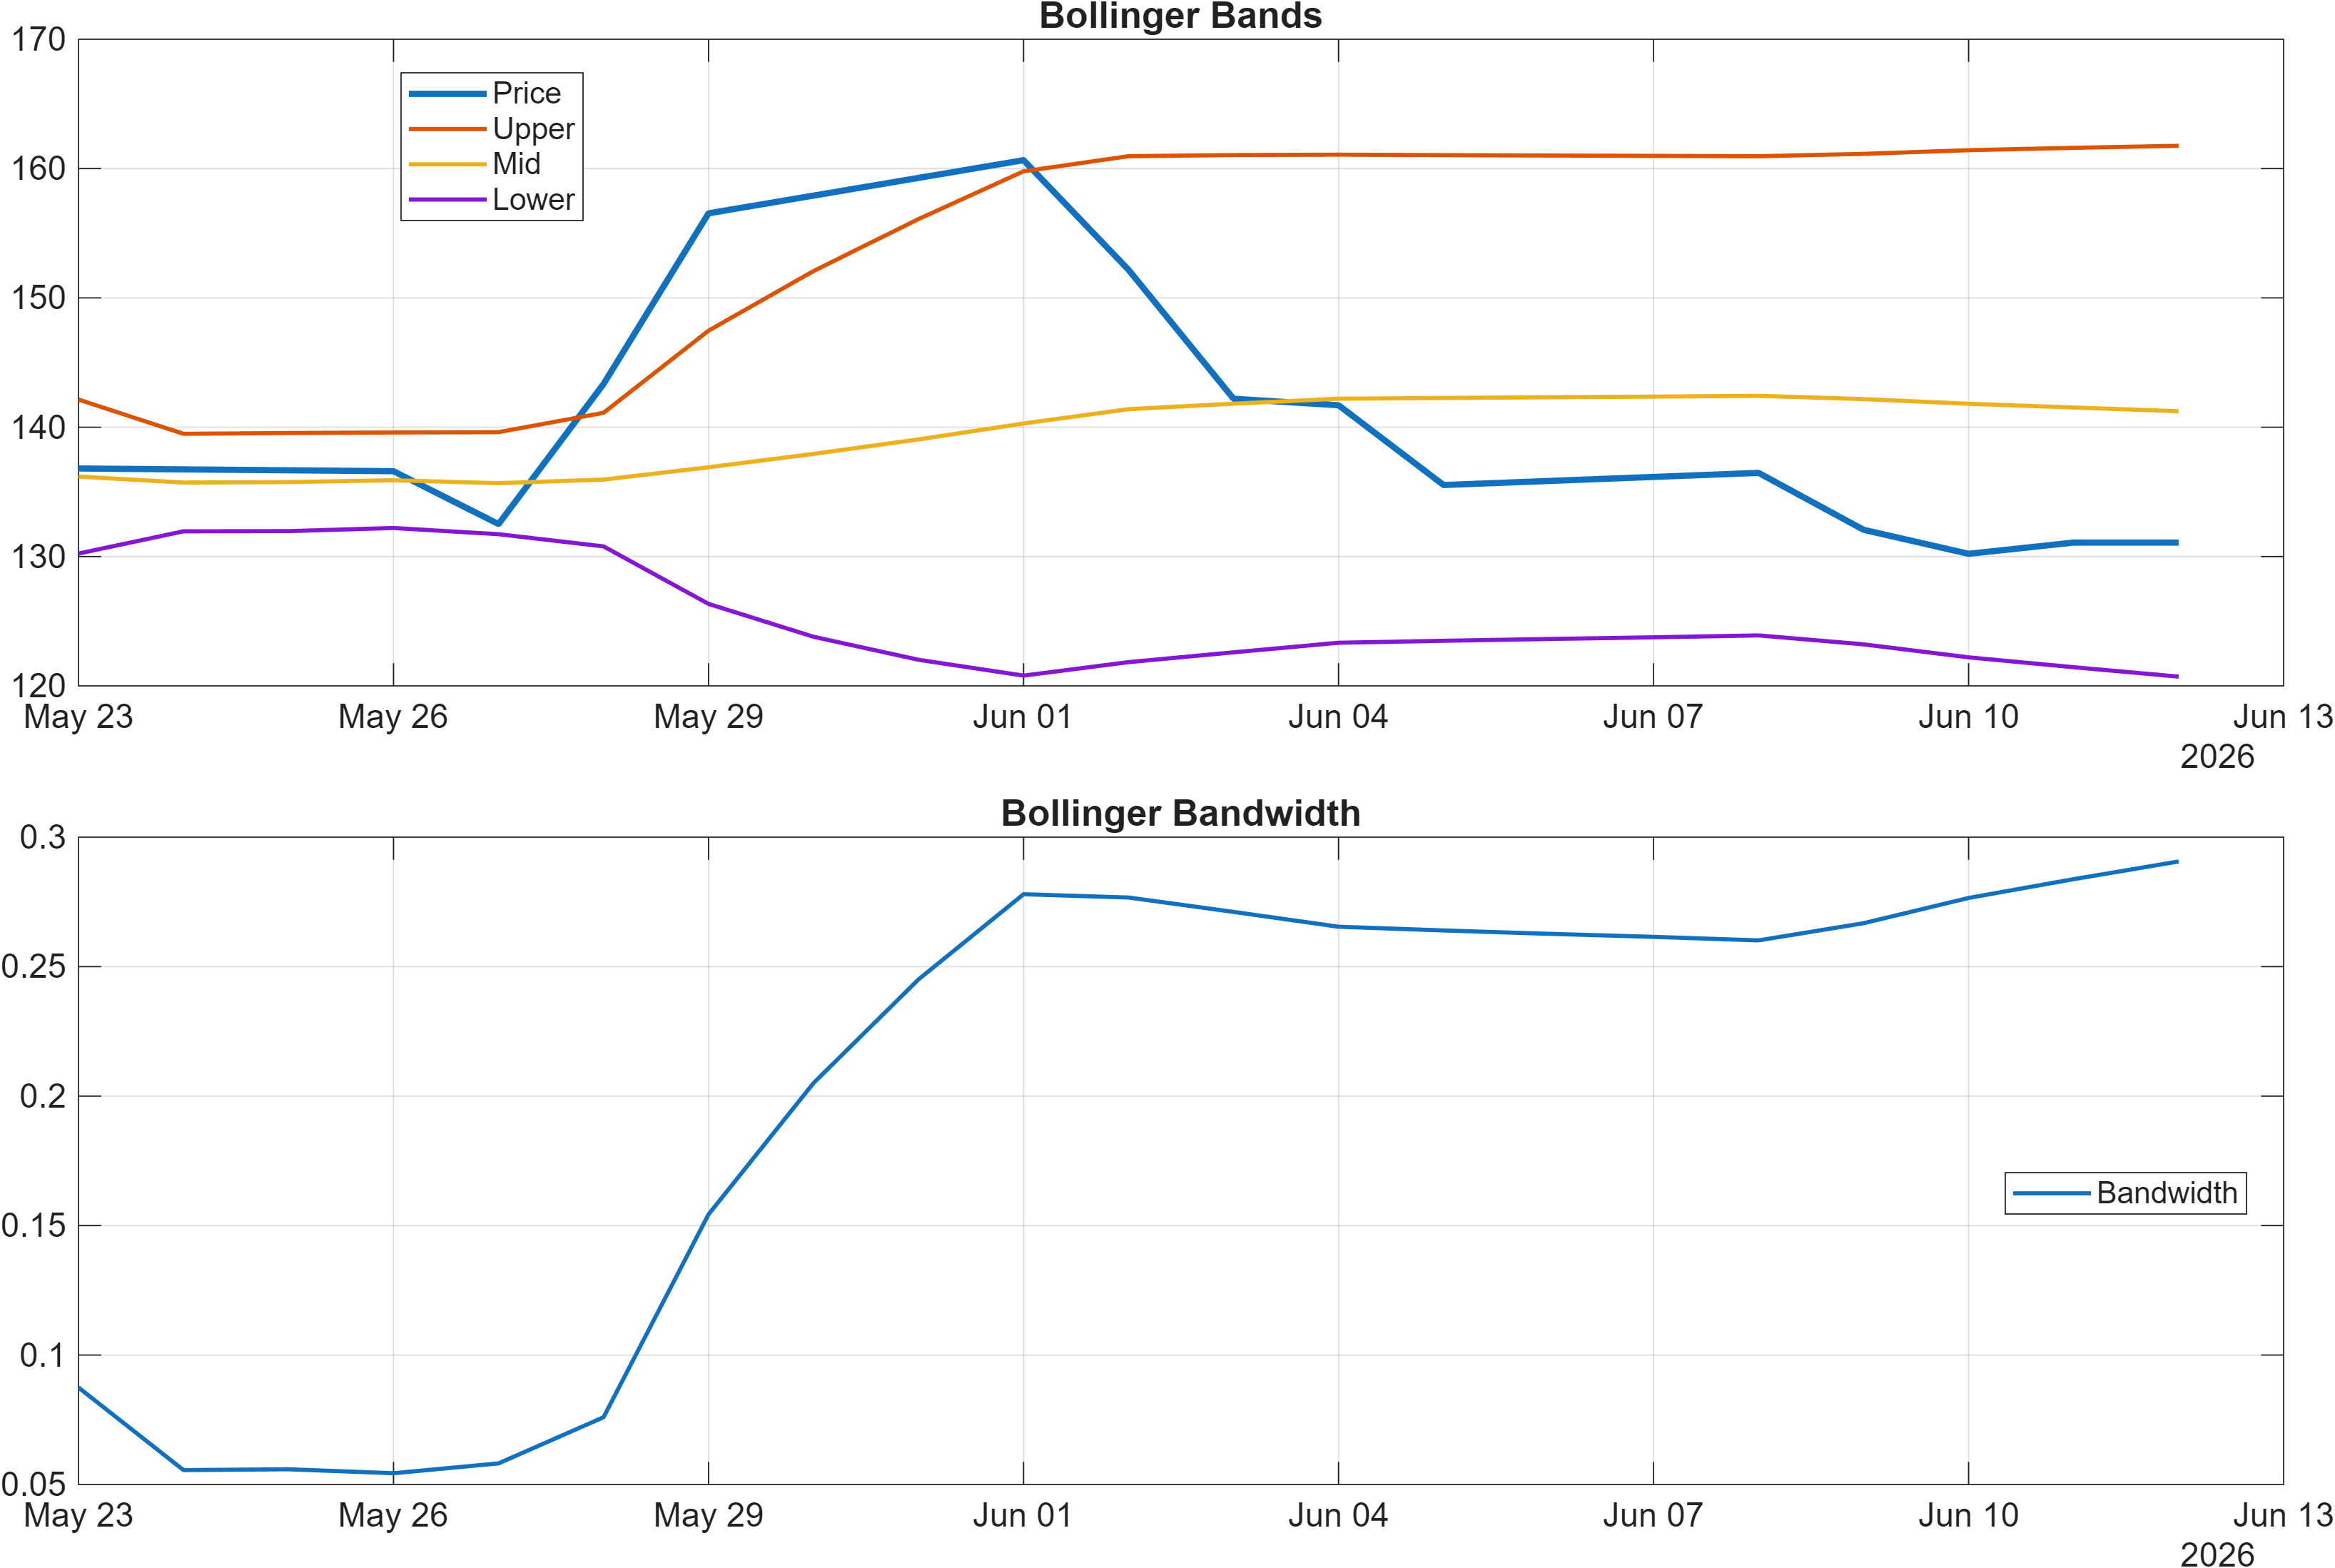
Volatility conditions are measurable but not described here as extreme: Bollinger bandwidth is 0.2906. When bandwidth sits in a moderate regime, the analytical focus often shifts from “volatility shock” narratives to whether momentum can transition from expansion to stabilization. In that setting, price frequently oscillates between well-defined levels, and confirmation becomes more dependent on whether momentum indicators start to base and turn while volatility remains contained.
A useful way to integrate these readings with the ranking profile is to watch for compression-to-expansion sequencing: if volatility remains orderly (bandwidth stable around 0.2906) while momentum stops deteriorating (MACD histogram improving from -1.8750), the mixed monthly-versus-3‑month ranks may begin to reconcile. Conversely, if momentum weakens again while volatility expands, the bearish intermediate ranking (#1773 at 3 months) would be consistent with renewed downside control.
4) Support / Resistance zones
Support ~ 130.3000 | Resistance ~ 152.1800
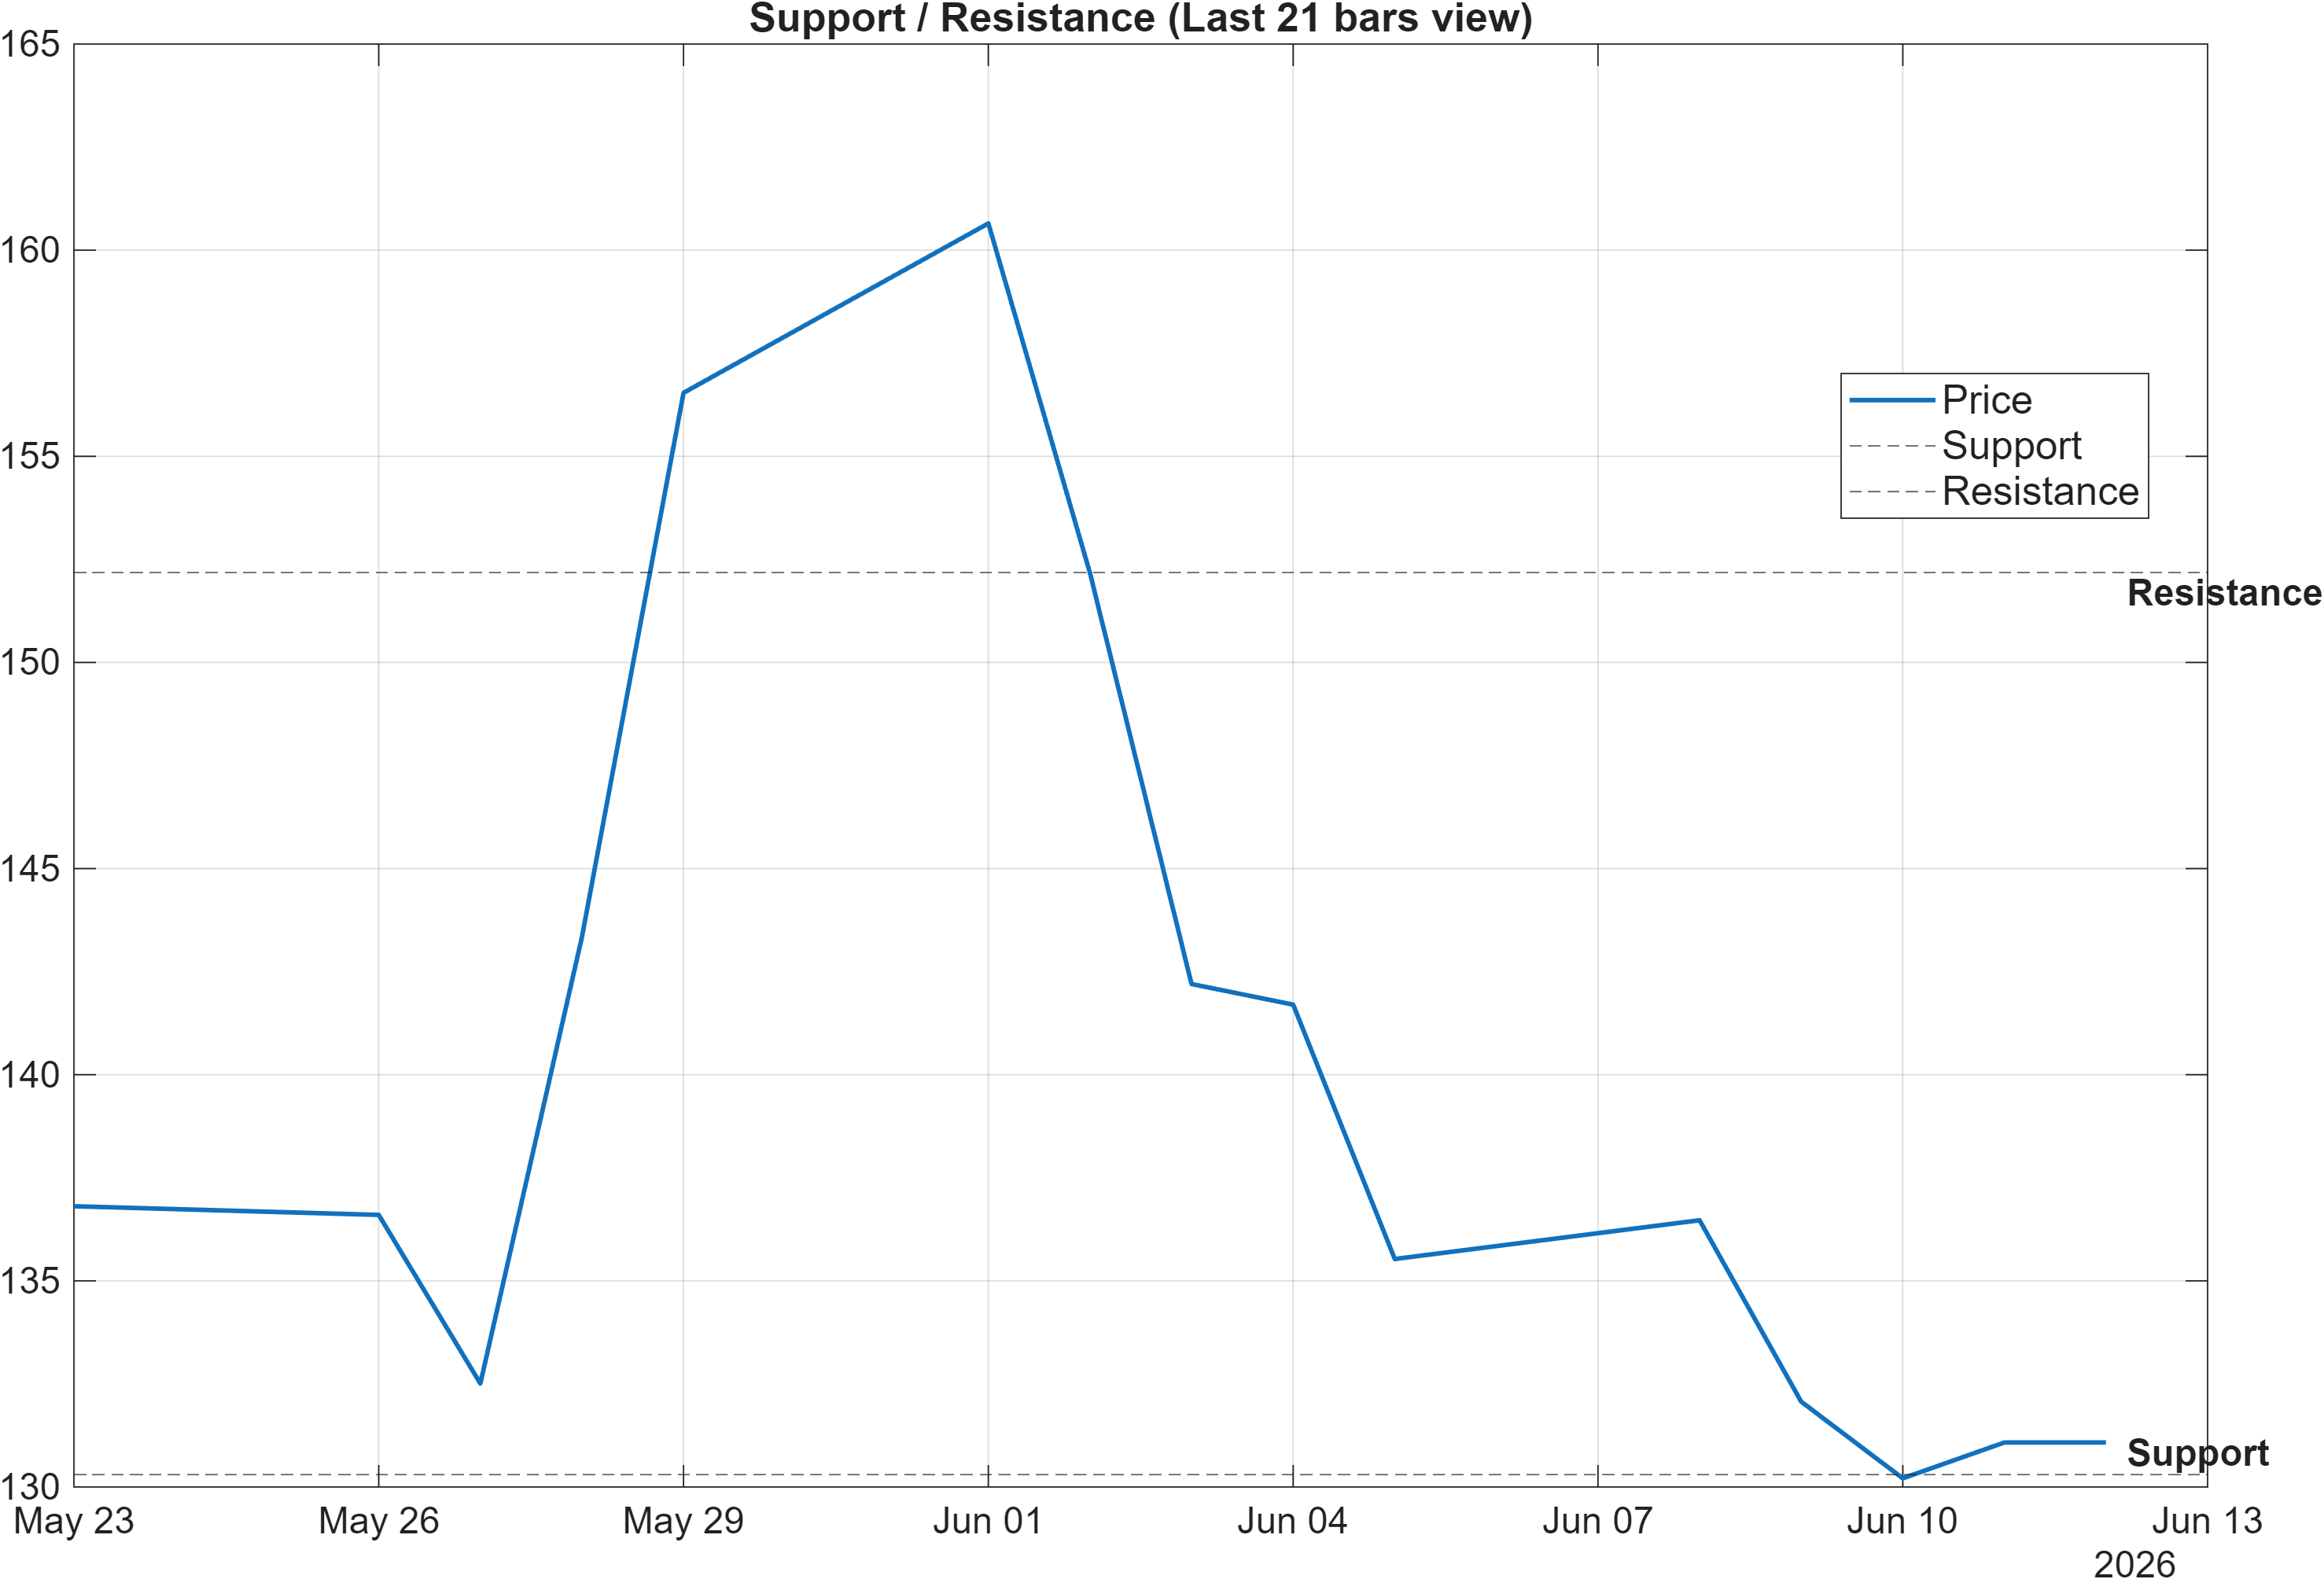
The current structure is defined by a clean, two-sided decision map: 130.3000 as support and 152.1800 as resistance. With MA-based trend signals bearish and momentum still pressured (MACD histogram -1.8750), these levels become higher-importance validation points for whether price is transitioning into a more constructive regime or simply oscillating within a broader downtrend.
The scenario logic embedded in the chart aligns with market microstructure behavior: a break above resistance with volume can indicate that incremental buyers are willing to transact at higher prices and absorb supply that previously capped advances. Conversely, a close below support is not merely a “level break”—it frequently reflects a change in who is forced to transact (stops, de-risking, and liquidity shifts), which can accelerate adverse moves, particularly when technical confluence is already bearish (overall -0.538 blended score).
These zones also reconcile the report’s mixed signals: a Neutral short-horizon rank (daily #582; weekly #599) can persist inside the range, while the monthly (#40) and 3‑month (#1773) disagreement resolves when price chooses a direction through 152.1800 or 130.3000. Until then, the dominant analytical stance is balanced conditions with bearish technical tilt, rather than a one-way thesis.
5) Quant Technical Dashboard (18 Signals)
KGNAI AI Technical Analysis Score (Deep Reinforcement Learning): Rank #1399 out of 2046 (Rank 1 represents the strongest technical positioning and a higher probability of favorable price behavior. As ranks increase toward the maximum, the probability of favorable outcomes weakens and bearish positioning becomes more dominant.) | Label: Neutral | Score: -0.368
18-Signal Technical Confluence Score: -0.611 (Bearish)
Overall Technical Score (18-signal confluence + DRL rank blend): -0.538 (Bearish)
Note: The blended score reflects signal strength weighted against broader AI technical ranking, which may temporarily diverge.
Blended technical score breakdown: -0.538 (Bearish | Bull 2 / Bear 13 / Neutral 3)
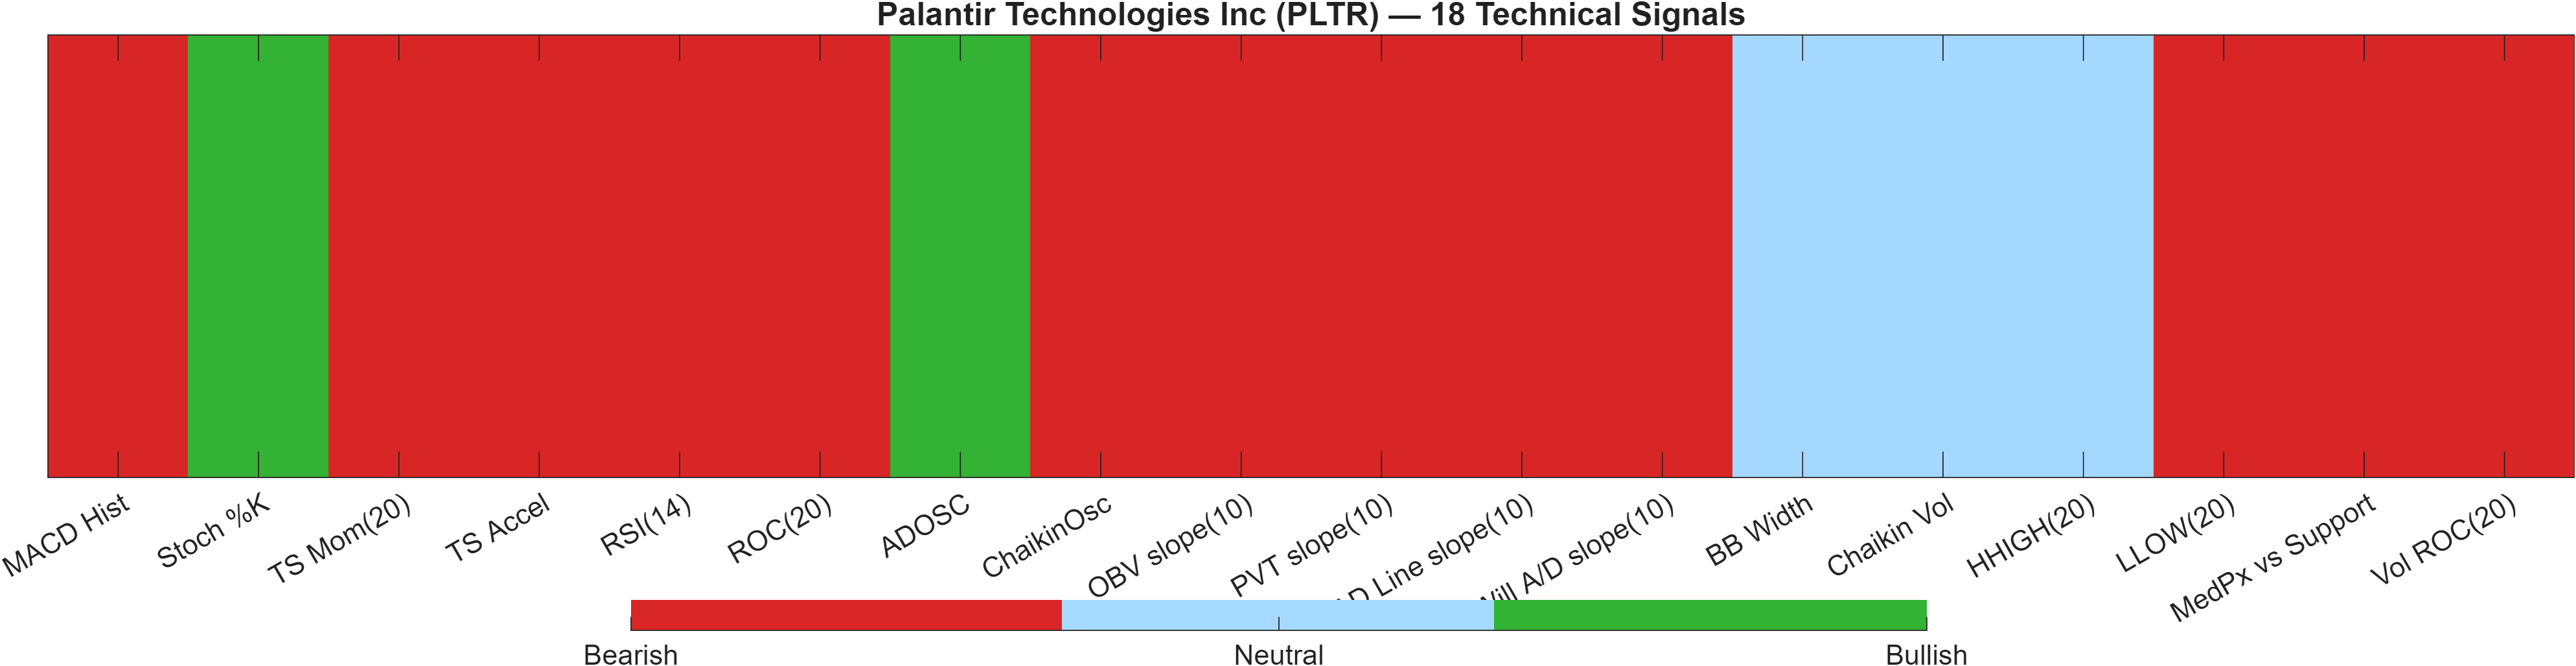
The dashboard presents a clear confluence-versus-model divergence theme. The 18-signal set is decisively bearish (-0.611), while the separate DRL technical ranking is labeled Neutral (rank #1399, score -0.368). The blended output remains bearish at -0.538, indicating the systematic aggregation still weights evidence toward weaker technical positioning, even if one model component is less negative.
Internally, the balance of signals is skewed: Bear 13 versus Bull 2 with Neutral 3. That distribution reduces the odds that a single indicator reversal will change the overall verdict. For example, even with some supportive behavior in the signal mix, the combined momentum/flow complex is still pressured—MACD histogram is -1.875 and RSI(14) is 15.87, while volatility is not providing a strong offset (BB Width 0.2906 is Neutral rather than a clear compression/expansion extreme in the signal table). In other words, the dashboard leans toward trend persistence unless multiple components pivot together.
Signal table (Bull/Bear/Neutral)
| Indicator | Value | Signal |
|---|---|---|
| MACD Hist | -1.875 | Bearish |
| Stoch %K | 15.92 | Bullish |
| TS Mom(20) | -5.66 | Bearish |
| TS Accel | -6.49 | Bearish |
| RSI(14) | 15.87 | Bearish |
| ROC(20) | -4.139 | Bearish |
| ADOSC | 76.38 | Bullish |
| ChaikinOsc | -5.024e+05 | Bearish |
| OBV slope(10) | -7.079e+07 | Bearish |
| PVT slope(10) | -5.79e+06 | Bearish |
| AD Line slope(10) | -8.068e+07 | Bearish |
| Will A/D slope(10) | -21.19 | Bearish |
| BB Width | 0.2906 | Neutral |
| Chaikin Vol | -33.72 | Neutral |
| HHIGH(20) | 163.7 | Neutral |
| LLOW(20) | 127.2 | Bearish |
| MedPx vs Support | -0.9502 | Bearish |
| Vol ROC(20) | -10.8 | Bearish |
Interpretation: Indicator-level signals form the base confluence, which is then adjusted using a separate AI-driven technical ranking model. The final technical score summarizes this combined view.
6) News sentiment + extractive gist
Sentiment score (avg): 0.064 | Positive: 27% | Neutral: 64% | Negative: 9%
KGNAI AI News Sentiment Score (normalized -1 to +1): 0.99 (as of 2026-06-12) | Label: Bullish | Overall news score: 0.91
Positive Developments
Recent coverage across major financial outlets indicates a mildly constructive narrative tone despite choppy price structure. The distribution is dominated by Neutral coverage (64%), but the Positive share (27%) is meaningfully larger than the Negative share (9%), producing an average sentiment score of 0.064. The normalized KGNAI news sentiment score is 0.99 (Bullish), suggesting that language-level framing around Palantir’s positioning and commercial activity has skewed supportive on balance. In this context, the practical implication is not that news overrides price, but that it can reduce downside narrative pressure while technicals attempt to stabilize—especially if price approaches the defined support zone (130.3000) and holds. A constructive bias can also help explain why shorter-horizon ranks remain Neutral (daily #582; weekly #599) even as intermediate technical confluence remains bearish (-0.538 blended).
Neutral / Mixed Developments
The neutral-heavy mix (64%) implies that much of the information flow is contextual rather than catalytic. That typically aligns with range-bound behavior where participants re-price expectations incrementally without decisive re-rating. In PLTR’s case, the coexistence of a Bullish monthly rank (#40) and a Bearish 3‑month rank (#1773) fits a mixed-news environment: near-term narratives can be constructive while the medium-term tape still works through earlier technical damage. With momentum still pressured (MACD histogram -1.8750) and volatility in a measurable regime (bandwidth 0.2906), neutral information flow can keep focus on execution and confirmation rather than prompting immediate repricing.
Negative / Risk Signals
Risk framing remains present even if it is the minority share of coverage (9%). In practice, a small negative share can still matter when technical positioning is already bearish (-0.611 confluence; -0.538 blended), because incremental negative narratives can act as a volatility amplifier near key levels. The market’s sensitivity tends to increase if price challenges support (~130.3000), where risk management becomes more mechanical. Separately, the gap between short-horizon neutrality (daily/weekly ranks in the ~#580–#600 area) and weak 3‑month positioning (#1773) leaves PLTR more exposed to adverse re-pricing if news tone shifts from neutral to negative while momentum remains weak.
- What to monitor next: Whether sentiment stays constructive while price tests 152.1800 resistance.
- What to monitor next: Any deterioration in tone coinciding with a close below 130.3000.
- What to monitor next: Signs of momentum repair (MACD histogram improving from -1.8750) alongside stable bandwidth (0.2906).
Sources referenced: Reuters, Bloomberg, Yahoo Finance, MarketWatch, Investing.com
Snapshot: AI Rank (Short–Mid–Long): Mixed (Neutral–Bearish–Not available) · Technical Confluence: Bearish · Key Levels: Support ~130.30 | Resistance ~152.18 · News Sentiment: Neutral
7) Sources
Source links are not reproduced in this publication format. Not available in the provided data.
You may also like: How KGNAI AI ranks instruments across global markets
Disclaimer: KGNAI provides AI-generated analytics and educational market commentary only. This is not financial advice. Markets involve risk. Always do your own research.