CMCSA (Comcast Corp) Technical & Rank Outlook — 05-Jun-2026 | Transitional Phase with Bearish Technical Confluence
AI-Based Technical, Rank & Sentiment Analysis
Comcast Corp (CMCSA) is currently exhibiting a transitionary setup: longer-horizon KGNAI ranks remain constructive (monthly bullish with 6-monthly and yearly also bullish), while the near-term technical stack is pressured. Price/MA structure flags bearish alignment (close vs MA50 bearish; MA50 vs MA200 bearish), and momentum gauges remain soft with MACD histogram at -0.1049 and an RSI(14) reading of 10.5, consistent with weak short-term impulse despite potential oversold characteristics. Volatility conditions are not extreme, with Bollinger bandwidth near 0.0995, suggesting the market is not yet in an expansionary breakout regime. The actionable framing centers on key decision zones: support ~24.5867 and resistance ~29.9100. News sentiment is statistically positive on the model scale (normalized score 0.99), but the price/technical layer has not yet validated that optimism.
Key Takeaways
- Rank stance: Short-term Neutral | Mid-term Neutral | Long-term Bullish
- Technical confluence: Bearish (18-signal confluence -0.444; blended -0.512; DRL tech rank #1708/2045)
- Key levels: Support ~24.5867 | Resistance ~29.9100
- News sentiment bias: Model sentiment Bullish (normalized 0.99) with headline mix largely neutral (87% neutral; 13% positive; 0% negative)
- Confirmation / invalidation: A sustained break above 29.9100 with volume supports continuation; a close below 24.5867 increases deterioration risk.
What KGNAI Measures
KGNAI evaluates assets using large cross-sectional datasets built from millions of structured data points. Inputs incorporate fundamental metrics, technical structures, and systematically processed news sentiment. Statistical models, machine learning, and AI frameworks are used to assess relative positioning, signal alignment, and probabilistic behavior across broad universes.
How to Read This Report
- Ranks are comparative across the tracked universe, not absolute price targets.
- Confluence reflects alignment among independent signal groups.
- Support/resistance levels are probabilistic decision zones, not guarantees.
- Sentiment provides contextual bias within the broader analytical framework.
1) KGNAI AI Analysis
Region: USA
Total universe size: 2045 ranked instruments
- Daily rank: #1282 out of 2045 — Neutral
- Weekly rank: #785 out of 2045 — Neutral
- Monthly rank: #175 out of 2045 — Bullish
- 3-Monthly rank: #1150 out of 2045 — Neutral
- 6-Monthly rank: #199 out of 2045 — Bullish
- Yearly rank: #162 out of 2045 — Bullish
CMCSA’s rank profile is best described as time-horizon dispersion. Near-term ranks are positioned in the lower half of the universe (daily #1282; weekly #785), consistent with a market that is not currently rewarding the name on a short lookback. In contrast, longer windows remain comparatively stronger: monthly #175 sits in the upper decile, while 6-monthly #199 and yearly #162 place CMCSA in the upper quartile of the 2045-instrument set.
This configuration often appears when a longer-horizon regime is still scoring well on broad cross-sectional tests, but recent price behavior and technical conditions have degraded enough to neutralize the short and intermediate read. The 3-monthly rank (#1150) reinforces that interpretation: it is neither strongly supportive nor decisively negative, implying the market is still processing a transition rather than expressing a stable trend.
The provided term view formalizes that split: Short-term Neutral, Mid-term Neutral, and Long-term Bullish. For positioning and risk framing, this typically shifts emphasis toward validation triggers—i.e., whether near-term technicals can stabilize without undermining the longer-horizon profile. Absent that stabilization, the model’s long-term strength can persist while price behavior remains tactically difficult.
Want the full universe and complete rank tables? Unlock full access on KGNAI: https://www.kgnai.com/pricing
2) Price & trend overview
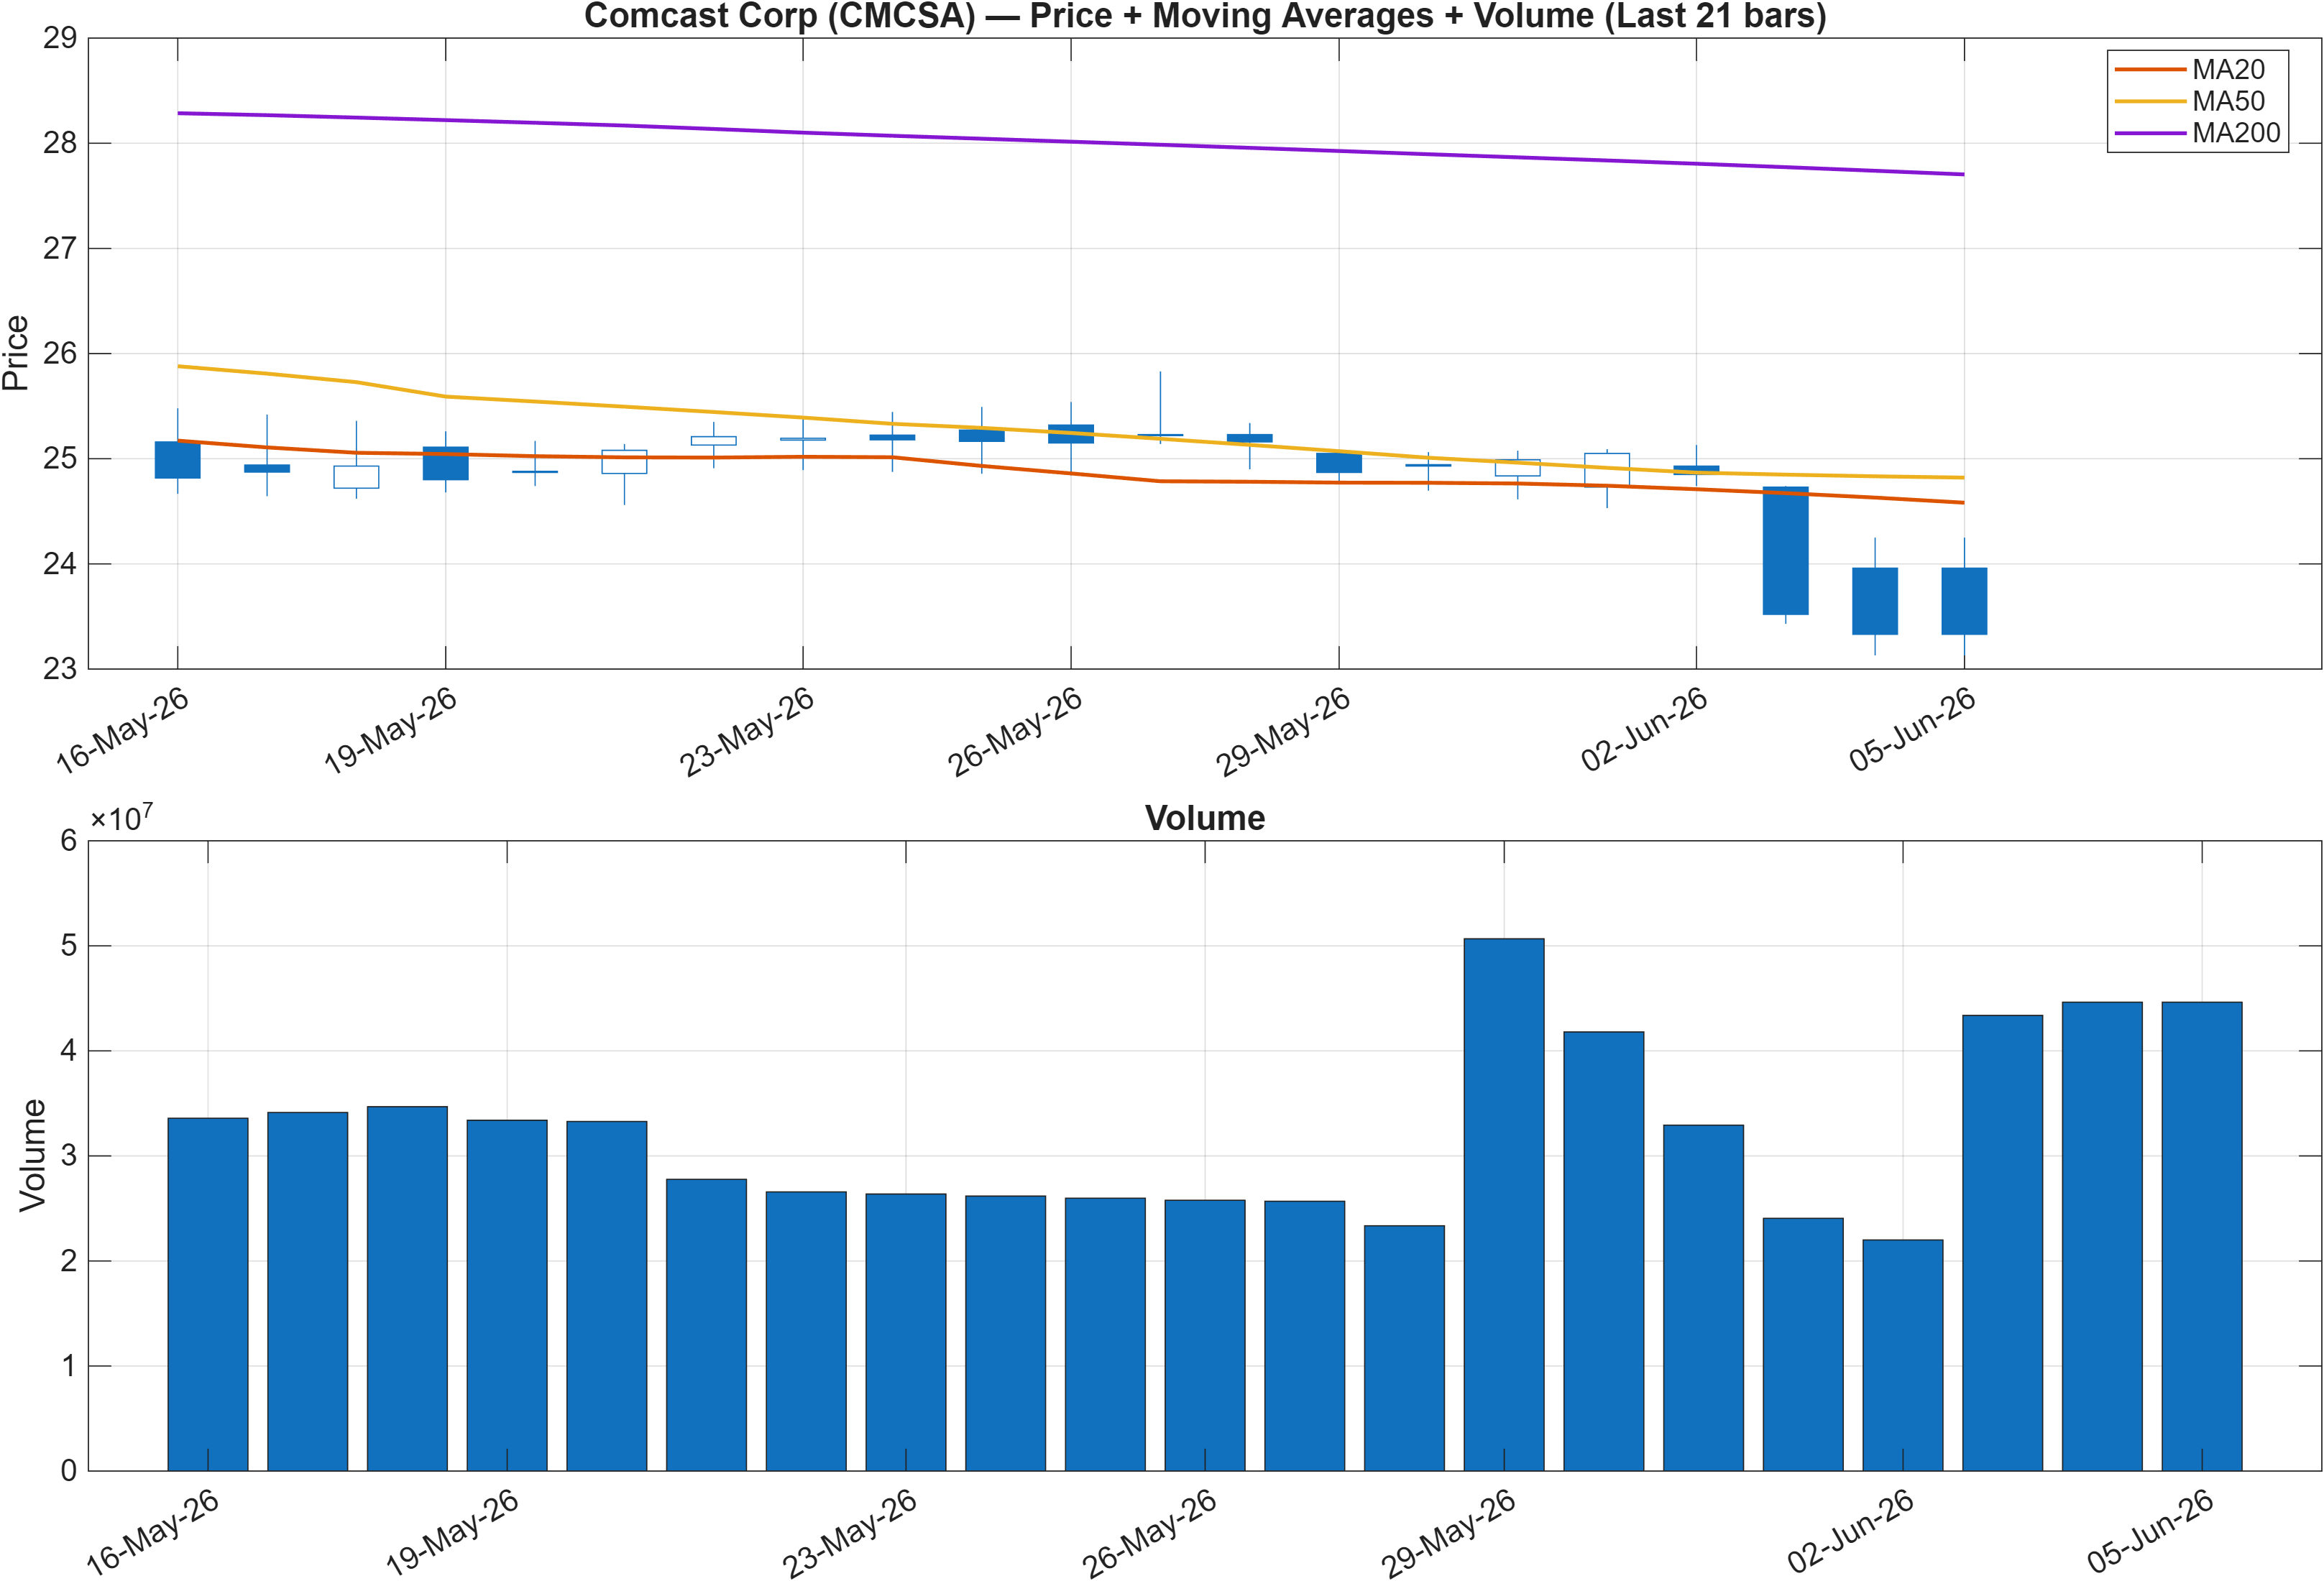
The moving-average structure is currently a headwind. The model flags close vs MA50 as bearish and MA50 vs MA200 as bearish, a combination that typically aligns with a market trading below intermediate trend while also reflecting a weaker longer-duration slope. In practice, that structure raises the bar for upside follow-through because rallies can encounter supply around declining averages.
This trend configuration also helps reconcile the rank dispersion: CMCSA can score well over longer windows (e.g., monthly #175; yearly #162) while still showing a tactically weak trend state on price/MA filters. When that occurs, the key question becomes whether the current phase is a pullback within a broader favorable ranking backdrop or a more persistent downtrend that will eventually pressure those longer-horizon scores.
From a market-structure perspective, the upcoming evaluation points are concentrated around the predefined zones in this report: support at 24.5867 and resistance at 29.9100. With trend filters bearish, the path of least resistance remains conditional on how price behaves as it approaches these levels—particularly whether rebounds can sustain above intermediate structure rather than fading into it.
Trend label: Bearish (MA structure)
3) Momentum & volatility dashboard
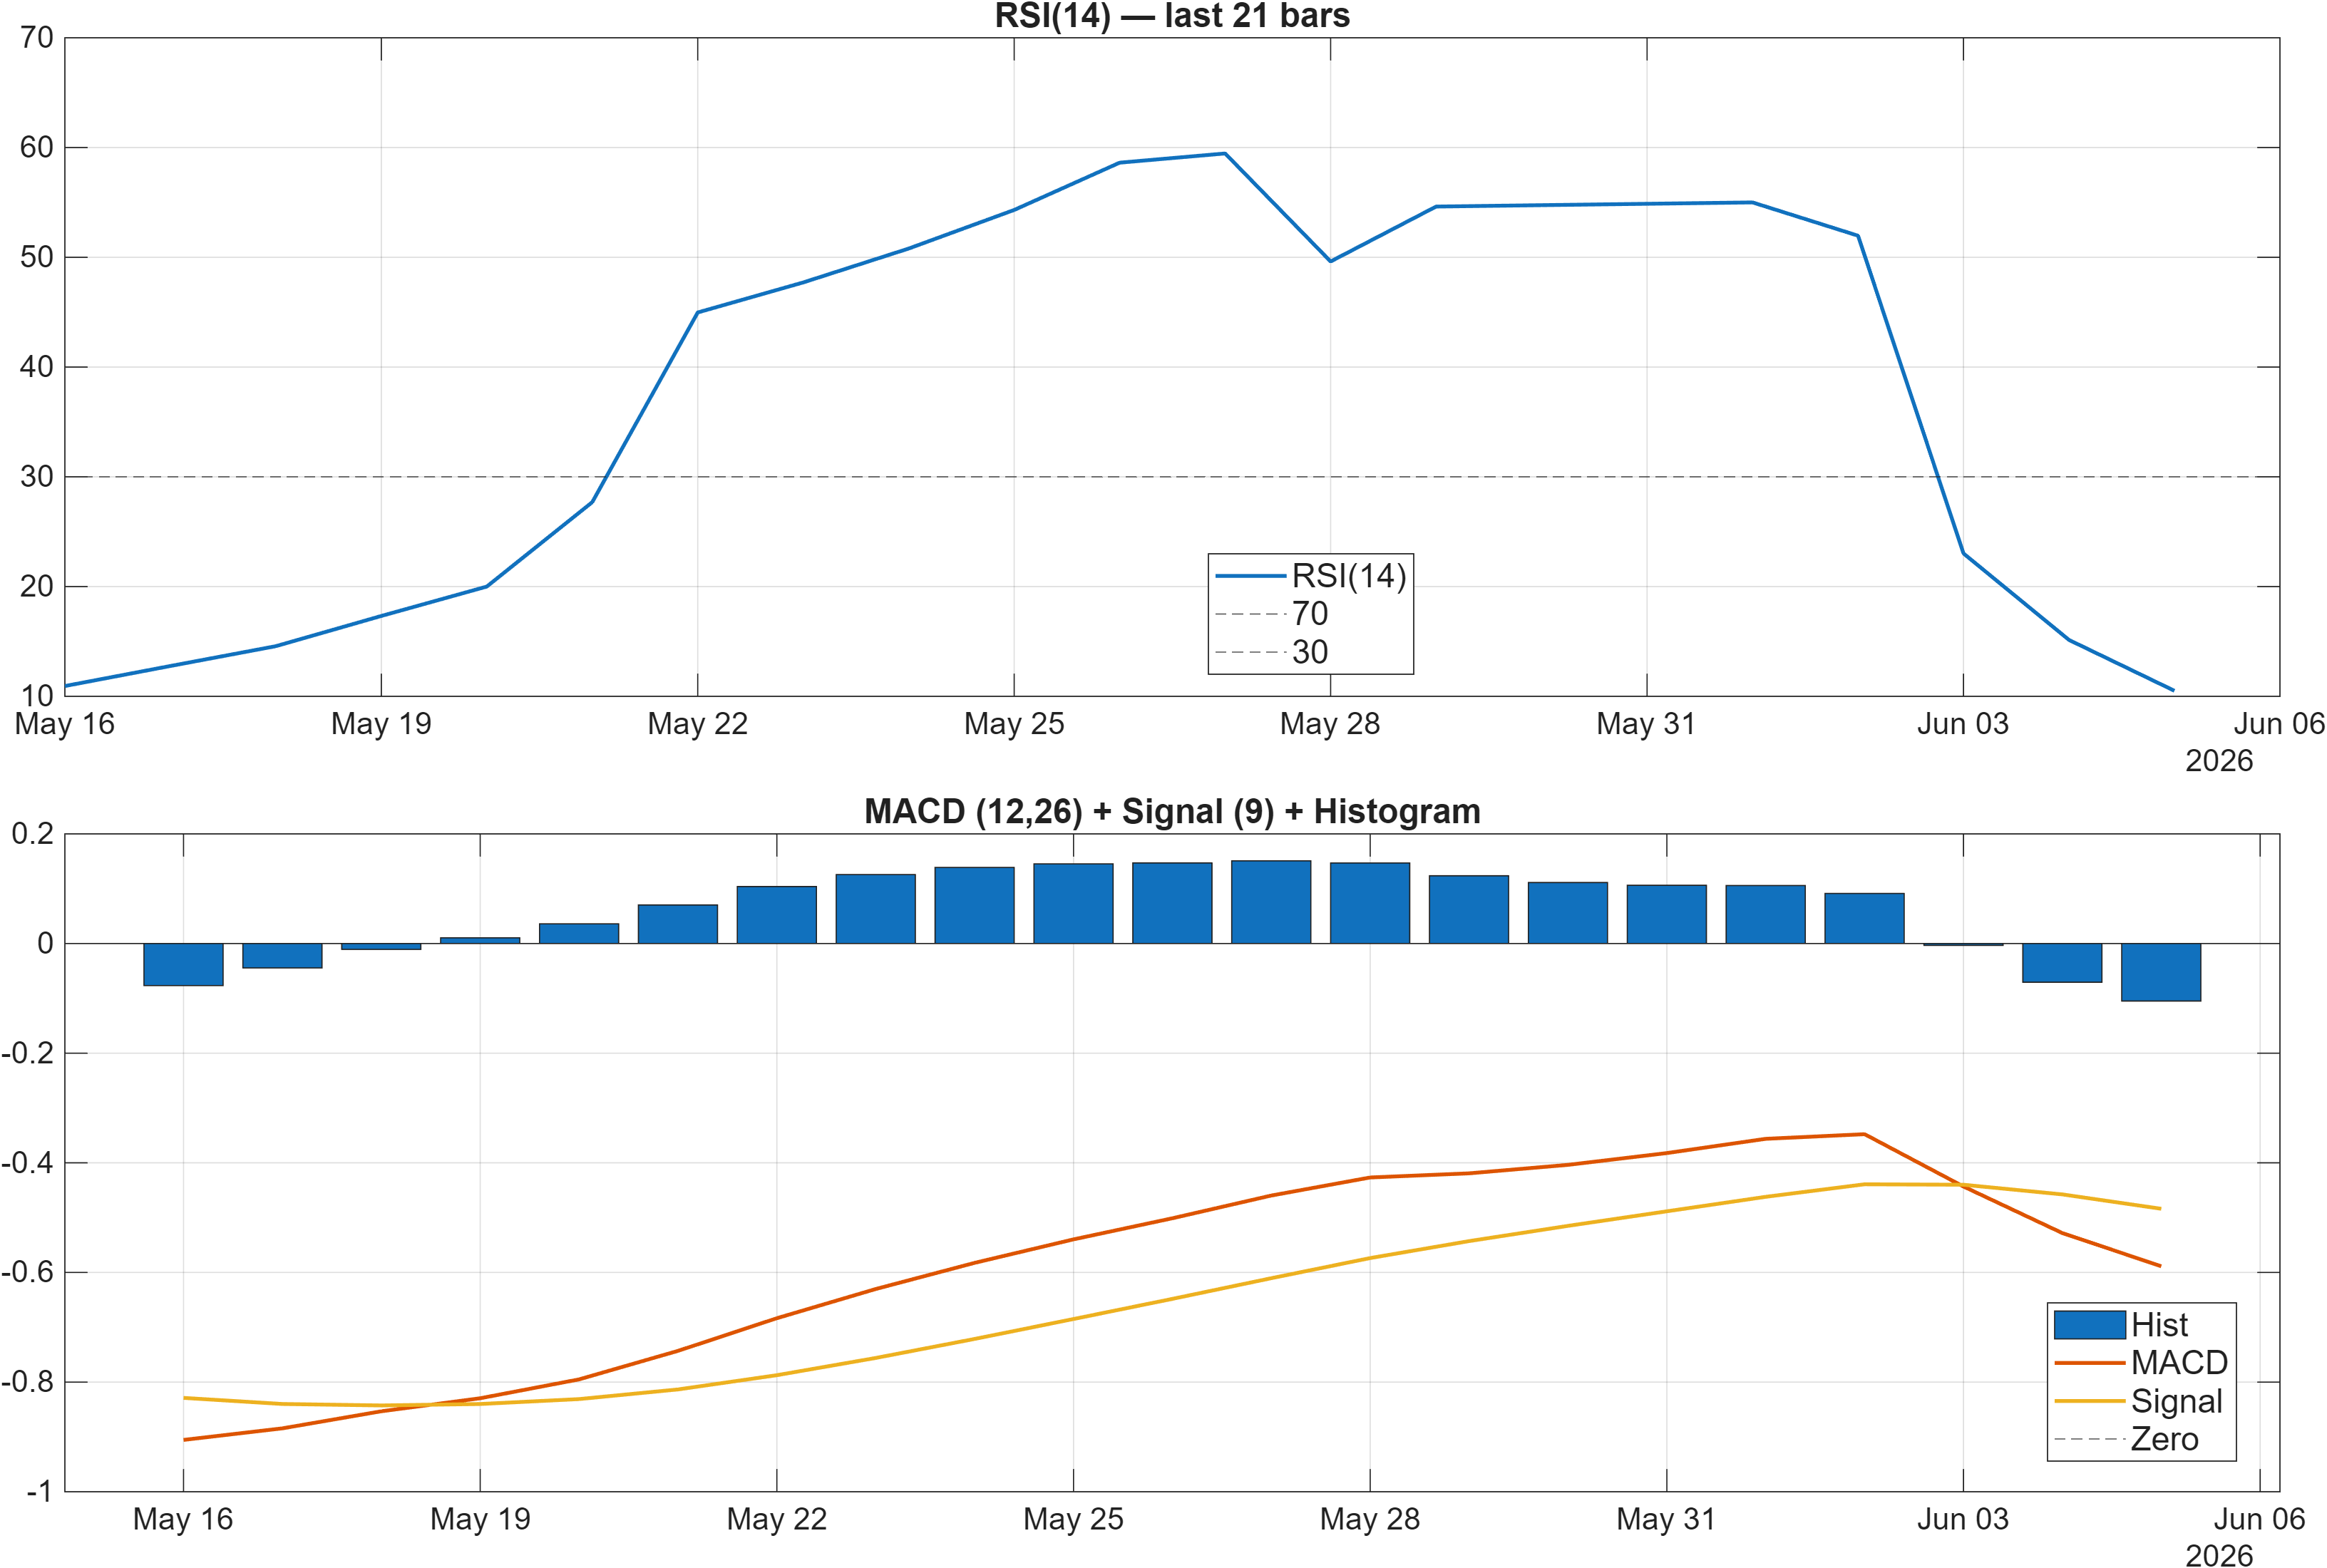
Momentum conditions skew defensive. The RSI layer is explicitly tagged bearish, and the underlying RSI(14) value of 10.5 signals heavily depressed momentum—often seen during sharp selloffs or persistent drift lower. While such readings can coincide with reflex bounces, the model framing remains probabilistic: oversold does not automatically translate into sustained trend reversal, particularly when moving averages are also bearish.
MACD corroborates the weak impulse: the MACD histogram at -0.1049 indicates negative momentum on that measure, consistent with downside pressure remaining present rather than neutralizing. In combination, RSI and MACD suggest the market is still working through a momentum repair process rather than already completing it.
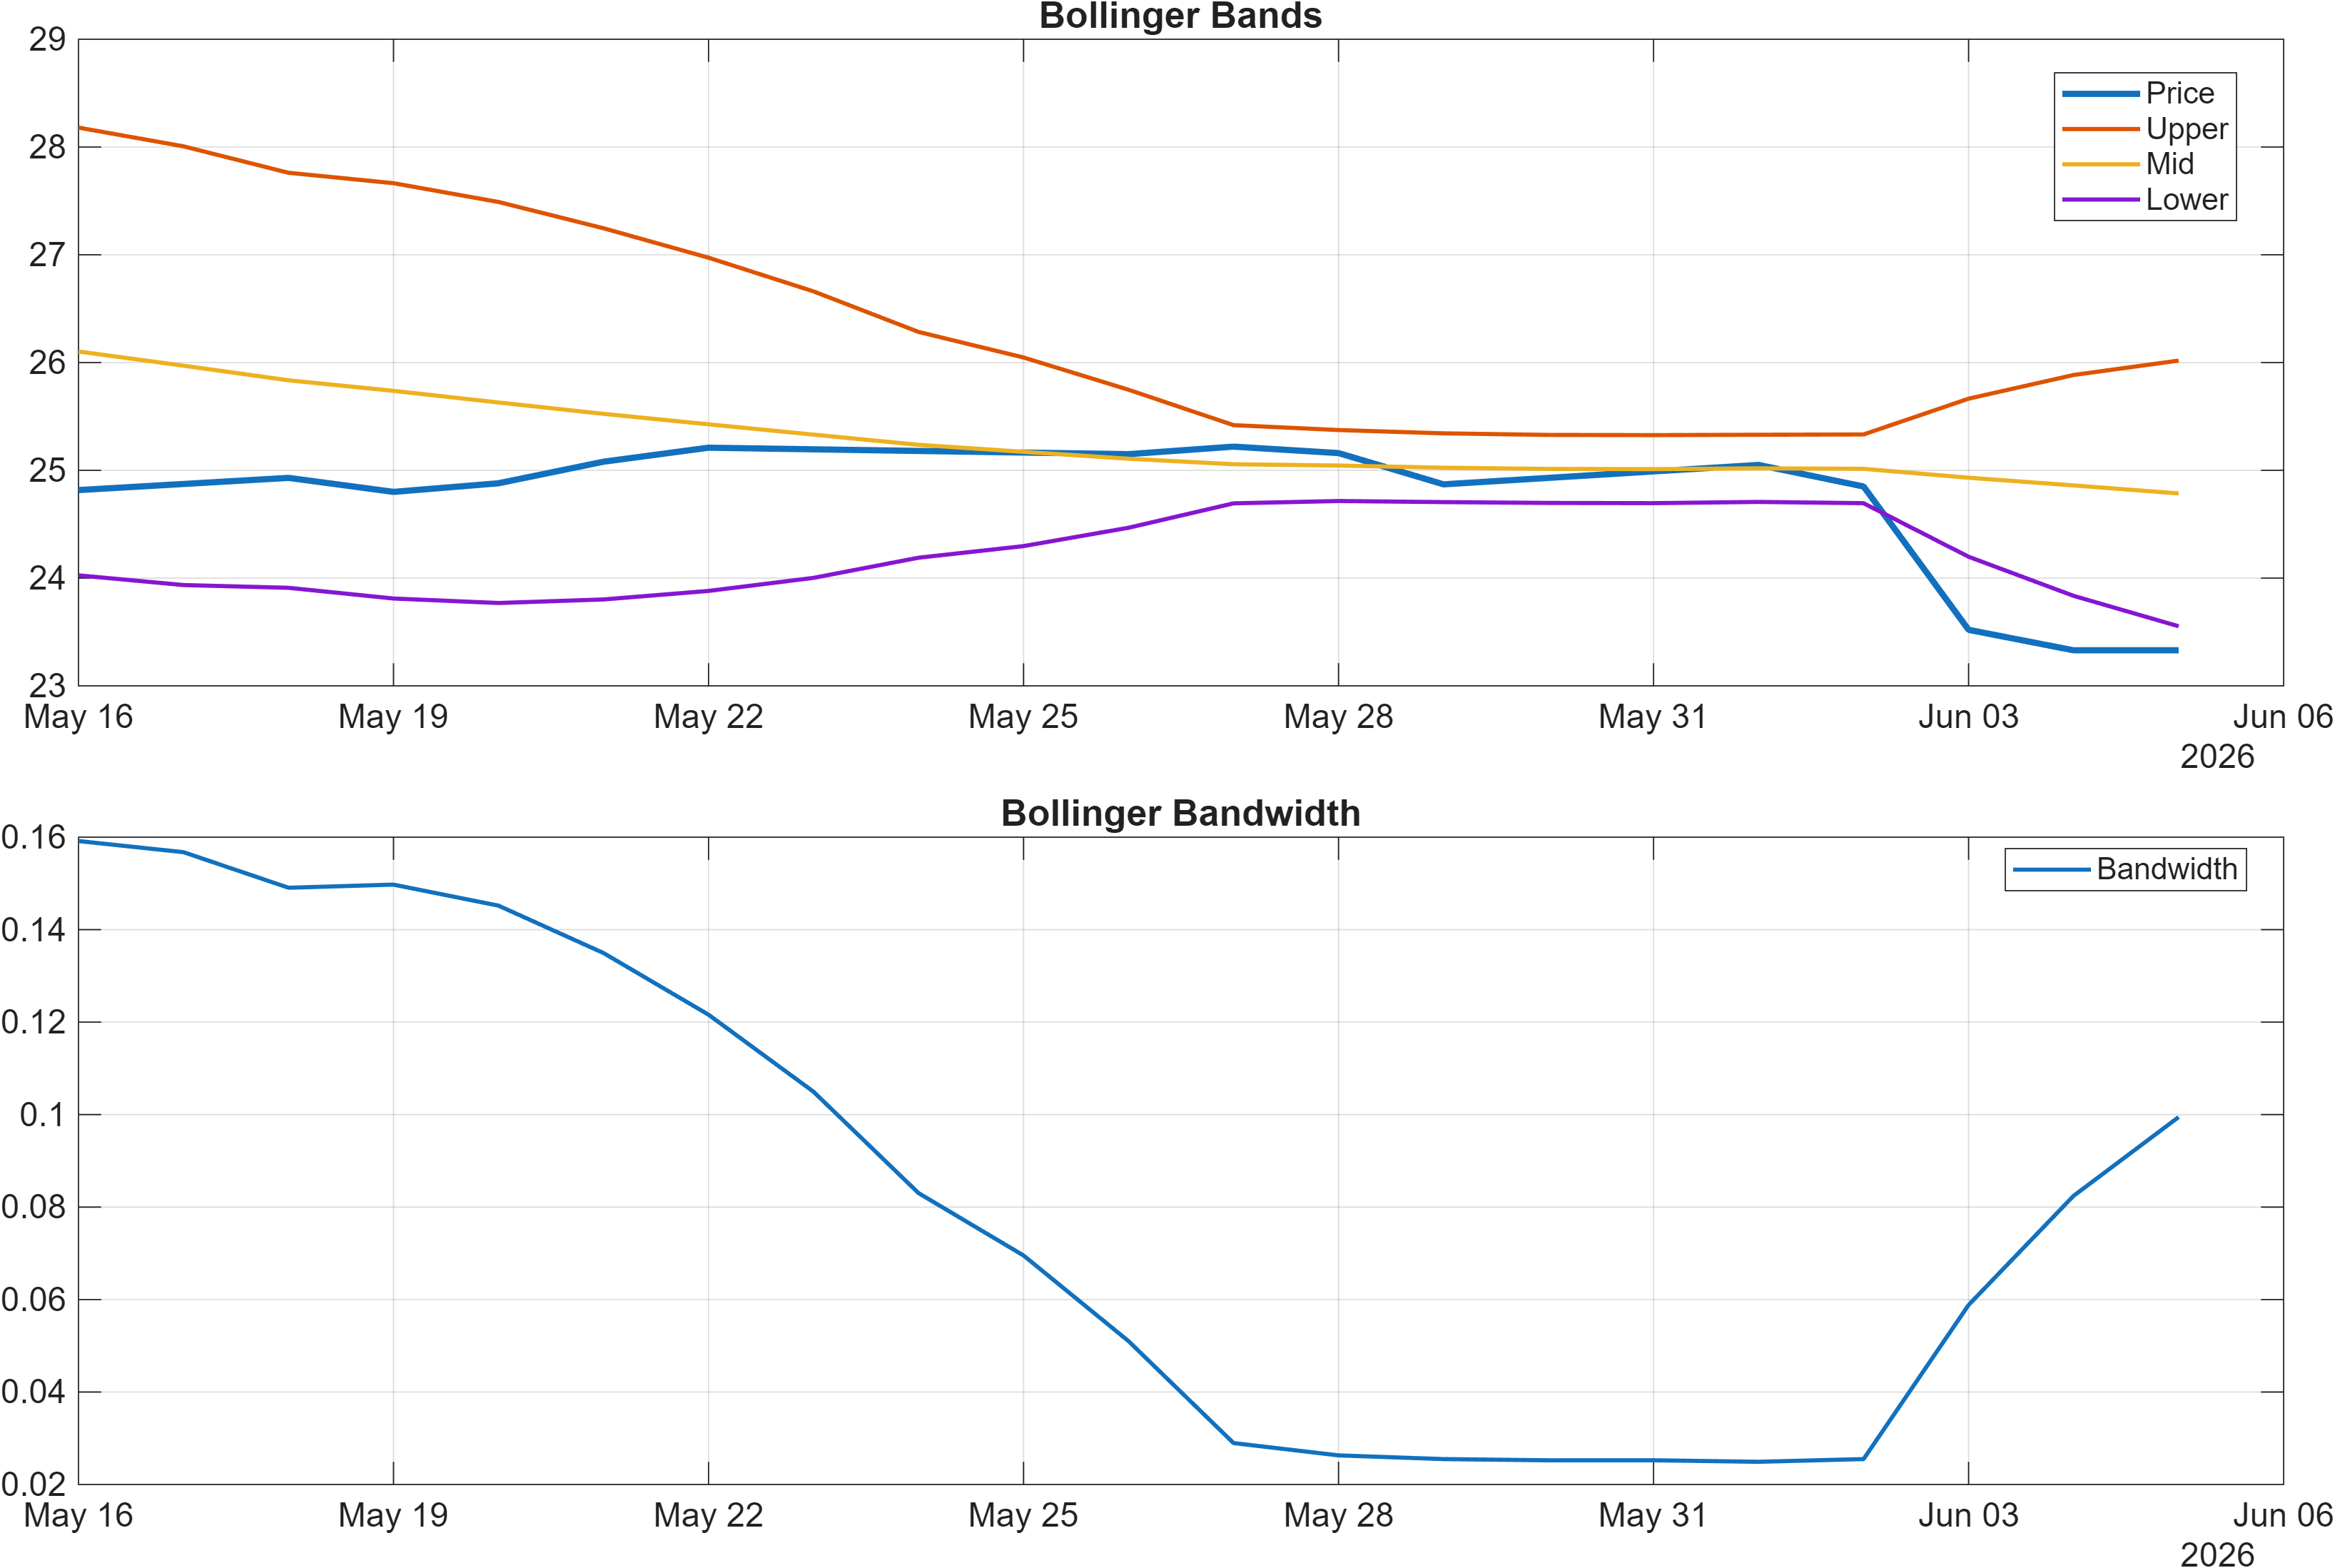
Volatility is informative but not extreme. The Bollinger bandwidth latest is 0.0995, pointing to a regime that is not currently in a dramatic expansion phase. That matters because durable trend transitions often arrive with volatility expansion and sustained directional follow-through; without that, rallies can remain mean-reverting. The implication is a market where momentum is weak but volatility is not signaling a decisive new impulse yet—consistent with the “transitional phase” framing.
Momentum label: Bearish (RSI/MACD) Volatility label: Neutral (bandwidth 0.0995)
4) Support / Resistance zones
Support ~ 24.5867 | Resistance ~ 29.9100
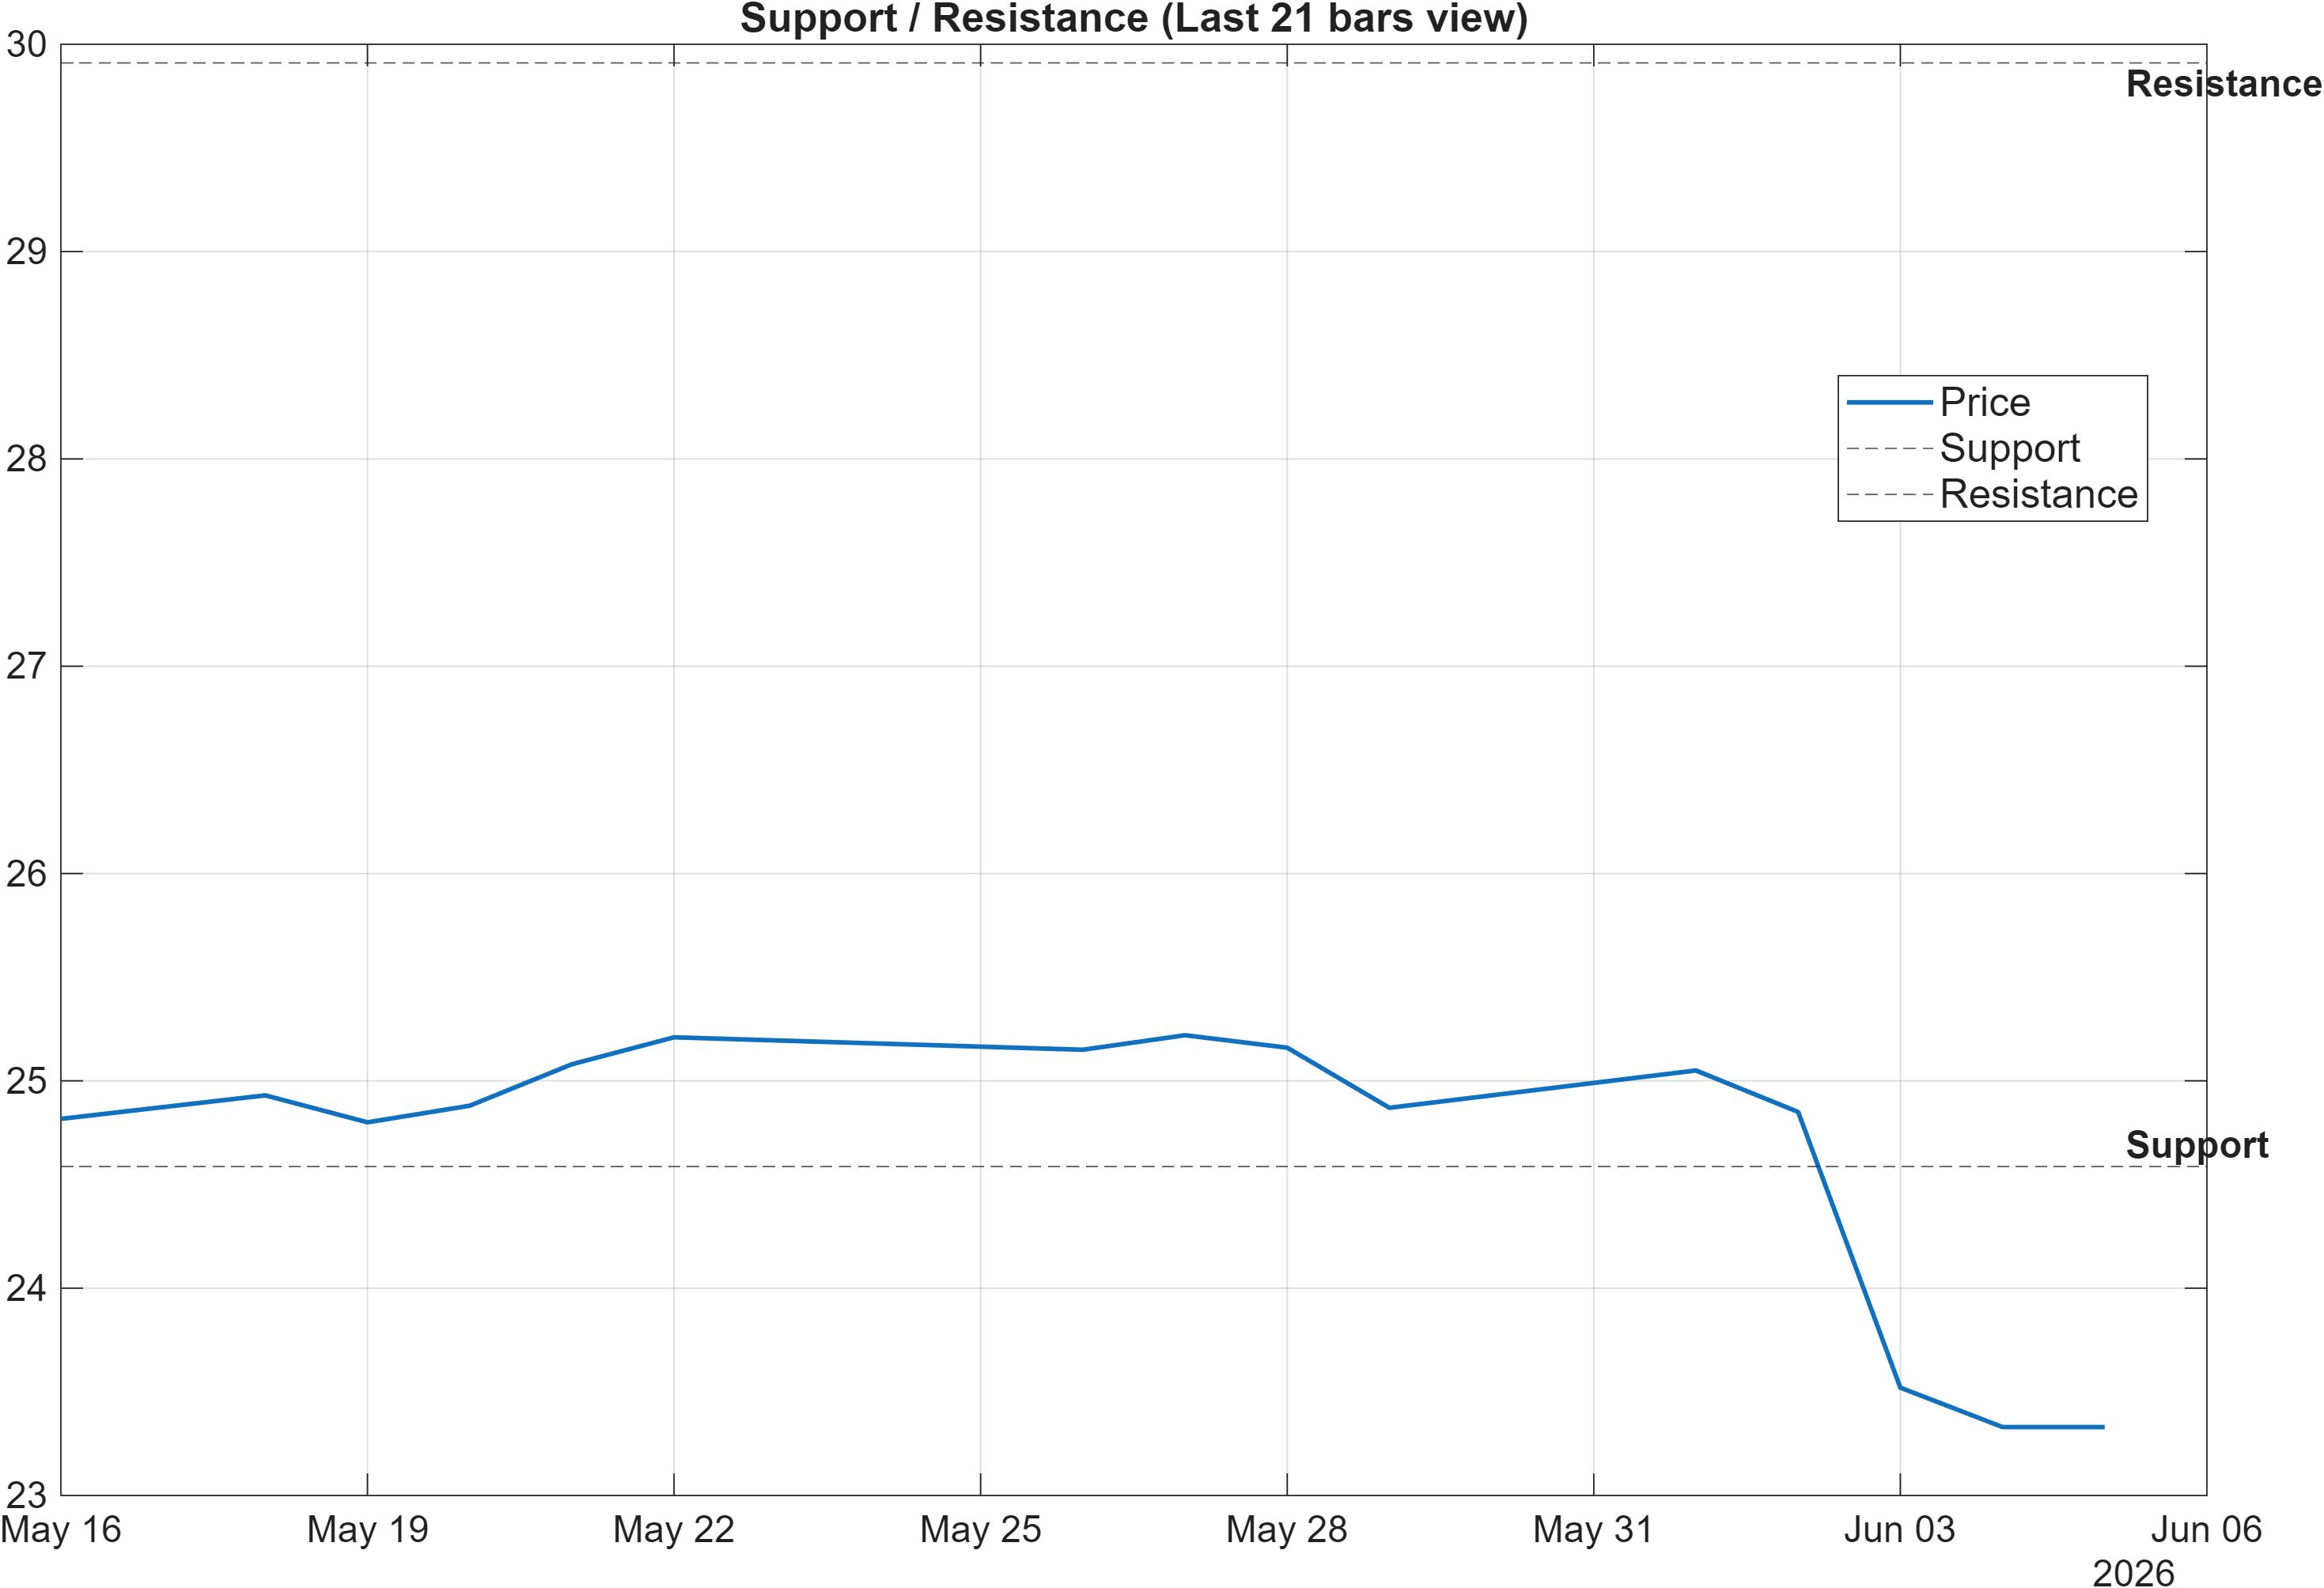
The current setup compresses into two decision zones. On the downside, 24.5867 is the key support reference in this report; with trend and momentum readings bearish (RSI bias bearish; MACD histogram -0.1049), that level functions as the primary line separating “stabilization attempt” from “deterioration risk.” A close below support would align with the existing bearish technical stack and can pressure both short-horizon ranks and the blended technical score.
On the upside, 29.9100 is the resistance threshold that matters for regime repair. Because close vs MA50 is bearish and MA50 vs MA200 is bearish, any advance that fails to reclaim and hold above resistance would still be consistent with a countertrend bounce rather than a transition into a healthier trend state. Conversely, a break above resistance with volume (as the scenario note specifies) would be a higher-quality confirmation that momentum has shifted from merely oversold to improving.
Importantly, these zones also help reconcile the rank split: longer-term ranks are bullish (e.g., yearly #162; 6-monthly #199), but the market likely needs evidence near resistance to justify that constructive profile in price action. Until then, the framework remains one of conditional upside with defined downside risk anchored at support.
Scenario view: Break above resistance with volume → continuation. Close below support → signal deterioration risk.
5) Quant Technical Dashboard (18 Signals)
KGNAI AI Technical Analysis Score (Deep Reinforcement Learning): Rank #1708 out of 2045 (Rank 1 represents the strongest technical positioning and a higher probability of favorable price behavior. As ranks increase toward the maximum, the probability of favorable outcomes weakens and bearish positioning becomes more dominant.) | Label: Bearish | Score: -0.670
18-Signal Technical Confluence Score: -0.444 (Bearish)
Overall Technical Score (18-signal confluence + DRL rank blend): -0.512 (Bearish)
Note: The blended score reflects signal strength weighted against broader AI technical ranking, which may temporarily diverge.
Blended technical score breakdown: -0.512 (Bearish | Bull 4 / Bear 12 / Neutral 2)
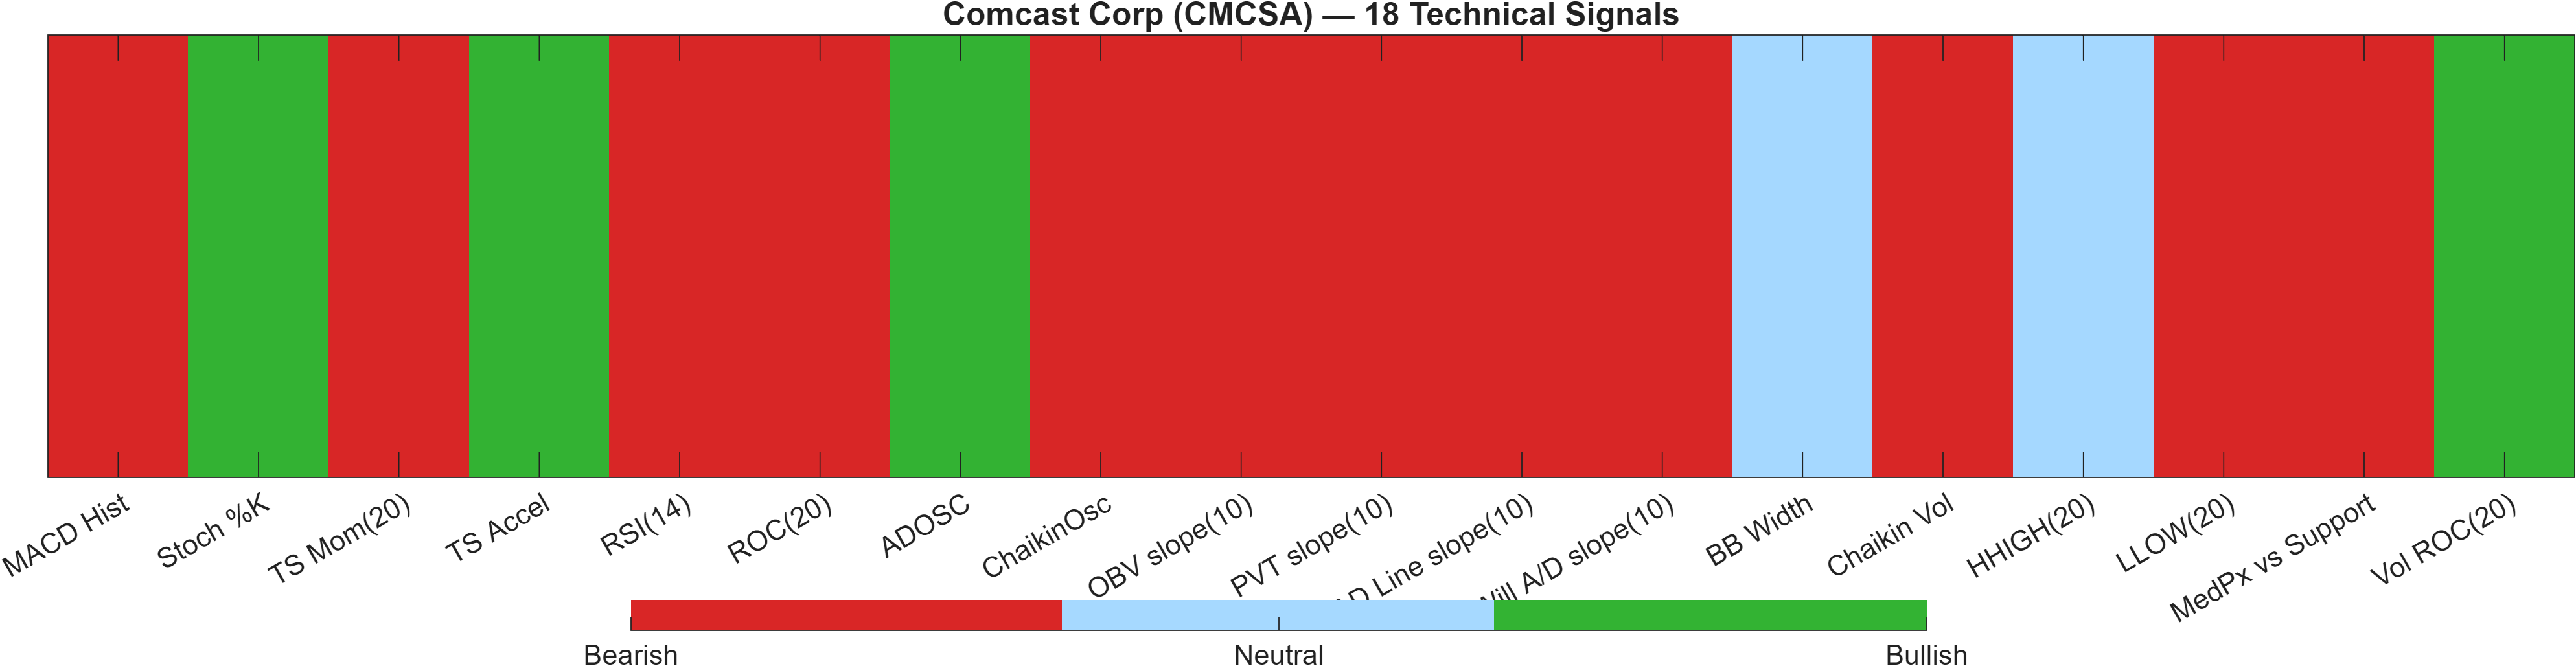
The technical dashboard emphasizes a broad-based bearish skew. The confluence score is -0.444 (Bearish), and the blended overall technical score is -0.512 (Bearish), reflecting that the signal-level picture and the DRL technical rank are directionally aligned. The DRL technical rank at #1708 out of 2045 places CMCSA in the lower portion of the universe on technical positioning, reinforcing that the current market microstructure is unfavorable relative to peers.
The signal mix also matters: Bear 12 / Bull 4 / Neutral 2 implies that isolated bullish readings are present but not dominant enough to define the regime. For example, the Stoch %K at 7.407 is marked bullish (often consistent with oversold conditions), yet the same table flags RSI(14) at 10.5 as bearish and TS Mom(20) at -1.543 as bearish—suggesting that any bounce signals are occurring inside a momentum backdrop that remains weak.
Volume/flow indicators lean negative overall: entries such as OBV slope(10) at -5.956e+07 and PVT slope(10) at -3.188e+06 are bearish, indicating distribution pressure or lack of persistent accumulation. While Vol ROC(20) at 30.77 is bullish, it is better read as “activity is rising” than as confirmation of directional control—particularly with MACD histogram at -0.1049 still negative.
Signal table (Bull/Bear/Neutral)
| Indicator | Value | Signal |
|---|---|---|
| MACD Hist | -0.1049 | Bearish |
| Stoch %K | 7.407 | Bullish |
| TS Mom(20) | -1.543 | Bearish |
| TS Accel | 1.223 | Bullish |
| RSI(14) | 10.5 | Bearish |
| ROC(20) | -6.205 | Bearish |
| ADOSC | 21.87 | Bullish |
| ChaikinOsc | -3.165e+07 | Bearish |
| OBV slope(10) | -5.956e+07 | Bearish |
| PVT slope(10) | -3.188e+06 | Bearish |
| AD Line slope(10) | -8.414e+07 | Bearish |
| Will A/D slope(10) | -1.79 | Bearish |
| BB Width | 0.09946 | Neutral |
| Chaikin Vol | 26.67 | Bearish |
| HHIGH(20) | 25.83 | Neutral |
| LLOW(20) | 23.13 | Bearish |
| MedPx vs Support | -0.8967 | Bearish |
| Vol ROC(20) | 30.77 | Bullish |
Interpretation: Indicator-level signals form the base confluence, which is then adjusted using a separate AI-driven technical ranking model. The final technical score summarizes this combined view.
6) News sentiment + extractive gist
Sentiment score (avg): 0.028 | Positive: 13% | Neutral: 87% | Negative: 0%
KGNAI AI News Sentiment Score (normalized -1 to +1): 0.99 (as of 2026-06-04) | Label: Bullish | Overall news score: 0.93
Positive Developments
Recent coverage across major financial outlets indicates a constructive narrative focused on capital structure actions and longer-cycle investment initiatives. The reported completion of cash tender activity—accepting about US$4.11 billion of notes after a cap increase to US$4.14 billion—is framed as balance-sheet management rather than a purely tactical move. Separately, commentary highlights a multibillion-dollar commitment to a UK theme-park build, described in coverage as an investment of over 8 billion (currency not standardized in the provided text) and elsewhere referenced as more than $6.71 billion. In addition, network expansion discussion (e.g., connectivity buildouts targeting more than 50,000 additional homes and businesses) reinforces an operational storyline that extends beyond one-off events. The net effect is a sentiment backdrop that is supportive at the model level, even while price-based indicators remain under pressure.
Neutral / Mixed Developments
The dominant tone in the news mix is informational rather than directional, consistent with the distribution of 87% neutral items and a modest 0.028 average sentiment score. A recurring theme is CMCSA being discussed alongside peers in broad market context, including mentions of stocks printing or approaching 52-week lows during a wider consumer-oriented drawdown. That framing can dilute single-name interpretation: the coverage is less about a CMCSA-specific catalyst and more about situating the stock within a risk-off tape. Meanwhile, corporate actions and strategic projects are presented as ongoing developments that may take time to translate into observable market behavior. This “wait-and-see” posture aligns with the report’s neutral short- and mid-term ranks (daily #1282; 3-monthly #1150), suggesting that the market is still processing information without clear technical confirmation.
Negative / Risk Signals
The key risk signal is the dissonance between upbeat narrative elements and stressed technical conditions. Even with a bullish normalized sentiment score of 0.99 and 0% negative items in the sentiment breakdown, the tape has been characterized in coverage as weak enough to drive 52-week-low references. From an execution standpoint, this matters because negative price behavior can persist despite constructive headlines when liquidity and positioning are aligned against the trend. The technical layer reinforces that caution: moving-average filters are bearish, and momentum remains depressed (RSI(14) 10.5; MACD histogram -0.1049). In this context, “risk” is less about any single news item and more about the possibility that positive developments fail to generate sustained demand before support at 24.5867 is challenged.
What to monitor next
- Whether price holds above 24.5867 during any renewed market weakness.
- Whether a rally can clear 29.9100 with confirming volume, consistent with the scenario trigger.
- Whether momentum repair emerges via improving MACD histogram (currently -0.1049) alongside stabilization in RSI.
Snapshot: AI Rank (Short–Mid–Long): Mixed (Neutral–Neutral–Bullish) · Technical Confluence: Bearish · Key Levels: Support ~24.59 | Resistance ~29.91 · News Sentiment: Neutral
Sources referenced: Reuters, Bloomberg, Yahoo Finance, MarketWatch, Investing.com
7) Sources
Not available in the provided data.
You may also like: How KGNAI AI ranks instruments across global markets
Disclaimer: KGNAI provides AI-generated analytics and educational market commentary only. This is not financial advice. Markets involve risk. Always do your own research.