
OSCR (Oscar Health Inc) — 03-Jun-2026 Technical & Rank Review: Bearish Cross-Sectional Positioning with Mixed Signal Confluence
This OSCR (Oscar Health Inc) snapshot as of 03-Jun-2026 evaluates current alignment across KGNAI ranks, price structure, momentum/volatility indicators, and systematically processed news sentiment. The cross-sectional rank profile is highly unfavorable in the tracked 2045-instrument universe, placing OSCR near the weakest tail on the daily and weekly horizons. Technically, the dashboard is not uniformly bearish: the 18-signal confluence score of -0.222 (Neutral) contrasts with a blended technical score of -0.360 (Bearish), indicating that higher-level ranking pressure is outweighing pockets of indicator-level support. Momentum readings remain stressed (notably RSI(14) at 29.79 and MACD histogram at -0.3662), while volatility sits in a moderate regime (Bollinger bandwidth 0.1961). Key decision zones are defined by support ~14.1775 and resistance ~24.2000. News tone is statistically positive (normalized score 0.99) but should be treated as contextual rather than confirmatory.
- Rank stance: Short Bearish | Mid Bearish | Long Not available
- Technical confluence: Neutral (18-signal: -0.222), but blended technical view Bearish (-0.360)
- Key levels: Support ~ 14.1775 | Resistance ~ 24.2000
- News sentiment bias: Statistically positive (0.99 normalized), while headline mix remains largely neutral (64% neutral)
- Confirmation / invalidation: A sustained push above 24.2000 with volume supports continuation risk-on; a decisive close below 14.1775 elevates deterioration risk
KGNAI evaluates assets using large cross-sectional datasets built from millions of structured data points. Inputs incorporate fundamental metrics, technical structures, and systematically processed news sentiment. Statistical models, machine learning, and AI frameworks are used to assess relative positioning, signal alignment, and probabilistic behavior across broad universes.
- Ranks are comparative across the tracked universe, not absolute price targets.
- Confluence reflects alignment among independent signal groups.
- Support/resistance levels are probabilistic decision zones, not guarantees.
- Sentiment provides contextual bias within the broader analytical framework.
1) KGNAI AI Analysis
Region: USA
Total universe size: 2045 ranked instruments
- Daily rank: #2043 out of 2045 — Bearish
- Weekly rank: #2028 out of 2045 — Bearish
- Monthly rank: #2011 out of 2045 — Bearish
- 3-Monthly rank: #1888 out of 2045 — Bearish
- 6-Monthly rank: Not available for this horizon — Not available
- Yearly rank: Not available for this horizon — Not available
Cross-sectional positioning vs. time horizon
OSCR’s placement is concentrated in the weakest tail of the universe on the horizons that are available. A daily rank of #2043 (out of 2045) is effectively bottom-decile by any practical cross-sectional framing, and the weekly rank of #2028 shows that this is not confined to a single session’s noise. The monthly rank of #2011 reinforces persistence: multiple independent windows are registering weak relative behavior at the same time.
The medium-short horizon slope is also informative: while the 3-month rank improves to #1888, it remains in the lower tail, suggesting that any earlier strength is not currently dominating the present regime. In other words, the model is not detecting a clean recovery sequence; it is detecting less-bad positioning over longer lookbacks while the nearer-term windows stay heavily pressured.
The 6-month and yearly ranks are not available in the provided data, which limits long-horizon regime classification. As a result, the practical read is that OSCR is currently a Bearish short- and mid-term instrument in KGNAI’s universe, with long-term inference explicitly constrained by missing horizon coverage.
The objective here is alignment measurement rather than directional forecasting; ranks characterize relative positioning and behavioral probabilities under comparable conditions, not guaranteed outcomes.
2) Price & trend overview
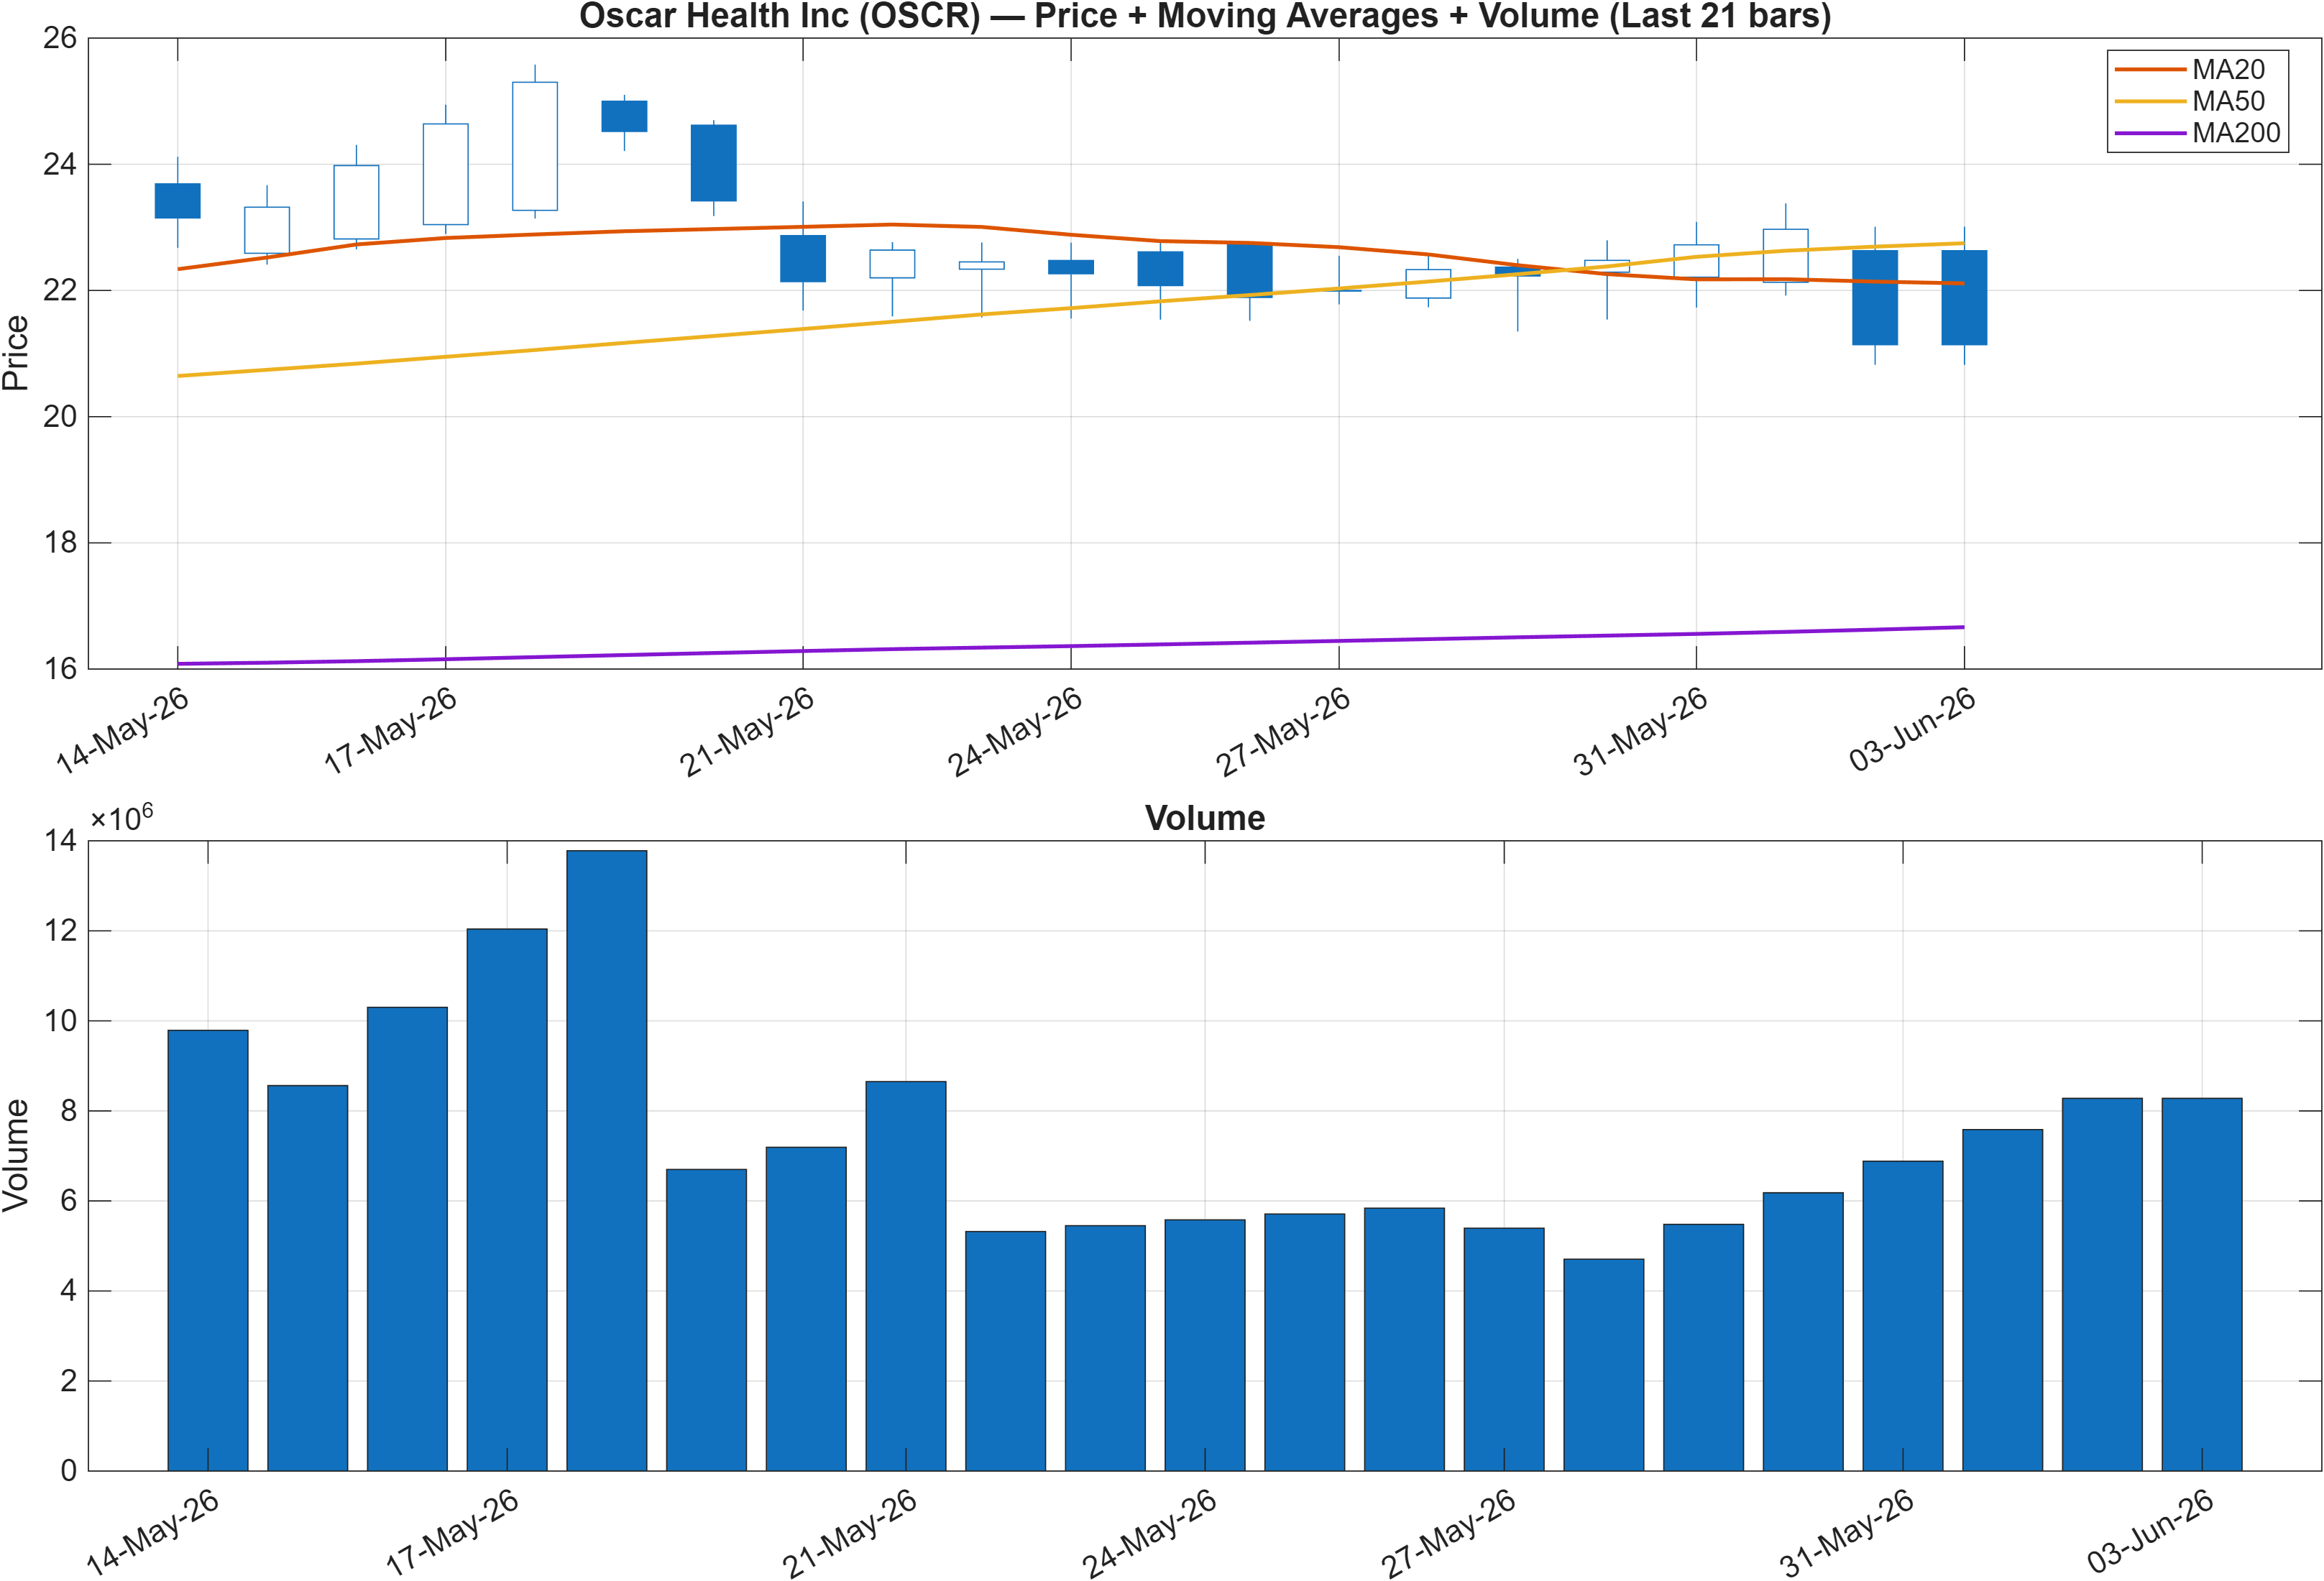
Trend state: short-term pressure inside a longer-term crossover structure
The moving-average configuration is a classic example of timeframe divergence. On the one hand, the interpretation flags Close vs MA50 = Bearish, implying that recent price action is trading below its intermediate trend proxy and that rallies may be encountering supply before establishing traction. On the other hand, MA50 vs MA200 = Bullish indicates a longer-horizon constructive crossover remains intact.
This combination often behaves like a trend under repair rather than a clean trend reversal: the longer-term structure can remain supportive, but the shorter-term tape can still impose drawdowns and failed bounces. In that context, it is consistent to see OSCR score poorly in cross-sectional ranks even while a higher timeframe MA relationship has not fully rolled over.
The practical analytical question becomes whether the short-term weakness is simply a pullback within a broader structure or an early stage of breakdown. KGNAI’s rank stack leaning heavily bearish (e.g., #2043 daily, #2028 weekly) suggests the market is currently rewarding other instruments more consistently than OSCR, regardless of the remaining MA50/MA200 support.
This is also where volume (as visualized in Figure 1) matters qualitatively: follow-through above resistance tends to require participation, while drift lower on rising activity can validate distribution. The figure provides the context, while the confirmation levels are formalized in the support/resistance section.
3) Momentum & volatility dashboard
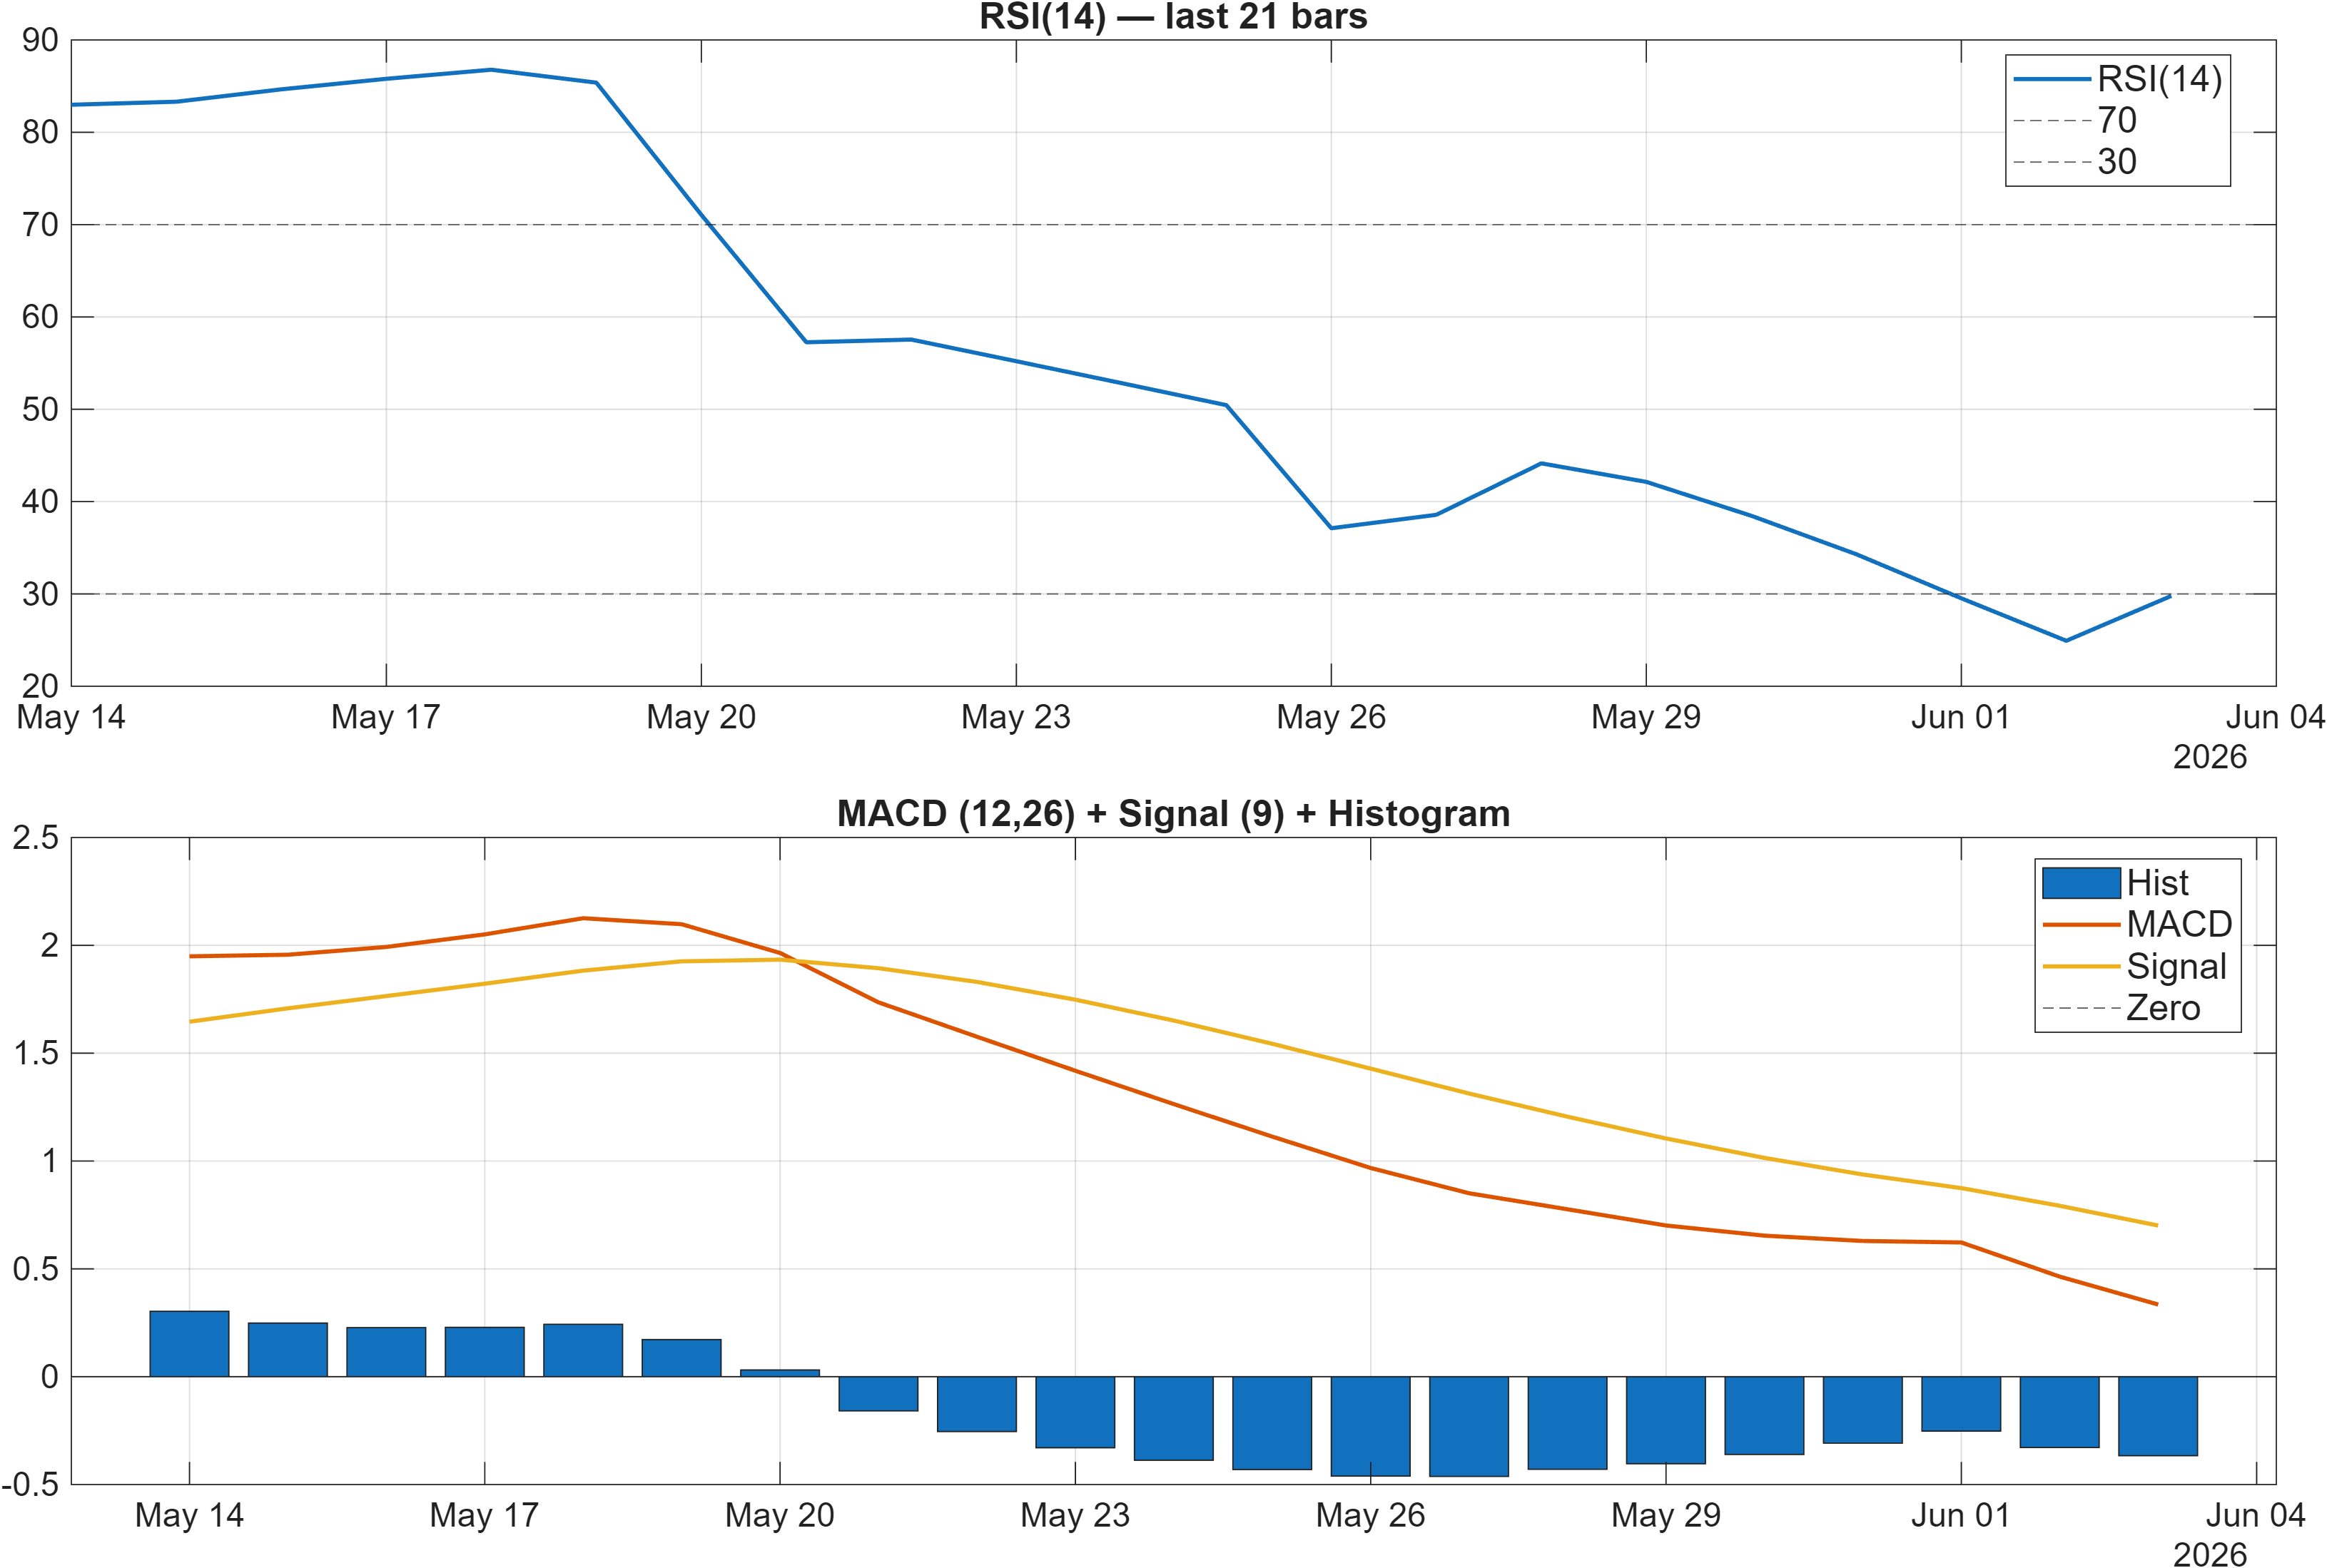
Interpretation: RSI bias = Bearish, MACD hist = -0.3662.
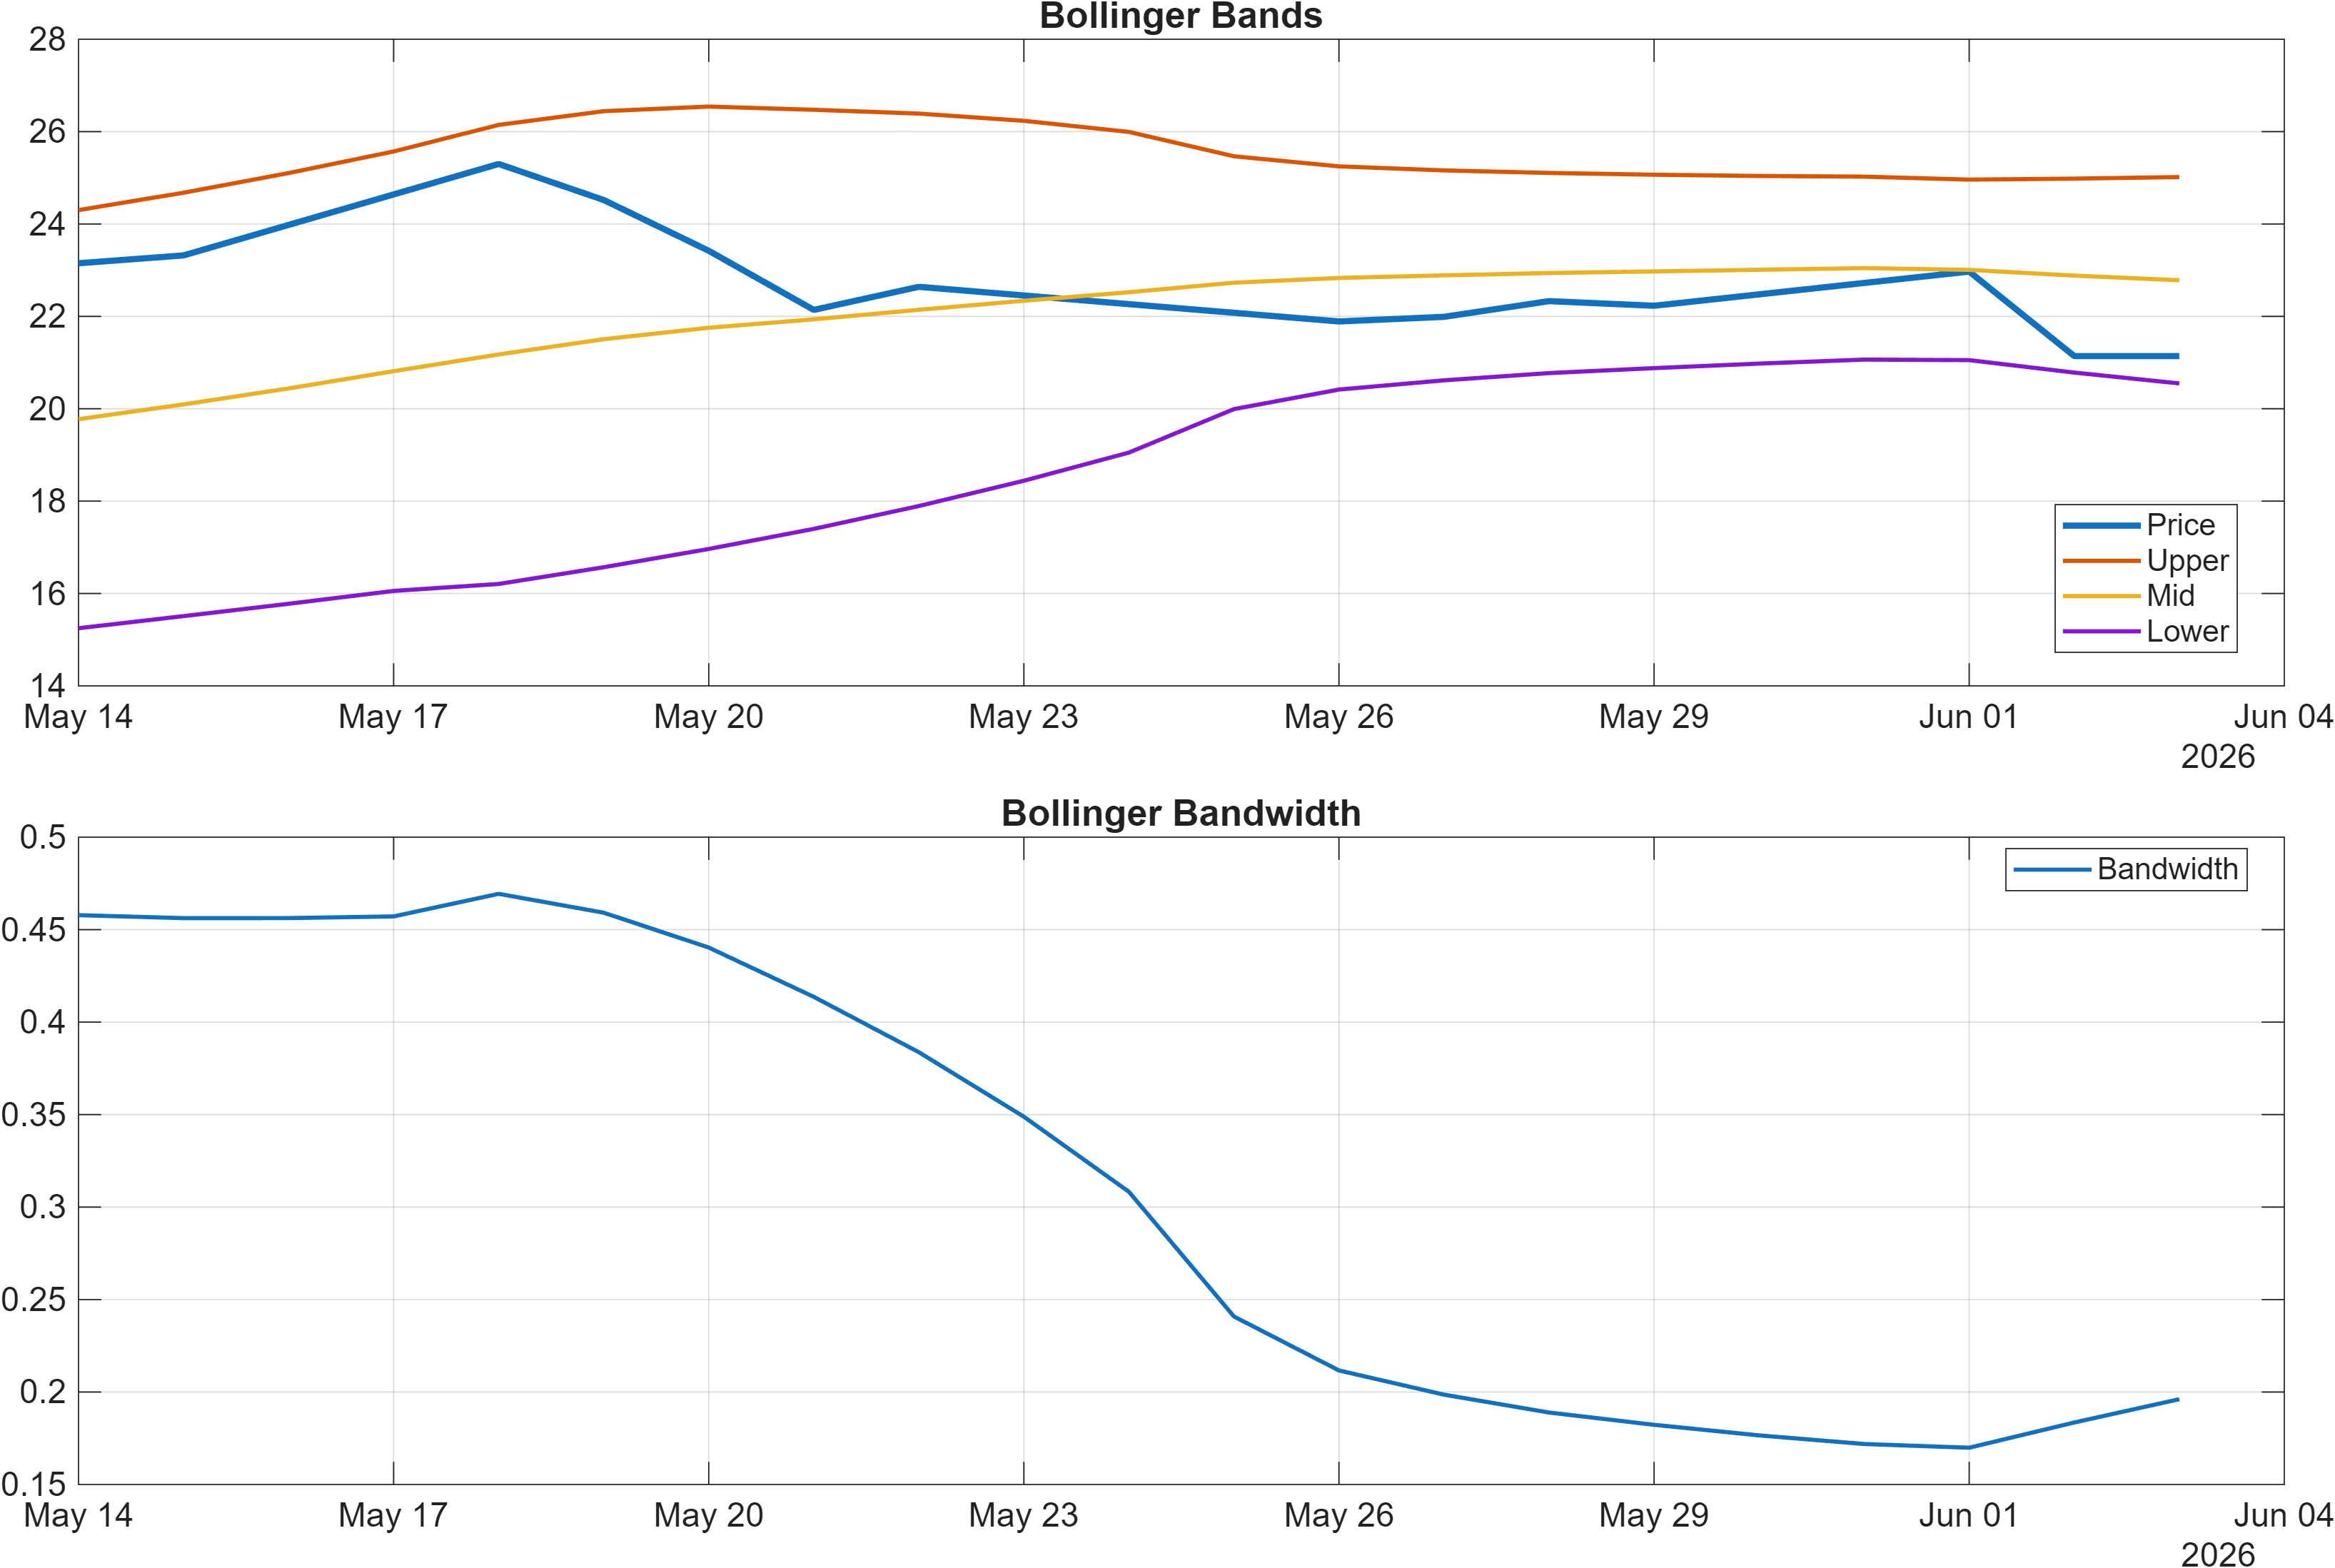
Interpretation: Bandwidth (volatility regime) latest = 0.1961.
Momentum stress vs. volatility regime
OSCR’s momentum indicators point to downside pressure that is not yet clearly resolving. The RSI(14) at 29.79 sits in a depressed zone, consistent with the dashboard’s bearish RSI bias. While low RSI can sometimes coincide with late-stage selling, KGNAI treats it as a condition—not a reversal signal on its own—especially when trend/rank context remains weak.
The MACD histogram at -0.3662 reinforces negative momentum: it indicates bearish impulse relative to the MACD signal line, and it aligns with the broader short-horizon ranks that sit near the bottom of the universe. In combination, RSI and MACD suggest the tape has not established a durable positive momentum base.
Volatility provides a different lens. With Bollinger bandwidth at 0.1961, the regime is neither extremely compressed nor in a clear volatility blowout based on the single provided value. That matters because momentum transitions are often most tradable when volatility expands after a compression phase. Here, the volatility read is better interpreted as room for movement rather than a definitive squeeze setup.
Taken together, the dashboard points to a market state where momentum is weak and volatility is moderate. This combination often produces choppy rebounds that struggle to convert into trend unless confirmation emerges at key levels and is supported by improving breadth/volume proxies (which the technical dashboard partially addresses through accumulation/distribution-type signals).
4) Support / Resistance zones
Support ~ 14.1775 | Resistance ~ 24.2000
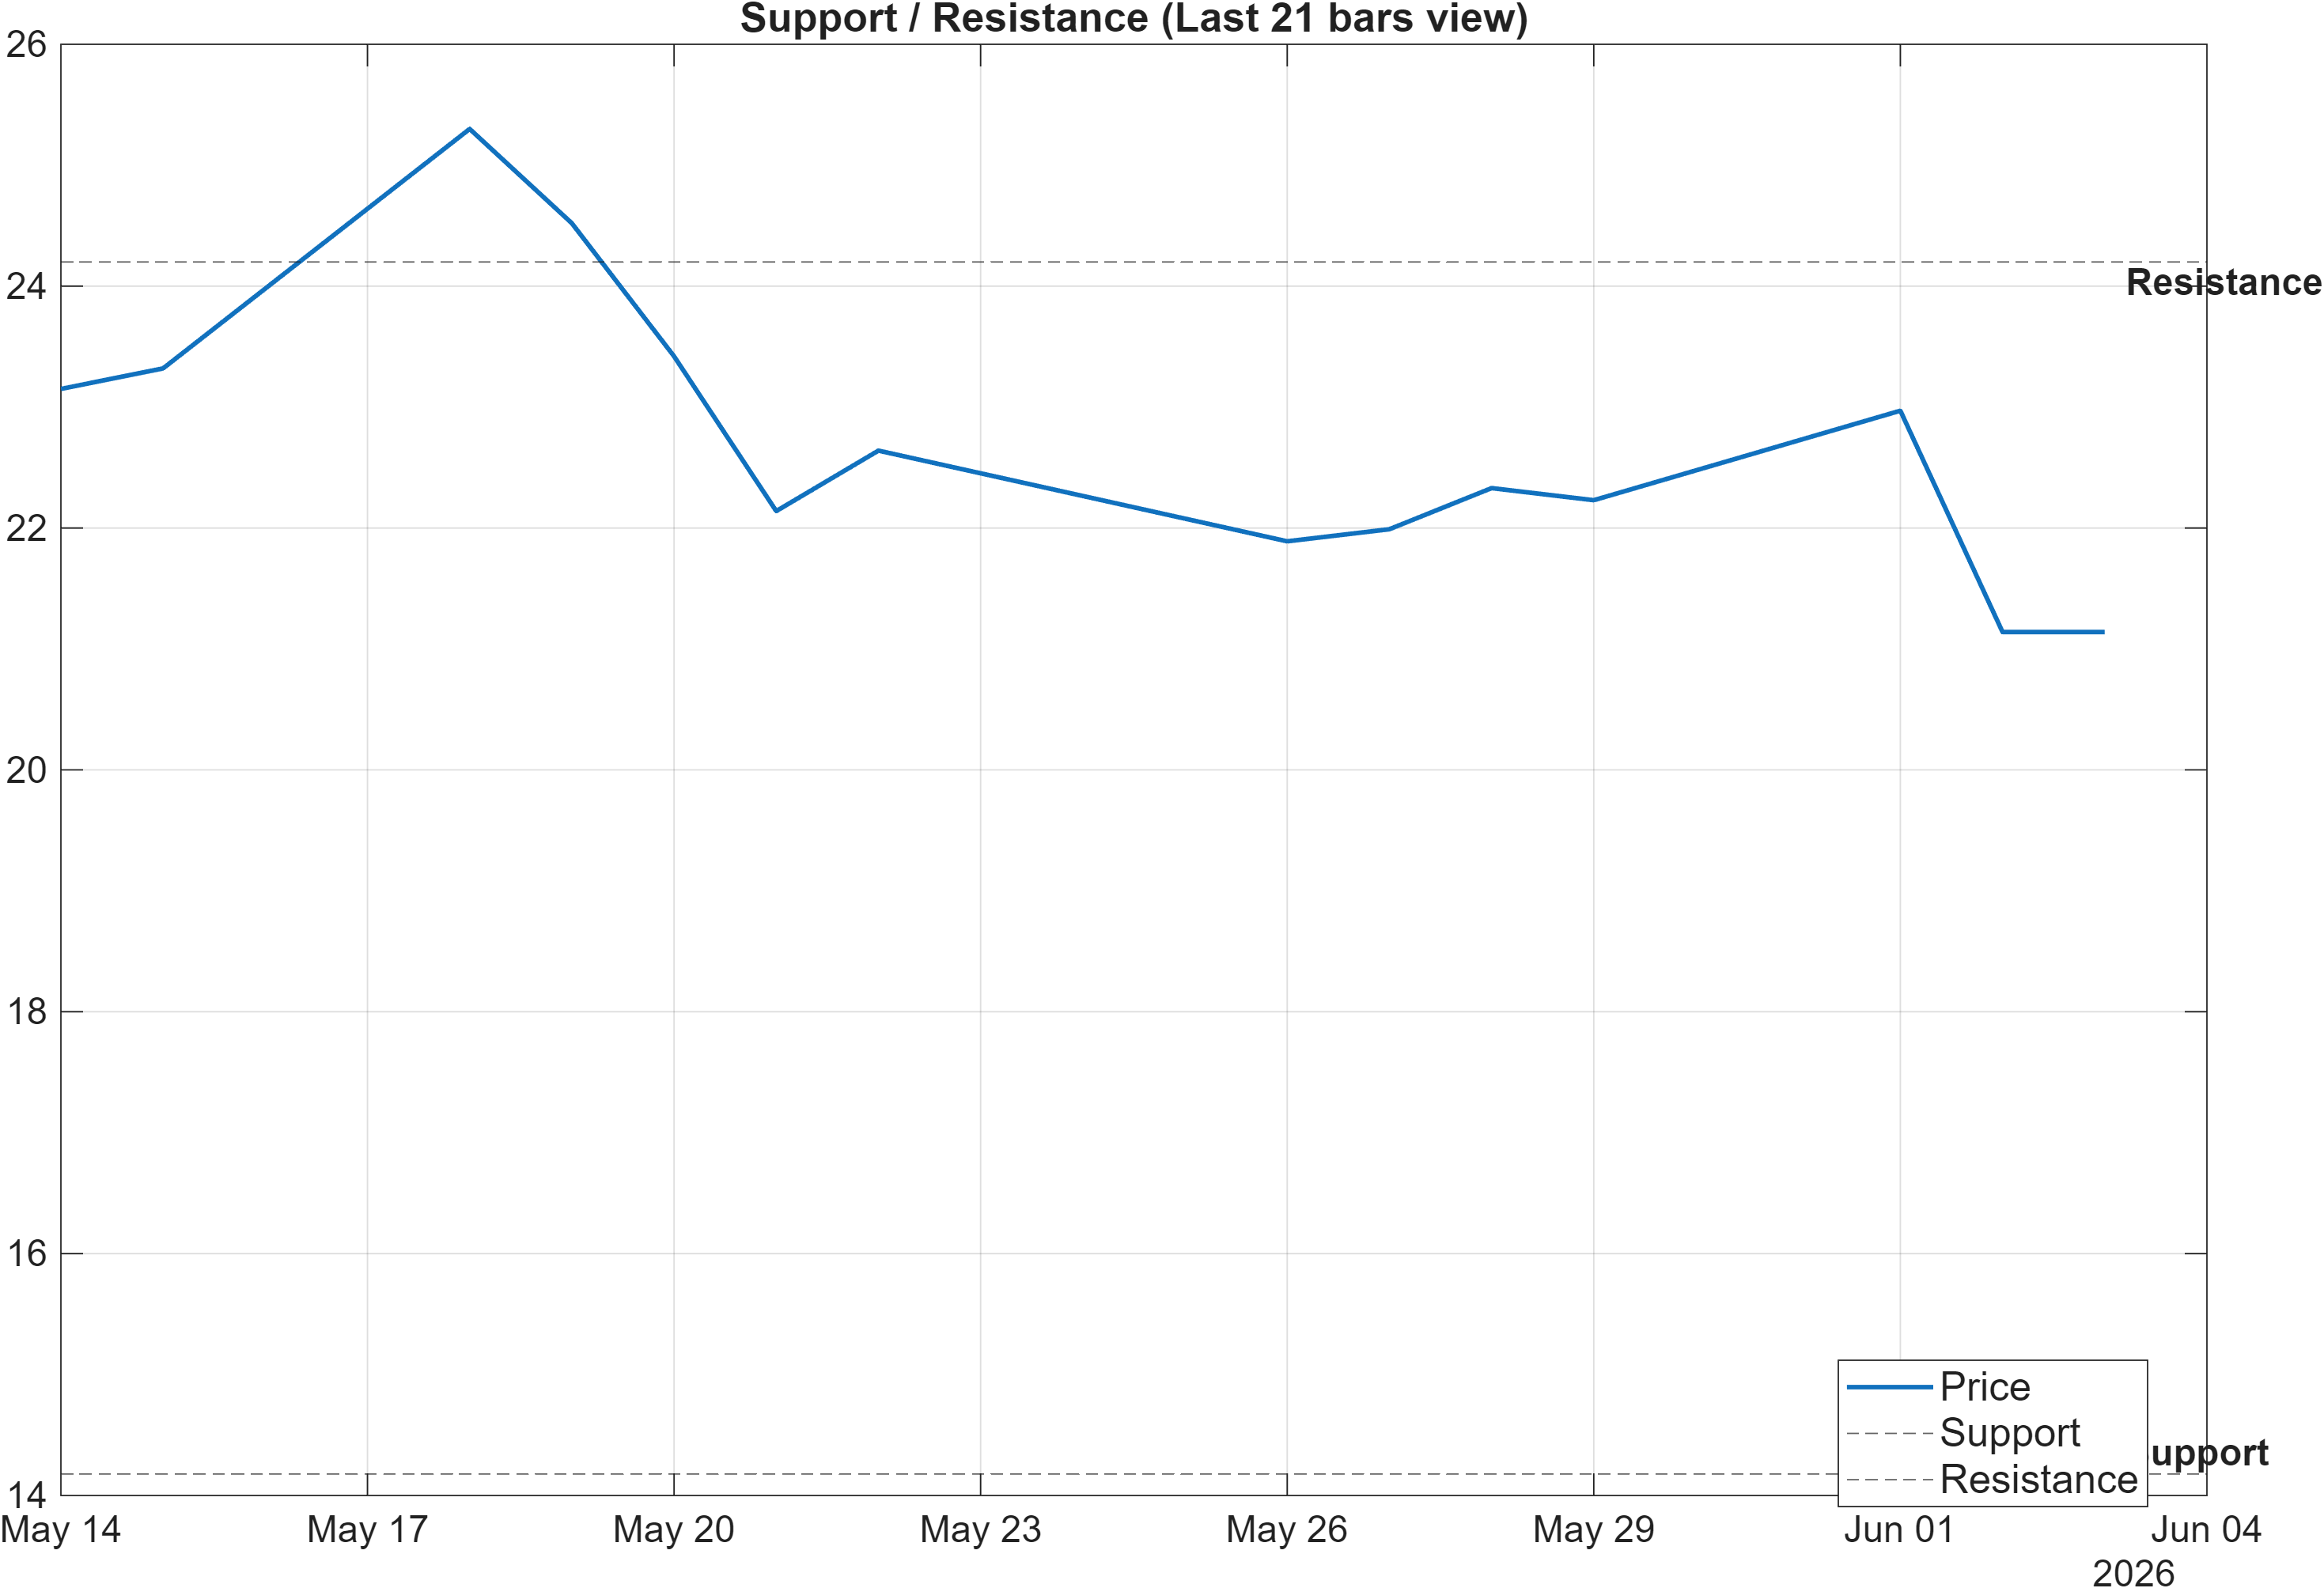
Scenario view: Break above resistance with volume → continuation. Close below support → signal deterioration risk.
Decision zones: validation vs. deterioration thresholds
The support/resistance framework is the most practical way to translate a mixed indicator set into observable thresholds. For OSCR, the primary zones are support near 14.1775 and resistance near 24.2000. With short- and mid-term ranks positioned near the bottom of the universe (e.g., #2043 daily and #2028 weekly), the burden of proof typically shifts toward upside confirmation rather than assuming mean reversion will persist.
A break above 24.2000 with volume is framed as continuation in the provided scenario logic. Analytically, that level also acts as a stress test for the bearish rank profile: the market would need to demonstrate sufficient demand to overcome a pre-defined supply zone while momentum indicators (like MACD histogram -0.3662) begin to stabilize.
On the downside, a close below 14.1775 is treated as deterioration risk. This is not a prediction of what will happen next; it is a conditional that helps separate controlled weakness from structural breakdown. In regimes where RSI is already depressed (29.79), breaches of defined support can lead to accelerated price discovery because prior buyers may become sellers.
The key analytical takeaway is asymmetry: with ranks and blended technicals currently bearish, OSCR often needs price acceptance above resistance to improve confidence, while a loss of support tends to confirm what the rank stack is already indicating.
5) Quant Technical Dashboard (18 Signals)
KGNAI AI Technical Analysis Score (Deep Reinforcement Learning): Rank #1719 out of 2045 (Rank 1 represents the strongest technical positioning and a higher probability of favorable price behavior. As ranks increase toward the maximum, the probability of favorable outcomes weakens and bearish positioning becomes more dominant.) | Label: Bearish | Score: -0.681
18-Signal Technical Confluence Score: -0.222 (Neutral)
Overall Technical Score (18-signal confluence + DRL rank blend): -0.360 (Bearish)
Note: The blended score reflects signal strength weighted against broader AI technical ranking, which may temporarily diverge.
Blended technical score breakdown: -0.360 (Bearish | Bull 6 / Bear 10 / Neutral 2)
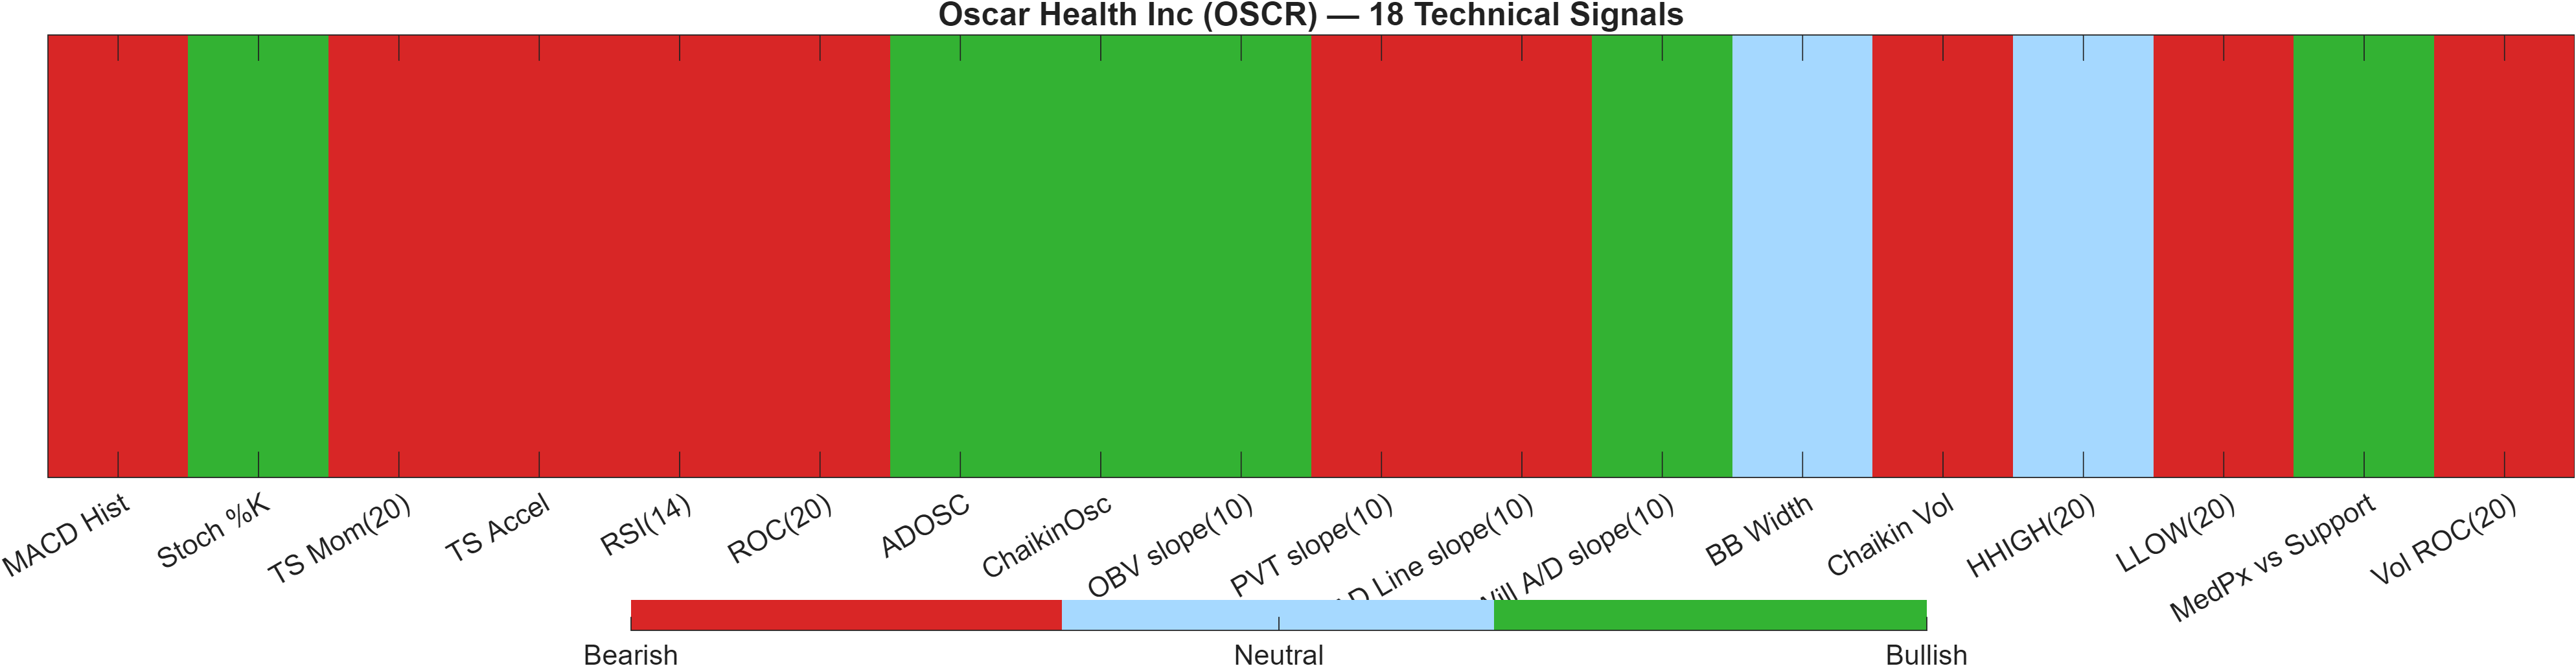
Confluence vs. model-weighted technical rank: where the divergence sits
The technical dashboard highlights a meaningful split between signal-level confluence and model-weighted technical ranking. The 18-signal confluence score of -0.222 is labeled Neutral, which implies the indicator set is not uniformly tilted toward downside. However, the Deep Reinforcement Learning technical rank sits at #1719 of 2045 with a score of -0.681, pulling the combined view to a blended -0.360 (Bearish).
That blend behavior is consistent with a market where some internals improve before price structure does. For instance, several flow/accumulation proxies are marked bullish (e.g., ADOSC 15.98 and OBV slope(10) 5.442e+06), while core momentum and trend-adjacent measures remain bearish (e.g., RSI(14) 29.79, ROC(20) -9.348, and TS Mom(20) -2.18). This mixture can occur during attempted basing, but it can also occur during bear-market rallies that fail.
The composition count (Bull 6 / Bear 10 / Neutral 2) supports the blended label: the majority of tracked signals still lean bearish, even if the total confluence score is only mildly negative. Volatility inputs are not providing a strong offset either; BB Width 0.1961 is tagged neutral, suggesting volatility is not the dominant explanatory driver at this moment.
Net: the dashboard reads as selective internal stabilization inside an overall bearish technical regime. For positioning discipline, that typically increases the value of confirmation at the major resistance level (24.2000) rather than relying on any single bullish sub-signal.
Signal table (Bull/Bear/Neutral)
| Indicator | Value | Signal |
|---|---|---|
| MACD Hist | -0.3662 | Bearish |
| Stoch %K | 12.5 | Bullish |
| TS Mom(20) | -2.18 | Bearish |
| TS Accel | -8.443 | Bearish |
| RSI(14) | 29.79 | Bearish |
| ROC(20) | -9.348 | Bearish |
| ADOSC | 15.98 | Bullish |
| ChaikinOsc | 9.366e+05 | Bullish |
| OBV slope(10) | 5.442e+06 | Bullish |
| PVT slope(10) | -4.579e+05 | Bearish |
| AD Line slope(10) | -2.804e+06 | Bearish |
| Will A/D slope(10) | 0.1097 | Bullish |
| BB Width | 0.1961 | Neutral |
| Chaikin Vol | 14.11 | Bearish |
| HHIGH(20) | 25.58 | Neutral |
| LLOW(20) | 20.82 | Bearish |
| MedPx vs Support | 7.738 | Bullish |
| Vol ROC(20) | -3.304 | Bearish |
Interpretation: Indicator-level signals form the base confluence, which is then adjusted using a separate AI-driven technical ranking model. The final technical score summarizes this combined view.
6) News sentiment + extractive gist
Sentiment score (avg): 0.096 | Positive: 32% | Neutral: 64% | Negative: 5%
KGNAI AI News Sentiment Score (normalized -1 to +1): 0.99 (as of 2026-06-02) | Label: Bullish | Overall news score: 0.95
Positive Developments
Recent coverage across major financial outlets indicates a constructive sentiment skew around Oscar Health’s near-term narrative, consistent with KGNAI’s normalized sentiment score of 0.99 and an overall news score of 0.95. The positive cluster emphasizes profitability momentum and company execution themes, which can help explain why the news model prints as bullish even while price-based ranks remain weak. Importantly, the distribution statistics show that explicitly positive items are not dominant in frequency (32% positive), suggesting the bullish score is being driven by the intensity and language characteristics of the constructive stories rather than a sheer volume of positive headlines. In practice, this type of sentiment configuration can support short-lived rebounds or reduce downside reflexivity, but it does not override technical decision levels—especially with bearish momentum readings such as RSI(14) 29.79 and MACD histogram -0.3662.
Neutral / Mixed Developments
The largest share of coverage is categorized as neutral (64%), which typically reflects market digestion rather than a clear narrative shift. Mixed items often include technically framed commentary (for example, moving-average milestones) alongside routine corporate or trading-session explanations. In OSCR’s case, this neutral majority fits the broader analytical picture: the 18-signal confluence is Neutral (-0.222), yet the blended technical stance is bearish (-0.360). That combination is compatible with an environment where participants debate whether weakness is a pullback or something more structural. Neutral news flow is therefore best read as context: it can shape timing and volatility around key levels, but it is not a standalone catalyst within this report’s framework.
Negative / Risk Signals
Explicitly negative items are limited in proportion (5%), but risk signals still matter when the market’s quantitative posture is already fragile. With OSCR sitting near the bottom of KGNAI’s universe on daily and weekly ranks (#2043 and #2028 out of 2045), even modest adverse narratives can have outsized impact if they coincide with technical breaks. The main risk lens here is sentiment–price conflict: news scoring is bullish, yet the price-based indicators and rank stack remain bearish. That divergence can resolve in either direction, but it raises the importance of confirmation—particularly whether price can reclaim and hold above resistance ~24.2000, or instead fails and presses toward support ~14.1775. If the latter occurs, sentiment support often proves insufficient to prevent deterioration.
- Whether bullish news tone (0.99 normalized) persists if price action remains below trend references.
- Any shift in the neutral-heavy mix (64%) toward more negative language as price approaches 14.1775.
- Follow-through quality if price attempts acceptance above 24.2000 (confirmation vs. rejection).
Sources referenced: Reuters, Bloomberg, Yahoo Finance, MarketWatch, Investing.com
7) Sources
The source list and URLs are not reproduced here per format rules. Not available in the provided data.
You may also like: How KGNAI AI ranks instruments across global markets
Disclaimer: KGNAI provides AI-generated analytics and educational market commentary only. This is not financial advice. Markets involve risk. Always do your own research.