
STX — Seagate Technology PLC (31-May-2026): Constructive short-/mid-term bias with long-horizon caution
Seagate Technology PLC (STX) enters 31-May-2026 with a constructive short- and mid-term profile in KGNAI’s cross-sectional ranking framework, while the long-term regime remains comparatively weak. The daily (#173), weekly (#354), and monthly (#144) ranks sit in the upper portion of a 2047-instrument universe, reinforced by a strong 3-month rank (#21) that signals persistence in the recent trend. At the same time, the 6-month rank (#1437) and yearly rank (#1657) introduce a durability question that shows up as “good momentum, less settled longer-run structure.” Technically, moving average structure is bullish (close vs MA50 and MA50 vs MA200), momentum is elevated (RSI(14) at 84.7 and MACD histogram 1.0638), and volatility sits in an identifiable regime (Bollinger bandwidth 0.2330). Key decision zones remain support ~468.7300 and resistance ~857.8187, with news sentiment skewing modestly positive in scoring while mixed in distribution.
- Rank stance: Short-term Bullish | Mid-term Bullish | Long-term Bearish
- Technical confluence label: 18-signal confluence 0.389 (Bullish) vs blended overall technical score 0.126 (Neutral)
- Key levels: Support ~ 468.7300 | Resistance ~ 857.8187
- News sentiment bias: Avg sentiment 0.136 with 33% positive / 67% neutral / 0% negative; normalized score 0.99 (Bullish)
- Confirmation / invalidation condition: A break above 857.8187 with volume supports continuation; a close below 468.7300 increases deterioration risk.
KGNAI evaluates assets using large cross-sectional datasets built from millions of structured data points. Inputs incorporate fundamental metrics, technical structures, and systematically processed news sentiment. Statistical models, machine learning, and AI frameworks are used to assess relative positioning, signal alignment, and probabilistic behavior across broad universes.
- Ranks are comparative across the tracked universe, not absolute price targets.
- Confluence reflects alignment among independent signal groups.
- Support/resistance levels are probabilistic decision zones, not guarantees.
- Sentiment provides contextual bias within the broader analytical framework.
1) KGNAI AI Analysis
Region: USA | Total universe size: 2047 ranked instruments
- Daily rank: #173 out of 2047 — Bullish
- Weekly rank: #354 out of 2047 — Bullish
- Monthly rank: #144 out of 2047 — Bullish
- 3-Monthly rank: #21 out of 2047 — Bullish
- 6-Monthly rank: #1437 out of 2047 — Neutral
- Yearly rank: #1657 out of 2047 — Bearish
Cross-horizon alignment vs divergence
STX shows a notable time-horizon split in KGNAI’s relative framework. The 3-month rank of #21 places the asset in the top decile of the 2047-instrument universe, consistent with strong recent behavior and broad participation. That strength is not isolated: the monthly rank (#144) and daily rank (#173) also fall within the upper tier, indicating the shorter-horizon advantage is still present rather than fading immediately.
The counterweight is longer horizon positioning. The 6-month rank (#1437) and yearly rank (#1657) sit in the lower third of the universe, which typically reflects weaker structural persistence when the window is widened. In practice, this combination often behaves like a momentum-dominant phase nested within a broader, less favorable historical regime—requiring more stringent confirmation from price structure and volatility to avoid extrapolating recent strength too far.
The stated term view—Short-term: Bullish; Mid-term: Bullish; Long-term: Bearish—matches the ranks’ distribution: an upside-leaning present with a longer-run profile that has not fully repaired. For portfolio construction, this profile usually argues for tighter decision rules around inflection points and a higher emphasis on how price behaves at defined levels rather than relying only on momentum continuation.
KGNAI ranks each instrument across large universes using multiple proprietary AI tests and statistical models (millions of data points). Lower ranks generally indicate stronger probability of favorable performance behavior, while higher ranks indicate weaker probability and more bearish positioning.
Want the full universe and complete rank tables? Unlock full access on KGNAI: https://www.kgnai.com/pricing
2) Price & trend overview
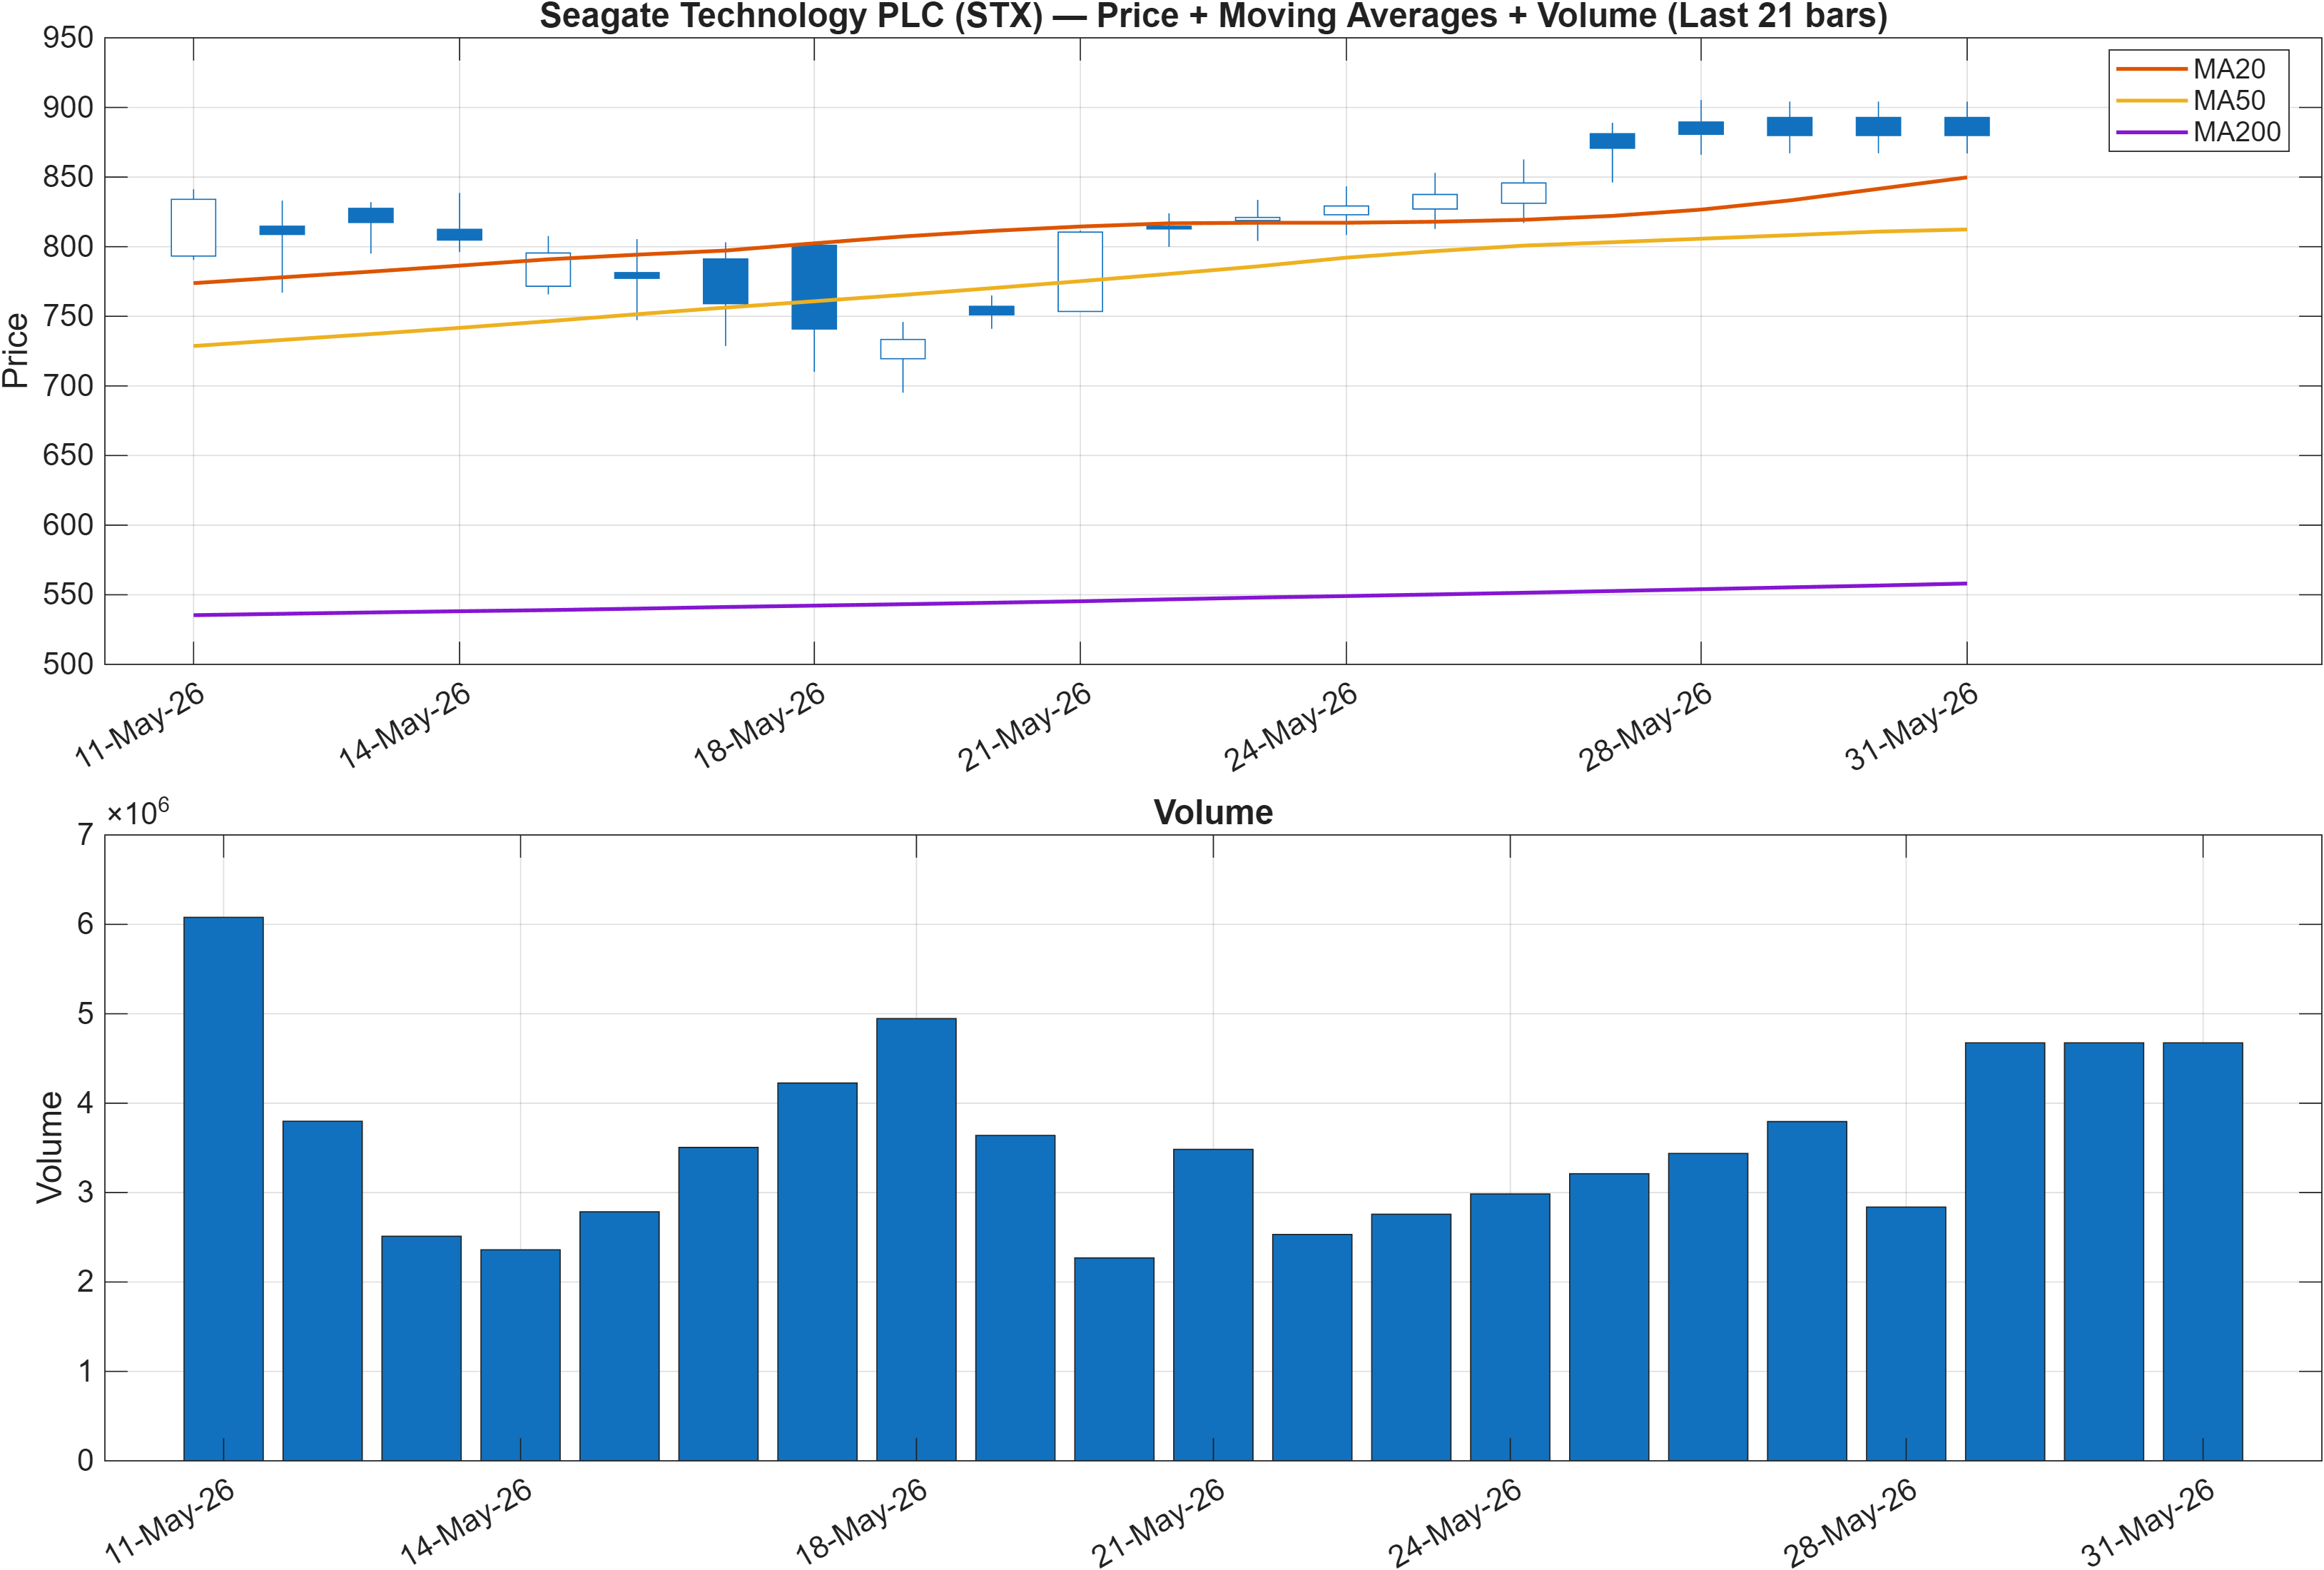
Trend state: constructive, but needs level-based validation
The trend read is internally consistent: close vs MA50 = Bullish and MA50 vs MA200 = Bullish. That combination typically characterizes a market that is not merely bouncing, but trading within a structure where intermediate trend and longer trend are pointing in the same direction. This aligns with STX’s strong shorter-window ranks (daily #173, monthly #144, and particularly 3-month #21), suggesting the recent move has been persistent enough to influence multiple horizons.
Where the picture becomes more conditional is that the longer-horizon ranks remain weak (6-month #1437, yearly #1657). When moving averages are bullish but long-horizon ranks lag, it often implies the market is in a repair or re-rating phase—improving faster than the longer window can “forget” prior weakness. That is not inherently bearish; it simply raises the importance of observing trend maintenance across pullbacks rather than evaluating strength only at local highs.
From a market-structure standpoint, the trend assessment is best framed around whether price continues to respect key decision zones and whether volume supports movement through them. The later sections’ resistance at 857.8187 and support at 468.7300 provide clean anchors for that evaluation: sustained trend strength tends to show up as contained retracements above support and orderly attempts at higher levels rather than sharp reversals back through the moving average stack.
3) Momentum & volatility dashboard
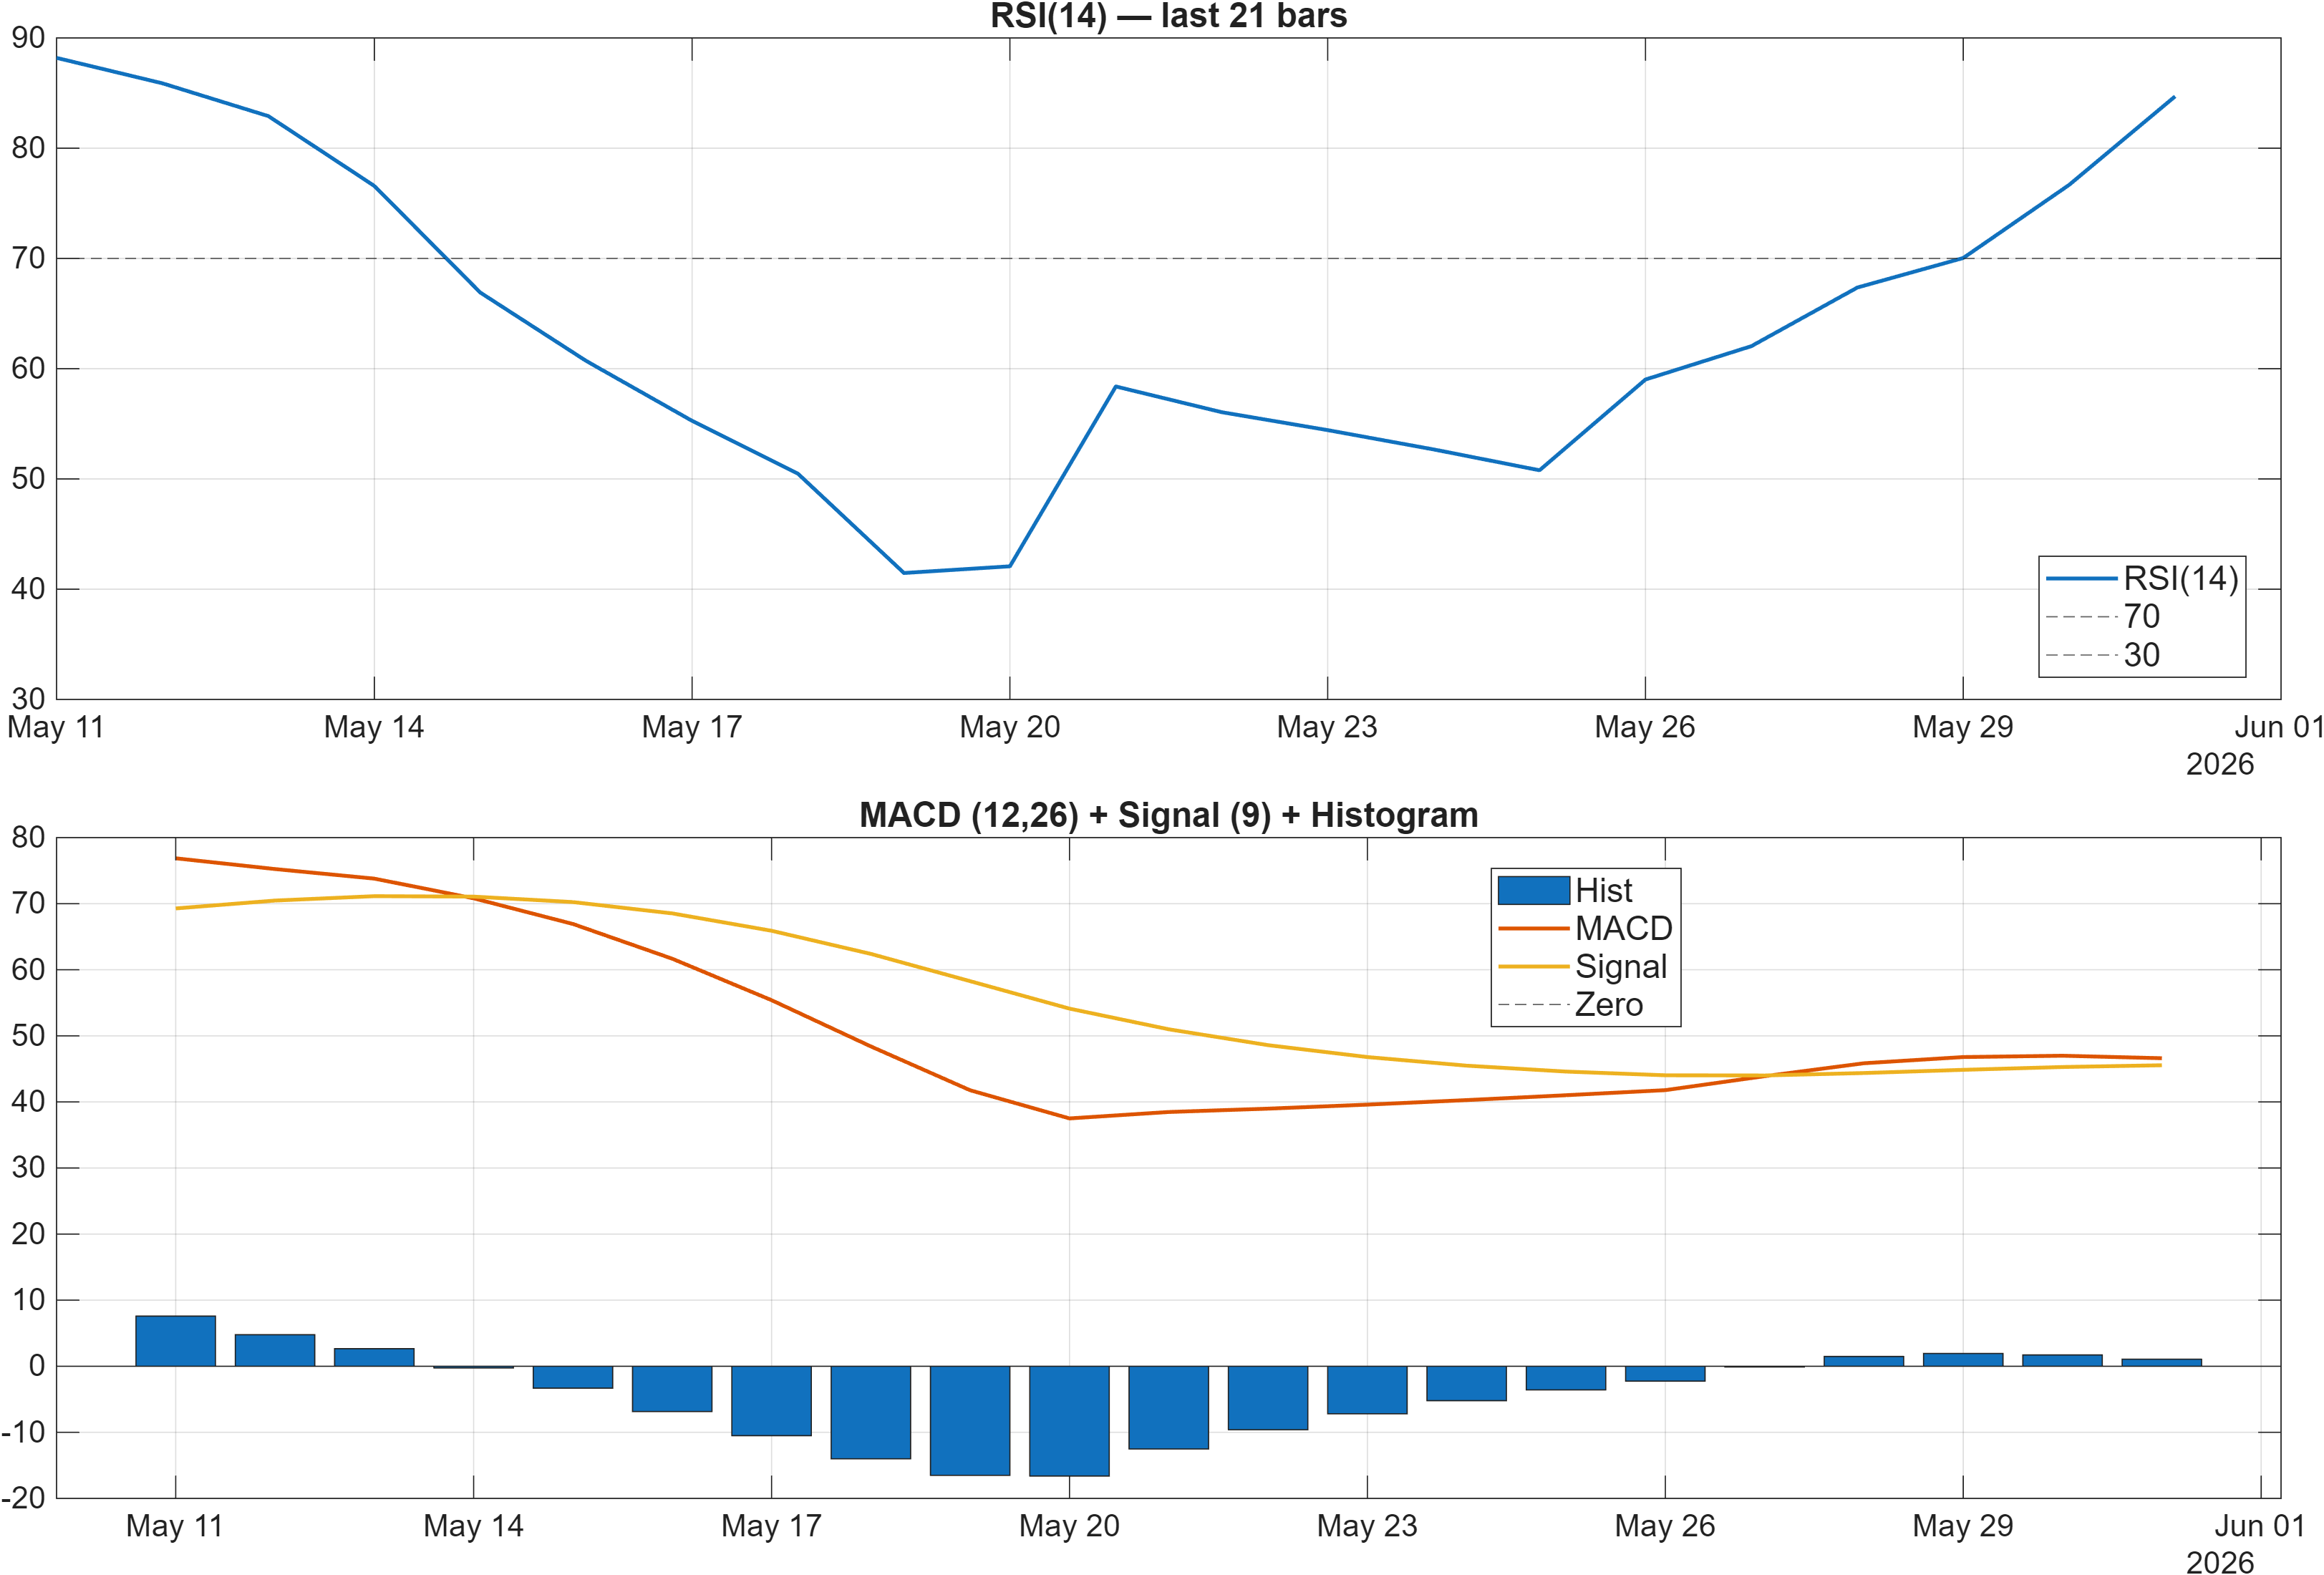
Interpretation: RSI bias = Bullish, MACD hist = 1.0638.
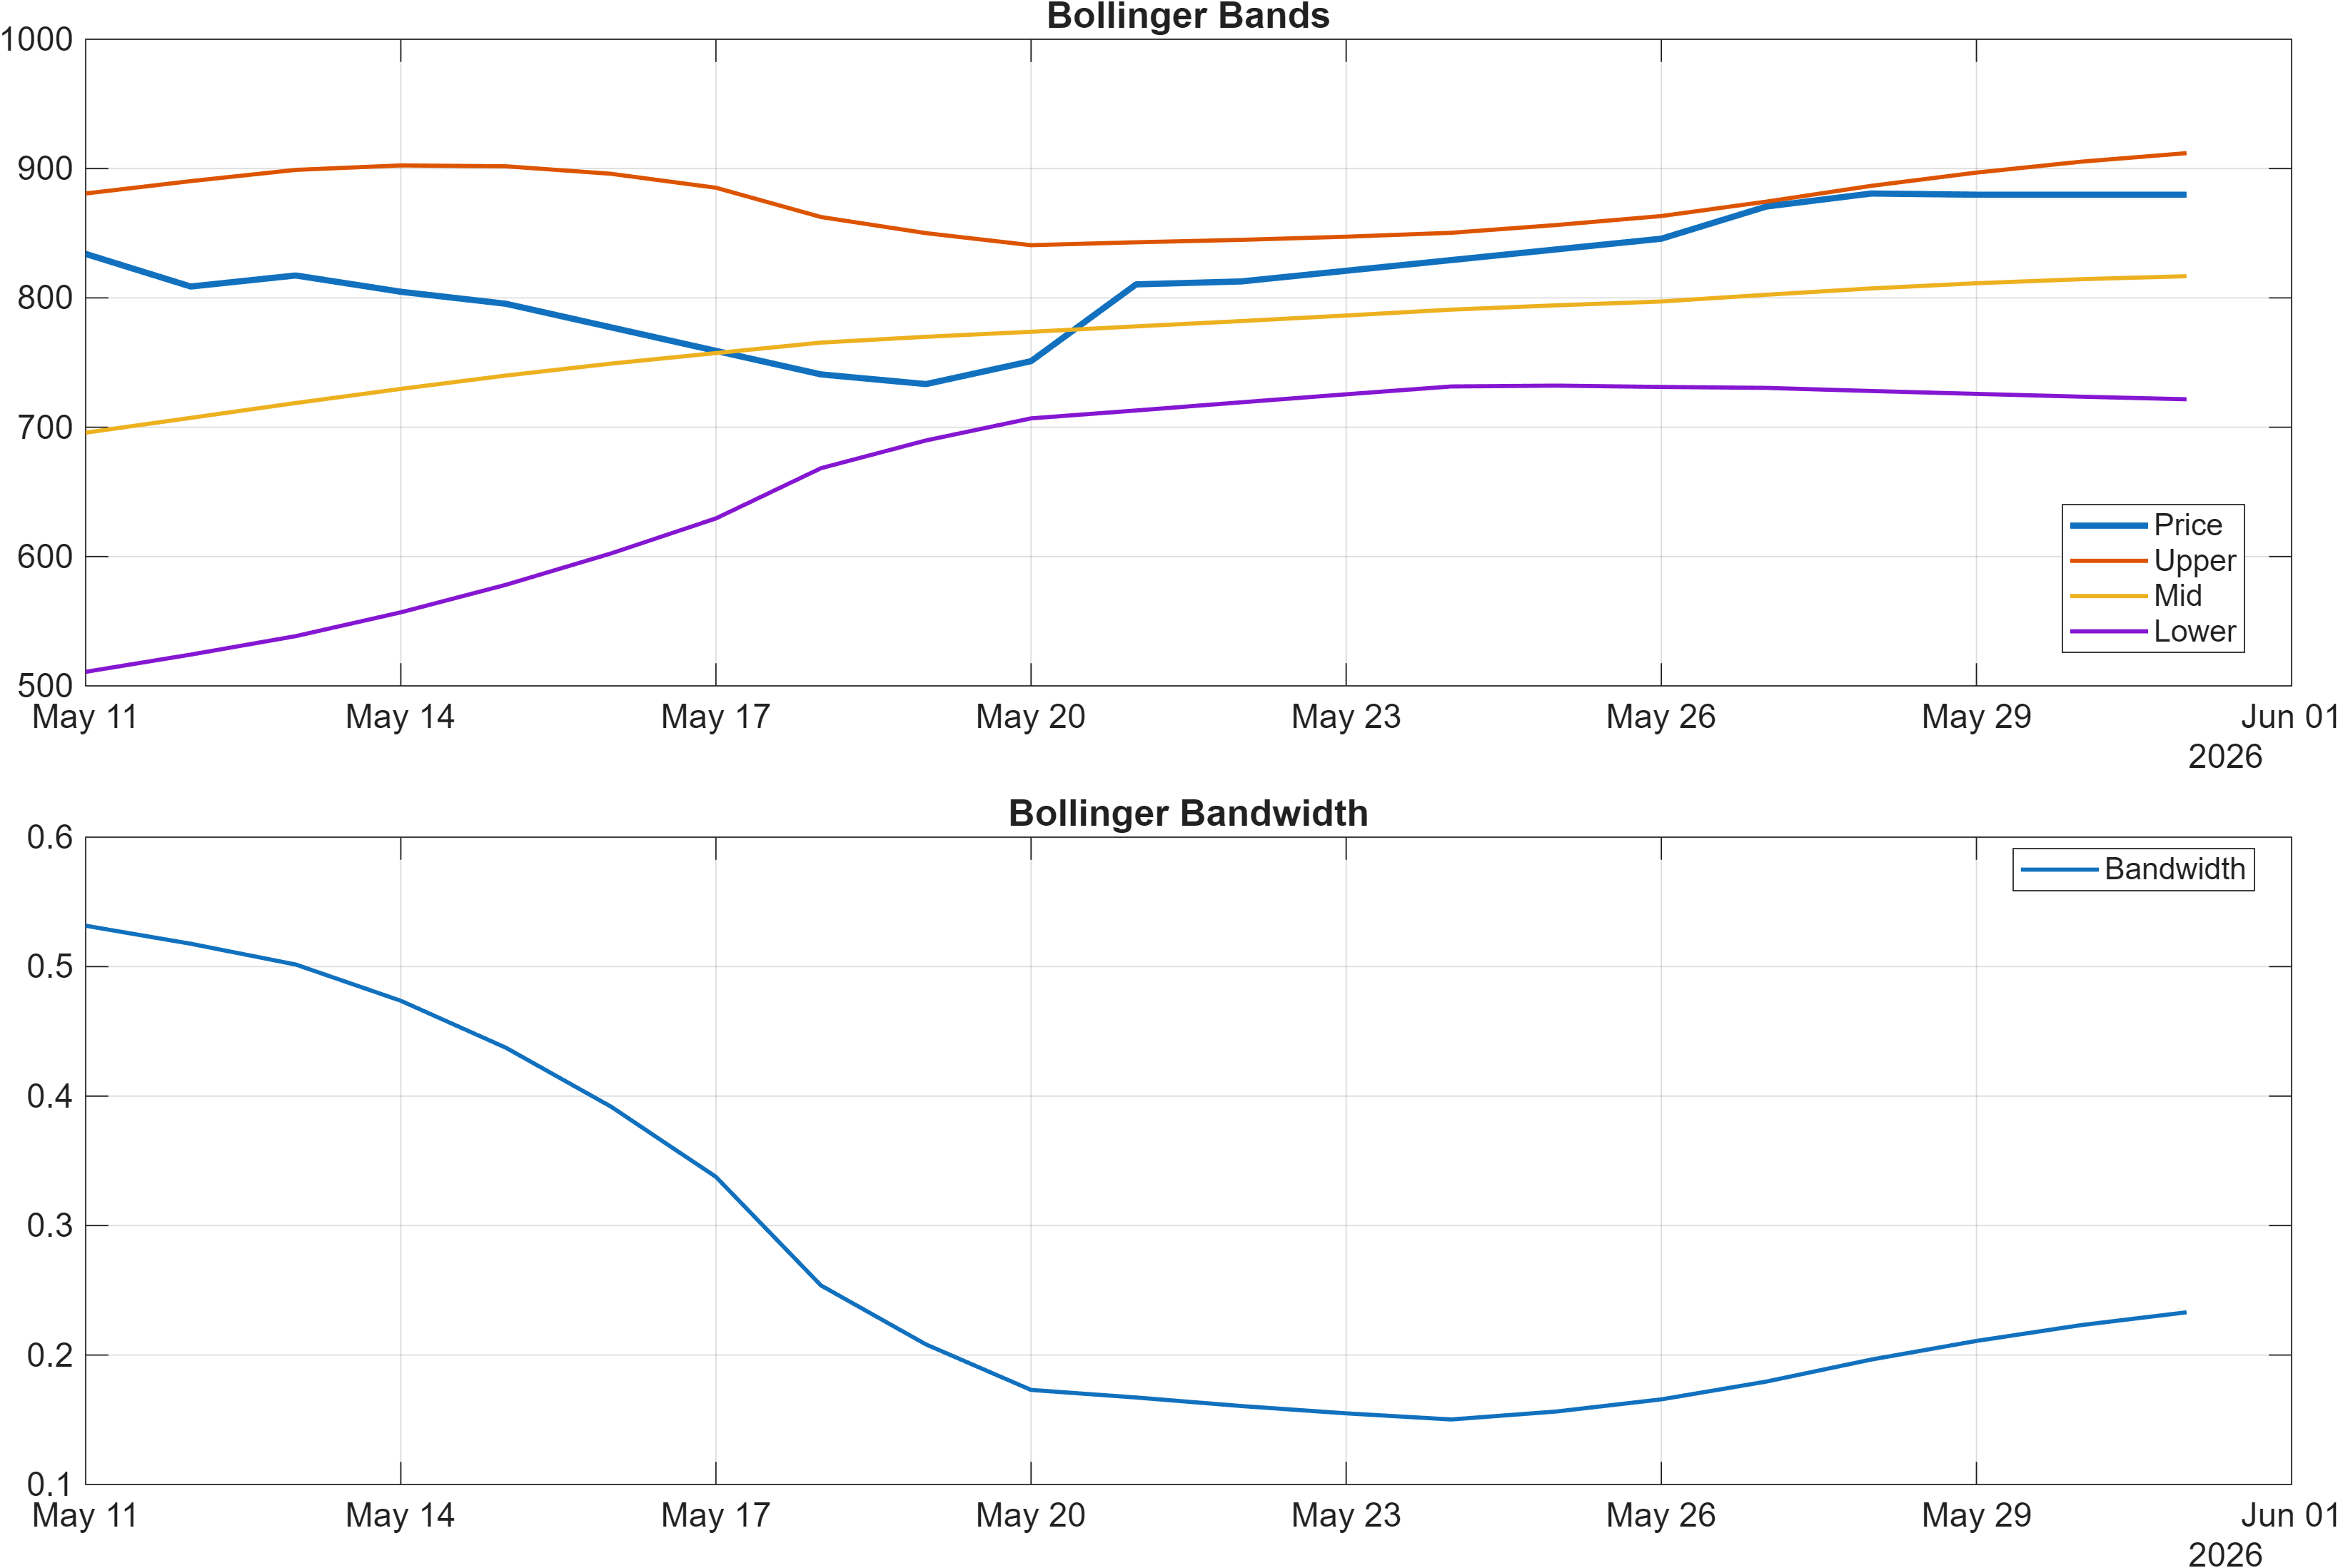
Interpretation: Bandwidth (volatility regime) latest = 0.2330.
Momentum strength vs exhaustion risk
Momentum is clearly elevated. RSI(14) at 84.7 is flagged bullish in the signal set, and the MACD histogram at 1.0638 supports a positive impulse. This configuration frequently corresponds to strong trend persistence, especially when it appears alongside a bullish moving-average structure (close above MA50 and MA50 above MA200). It also fits with the 3-month rank (#21) that implies recent leadership versus the broader universe.
The analytical nuance is that very high RSI readings can also coincide with late-stage acceleration, where follow-through depends on whether dips remain controlled. Within the 18-signal dashboard, this “strong but sensitive” condition is echoed by the presence of a bearish acceleration measure (TS Accel -150.2) even as other momentum metrics remain constructive (e.g., ROC(20) 8.779 and TS Mom(20) 71 marked bullish). That mix is consistent with a market that has delivered strength but may be prone to sharper mean-reversion if buying pressure cools.
Volatility regime provides context. Bollinger bandwidth at 0.2330 is treated as the current state of dispersion; rather than implying direction, it helps frame how quickly price may traverse support/resistance zones. If the market is trending while volatility remains identifiable (not collapsing), the result is often opportunity with wider timing error bars—making confirmation at levels more important than attempting to optimize entries purely off oscillator readings.
4) Support / Resistance zones
Support ~ 468.7300 | Resistance ~ 857.8187
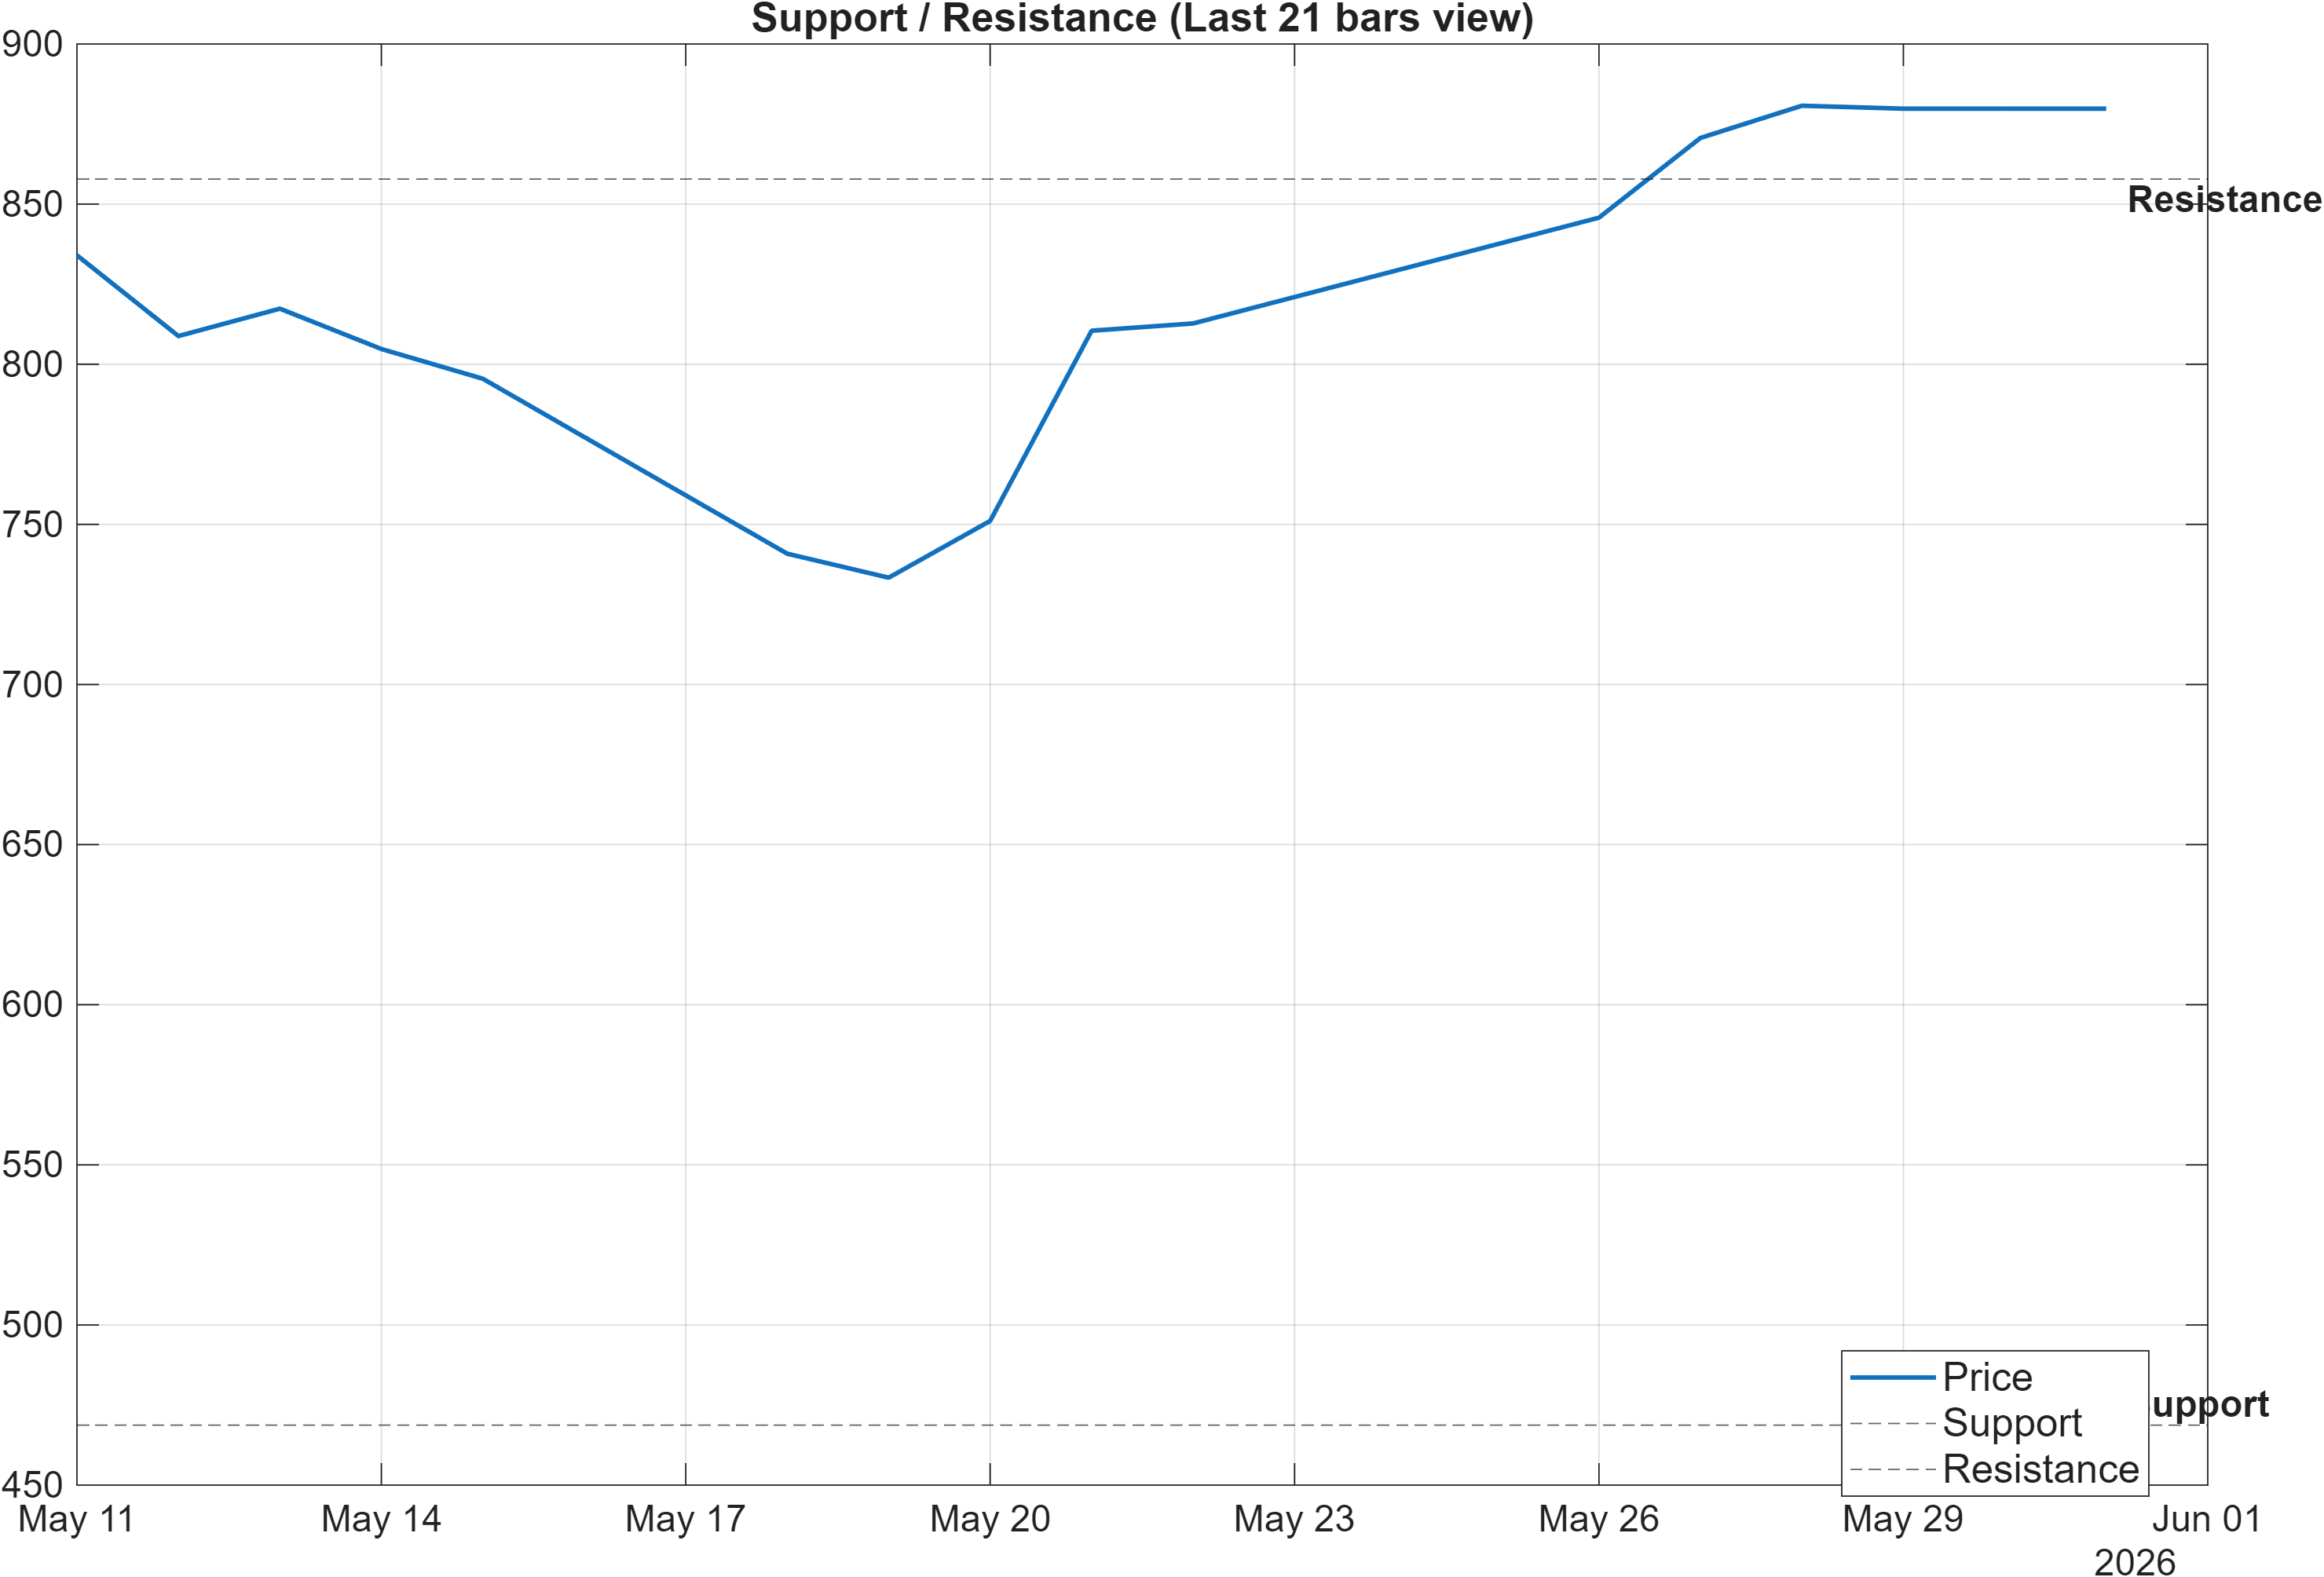
Scenario view: Break above resistance with volume → continuation. Close below support → signal deterioration risk.
Decision zones: mapping continuation vs deterioration
The support and resistance framework provides the clearest rule-set for separating trend continuation from trend damage. With support defined near 468.7300, the constructive short-/mid-term view is most coherent when price action remains above that zone on pullbacks, particularly given the elevated momentum profile (RSI(14) 84.7). High-momentum regimes can retrace quickly; the analytical question is whether those retracements are absorbed without violating key structure.
Resistance near 857.8187 functions as the primary continuation checkpoint. The scenario framing is explicit: a break above resistance with volume supports continuation, which would be consistent with the bullish moving average alignment and the 3-month leadership rank (#21). Absent that break, repeated failures near resistance can compress momentum and shift the technical mix toward neutrality even if longer-term ranks remain a headwind.
It is also helpful to connect these levels to the broader signal environment. The 18-signal set includes a bullish “MedPx vs Support” reading of 416.9, which supports the idea that price structure relative to support has been favorable within the model’s definitions, while a neutral “BB Width” at 0.233 suggests volatility is present but not itself a directional vote. Given the long-horizon rank drag (yearly #1657), this section’s levels effectively become the “arbiter”: continuation generally requires a clean acceptance above resistance, while deterioration is most credibly signaled by a close below support rather than by oscillators alone.
5) Quant Technical Dashboard (18 Signals)
KGNAI AI Technical Analysis Score (Deep Reinforcement Learning): Rank #1523 out of 2047 (Rank 1 represents the strongest technical positioning and a higher probability of favorable price behavior. As ranks increase toward the maximum, the probability of favorable outcomes weakens and bearish positioning becomes more dominant.) | Label: Neutral | Score: -0.488
18-Signal Technical Confluence Score: 0.389 (Bullish)
Overall Technical Score (18-signal confluence + DRL rank blend): 0.126 (Neutral)
Note: The blended score reflects signal strength weighted against broader AI technical ranking, which may temporarily diverge.
Blended technical score breakdown: 0.126 (Neutral | Bull 10 / Bear 3 / Neutral 5)
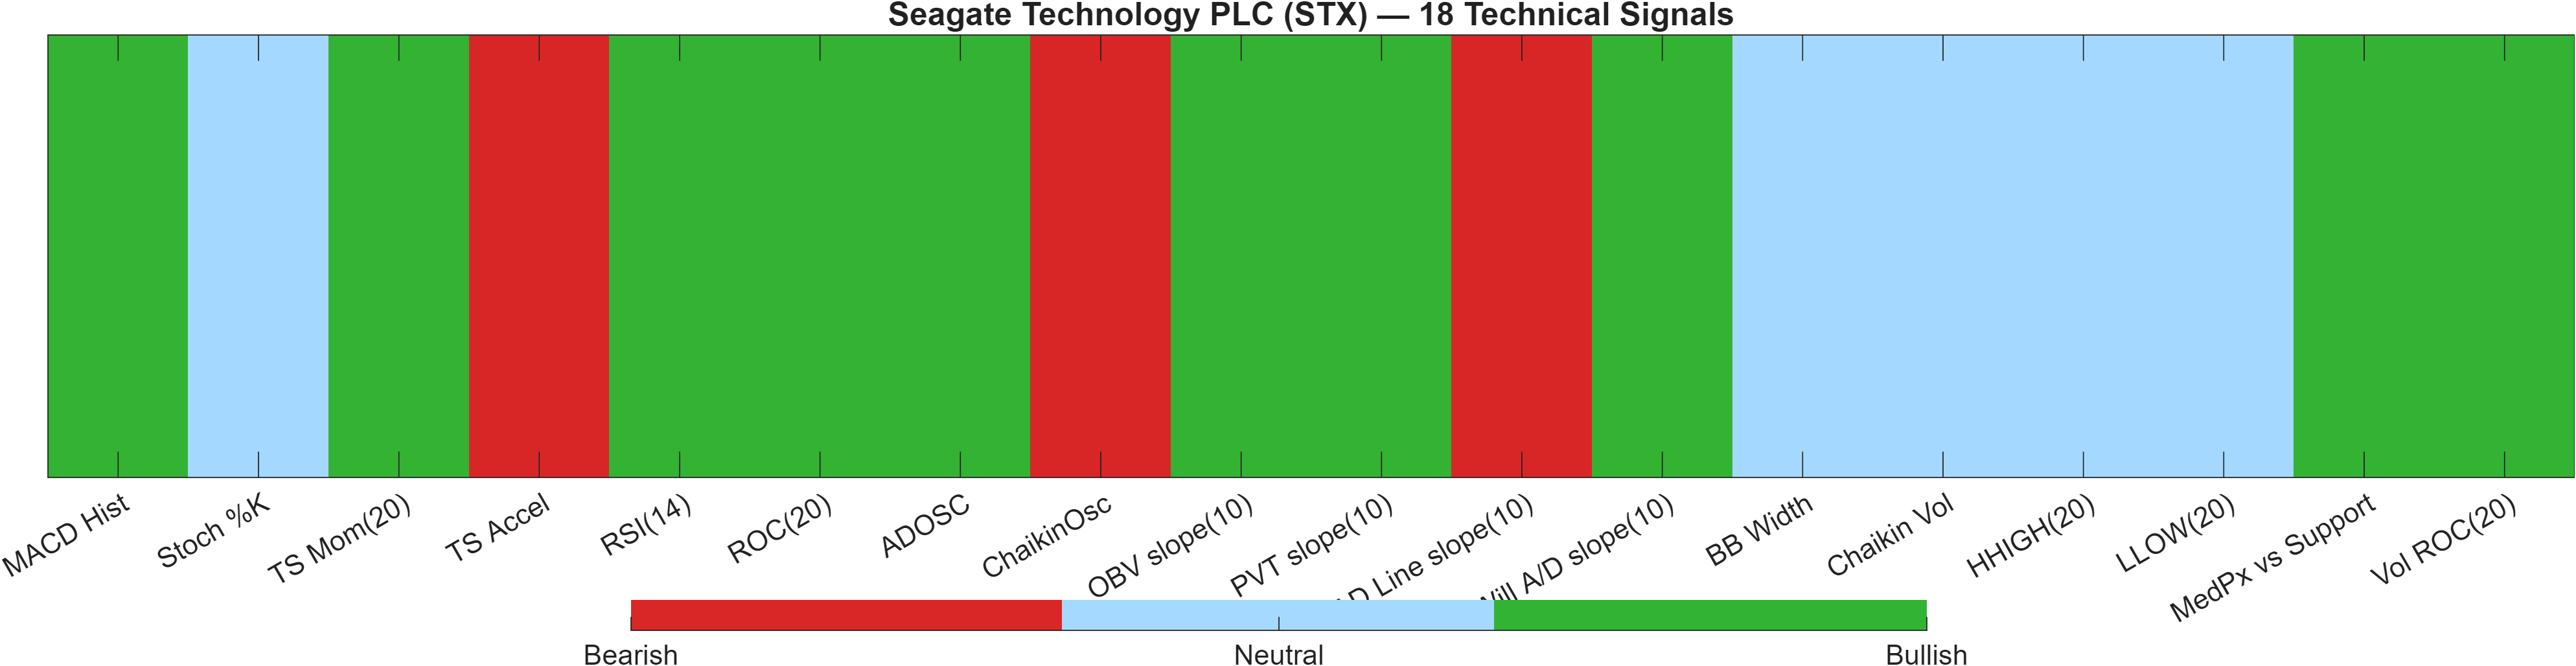
Confluence vs model-rank drag: why “Bullish” becomes “Neutral” in the blend
STX’s technical picture is defined by a confluence/rank divergence. The 18-signal confluence score is 0.389 (Bullish) with a distribution of Bull 10 / Bear 3 / Neutral 5, indicating that across common technical families—momentum, price structure, and several volume/flow measures—the majority of individual readings point in the same direction. This aligns with the momentum dashboard: MACD histogram around 1.064 and RSI(14) 84.7 both register bullish within the signal set.
Yet the Deep Reinforcement Learning technical rank sits at #1523 out of 2047 with a Neutral label and score -0.488. In the blended framework, that broader-model assessment tempers the indicator-level agreement, producing an overall technical score of 0.126 (Neutral). This is a classic signature of a market that looks strong on conventional indicators, while the broader pattern-recognition model is less willing to assign high-quality technical positioning—often due to factors like regime inconsistency across longer samples, or atypical price/volume dynamics not captured by a small set of indicators.
The internal composition provides hints about where the friction may sit. Alongside bullish volume-based slopes (e.g., OBV slope(10) 1.688e+07 and PVT slope(10) 2.706e+05), there are bearish elements in flow/breadth proxies (e.g., AD Line slope(10) -1.753e+06) and acceleration (TS Accel -150.2). The takeaway is not that the trend is invalid, but that signal quality may be more conditional: continuation benefits from confirmation at 857.8187, while a breakdown toward 468.7300 would likely cause the blended score to deteriorate more quickly than the confluence score alone might suggest.
Signal table (Bull/Bear/Neutral)
| Indicator | Value | Signal |
|---|---|---|
| MACD Hist | 1.064 | Bullish |
| Stoch %K | 75.76 | Neutral |
| TS Mom(20) | 71 | Bullish |
| TS Accel | -150.2 | Bearish |
| RSI(14) | 84.7 | Bullish |
| ROC(20) | 8.779 | Bullish |
| ADOSC | 32.46 | Bullish |
| ChaikinOsc | -5.97e+05 | Bearish |
| OBV slope(10) | 1.688e+07 | Bullish |
| PVT slope(10) | 2.706e+05 | Bullish |
| AD Line slope(10) | -1.753e+06 | Bearish |
| Will A/D slope(10) | 119.5 | Bullish |
| BB Width | 0.233 | Neutral |
| Chaikin Vol | -15.3 | Neutral |
| HHIGH(20) | 905.4 | Neutral |
| LLOW(20) | 695.1 | Neutral |
| MedPx vs Support | 416.9 | Bullish |
| Vol ROC(20) | 23.07 | Bullish |
Interpretation: Indicator-level signals form the base confluence, which is then adjusted using a separate AI-driven technical ranking model. The final technical score summarizes this combined view.
6) News sentiment + extractive gist
Sentiment score (avg): 0.136 | Positive: 33% | Neutral: 67% | Negative: 0%
KGNAI AI News Sentiment Score (normalized -1 to +1): 0.99 (as of 2026-05-30) | Label: Bullish | Overall news score: 0.90
Positive Developments
Recent coverage across major financial outlets indicates a generally constructive tone around STX, with emphasis on demand conditions tied to data-center and AI-related storage workloads, alongside commentary on product/platform progress. This backdrop is consistent with the normalized sentiment score of 0.99 and a positive skew in the model’s label. Importantly, the distribution shows 33% positive and 67% neutral with 0% negative, which tends to describe an environment where bullish interpretations exist but are not universally dominant. In market terms, that often supports continued attention and liquidity without necessarily implying one-way positioning. When paired with the technical context—RSI(14) at 84.7 and bullish moving-average structure—positive coverage can reinforce trend persistence, but it also raises sensitivity to any shift in tone because expectations may already be elevated.
Neutral / Mixed Developments
The neutral bucket appears driven by informational updates and “what’s next” framing rather than overtly directional narratives. That aligns with the measured average sentiment of 0.136, which is positive but not extreme. A predominantly neutral news mix commonly acts as a stabilizer for price discovery: it may reduce the probability of abrupt sentiment shocks, while still allowing technical factors—such as the MACD histogram near 1.0638 and volatility state (bandwidth 0.2330)—to exert more influence on near-term path. In this context, neutral coverage is best read as background confirmation that the story remains “in play,” without providing a decisive catalyst on its own.
Negative / Risk Signals
While the sentiment distribution records 0% negative, risk framing still exists in the form of conditionality: elevated momentum (RSI(14) 84.7) and mixed technical blending (overall technical score 0.126 despite confluence 0.389) can amplify downside sensitivity if the narrative cools or if positioning becomes crowded. Coverage that revisits prior moves and asks “what’s next” can sometimes coincide with late-stage trend behavior, where incremental good news has less marginal impact. For STX, the risk signal is therefore less about overtly negative headlines and more about timing asymmetry: if price fails to confirm at 857.8187 or breaks down through 468.7300, the absence of negative sentiment may not prevent technical deterioration.
- Whether price acceptance develops above 857.8187 with volume (continuation confirmation).
- Whether pullbacks hold above 468.7300 (structure preservation vs deterioration).
- Whether momentum cools while volatility (bandwidth 0.2330) expands or compresses (regime shift risk).
Sources referenced: Reuters, Bloomberg, Yahoo Finance, MarketWatch, Investing.com
7) Sources
- A Look At Seagate Technology Holdings (STX) Valuation After Strong Q3 AI Storage And HAMR Momentum — https://finance.yahoo.com/markets/stocks/articles/look-seagate-technology-holdings-stx-030807504.html?.tsrc=rss
- Why Is Seagate (STX) Up 35.3% Since Last Earnings Report? — https://finance.yahoo.com/markets/stocks/articles/why-seagate-stx-35-3-153017048.html?.tsrc=rss
- Seagate Announces Closing of Exchanges with Holders of $185.908 Million Principal Amount of Exchangeable Notes — https://finance.yahoo.com/markets/stocks/articles/seagate-announces-closing-exchanges-holders-123000191.html?.tsrc=rss
- Seagate (STX) Lands A Stunning Target Hike As Storage Demand Accelerates — https://finance.yahoo.com/markets/stocks/articles/seagate-stx-lands-stunning-target-121722739.html?.tsrc=rss
- Seagate vs. NetApp: Which Data Management Stock is the Better Bet? — https://finance.yahoo.com/markets/stocks/articles/seagate-vs-netapp-data-management-144200364.html?.tsrc=rss
- MU Achieves a Milestone: Will 3 Memory & Storage Stocks Follow Suit? — https://finance.yahoo.com/markets/stocks/articles/mu-achieves-milestone-3-memory-115900713.html?.tsrc=rss
- Is Seagate (STX) Using Debt-for-Equity Swaps to Reinforce Its AI Storage Ambitions? — https://finance.yahoo.com/markets/stocks/articles/seagate-stx-using-debt-equity-160847397.html?.tsrc=rss
- Why Is Seagate (STX) Up 35.3% Since Last Earnings Report? — https://www.nasdaq.com/articles/why-seagate-stx-353-last-earnings-report
You may also like: How KGNAI AI ranks instruments across global markets
Disclaimer: KGNAI provides AI-generated analytics and educational market commentary only. This is not financial advice. Markets involve risk. Always do your own research.