
600276 — Jiangsu Hengrui Medicine Co Ltd (13-Feb-2026) | Bullish technical confluence with short-term neutrality
Jiangsu Hengrui Medicine Co Ltd (600276) enters 13-Feb-2026 with a timeframe split that matters for execution: the Daily rank (#504/1294) sits in a neutral zone, while the Weekly (#79/1294) and Monthly (#22/1294) ranks push the stock into the upper cohort of the China universe. This configuration often reflects a market that has improved its medium-term positioning faster than its short-term follow-through. On the technical layer, the 18-signal confluence score (0.389, Bullish) and overall blended technical score (0.352, Bullish) indicate broad signal agreement despite a Neutral DRL technical rank (#475/1294; score 0.266). Momentum is constructive with MACD histogram at 0.3198, while volatility remains compressed (bandwidth 0.0485), keeping the next directional resolution closely tied to the decision zones at 56.8967 support and 64.2500 resistance.
Key Takeaways
- Rank stance: Short-term Neutral; Mid-term Bullish; Long-term Bullish (notably Monthly #22, Weekly #79).
- Technical confluence: Bullish (18-signal confluence 0.389; blended technical score 0.352) alongside a Neutral DRL technical rank (#475).
- Decision levels: Support ~56.8967 and Resistance ~64.2500 frame the current range.
- News sentiment bias: Mostly Neutral in distribution (Positive 6% / Neutral 88% / Negative 6%), with a normalized sentiment score of 1.00 (Bullish) as of 2026-02-03.
- Confirmation / invalidation: A break above 64.2500 with volume supports continuation; a close below 56.8967 increases deterioration risk.
What KGNAI Measures
KGNAI ranks instruments relative to large universes using multiple AI tests and statistical models to evaluate positioning, stability, and signal alignment. Outputs are designed to capture probabilistic behavior patterns across many instruments rather than single-name narratives. Levels and indicators are treated as decision references within a regime, not as targets.
How to Read This Report
- Ranks are comparative across 1294 instruments, not absolute forecasts.
- Confluence summarizes agreement across indicators (e.g., RSI, MACD, Bollinger Bands, volume/participation).
- Support/resistance define zones where behavior often changes (break, hold, or fail).
- Sentiment provides contextual bias and can diverge from price-based signals.
1) KGNAI AI Analysis
Region: CHINA | Total universe size: 1294 ranked instruments
- Daily rank: #504 out of 1294 — Neutral
- Weekly rank: #79 out of 1294 — Bullish
- Monthly rank: #22 out of 1294 — Bullish
- 3-Monthly rank: #39 out of 1294 — Bullish
- 6-Monthly rank: #69 out of 1294 — Bullish
- Yearly rank: #86 out of 1294 — Bullish
The rank curve shows a clear improvement with horizon. While the Daily rank (#504) sits near the middle of the universe (suggesting limited short-term edge), the Weekly (#79) and Monthly (#22) ranks move 600276 into the upper cohort, consistent with a market that has been re-priced on a medium-term basis. The longer windows remain supportive—3-Month (#39), 6-Month (#69), and Yearly (#86)—which tends to be more consistent with trend persistence than a one-off swing.
This specific structure often reads as short-term digestion inside a stronger regime: the longer-term models flag constructive behavior patterns while the short-term model is not yet confirming a clean acceleration. That difference matters: it can reduce the probability of a smooth, immediate follow-through, even when the broader setup is favorable.
From a positioning perspective, the report’s term view stays coherent: Short-term Neutral, Mid-term Bullish, Long-term Bullish. Practically, that points to a bias of buying confirmation rather than chasing noise—especially when combined with the nearby structural levels (56.8967 / 64.2500) and compressed volatility discussed later.
2) Price & trend overview
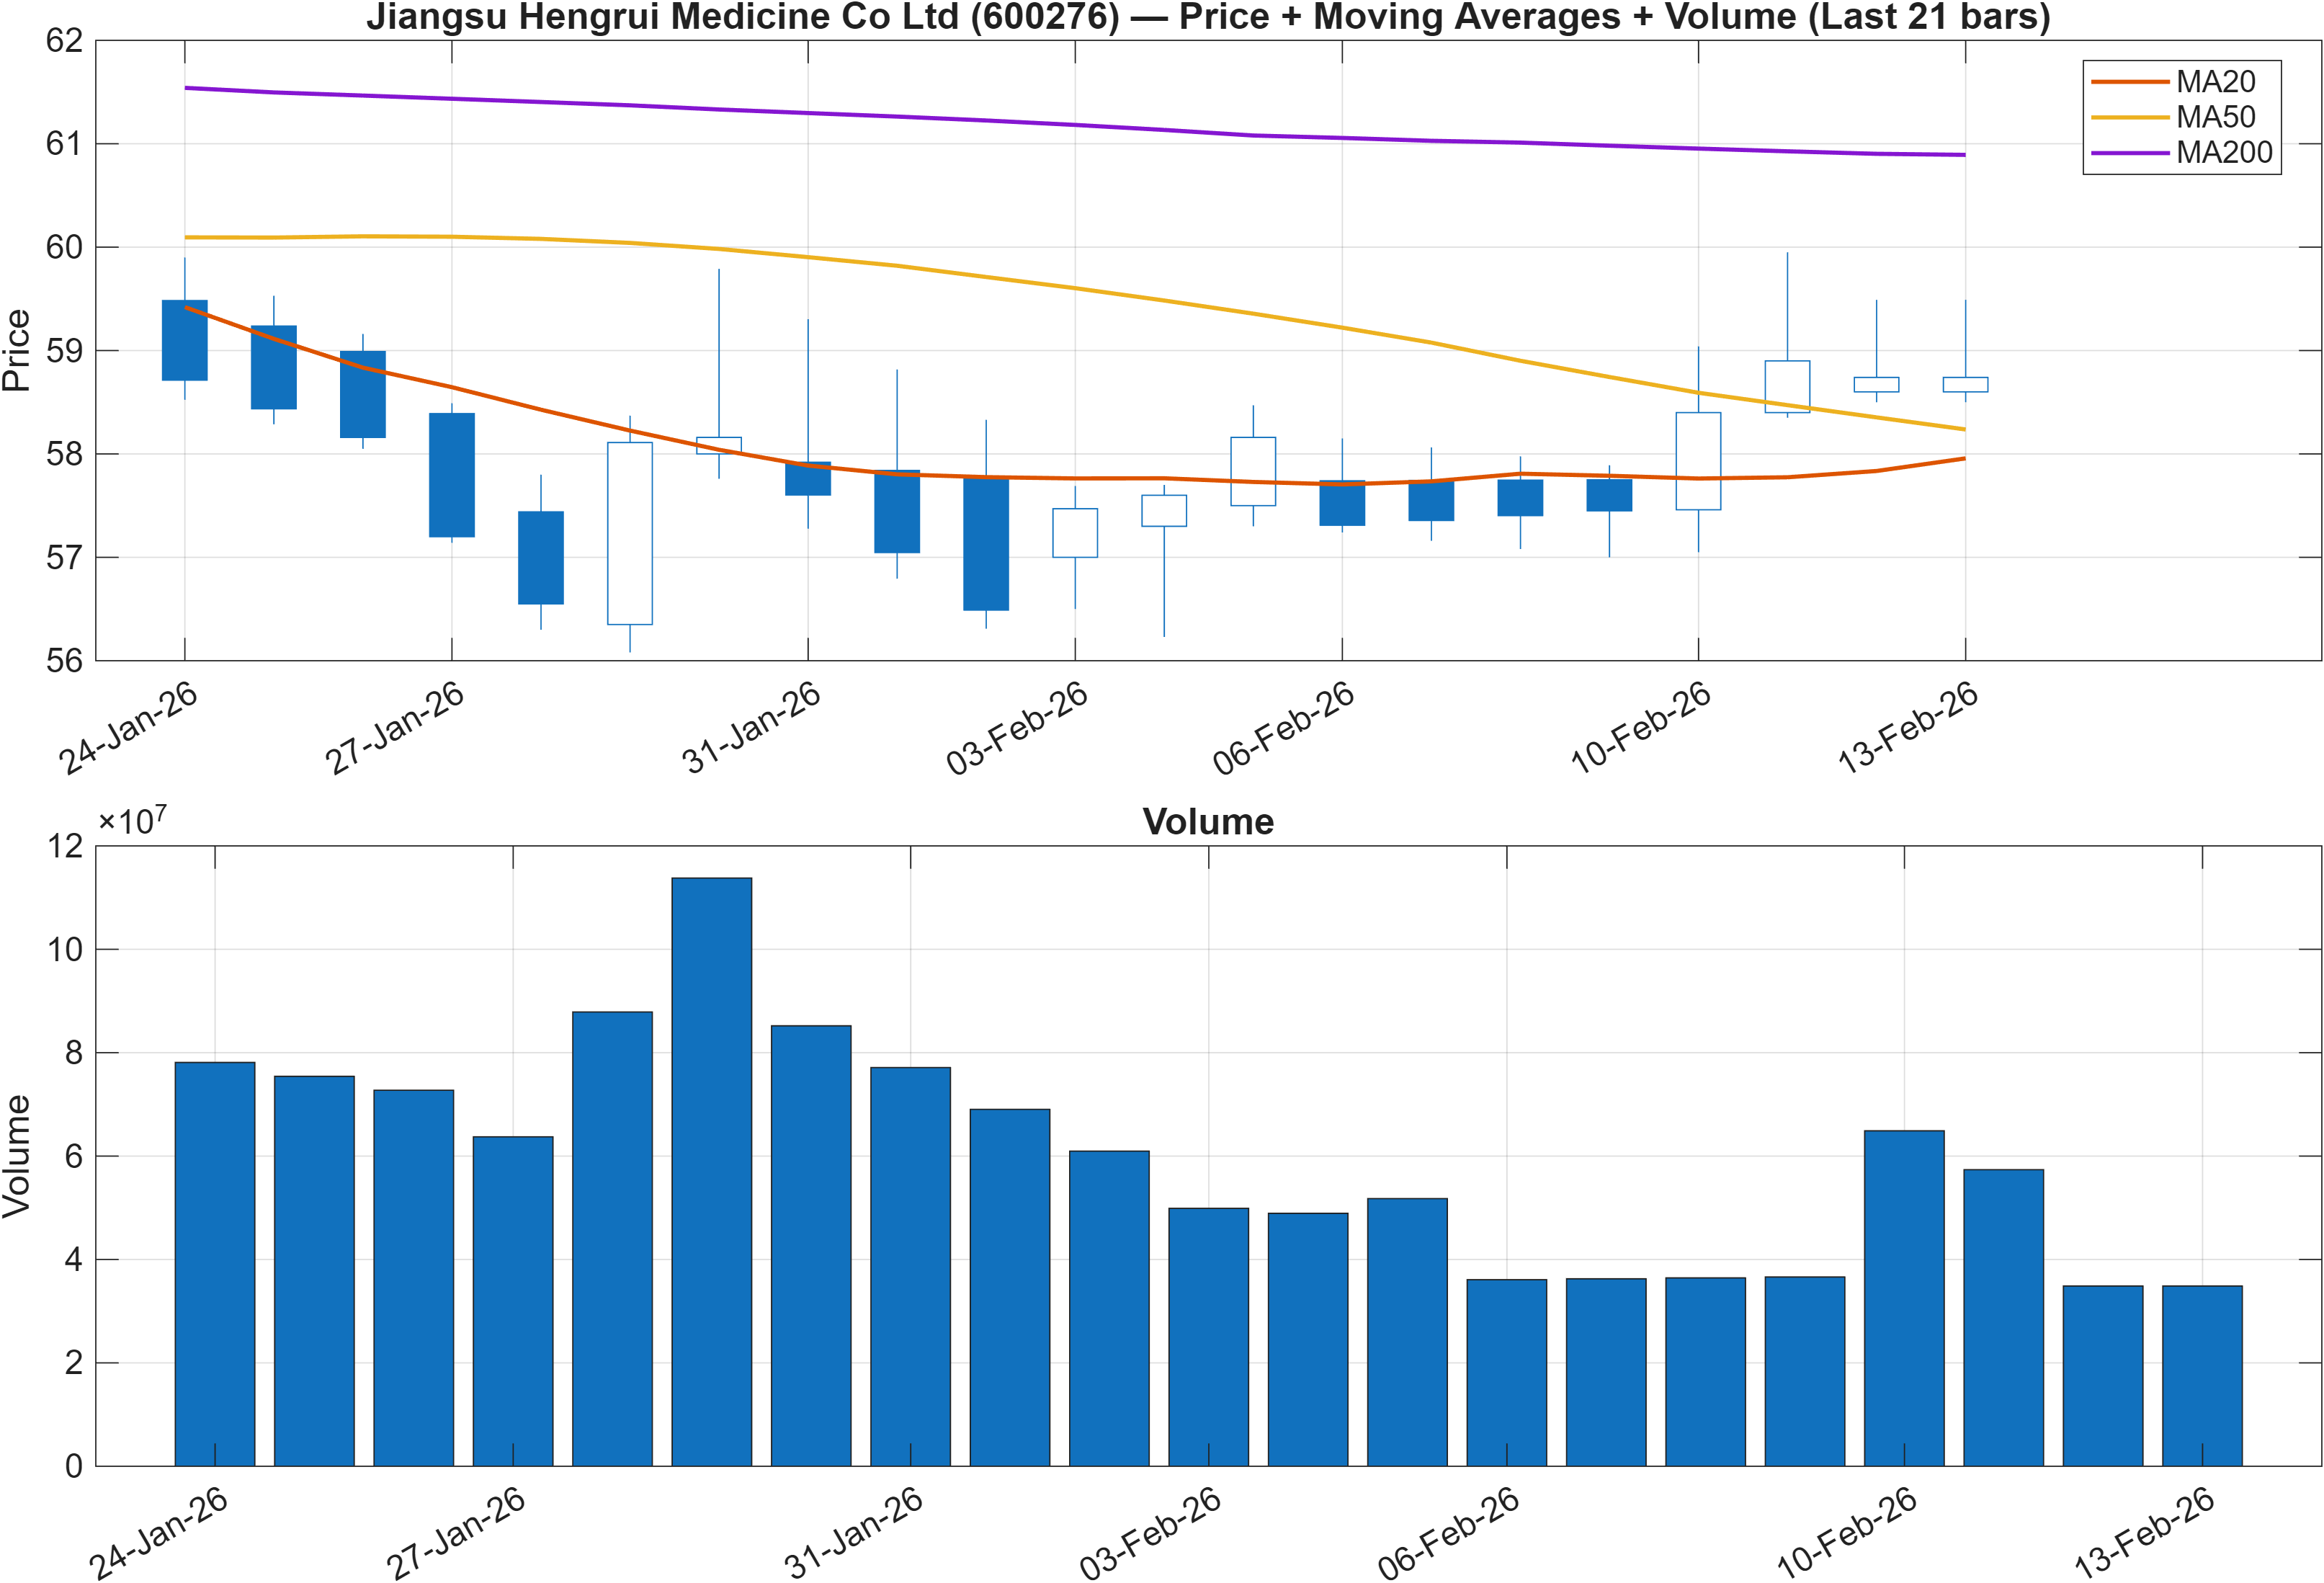
The trend framing is explicitly mixed: Close vs MA50 = Bullish, while MA50 vs MA200 = Bearish. That combination is often seen in transition phases where shorter-horizon price strength is present, but the longer-horizon moving-average structure has not fully rotated. In other words, the market is behaving better recently than it has across the longer window, yet the longer-term trend filter remains a constraint.
This is where the rank structure adds context. The Monthly rank (#22) and 3-Month rank (#39) imply strong relative positioning despite the bearish MA50/MA200 relationship. When those disagree, the question becomes whether price can maintain strength long enough for the slow trend measures to catch up—often requiring stability above nearby supports such as 56.8967 and eventual pressure toward 64.2500.
Volume behavior is treated here as a confirmation layer rather than a standalone signal, consistent with the report’s premise that trend and momentum must be cross-validated against participation. This matters because short-term neutrality (Daily #504) can reflect a market that is trending but still vulnerable to failed follow-through if participation fades. The scenario framing later—breakout with volume versus deterioration below support—becomes the operational interpretation of this trend structure.
3) Momentum & volatility dashboard
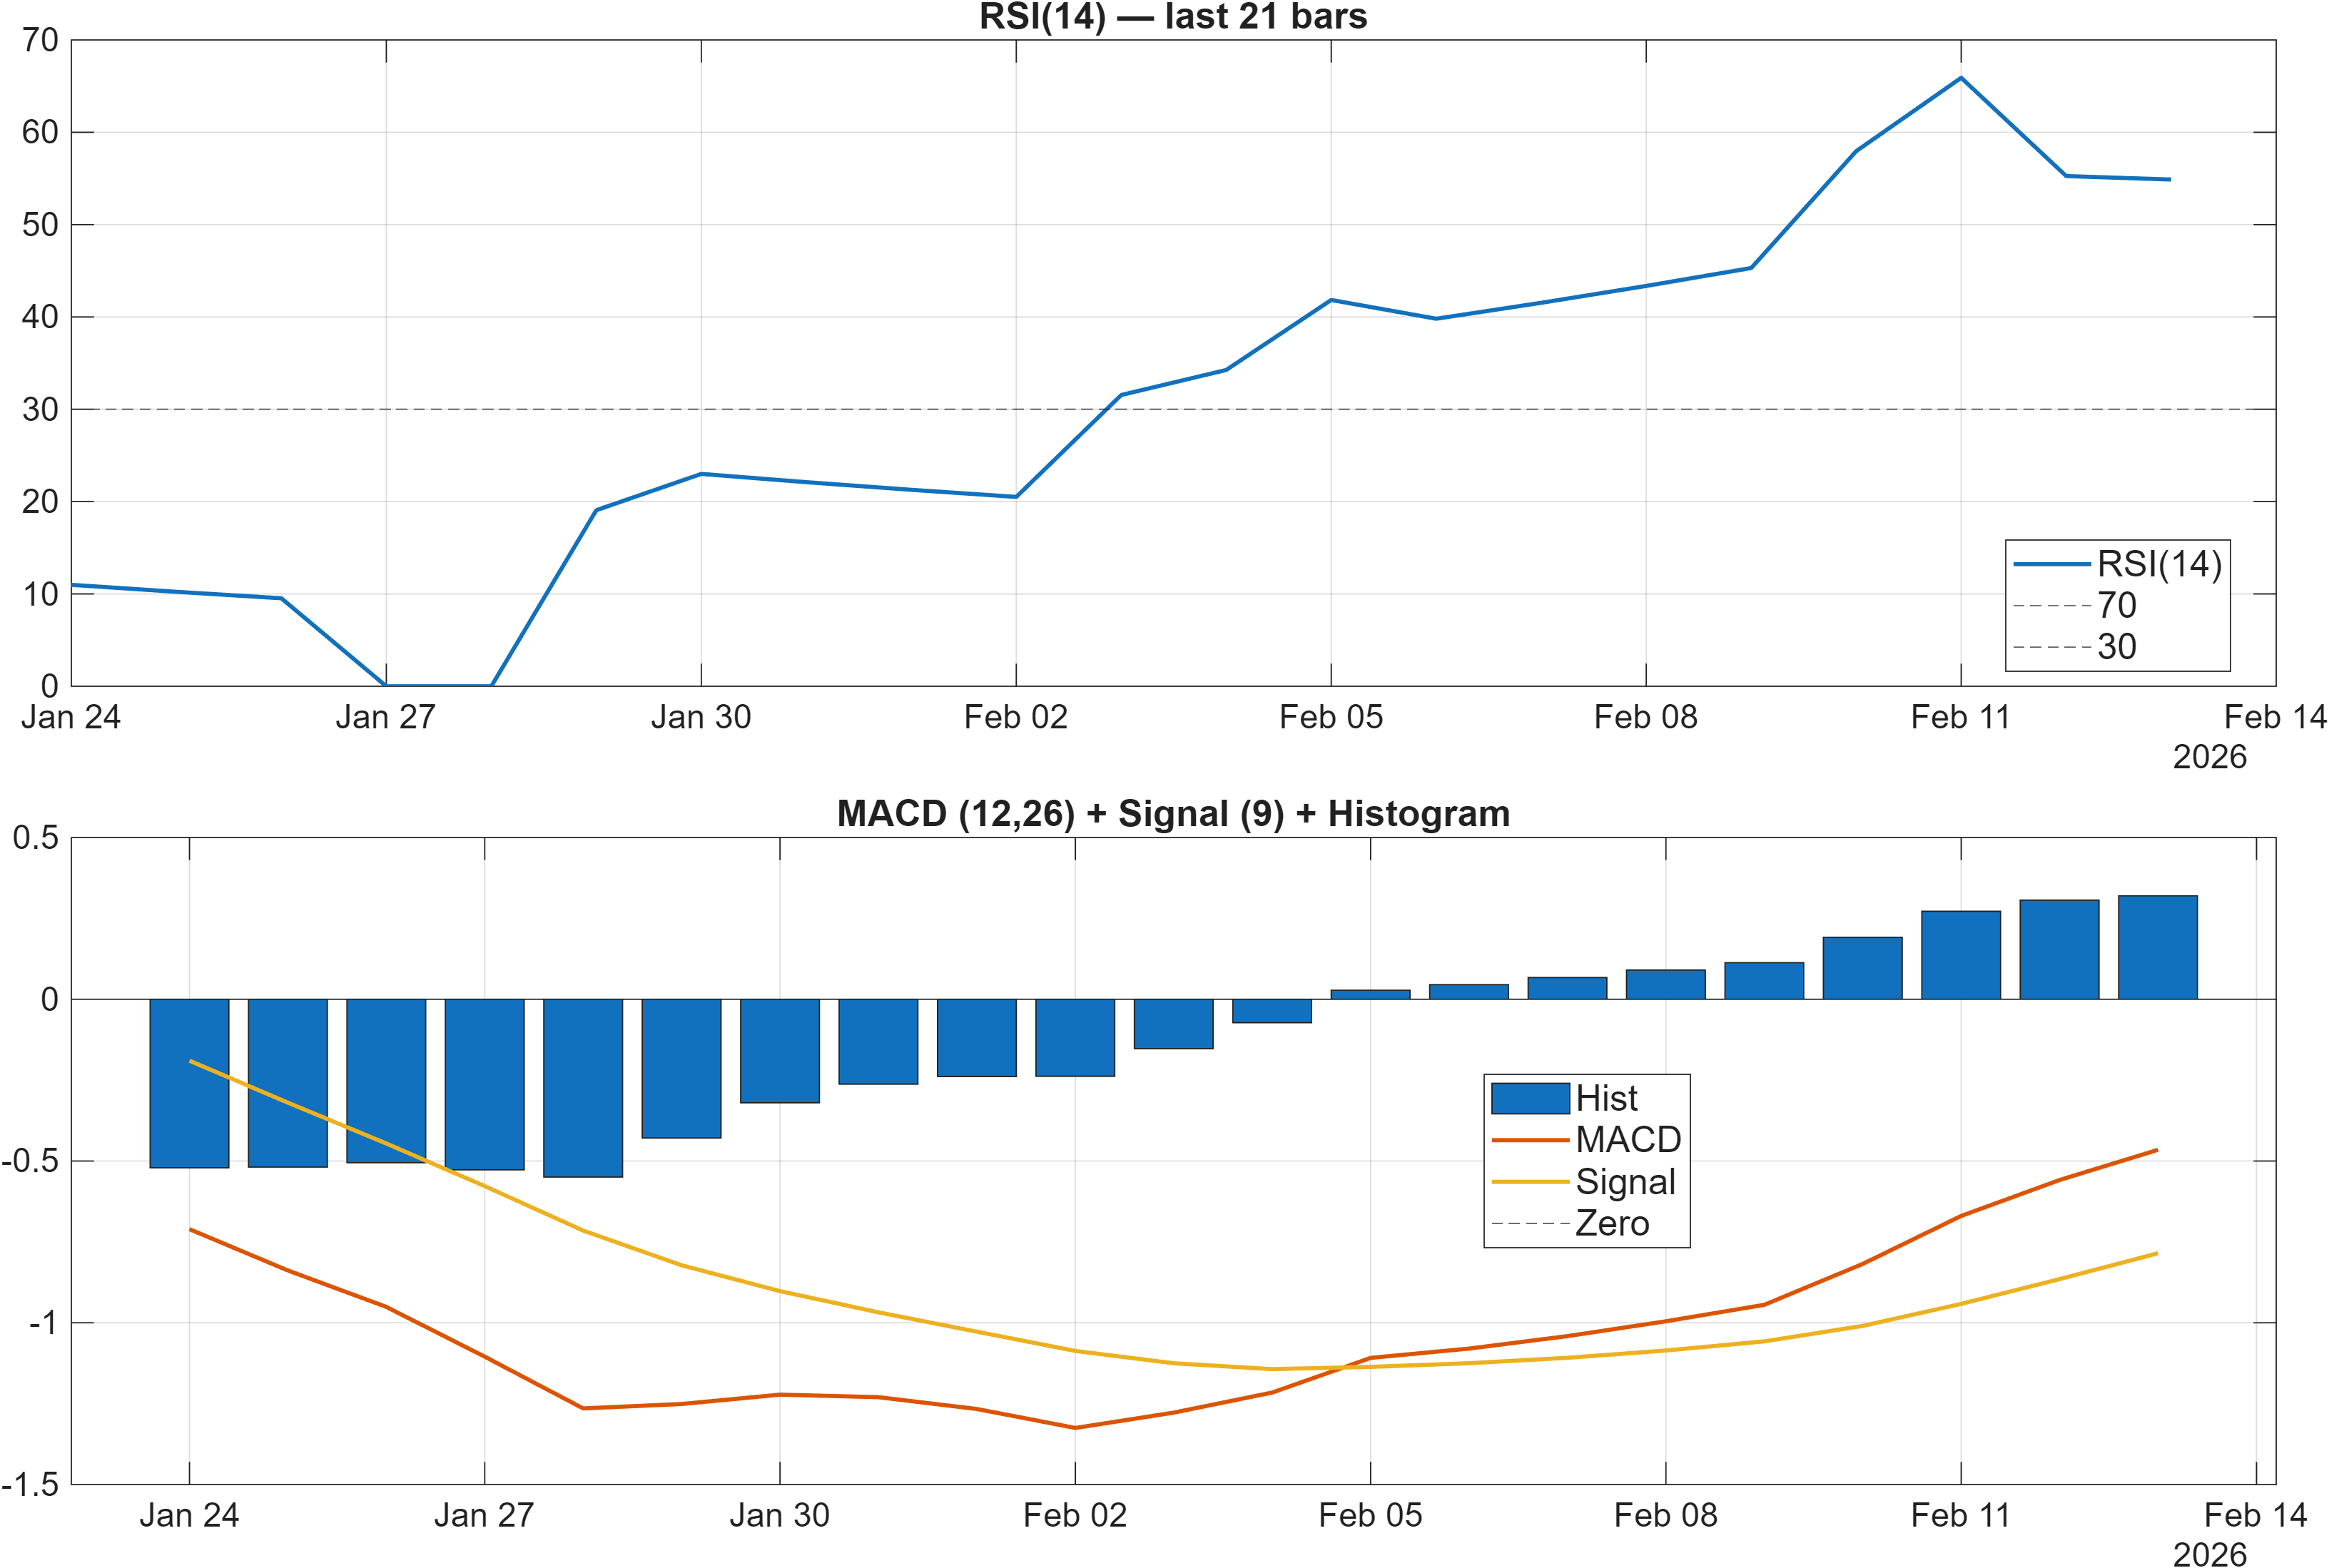
Momentum signals are constructive but not extreme. The RSI bias is Neutral with RSI(14) at 54.88, which typically aligns with a market that is neither overbought nor washed out. At the same time, the MACD histogram is 0.3198, a positive reading consistent with improving momentum. This pairing often appears when a trend is building rather than climaxing, particularly when the short-term rank remains Neutral.
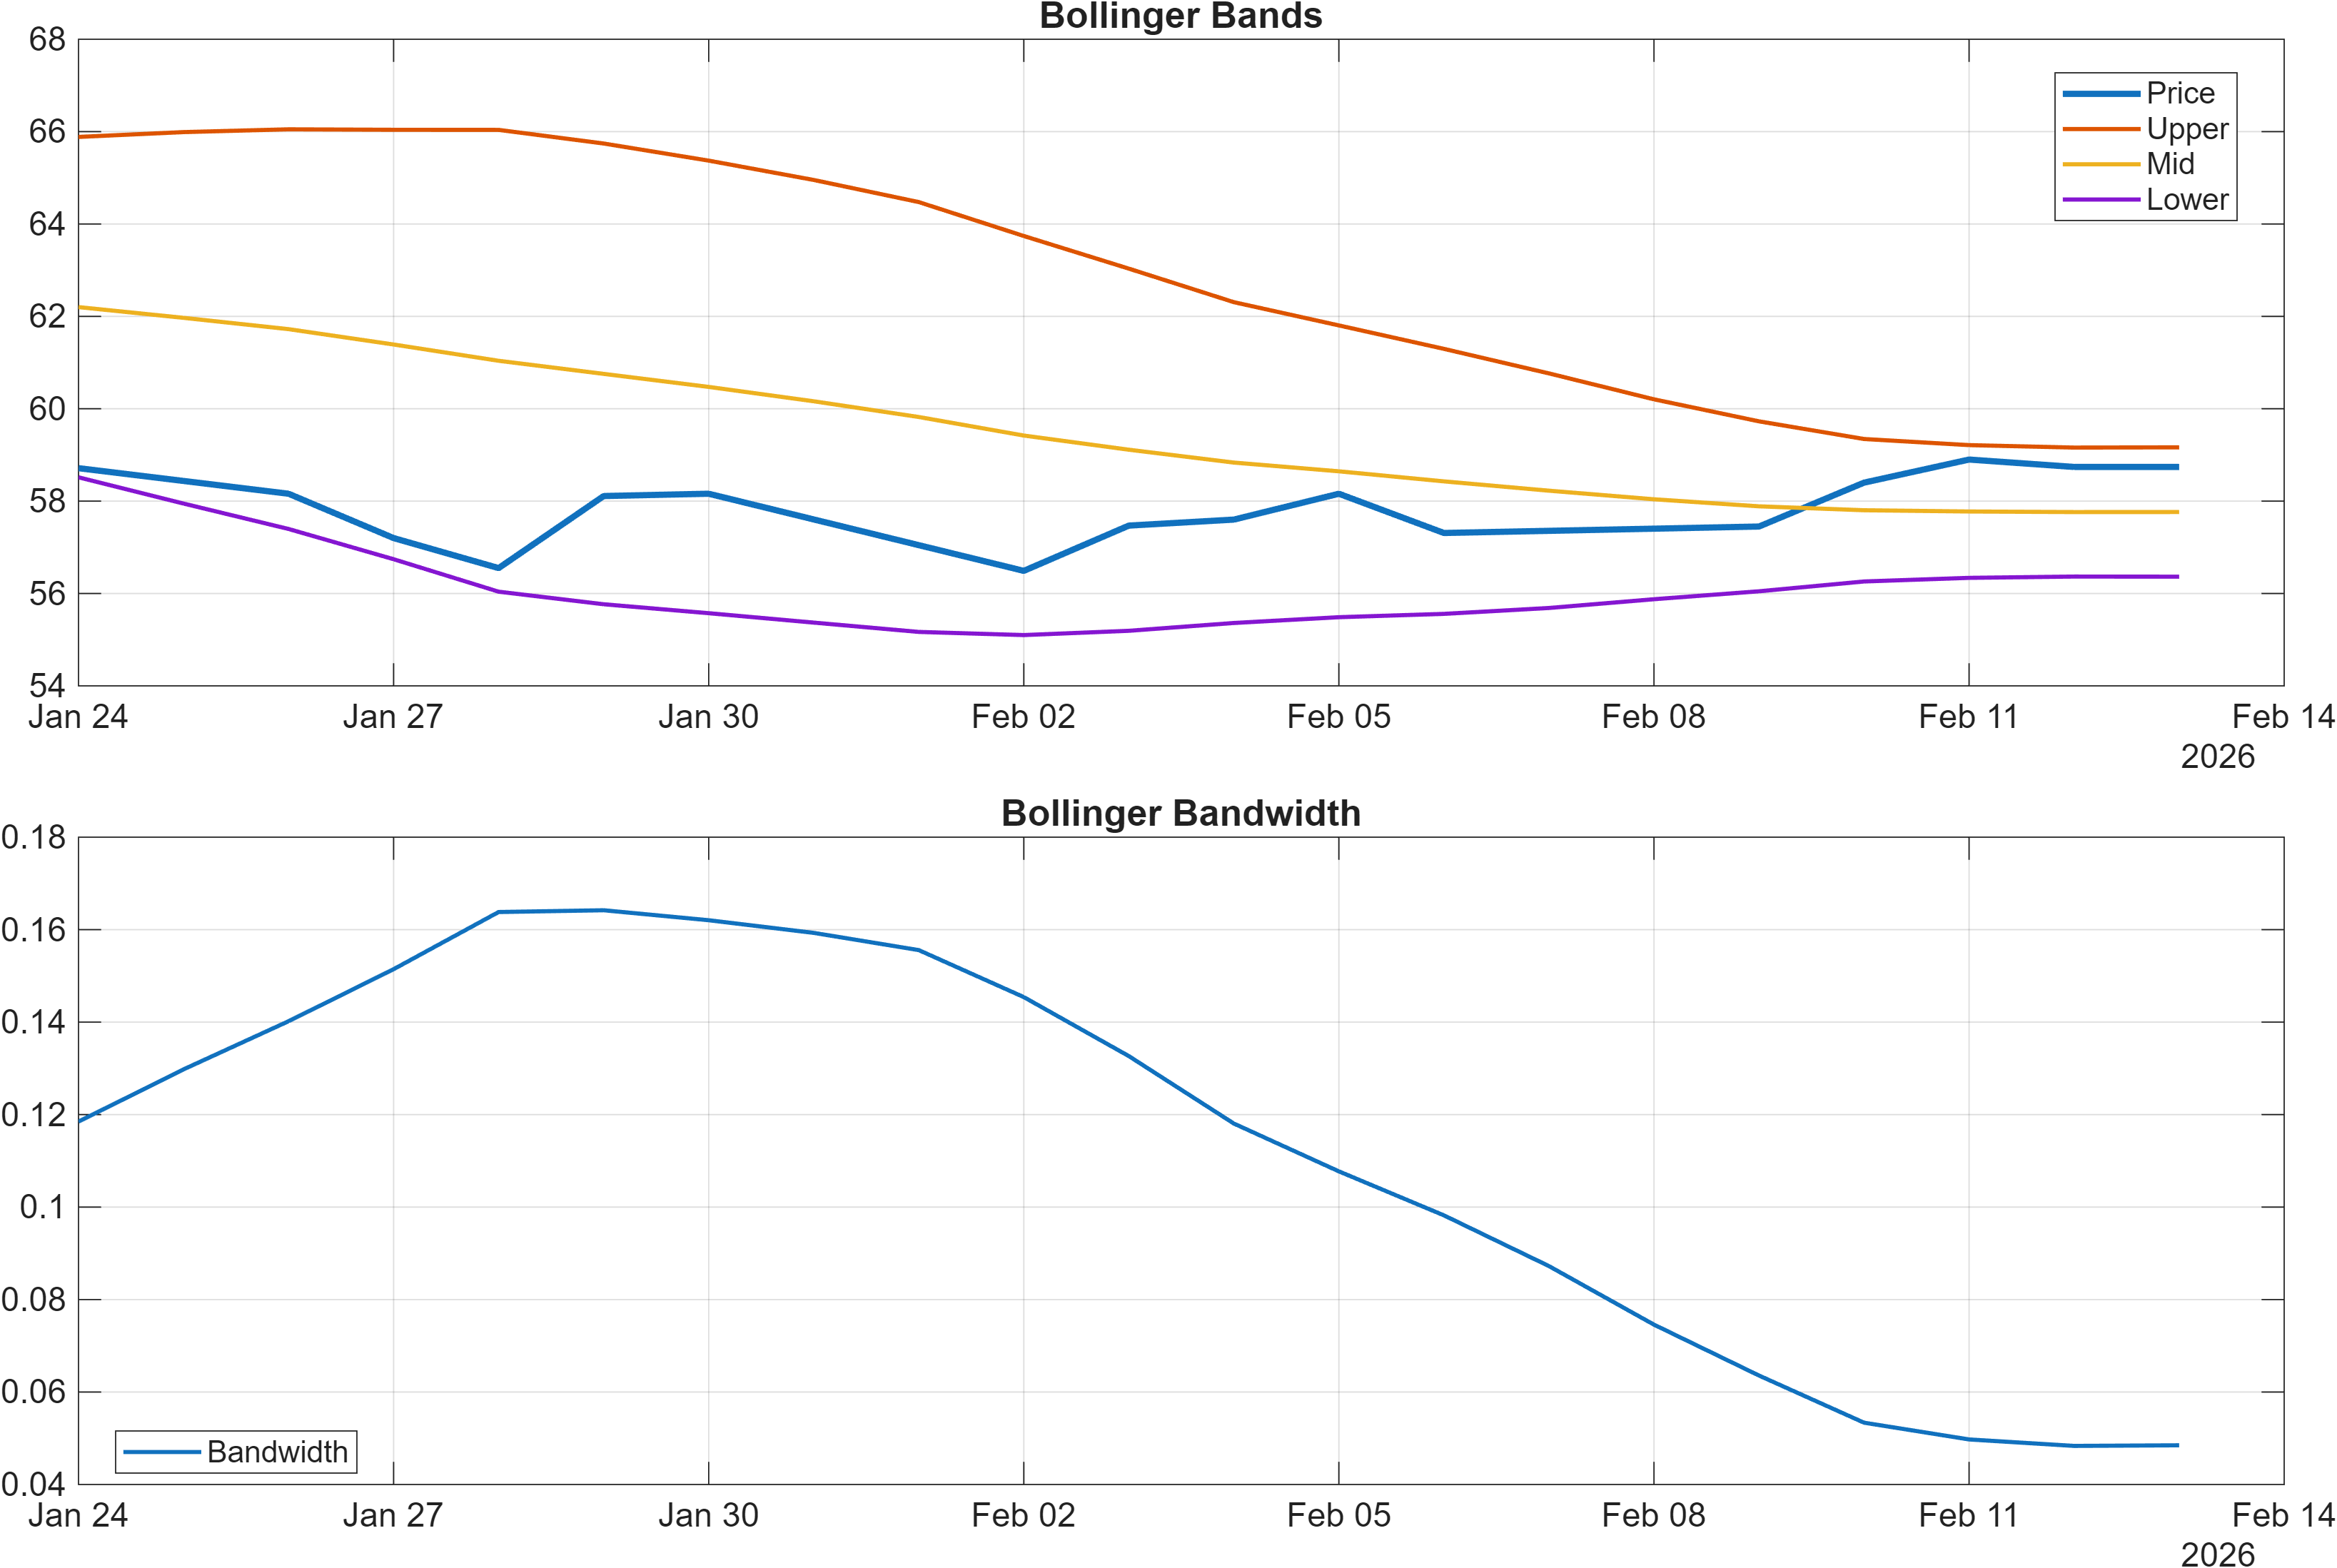
Volatility is currently compressed: Bandwidth latest = 0.0485. In Bollinger Band terms, low bandwidth frequently coincides with range compression where the next material move tends to be resolved by a directional break rather than a drift. This is consistent with the support/resistance map centered on 56.8967 and 64.2500: compressed volatility increases the importance of those boundaries as “decision zones.”
The key analytical nuance is that positive momentum (MACD hist 0.3198) can exist during compression without guaranteeing continuation; it simply indicates that recent price action has had an upside bias. With RSI still neutral (54.88), the tape is not signaling exhaustion. The more rigorous read is to treat momentum as eligible for continuation, but to require confirmation through the range resolution and, per the scenario definition, volume behavior.
4) Support / Resistance zones
Support ~ 56.8967 | Resistance ~ 64.2500
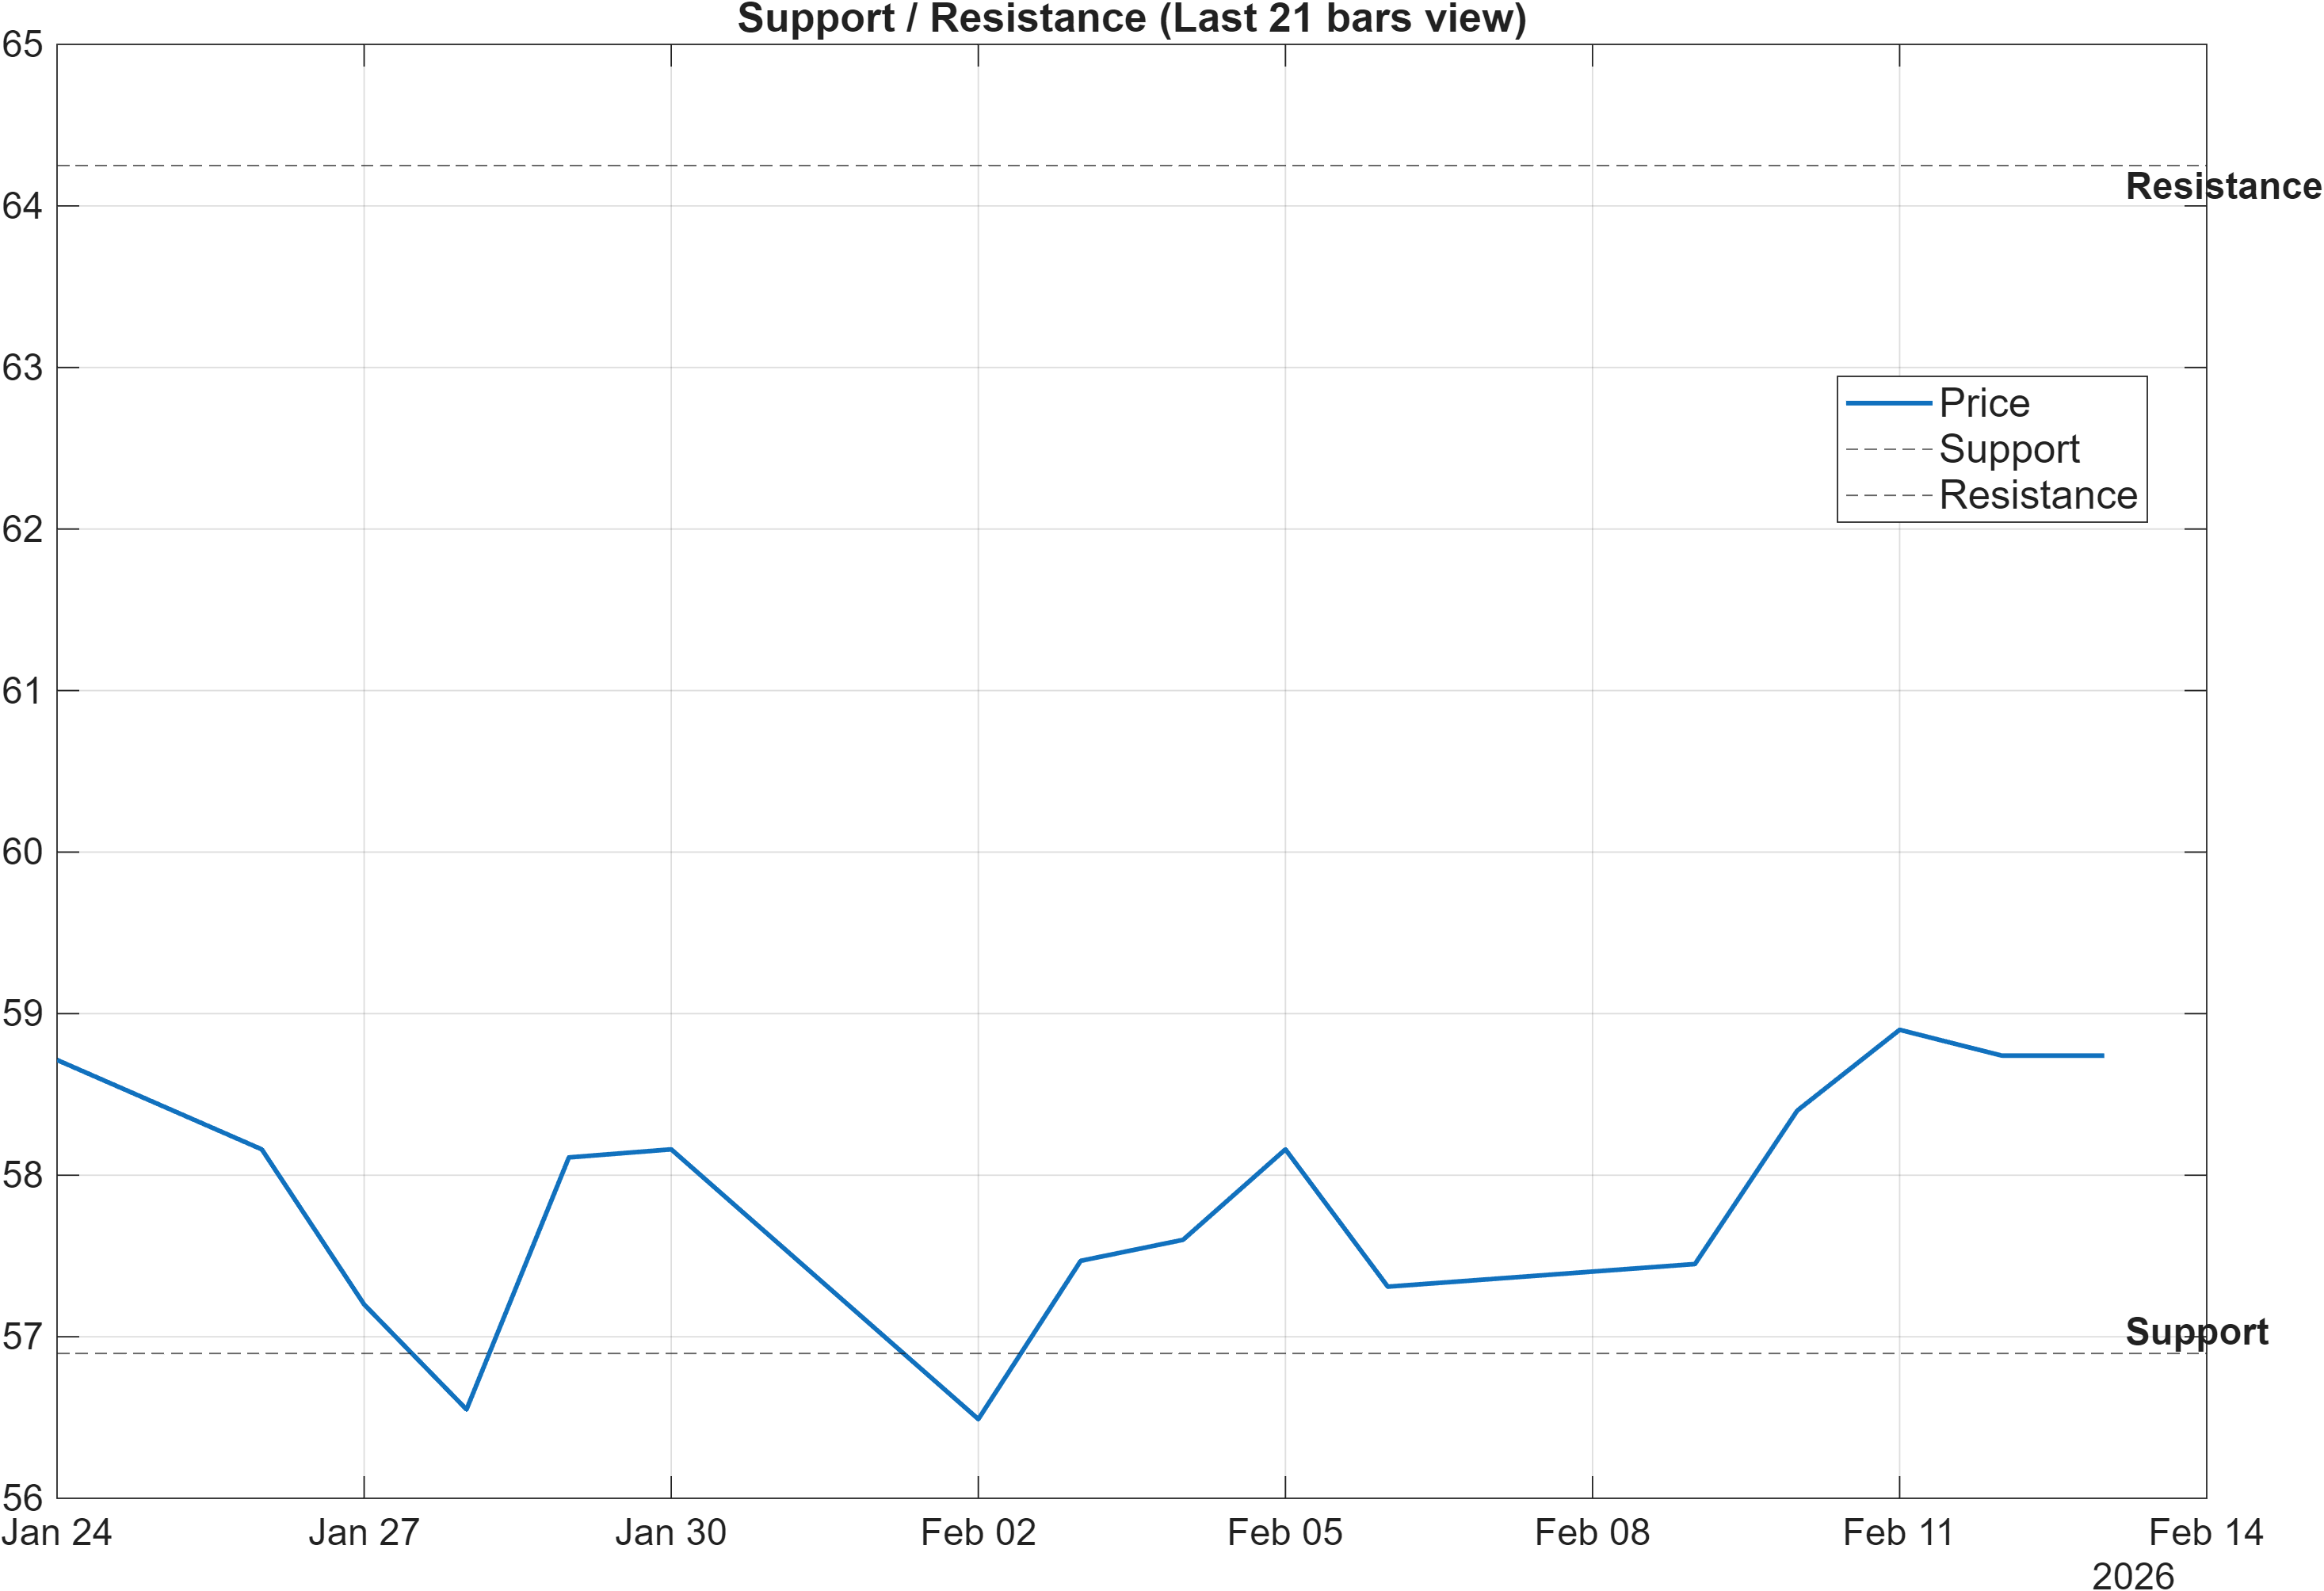
The current structure is framed around a clean two-level map: 56.8967 as support and 64.2500 as resistance. With volatility tight (0.0485 bandwidth) and momentum constructive (MACD hist 0.3198), these levels become less about “targets” and more about diagnostics—where the market reveals whether it is transitioning into a stronger trend or reverting back into range behavior.
The scenario guidance is explicit: break above resistance with volume → continuation, while a close below support → signal deterioration risk. This aligns with the rank profile: the medium-to-long windows are bullish (Monthly #22, 3-Month #39), but the short-term window is neutral (Daily #504). In practice, that configuration often makes the upside case more credible when the breakout is confirmed, and the downside case more relevant when a breakdown forces the short-term model’s neutrality to resolve negatively.
Treat the band between these levels as the market’s “negotiation zone.” A sustained hold above 56.8967 keeps the longer-horizon strength in play; repeated rejection near 64.2500 without participation would be more consistent with consolidation. The stronger the alignment between price behavior at these levels and the participation metrics in the dashboard, the more reliable the interpretation tends to be.
5) Quant Technical Dashboard (18 Signals)
KGNAI AI Technical Analysis Score (Deep Reinforcement Learning): Rank #475 out of 1294 (Rank 1 represents the strongest technical positioning and a higher probability of favorable price behavior. As ranks increase toward the maximum, the probability of favorable outcomes weakens and bearish positioning becomes more dominant.) | Label: Neutral | Score: 0.266
18-Signal Technical Confluence Score: 0.389 (Bullish)
Overall Technical Score (18-signal confluence + DRL rank blend): 0.352 (Bullish)
Note: The blended score reflects signal strength weighted against broader AI technical ranking, which may temporarily diverge.
Blended technical score breakdown: 0.352 (Bullish | Bull 10 / Bear 3 / Neutral 5)
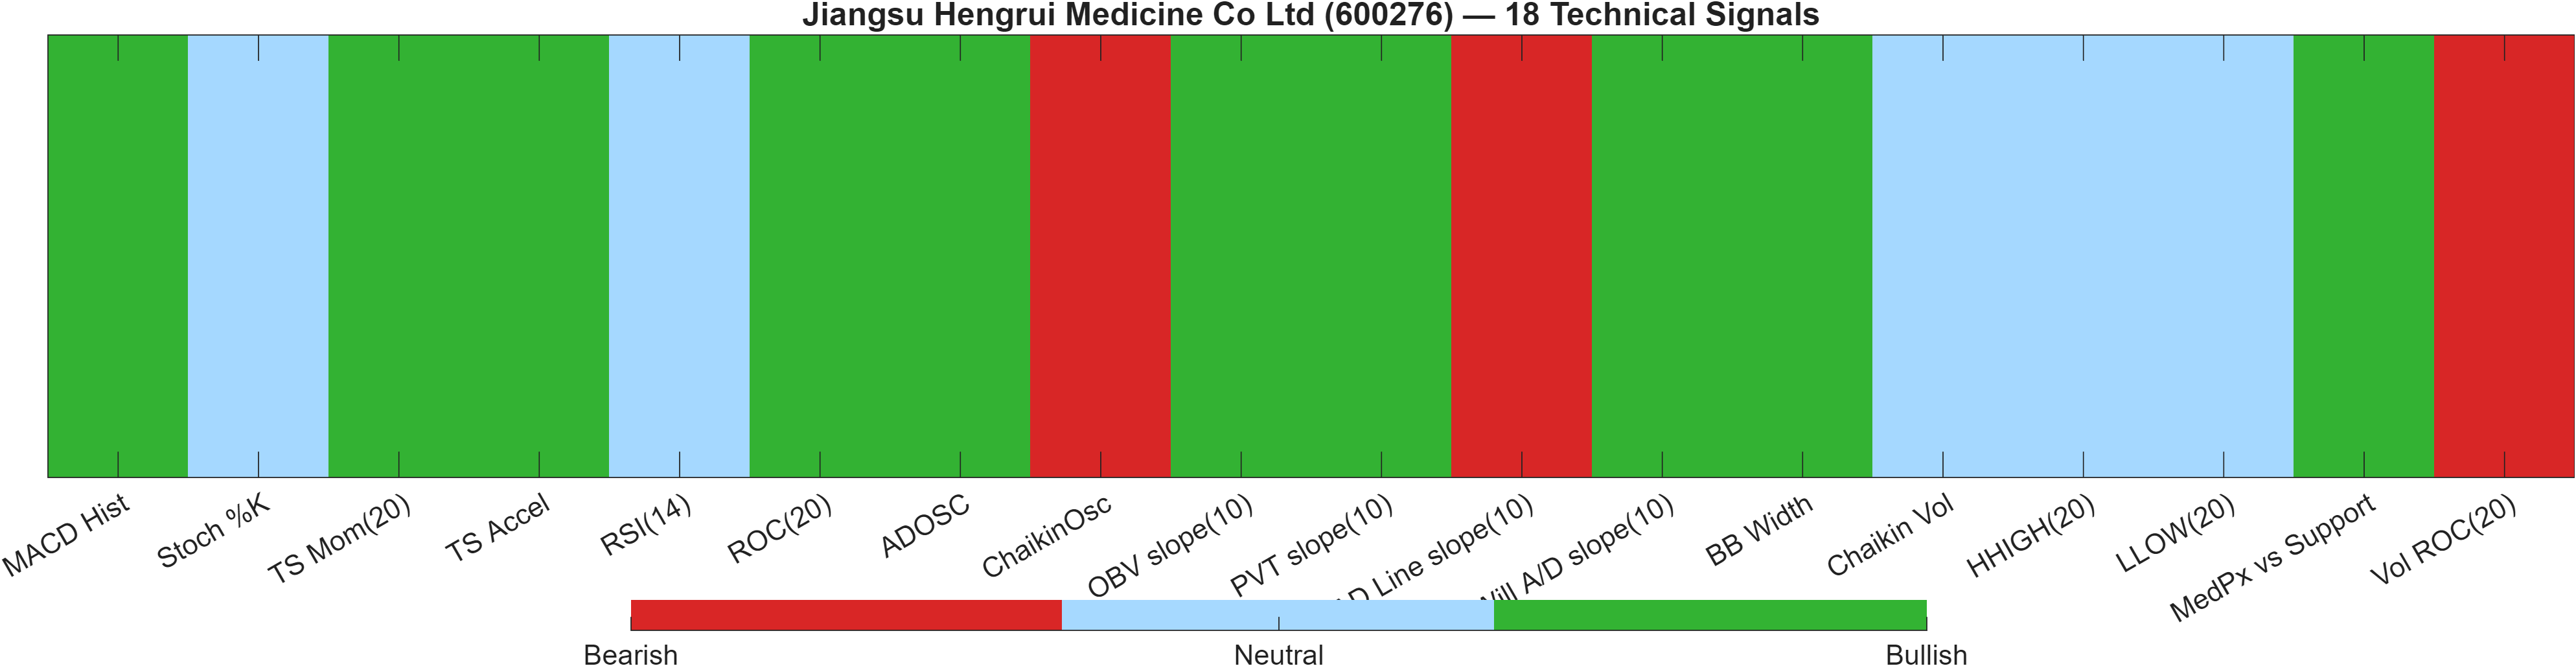
Signal table (Bull/Bear/Neutral)
| Indicator | Value | Signal |
|---|---|---|
| MACD Hist | 0.3198 | Bullish |
| Stoch %K | 67.47 | Neutral |
| TS Mom(20) | 0.3033 | Bullish |
| TS Accel | 4.927 | Bullish |
| RSI(14) | 54.88 | Neutral |
| ROC(20) | 0.5191 | Bullish |
| ADOSC | 57.07 | Bullish |
| ChaikinOsc | -3.168e+07 | Bearish |
| OBV slope(10) | 2.613e+08 | Bullish |
| PVT slope(10) | 1.645e+06 | Bullish |
| AD Line slope(10) | -2.486e+07 | Bearish |
| Will A/D slope(10) | 3.5 | Bullish |
| BB Width | 0.04848 | Bullish |
| Chaikin Vol | -24.02 | Neutral |
| HHIGH(20) | 59.95 | Neutral |
| LLOW(20) | 56.08 | Neutral |
| MedPx vs Support | 2.098 | Bullish |
| Vol ROC(20) | -53.77 | Bearish |
The technical stack is defined by breadth with a few participation frictions. The confluence engine is Bullish (0.389) and remains Bullish after blending (0.352), supported by a 10 / 3 / 5 Bull/Bear/Neutral split. Momentum/price signals are generally constructive—MACD hist 0.3198 and TS Accel 4.927 both lean positive—while volatility metrics (BB Width 0.04848) reinforce the compression narrative seen in the bandwidth chart.
The main caveat is the divergence between the Neutral DRL technical rank (#475; score 0.266) and the Bullish confluence. When a learned ranking model is less enthusiastic than the indicator stack, it can mean the market is improving but still lacking in one or more quality dimensions (often consistency, trend maturity, or participation behavior). That interpretation aligns with the participation-side mixed signals: Vol ROC(20) at -53.77 is Bearish even as OBV slope(10) at 2.613e+08 is Bullish, pointing to a market where volume dynamics are not perfectly uniform across measures.
Net: the dashboard supports a constructive bias, but the presence of Bearish readings in volume-linked indicators argues for using 64.2500 (breakout confirmation) and 56.8967 (breakdown risk) as the practical validation framework.
6) News sentiment + extractive gist
Note: Instrument-specific news matches were not found, so the digest includes broader market/sector headlines. Links are provided for verification.
Sentiment score (avg): -0.011 | Positive: 6% | Neutral: 88% | Negative: 6%
KGNAI AI News Sentiment Score (normalized -1 to +1): 1.00 (as of 2026-02-03) | Label: Bullish | Overall news score: 0.90
Positive Developments
Recent coverage across major financial outlets reflects a generally stable-to-constructive macro backdrop for risk assets, with several narratives leaning supportive in the near term. Softer inflation discussion has been associated with renewed attention on the path of interest rates, which can improve discount-rate expectations and overall risk appetite. In parallel, policy and regulatory updates around global energy operations and investment permissions have been discussed as signals of changing constraints—developments that markets often treat as incremental improvements in cross-border operating conditions. While these items are not instrument-specific for 600276, the sentiment model’s normalized score of 1.00 (Bullish) suggests that the aggregate textual tone detected in the matched corpus has skewed constructive, even though the distribution remains heavily Neutral (88%). For price action already showing constructive momentum (MACD hist 0.3198), a benign news tone can function as background support rather than a primary catalyst.
Neutral / Mixed Developments
The dominant feature of the digest is the lack of instrument-specific matches, which naturally pushes the section toward macro and cross-sector information. In that setting, most coverage reads as context rather than a directional driver—consistent with the sentiment breakdown showing only 6% Positive and 6% Negative. Discussion around public finance constraints and budget outlooks can be interpreted in multiple ways: it may signal policy limitations, but it can also hint at future adjustments designed to stabilize conditions. Similarly, operational updates and administrative decisions reported in the broader media tend to be headline-sensitive but transient in market impact unless they translate into tighter financial conditions or direct sector constraints. For 600276, this “mostly neutral” environment places greater weight on technical decision points (56.8967 / 64.2500) and on whether compressed volatility (0.0485 bandwidth) resolves upward or downward.
Negative / Risk Signals
The clearest risk thread in the broader digest relates to uncertainty around inflation and policy reaction functions. Even when inflation readings improve, market narratives can shift quickly if the path to sustained improvement is questioned, which can reintroduce rate volatility and compress equity risk appetite. Additional risk framing comes from the general possibility that macro headlines can dominate short-term flows—even when an individual equity’s medium-term positioning looks strong (e.g., Monthly rank #22). With the stock’s short-term rank still Neutral (Daily #504), it may be more sensitive to abrupt sentiment swings than its longer-term ranks imply. In that context, the report’s scenario guidance remains the practical filter: watch for confirmation above 64.2500 with participation, and treat a close below 56.8967 as an elevated deterioration risk signal.
- Whether price can clear 64.2500 alongside confirming volume behavior.
- Whether volatility compression (0.0485 bandwidth) transitions into expansion without breaking 56.8967.
- Any shift in the sentiment distribution away from 88% Neutral that coincides with the level breaks.
Sources referenced: Reuters, Bloomberg, Yahoo Finance, MarketWatch, Investing.com
7) Sources
Not available in the provided data.
You may also like: How KGNAI AI ranks instruments across global markets
Disclaimer: KGNAI provides AI-generated analytics and educational market commentary only. This is not financial advice. Markets involve risk. Always do your own research.