
600025 — Huaneng Lancang River Hydropower Inc Class A (15-Feb-2026) | Neutral stance, strong longer-horizon ranks vs soft near-term structure
Huaneng Lancang River Hydropower Inc Class A (600025) presents a neutral near-term profile inside KGNAI’s CHINA universe of 1294 instruments, while maintaining a distinctly stronger positioning over longer horizons. The rank stack is mixed across timeframes—Daily #82 and Monthly #43 lean constructive, while the Weekly #265 sits in a more middle-of-pack regime. Longer-duration ranks remain notably strong (3-Monthly #10, 6-Monthly #1, Yearly #2), which often reflects persistence in broader statistical behavior even when price structure softens. Technically, the blended view is Neutral with an Overall Technical Score of -0.299 and a 18-signal confluence of -0.278, consistent with “wait for resolution” conditions rather than trend acceleration. Support and resistance sit at 8.9900 and 9.3550, framing the current decision zone alongside a subdued volatility regime (Bandwidth 0.0297) and a Neutral RSI backdrop (RSI(14) 45.39).
- Rank stance: Short-term Neutral; Mid-term Bullish; Long-term Bullish (notably strong at 6-Monthly #1 and Yearly #2).
- Technical confluence: Neutral (Overall Technical Score -0.299; confluence -0.278).
- Key levels: Support 8.9900 | Resistance 9.3550.
- News sentiment bias: Neutral (avg 0.013; 94% neutral; 0% negative).
- Confirmation / invalidation: A break above 9.3550 with volume supports continuation; a close below 8.9900 increases deterioration risk.
What KGNAI Measures
KGNAI ranks instruments by relative positioning across a large universe, emphasizing alignment across multiple tests rather than isolated indicator strength. The framework is designed to capture probabilistic behavior patterns that tend to persist across regimes, while allowing for temporary divergences between price structure and model ranks.
How to Read This Report
- Ranks are comparative (within 1294 instruments), not absolute forecasts.
- Confluence reflects agreement across signals (and can be neutral during compression).
- Support/resistance are decision zones (8.9900 / 9.3550), not targets.
- Sentiment provides contextual bias (here: mostly neutral at 94%).
1) KGNAI AI Analysis
Region: CHINA
Total universe size: 1294 ranked instruments
- Daily rank: #82 out of 1294 — Bullish
- Weekly rank: #265 out of 1294 — Neutral
- Monthly rank: #43 out of 1294 — Bullish
- 3-Monthly rank: #10 out of 1294 — Bullish
- 6-Monthly rank: #1 out of 1294 — Bullish
- Yearly rank: #2 out of 1294 — Bullish
The rank profile for 600025 is best described as short-horizon mixed but longer-horizon dominant. Within a 1294-instrument universe, a Daily #82 places the name in the upper slice of the distribution, while the Weekly #265 is closer to the broad middle—often a sign that the most recent impulse has not fully aligned with the broader model view. By contrast, the 3-Monthly #10 moves into the top decile, and the 6-Monthly #1 alongside Yearly #2 indicates the strongest relative positioning over those horizons.
This time-horizon divergence matters because it can appear during regime transitions: longer-horizon ranks can remain strong even when technical structure (moving averages, momentum) degrades temporarily. In this report, that tension is visible again later: the price/trend block flags bearish moving-average relationships, while the rank stack remains constructive beyond the weekly window.
Term view: Short-term: Neutral. Mid-term: Bullish. Long-term: Bullish. Practically, that combination tends to reward patience and level discipline—using 8.9900 and 9.3550 as confirmation boundaries—rather than treating the longer-horizon strength as sufficient on its own.
Want the full universe and complete rank tables? Unlock full access on KGNAI: https://www.kgnai.com/pricing
2) Price & trend overview
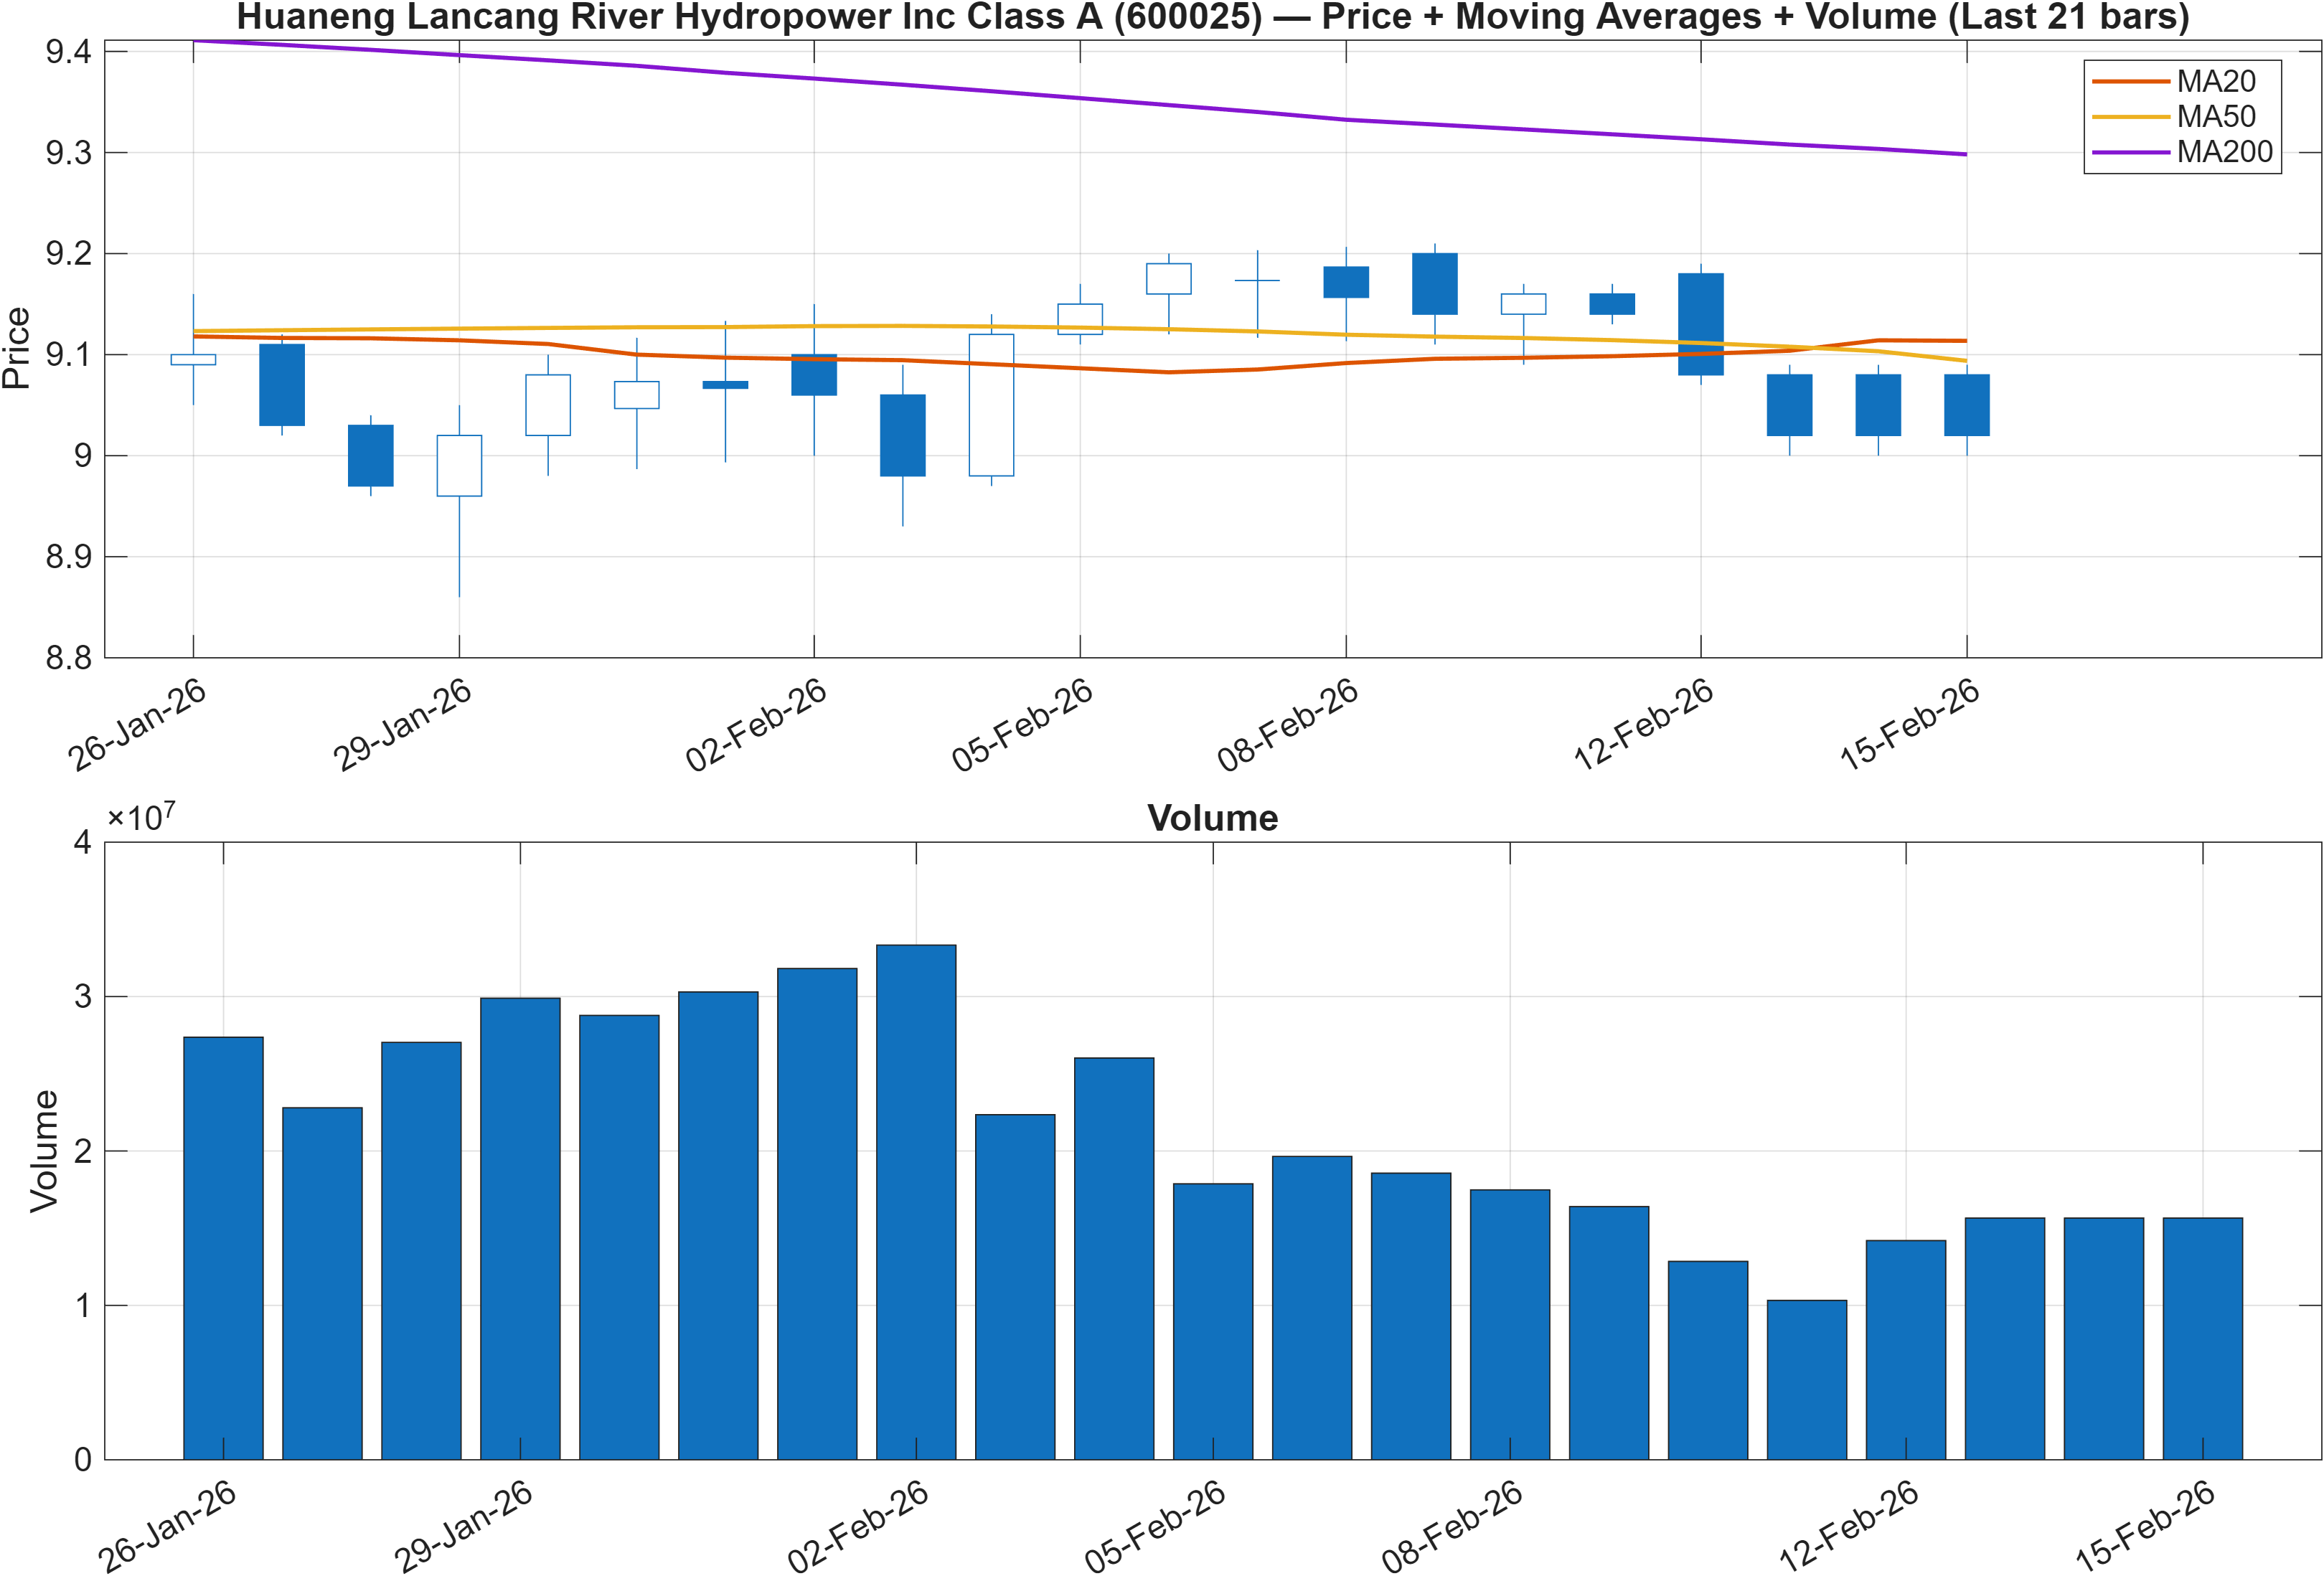
Interpretation: Close vs MA50 = Bearish, MA50 vs MA200 = Bearish.
Price structure is currently defined by a bearish relationship to trend filters: the close sits below the MA50, and the MA50 is below the MA200. This combination typically reflects a market that is still working through prior supply, where rallies can meet overhead friction until the shorter moving average begins to stabilize and reclaim longer trend measures.
The key analytical nuance is how this contrasts with the rank stack. A Daily #82 and Monthly #43 suggest the instrument is not behaving like a structurally weak laggard within its universe, yet the moving-average state indicates the tape has not re-validated a durable trend turn. In mixed regimes like this, follow-through often depends on whether the next advance can occur with participation (volume confirmation) rather than only mean reversion.
From a decision-zone perspective, the price map is clean: 8.9900 below acts as the nearby structural reference, while 9.3550 marks the level that needs to be reclaimed to reduce the probability that the bearish MA configuration continues to dominate. Until that occurs, the more constructive longer-horizon ranks (3-Monthly #10, 6-Monthly #1, Yearly #2) are best treated as a supportive backdrop—not a substitute for confirmation in trend structure.
3) Momentum & volatility dashboard
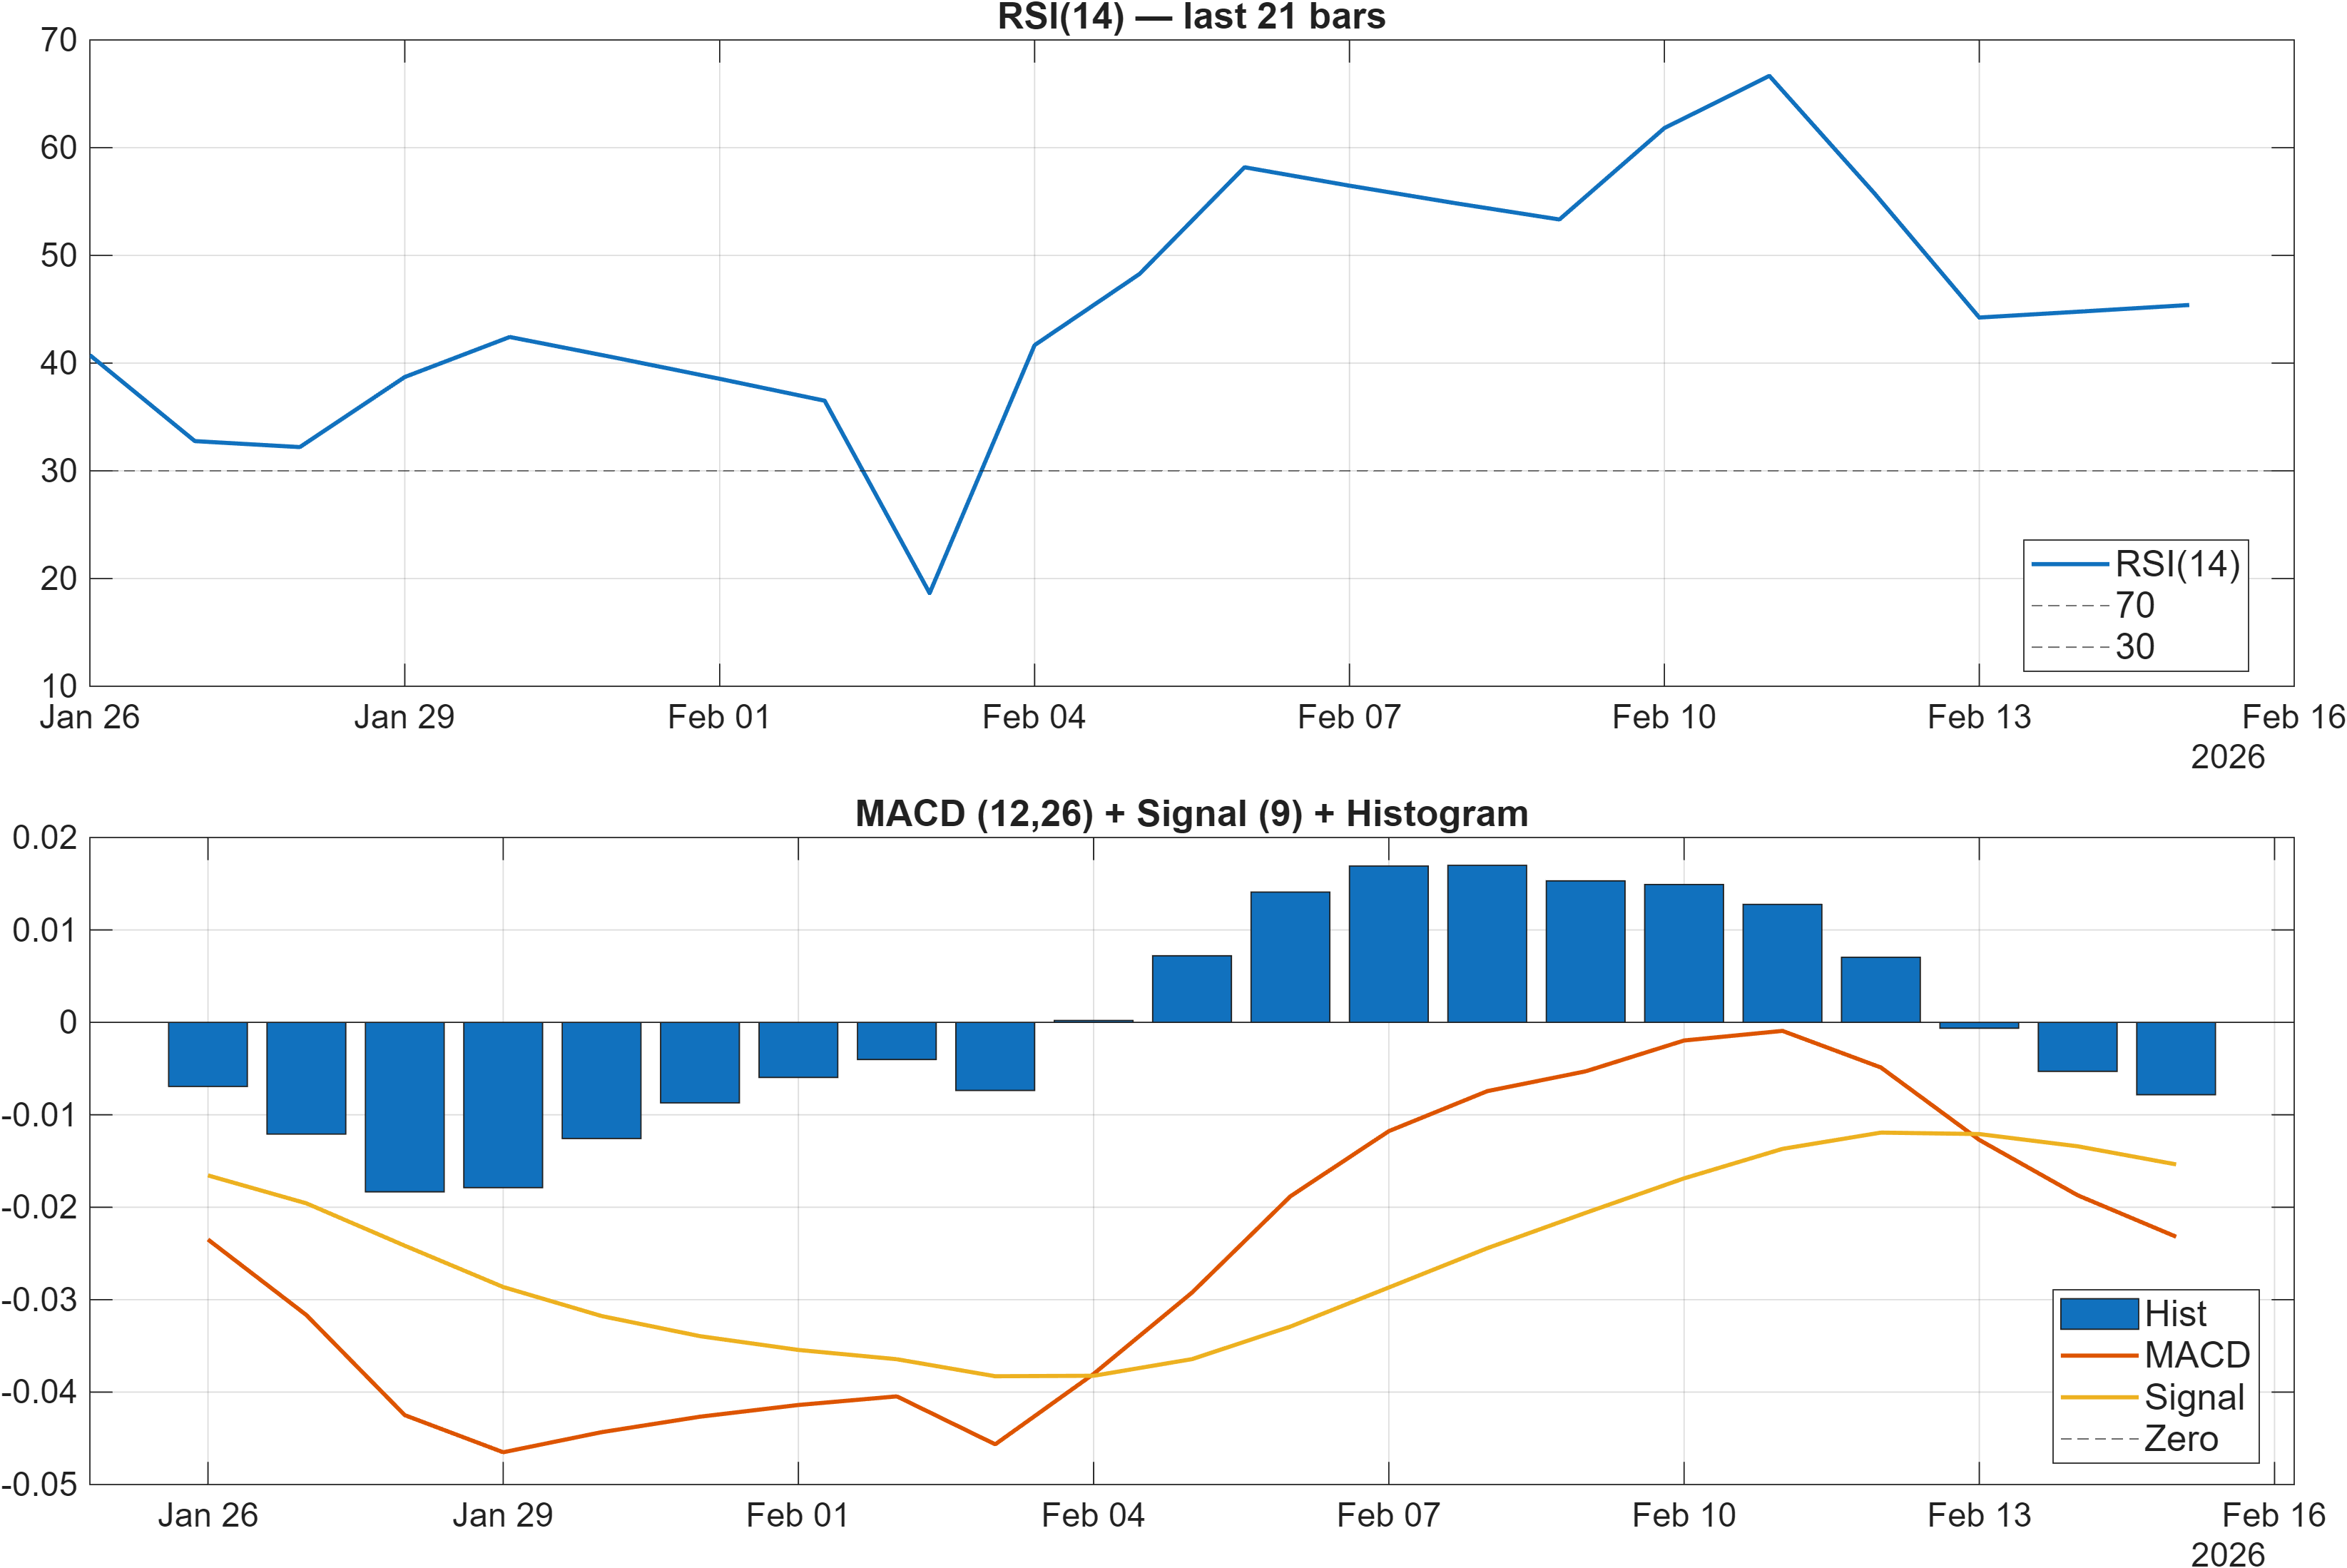
Interpretation: RSI bias = Neutral, MACD hist = -0.0078.
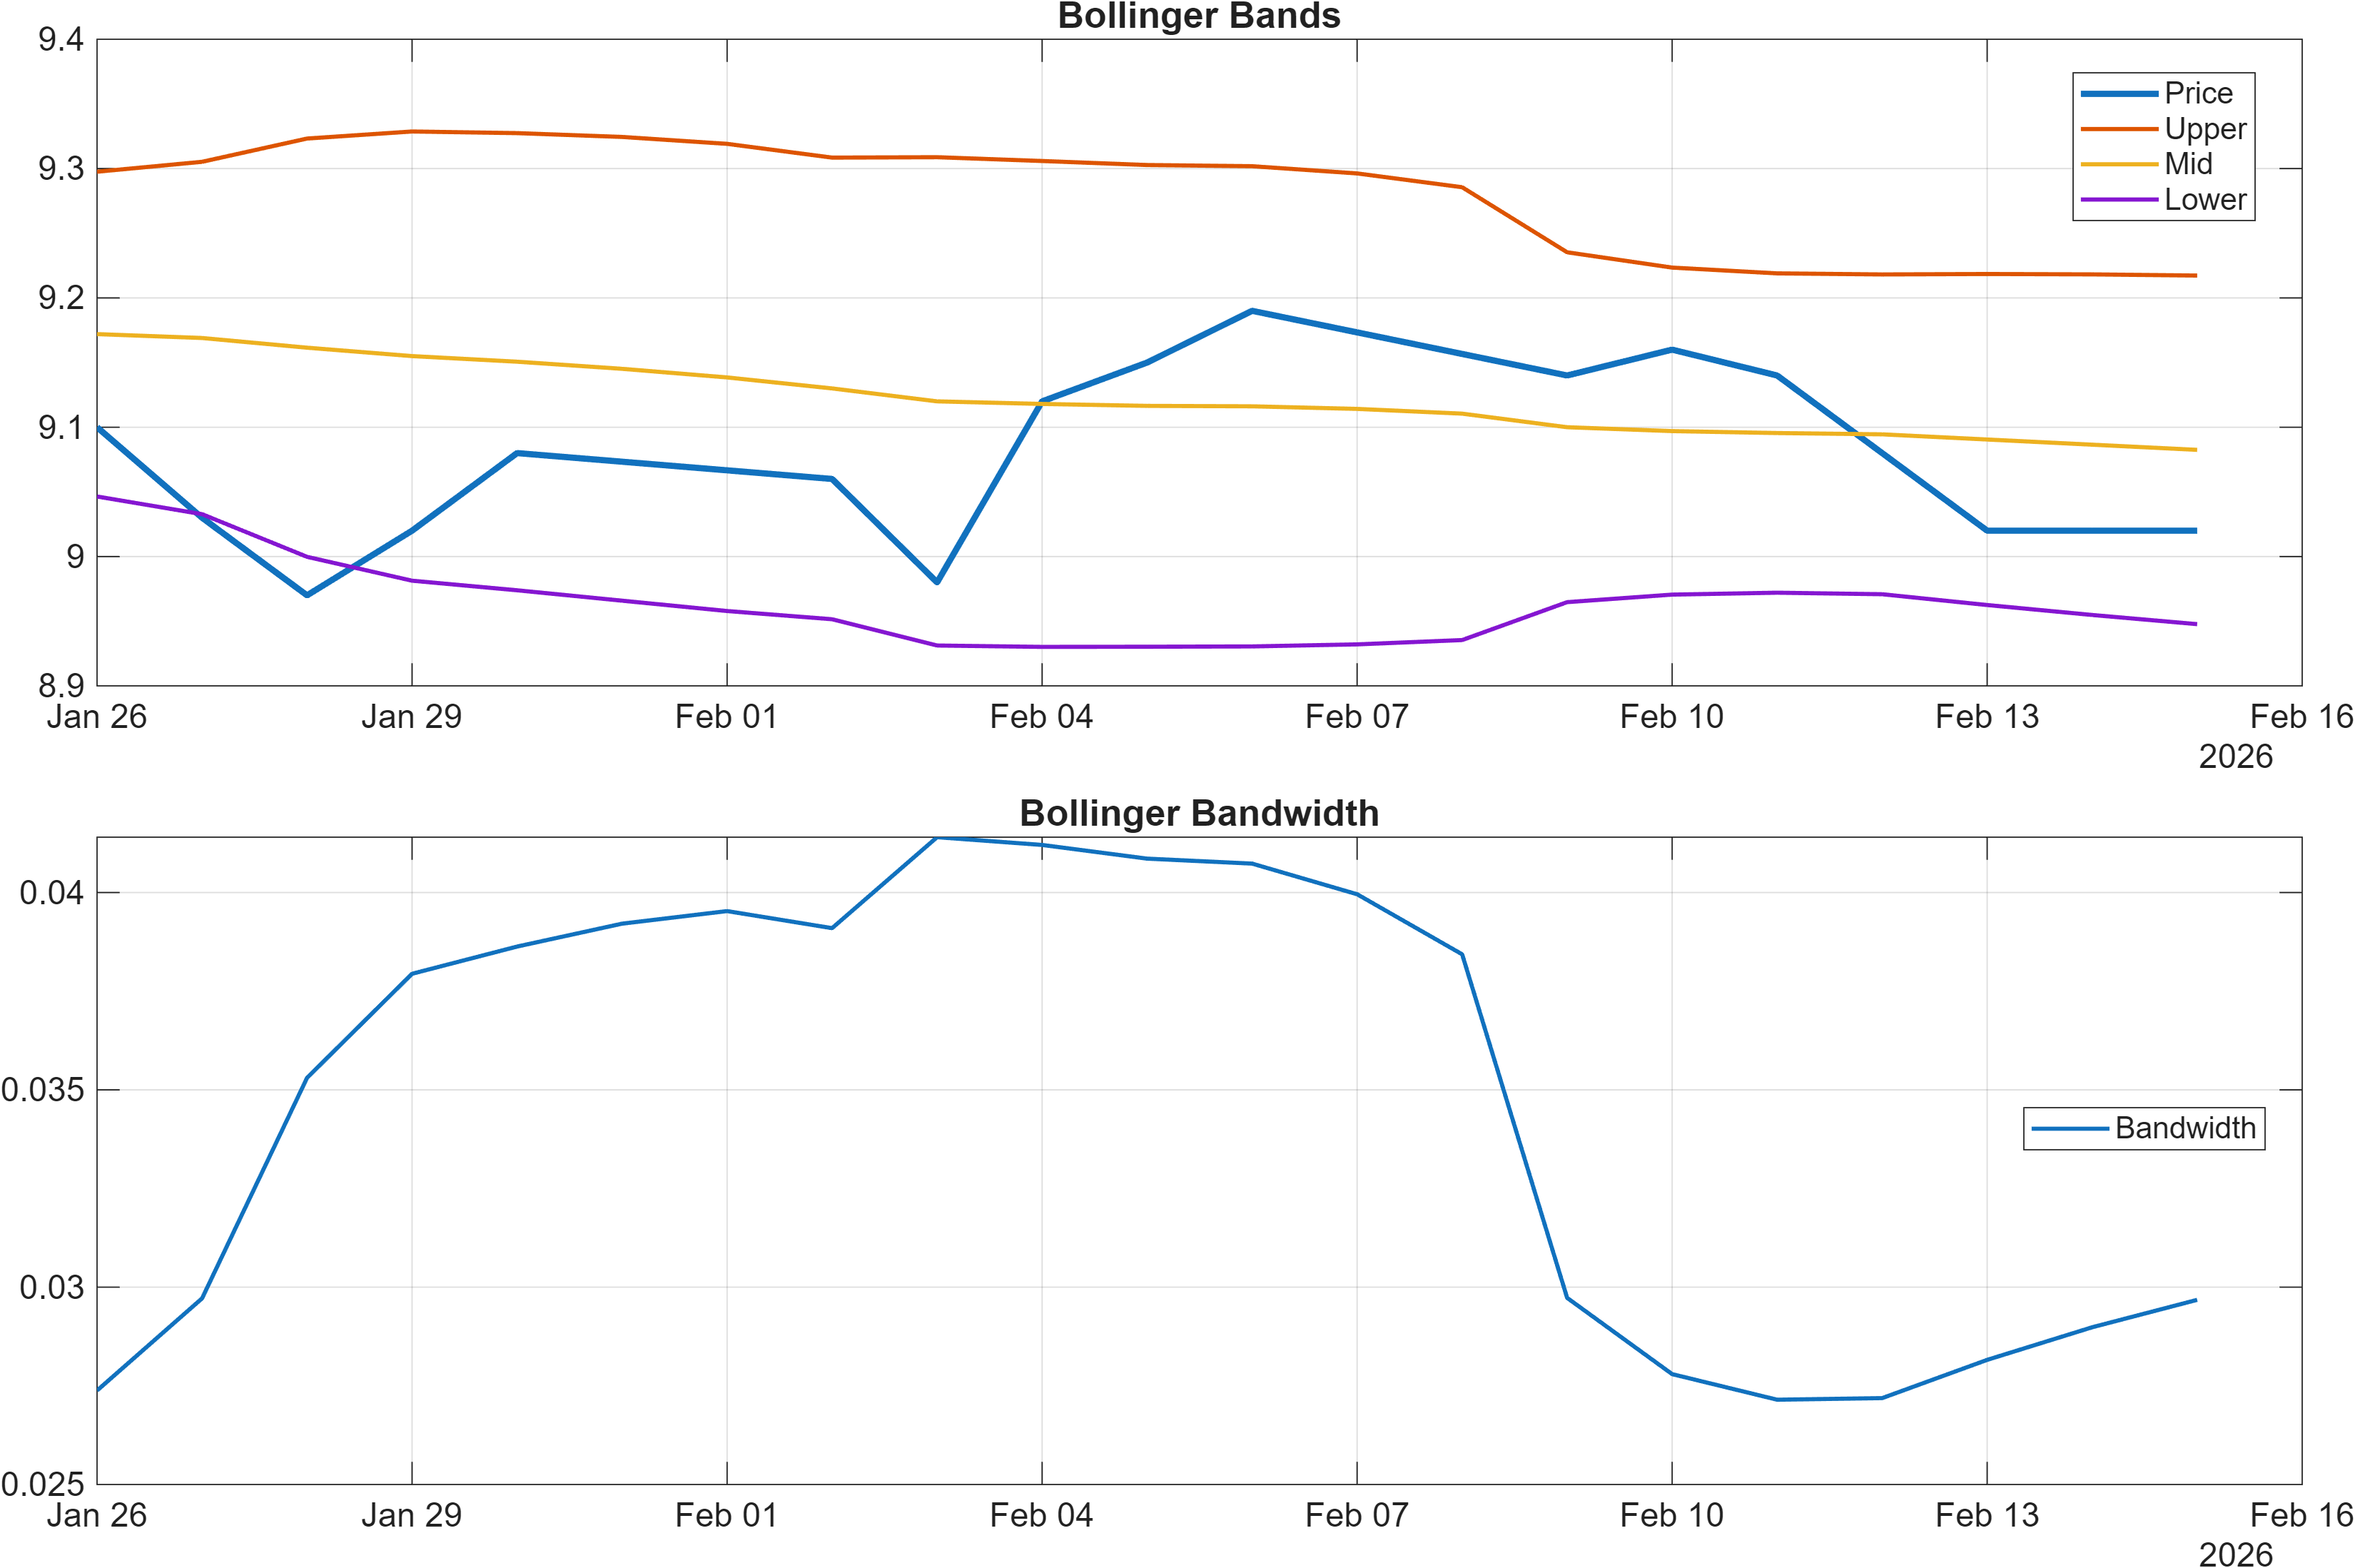
Interpretation: Bandwidth (volatility regime) latest = 0.0297.
Momentum is not currently providing a strong directional impulse. The RSI(14) 45.39 sits in neutral territory, consistent with a market that is neither extended on the upside nor washed out on the downside. At the same time, the MACD histogram at -0.007826 remains slightly negative, which generally aligns with the bearish moving-average configuration and suggests momentum has not convincingly flipped.
Volatility conditions lean compressed rather than expansive. The Bollinger bandwidth reading of 0.0297 indicates a relatively tight regime, which often corresponds to consolidation and a higher sensitivity to level breaks. In these regimes, a move through a well-defined boundary—here, 9.3550 on the upside or 8.9900 on the downside—tends to carry more informational value than smaller oscillations within the range.
Internally, there are early signs of short-cycle tension: Stoch %K at 9.524 reads bullish in the signal table, while broader momentum measures like ROC(20) -0.1107 and TS Mom(20) -0.01 remain bearish. That combination can occur near range lows where oscillators respond quickly, but trend measures lag. For 600025, the implication is straightforward: momentum is attempting to stabilize, but the weight of evidence still favors patience until either MACD improves materially or price confirms through resistance with participation.
4) Support / Resistance zones
Support ~ 8.9900 | Resistance ~ 9.3550
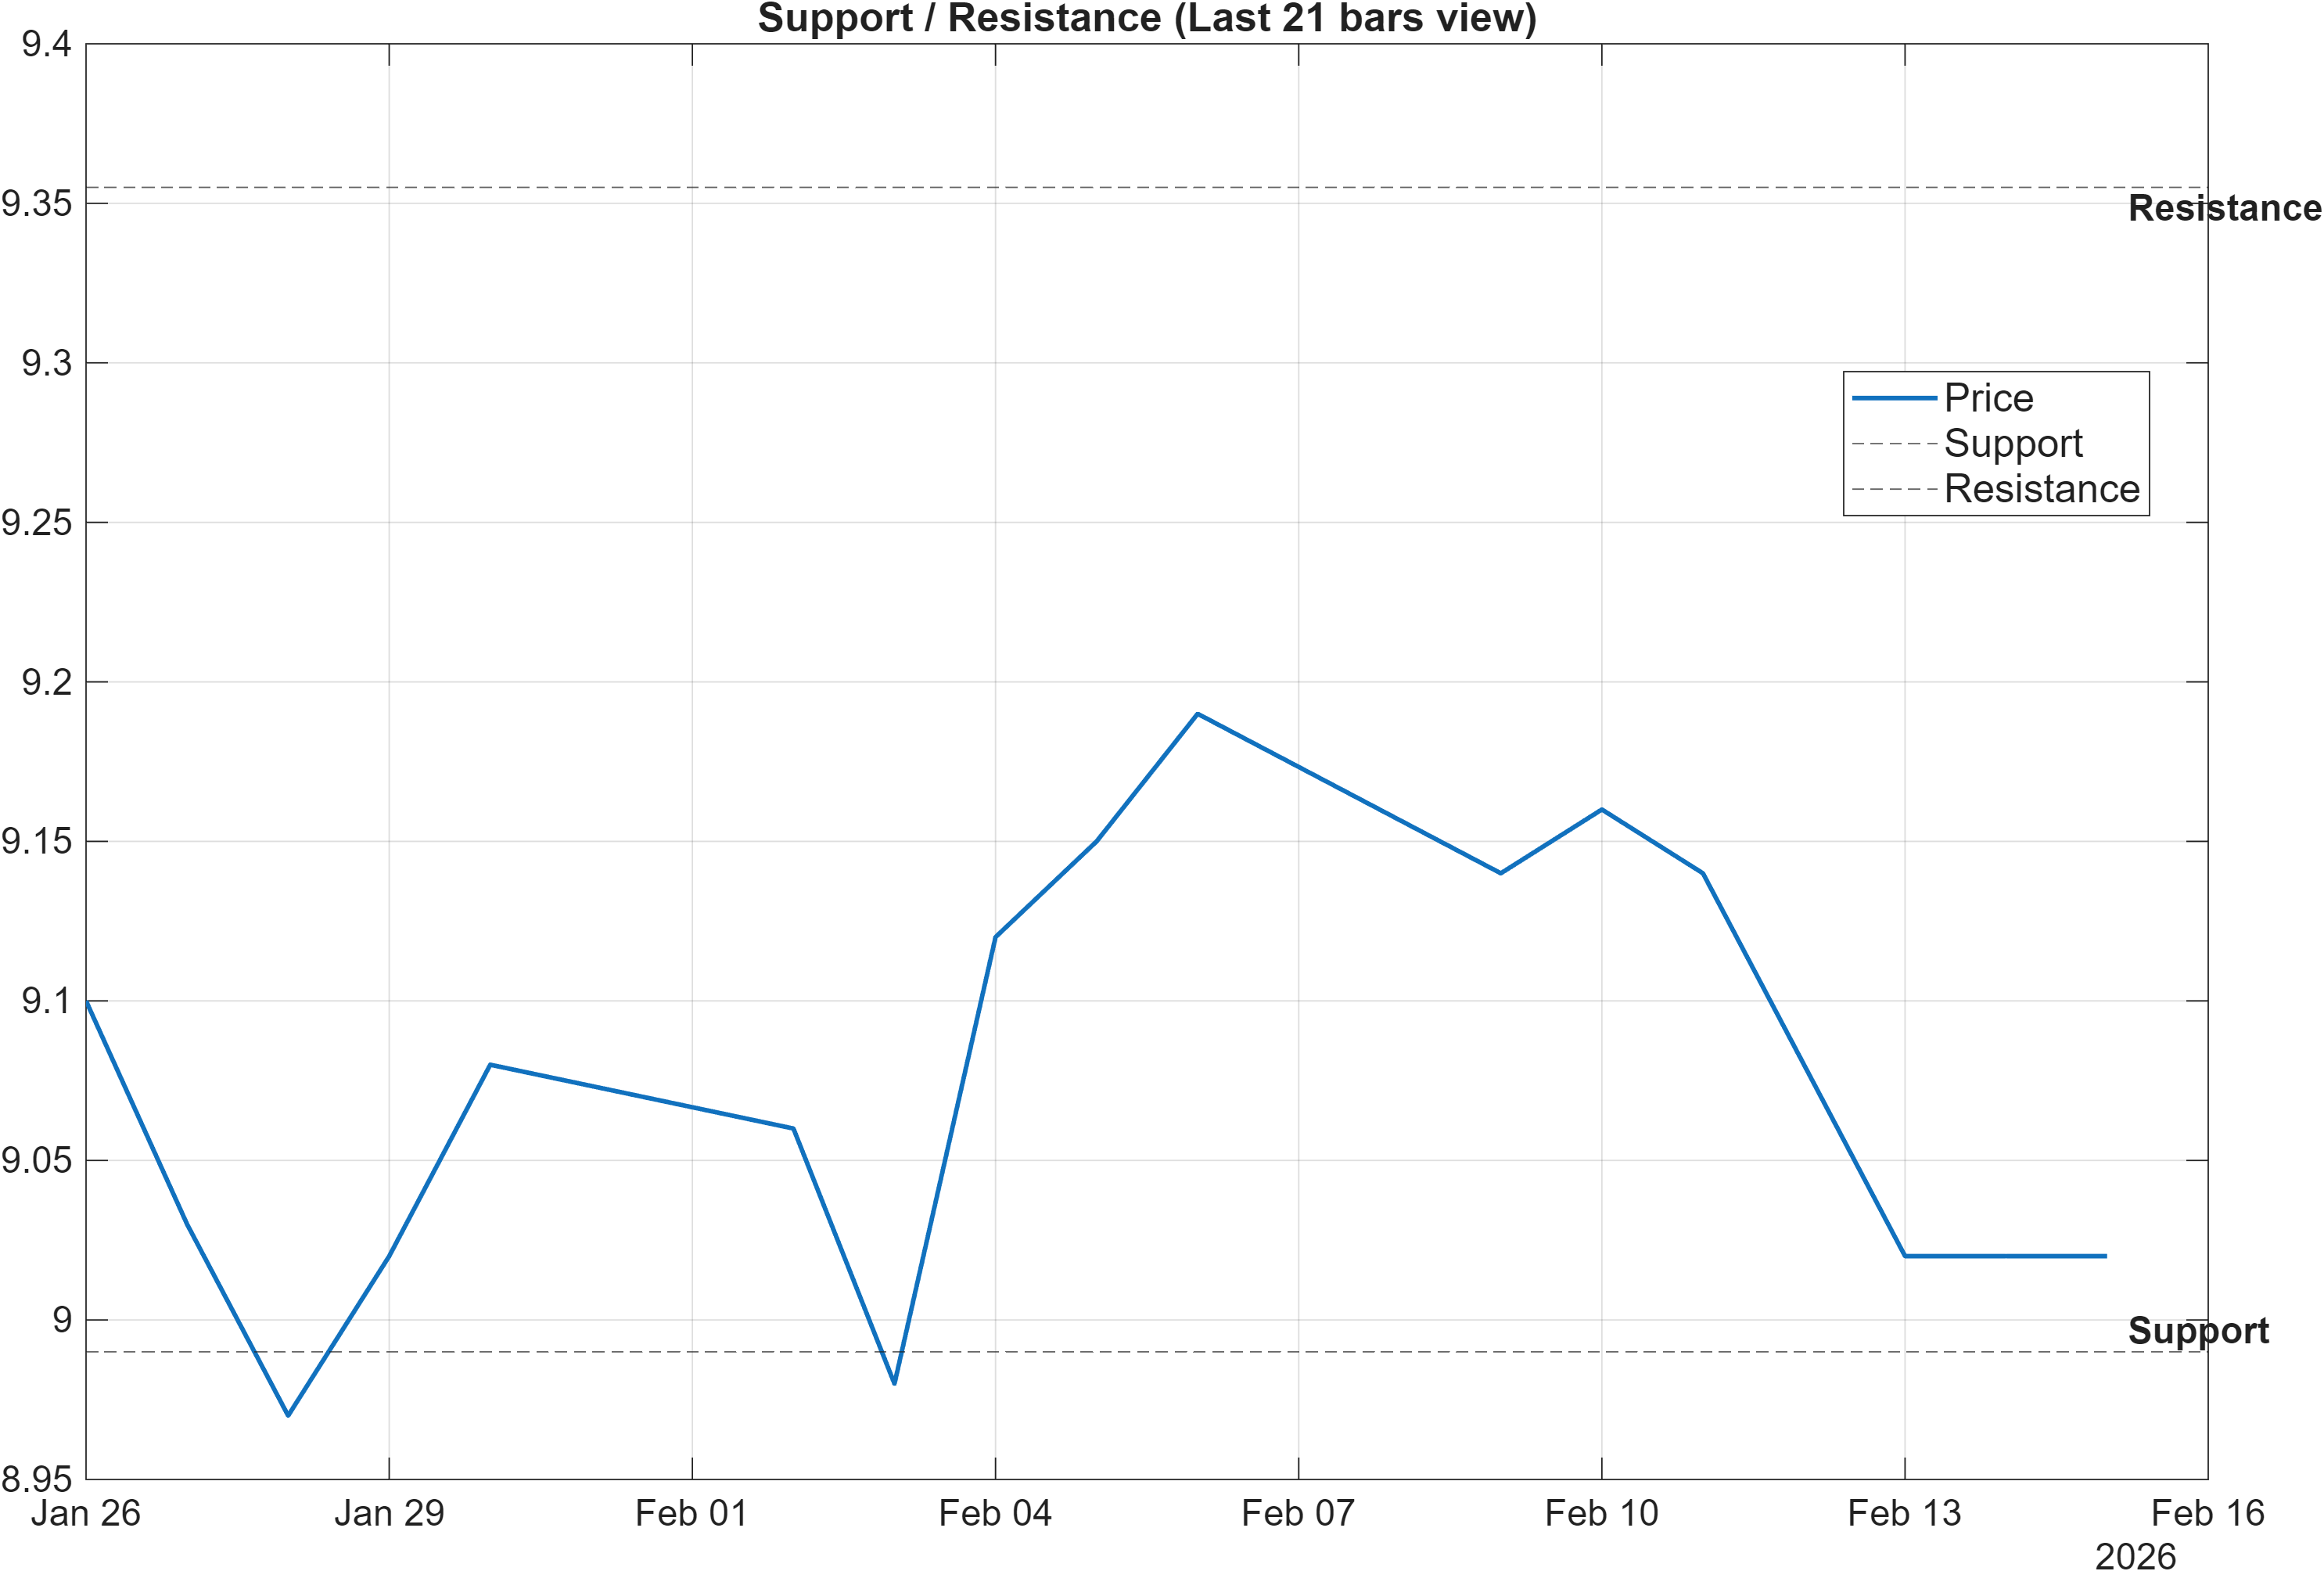
Scenario view: Break above resistance with volume → continuation. Close below support → signal deterioration risk.
The current structure compresses into a narrow decision corridor defined by 8.9900 (support) and 9.3550 (resistance). With bandwidth at 0.0297, the market is not pricing a high-volatility environment, which tends to increase the relevance of clean breaks—particularly when they occur with confirming volume.
From a level-based framework, the upside case is not about forecasting magnitude; it’s about reducing ambiguity. A sustained move above 9.3550 would align better with the longer-horizon rank strength (for example, 3-Monthly #10 and 6-Monthly #1) by improving the probability that near-term structure is re-synchronizing with the model’s broader positioning. Conversely, a close below 8.9900 would increase the odds that the bearish MA relationships and negative MACD histogram (-0.007826) remain the dominant short-term regime.
The signal table also supports treating these levels as gating conditions. “MedPx vs Support” is 0.055 and bullish, implying price is not far from a structural reference; however, multiple volume/accumulation slopes remain bearish (e.g., OBV slope(10) -6.012e+07 and Vol ROC(20) -31.33). When participation is soft, levels tend to be tested more than once. In practice, this favors waiting for either an upside reclaim with visible confirmation or a downside break that clarifies risk.
5) Quant Technical Dashboard (18 Signals)
KGNAI AI Technical Analysis Score (Deep Reinforcement Learning): Rank #873 out of 1294 (Rank 1 represents the strongest technical positioning and a higher probability of favorable price behavior. As ranks increase toward the maximum, the probability of favorable outcomes weakens and bearish positioning becomes more dominant.) | Label: Neutral | Score: -0.349
18-Signal Technical Confluence Score: -0.278 (Neutral)
Overall Technical Score (18-signal confluence + DRL rank blend): -0.299 (Neutral)
Note: The blended score reflects signal strength weighted against broader AI technical ranking, which may temporarily diverge.
Blended technical score breakdown: -0.299 (Neutral | Bull 4 / Bear 9 / Neutral 5)
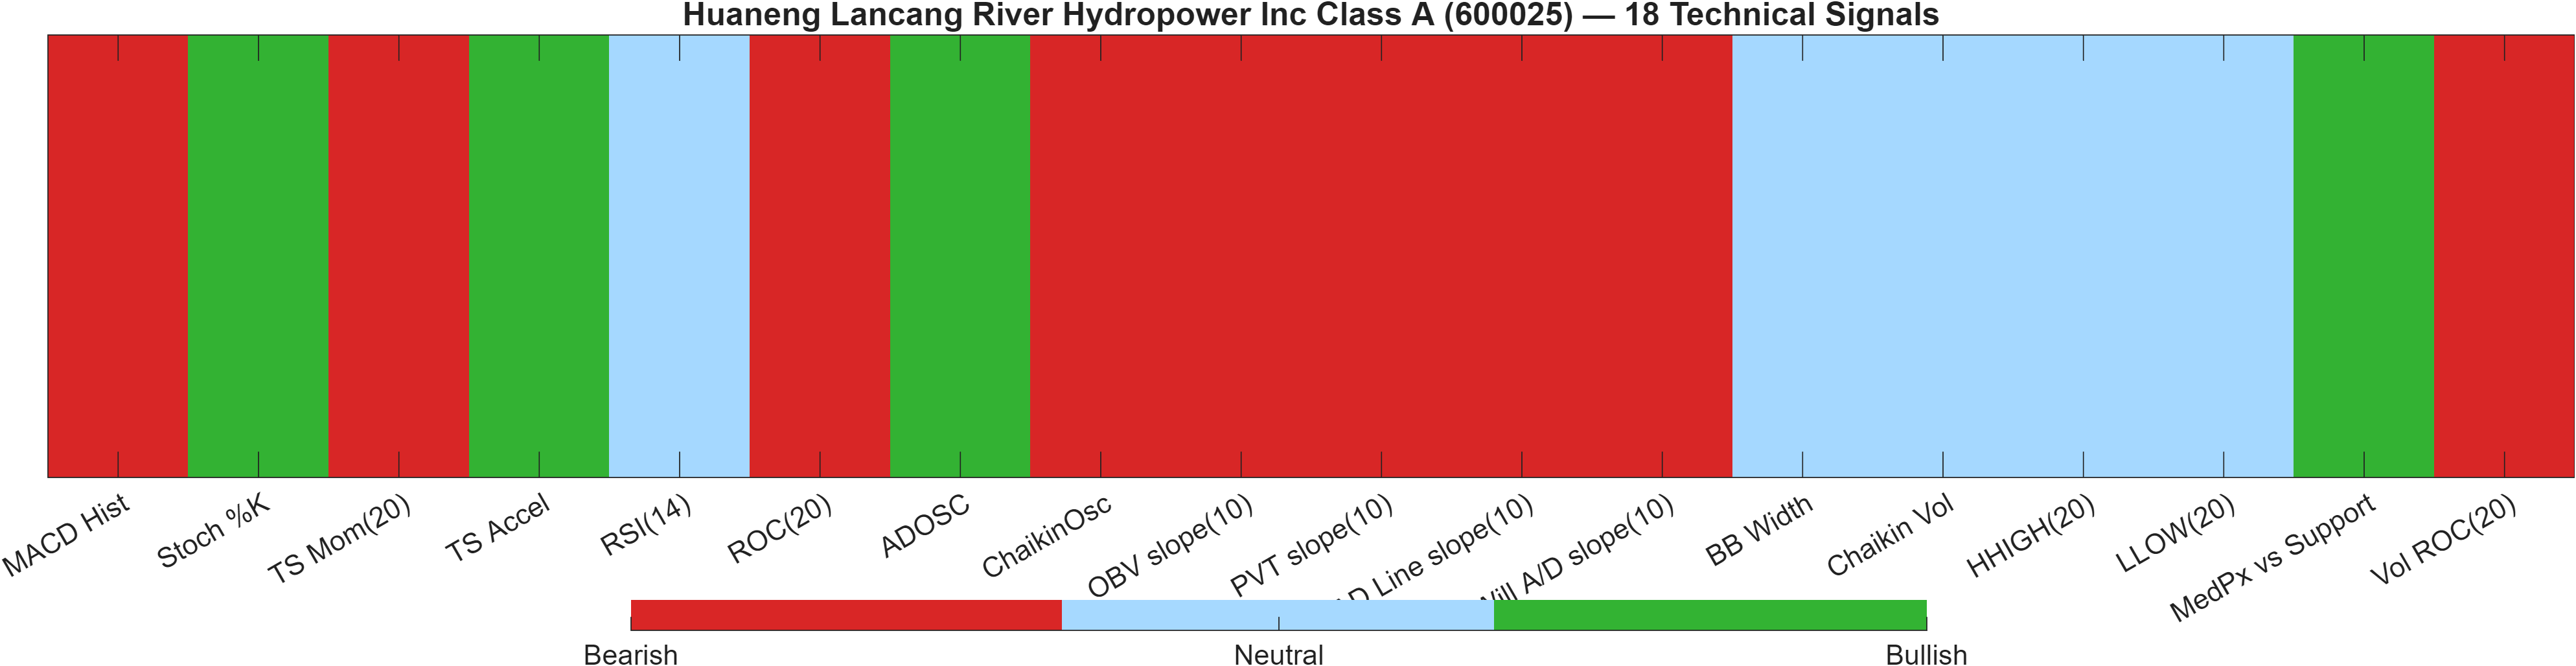
Signal-level alignment vs divergence
| Indicator | Value | Signal |
|---|---|---|
| MACD Hist | -0.007826 | Bearish |
| Stoch %K | 9.524 | Bullish |
| TS Mom(20) | -0.01 | Bearish |
| TS Accel | 0.08 | Bullish |
| RSI(14) | 45.39 | Neutral |
| ROC(20) | -0.1107 | Bearish |
| ADOSC | 16.67 | Bullish |
| ChaikinOsc | -1.07e+07 | Bearish |
| OBV slope(10) | -6.012e+07 | Bearish |
| PVT slope(10) | -2.004e+05 | Bearish |
| AD Line slope(10) | -2.081e+07 | Bearish |
| Will A/D slope(10) | -0.22 | Bearish |
| BB Width | 0.02968 | Neutral |
| Chaikin Vol | -20.78 | Neutral |
| HHIGH(20) | 9.21 | Neutral |
| LLOW(20) | 8.86 | Neutral |
| MedPx vs Support | 0.055 | Bullish |
| Vol ROC(20) | -31.33 | Bearish |
Interpretation: Indicator-level signals form the base confluence, which is then adjusted using a separate AI-driven technical ranking model. The final technical score summarizes this combined view.
The technical dashboard is firmly in neutral territory, but for a specific reason: the signal set is not evenly split. The blended breakdown shows Bull 4 / Bear 9 / Neutral 5, which normally would skew bearish—yet the composite remains neutral due to weighting and the interaction with the AI technical rank.
The DRL technical rank is #873 out of 1294 with a score of -0.349, while the 18-signal confluence is -0.278 and the overall blend is -0.299. This configuration often appears when several classic “participation” measures are soft (e.g., AD Line slope(10) -2.081e+07, PVT slope(10) -2.004e+05, and Vol ROC(20) -31.33), even as a few short-cycle components show early stabilization.
On the constructive side, TS Accel 0.08, ADOSC 16.67, and Stoch %K 9.524 contribute bullish elements that can accompany basing behavior—especially near support. Still, the persistence of bearish momentum/trend measures such as MACD Hist -0.007826 and ROC(20) -0.1107 keeps the setup from graduating into a higher-conviction state. The most actionable read is that the market is in signal reconciliation: a move beyond 9.3550 would help resolve that conflict; a break under 8.9900 would likely pull the blend further negative.
6) News sentiment + extractive gist
Note: Instrument-specific news matches were not found, so the digest includes broader market/sector headlines. Links are provided for verification.
Sentiment score (avg): 0.013 | Positive: 6% | Neutral: 94% | Negative: 0%
KGNAI AI News Sentiment Score (normalized -1 to +1): Not available (as of —) | Label: Not available | Overall news score: 0.01
Positive Developments
Recent coverage across major financial outlets is largely non-directional for this instrument, but the aggregate tone in the provided digest is mildly constructive on balance, reflected in an average sentiment of 0.013 with 6% positive items. The positive tilt appears to be driven more by general contextual “risk is contained” framing rather than company-specific catalysts (which are not available in the provided data). For a technical setup that is currently neutral (Overall Technical Score -0.299), a low-intensity positive media backdrop can matter mainly by reducing headline-driven volatility, which is consistent with the compressed regime signaled by bandwidth near 0.0297. The key point is not optimism; it is the absence of strong negative narrative pressure that might otherwise accelerate a break below 8.9900. As a result, sentiment functions as a weakly supportive context while price remains bounded between 8.9900 and 9.3550.
Neutral / Mixed Developments
The dominant classification is Neutral (94%), which aligns with the report’s broader “resolution pending” profile: RSI is 45.39 (neutral), and the 18-signal confluence score is -0.278 (neutral). With instrument-specific matches not found, the newsflow operates more like background noise than a direct driver. In such environments, price behavior tends to be guided by market microstructure and technical decision zones—especially when volatility is muted (0.0297). Mixed news does not necessarily imply indecision in the tape; it often means that levels and liquidity determine whether the next move becomes a breakout above 9.3550 or a breakdown below 8.9900. Until a level is resolved, the informational value of the news digest remains limited.
Negative / Risk Signals
The provided digest reports 0% negative items, and the overall news score is 0.01. That does not remove risk; it simply suggests that downside pressure, if it emerges, is more likely to be technically driven than headline-driven based on the data provided. Technically, several participation and money-flow components still point to fragility (e.g., OBV slope(10) -6.012e+07 and Vol ROC(20) -31.33), and MACD remains slightly negative (-0.007826). In other words, even with a neutral-to-benign news backdrop, a failure to hold 8.9900 could shift the technical blend further negative. Conversely, the absence of negative sentiment can reduce the probability of abrupt gap-style moves, keeping the focus on confirmation through volume and clean closes around key levels.
- Whether price can reclaim 9.3550 with confirming volume while MACD improves from -0.007826.
- Any loss of 8.9900 alongside continued weakness in volume signals (e.g., Vol ROC(20) -31.33).
- Whether volatility expands from the current compressed state (Bandwidth 0.0297) during a level break.
Sources referenced: Reuters, Bloomberg, Yahoo Finance, MarketWatch, Investing.com
Snapshot: AI Rank (Short–Mid–Long): Mixed (Bullish tilt) (Neutral–Bullish–Bullish) · Technical Confluence: Neutral · Key Levels: Support ~8.99 | Resistance ~9.36 · News Sentiment: Neutral
7) Sources
- Not available in the provided data.
You may also like: How KGNAI AI ranks instruments across global markets
Disclaimer: KGNAI provides AI-generated analytics and educational market commentary only. This is not financial advice. Markets involve risk. Always do your own research.