
INJ-USD (Injective) Technical & Rank Report — 13-Feb-2026, Bias Skews Negative
Injective (INJ-USD) is showing a mixed rank profile against a large crypto universe, while its technical confluence remains bearish on the current snapshot date (13-Feb-2026). The daily rank is strong at #28 out of 800, but the weekly rank softens to #266, suggesting near-term relative strength that is not yet confirmed on the intermediate horizon. On the technical layer, the 18-signal confluence prints -0.389 (Bearish) and the blended overall technical score is -0.433 (Bearish), consistent with downside-leaning momentum readings such as RSI(14) at 24.46 and MACD histogram at -0.0162. Key decision levels remain Support ~ 3.0296 and Resistance ~ 5.4919, with news sentiment registered as 0.00 (Neutral) in the provided data.
- Rank stance (Short / Mid / Long): Neutral / Neutral / Neutral (daily rank #28 vs weekly rank #266 indicates uneven confirmation).
- Technical confluence: Bearish (18-signal -0.389; overall technical -0.433).
- Key levels: Support ~ 3.0296 | Resistance ~ 5.4919.
- News sentiment bias: Neutral (avg 0.000; 100% neutral).
- Confirmation / invalidation: Break above 5.4919 with volume supports continuation; a close below 3.0296 increases deterioration risk.
What KGNAI Measures
KGNAI ranks instruments by relative positioning across large universes and evaluates whether multiple tests point in the same direction. The goal is to identify environments where signals align (higher follow-through tendency) versus diverge (higher path uncertainty). Outputs should be read as probabilistic behavior tendencies within the ranked universe, not as point forecasts.
How to Read This Report
- Ranks are comparative across a stated universe size, not absolute measures.
- Confluence summarizes agreement across multiple signals (e.g., RSI, MACD, Bollinger Bands).
- Support / resistance are practical decision zones, not precise turning points.
- Sentiment provides context and may lag or conflict with price/technical conditions.
1) KGNAI AI Analysis
Region: CRYPTO
Total universe size: 800 ranked instruments
- Daily rank: #28 out of 800 — Bullish
- Weekly rank: #266 out of 800 — Neutral
- Monthly rank: #69 out of 800 — Bullish
- 3-Monthly rank: #210 out of 800 — Neutral
The rank stack for INJ-USD is notable for its timeframe dispersion. A daily rank of #28 places it near the top of the universe on the shortest lens, while the weekly rank at #266 sits closer to the mid-pack, arguing that the strongest relative behavior has not been consistently expressed across intermediate windows. The monthly rank at #69 improves the picture again, but the 3-month rank at #210 returns to a neutral zone—an alignment pattern often associated with rotation risk rather than clean trend persistence.
KGNAI’s interpretation emphasizes whether a strong short-term rank is being “confirmed” by slower ranks. Here, confirmation is partial at best: daily and monthly show bullish placement, while weekly and 3-month remain neutral. That divergence is consistent with a market where short bursts of relative strength can occur inside a broader, less stable regime. For positioning discipline, the practical implication is to treat improvements in the daily rank as informative but conditional on price behavior at key levels and on whether intermediate ranks begin to migrate toward the upper quartile.
Term view: Short-term: Neutral. Mid-term: Neutral. Long-term: Neutral remains the platform stance in the provided data—consistent with mixed rank confirmation rather than a single-direction regime.
Want the full universe and complete rank tables? Unlock full access on KGNAI: https://www.kgnai.com/pricing
2) Price & trend overview
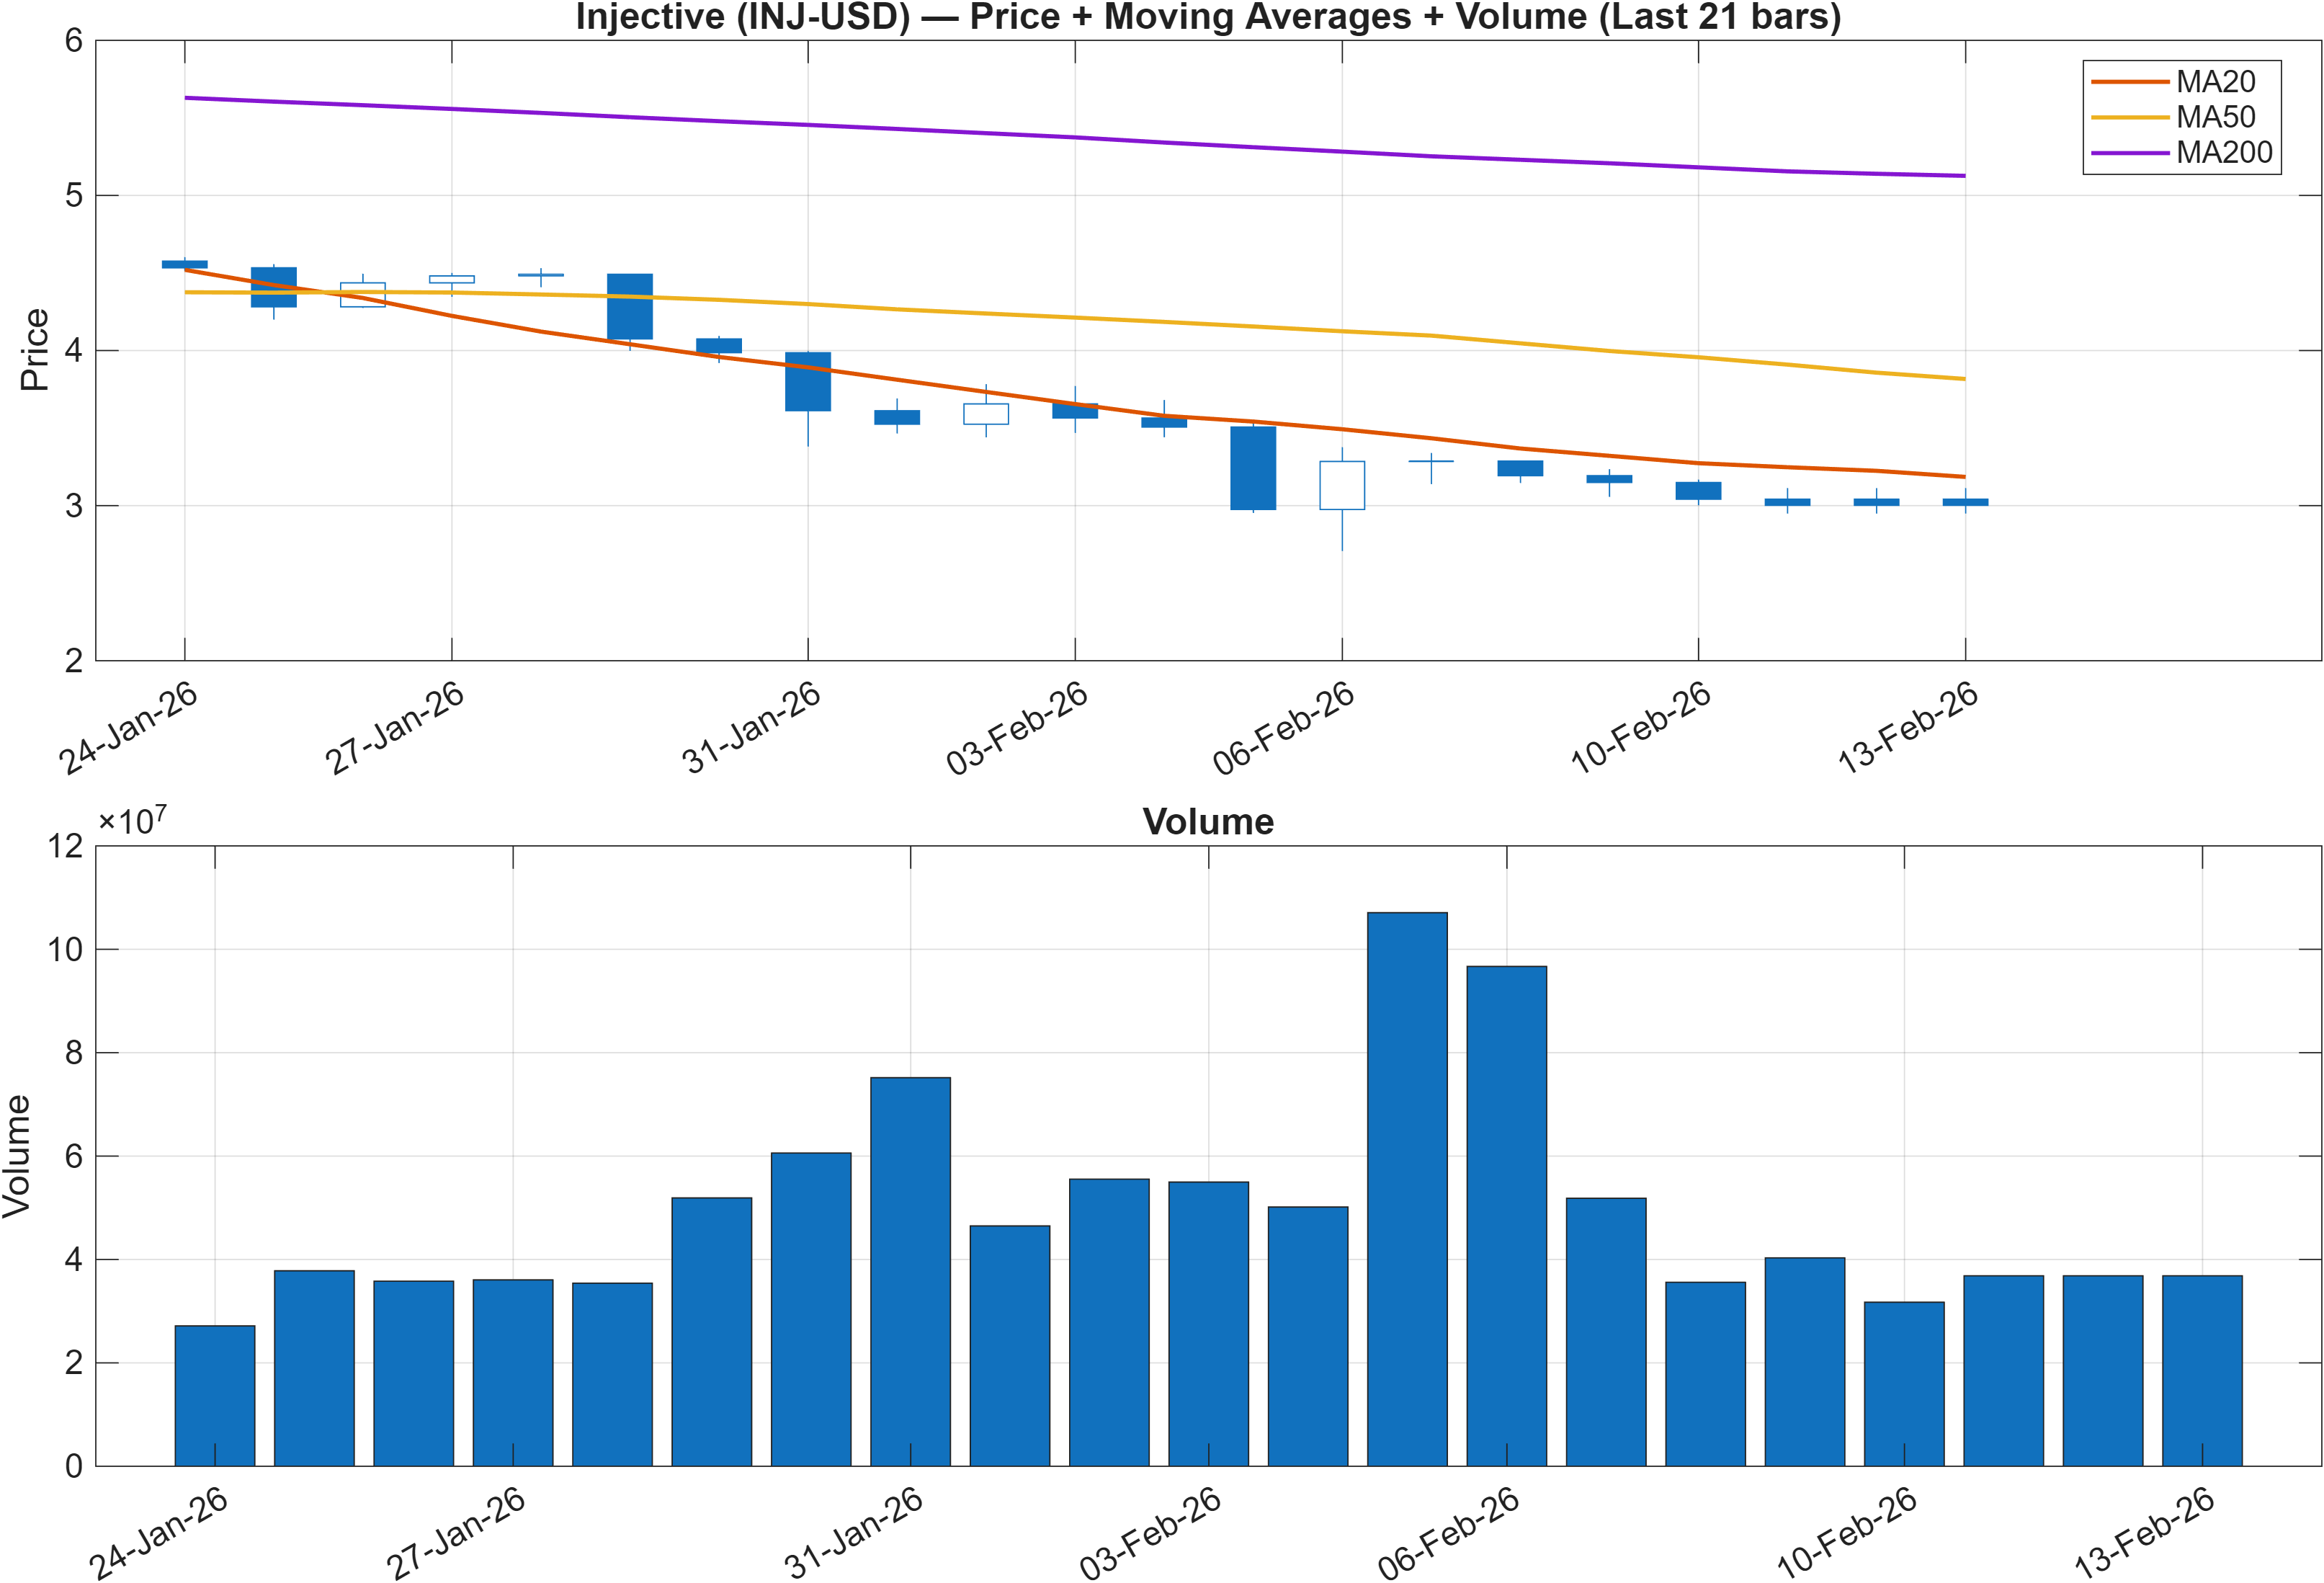
Interpretation: Close vs MA50 = Bearish, MA50 vs MA200 = Bearish.
The trend layer is unambiguous in the provided read: the close is below the MA50 and the MA50 is below the MA200, a classic configuration that typically signals downside control across both intermediate and longer moving-average horizons. This matters because it sets a higher bar for the strong daily rank (#28) to translate into durable price behavior; short-term relative strength can appear during countertrend moves, but trend filters often remain restrictive until the close recaptures the MA50 and the MA structure begins to flatten.
When moving averages are aligned bearishly, rallies can become mean-reversion tests rather than trend continuation signals. In that context, resistance at 5.4919 becomes more than a price level—it becomes a reference for whether the market can reclaim prior distribution zones with sufficient participation. Conversely, the support at 3.0296 remains the nearer-term “line in the sand” for avoiding further technical damage.
Volume is presented in Figure 1, but the report’s directional read still leans on confirmation logic: bearish MA structure plus bearish confluence (overall technical -0.433) implies trend conditions have not yet shifted. Until the moving-average signals improve, upside attempts are better evaluated by whether they produce sustained closes that reduce the distance to resistance rather than brief intraday spikes.
3) Momentum & volatility dashboard
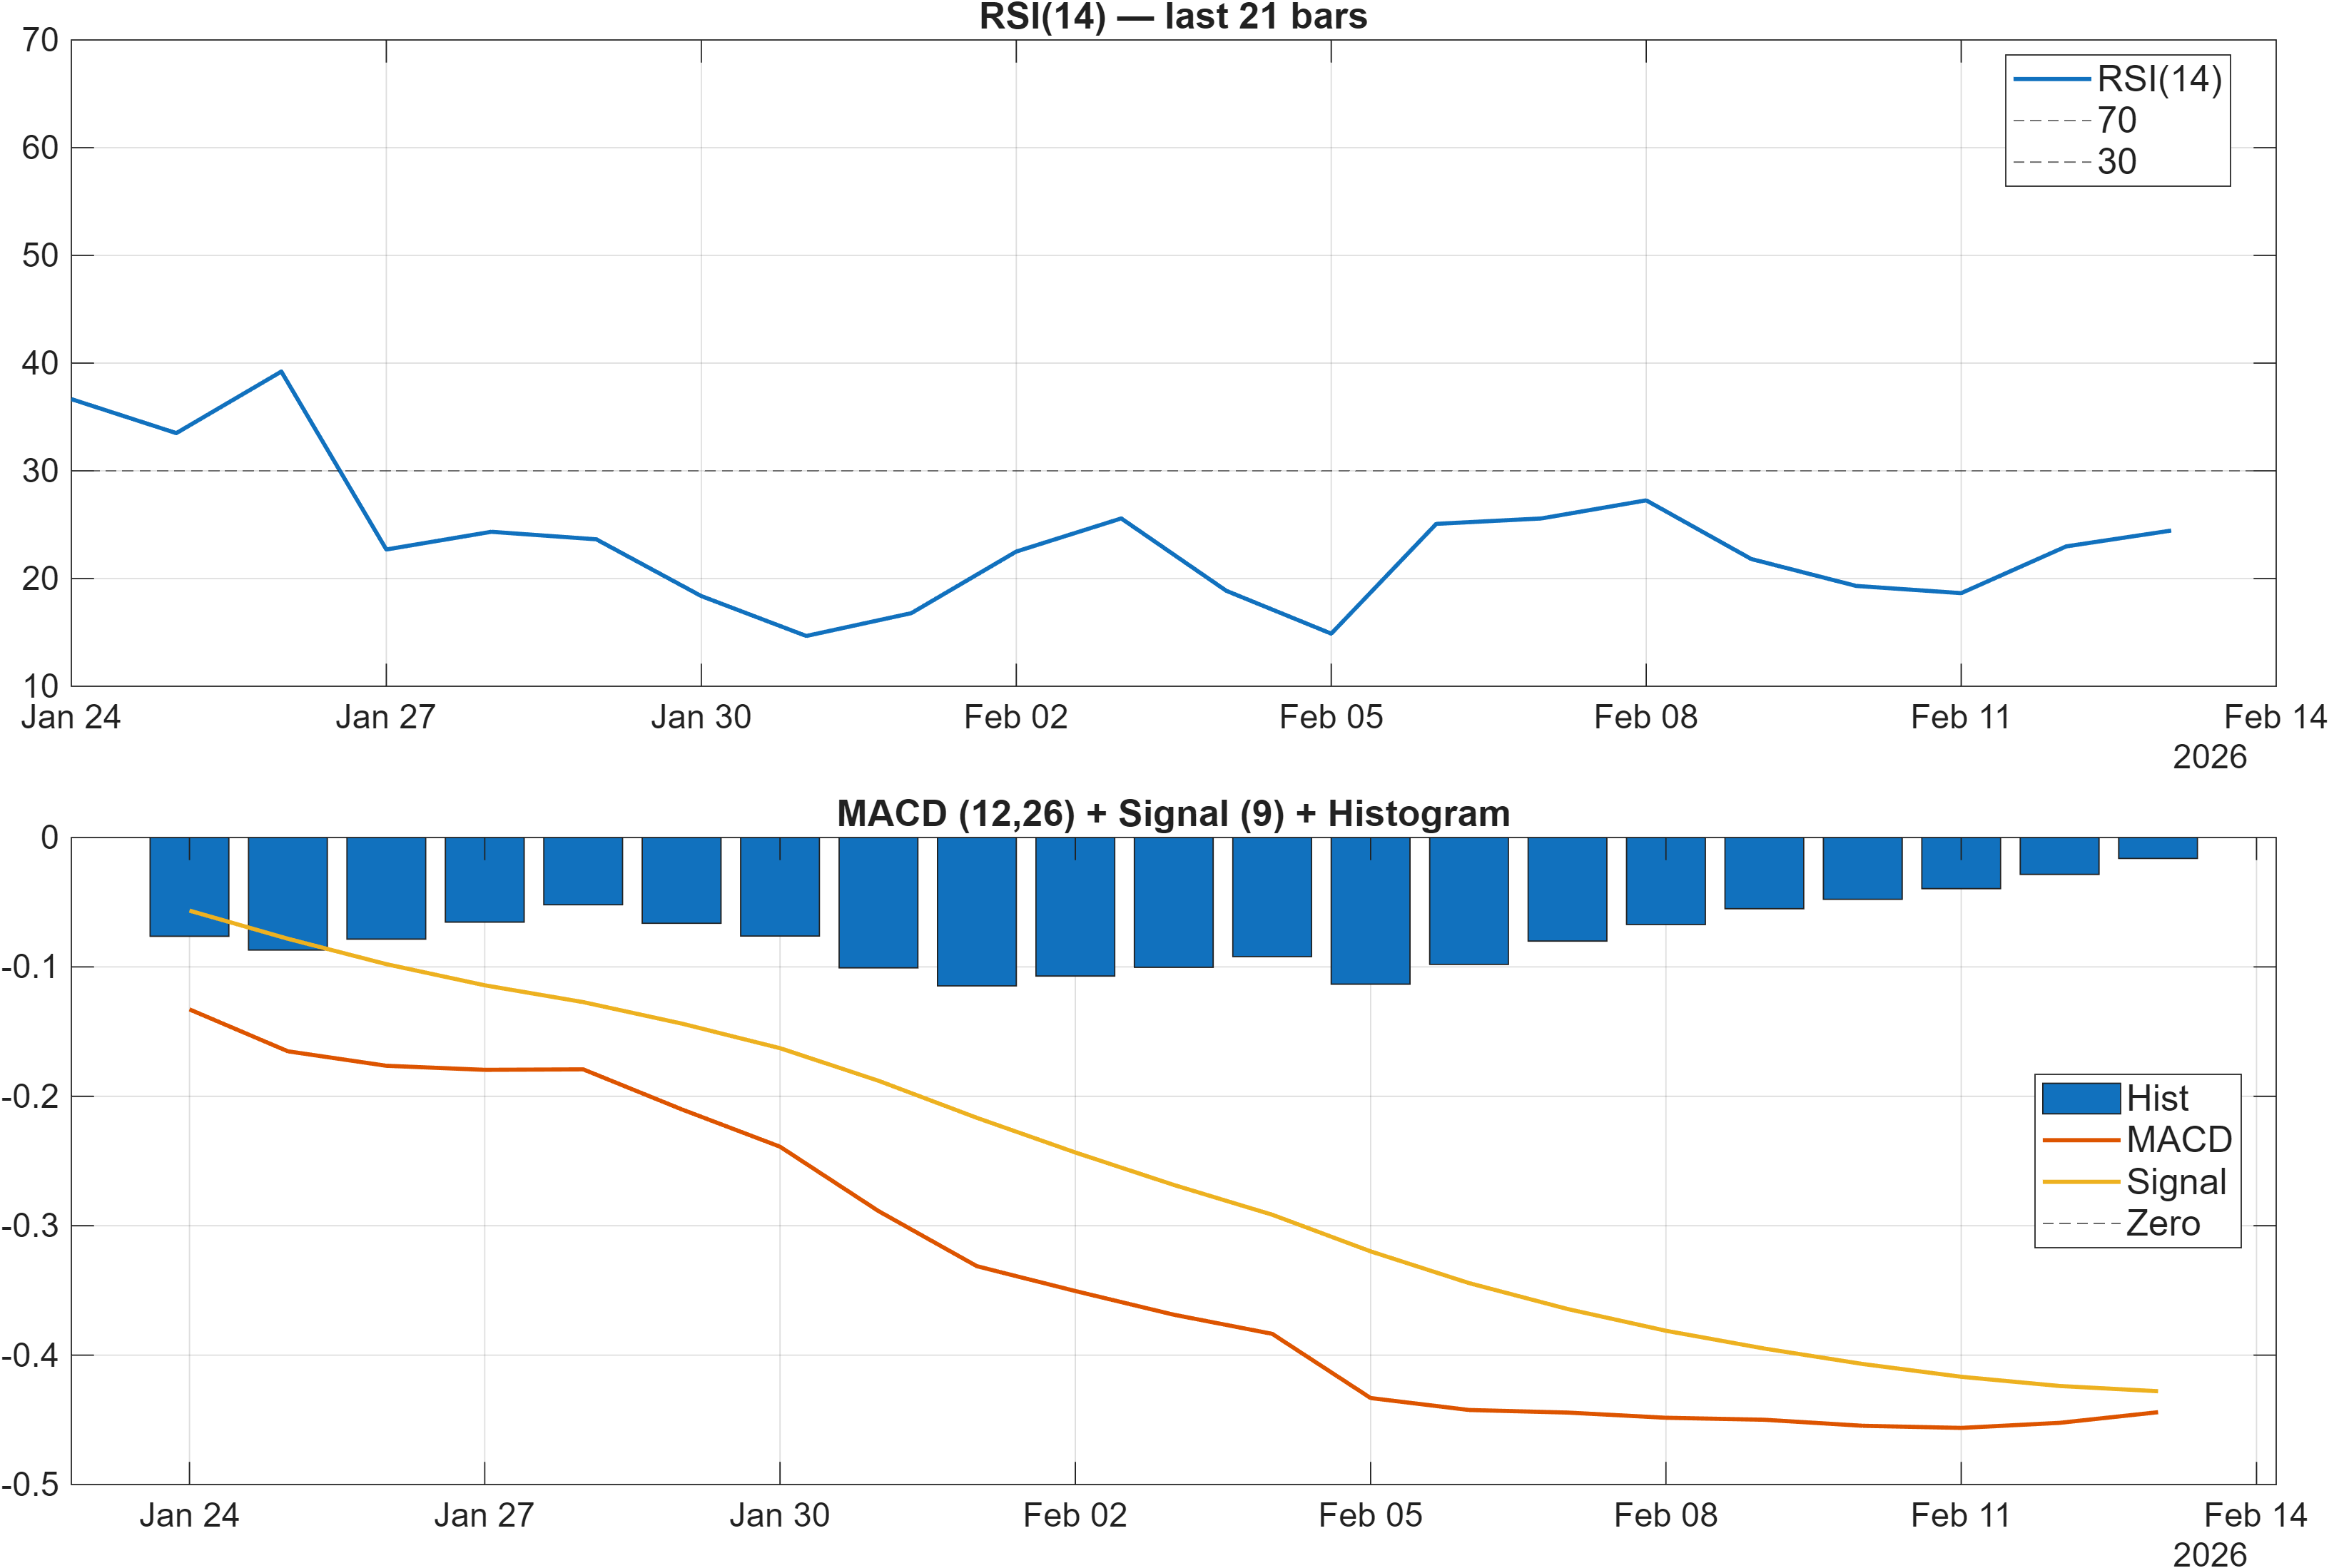
Interpretation: RSI bias = Bearish, MACD hist = -0.0162.
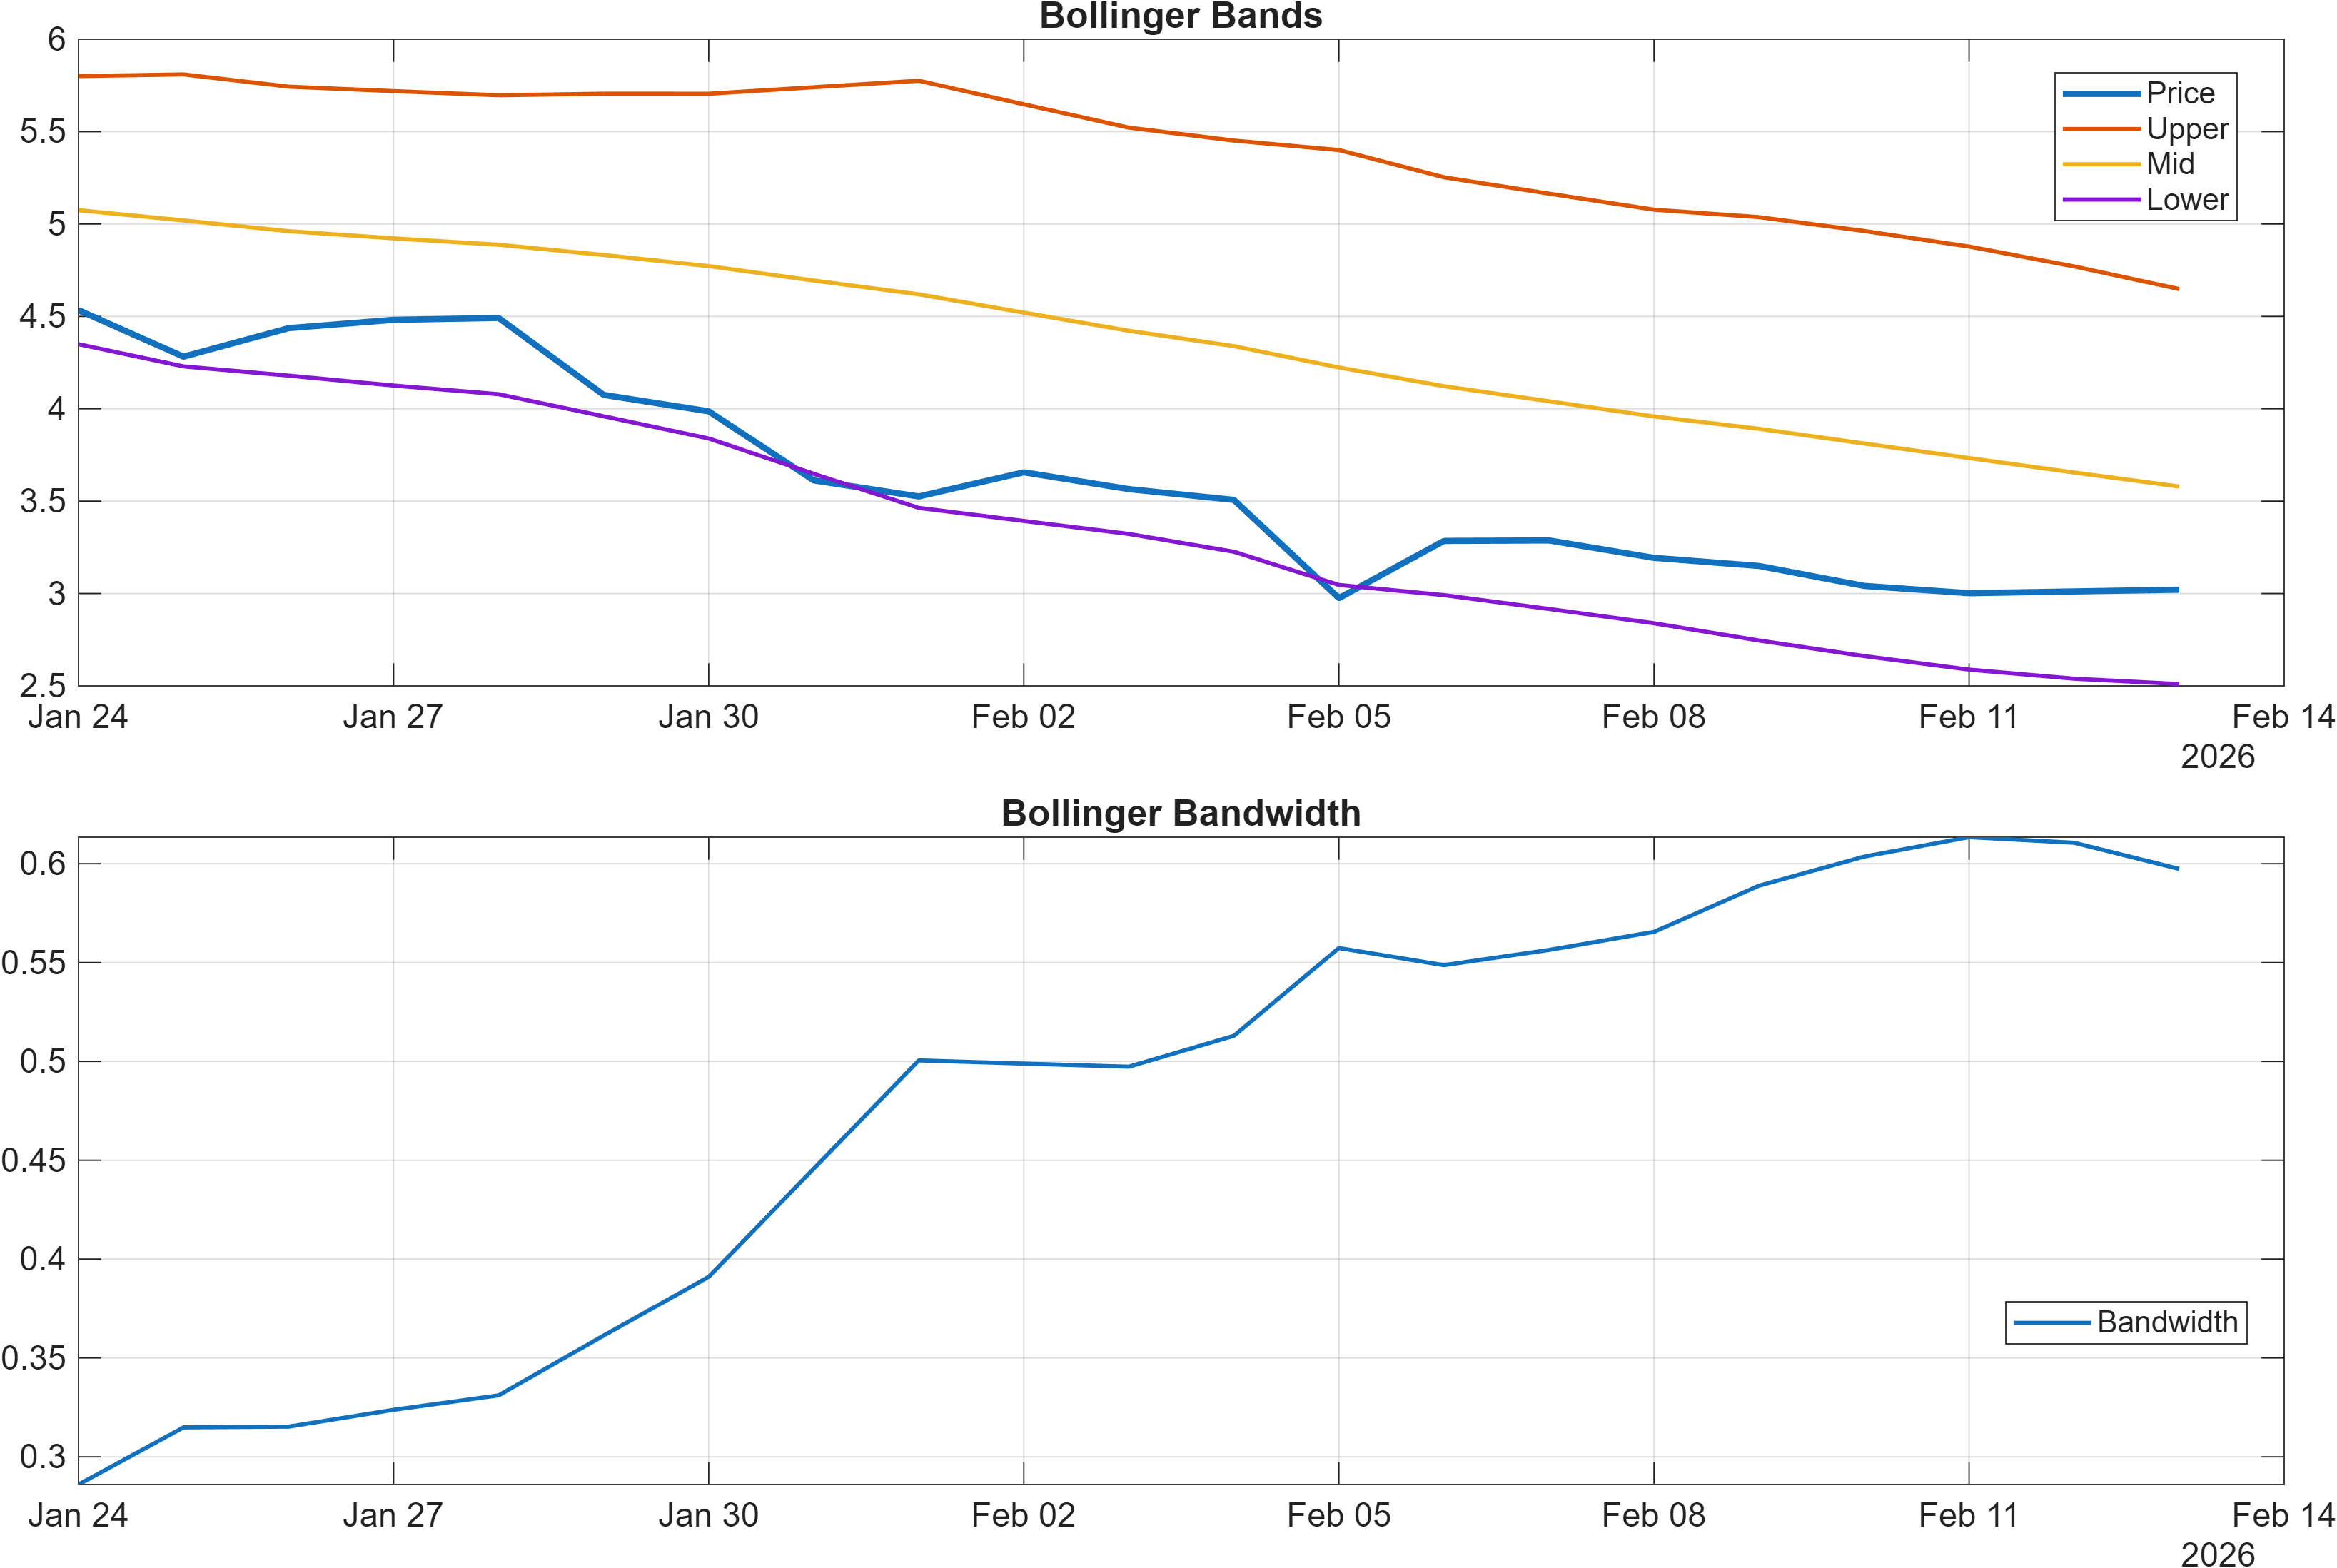
Interpretation: Bandwidth (volatility regime) latest = 0.5974.
Momentum readings reinforce the bearish technical bias. RSI(14) at 24.46 is consistent with an oversold-leaning condition, but in downtrends oversold can persist—so the key question is whether momentum stabilizes rather than whether it is merely low. The MACD histogram at -0.0162 keeps the short-to-intermediate momentum impulse on the negative side, aligning with the moving-average configuration that remains bearish.
Volatility context helps frame the quality of signals. Bollinger Bandwidth at 0.5974 indicates a defined volatility regime in the provided data; in practice, this often influences how quickly price can traverse between 3.0296 support and 5.4919 resistance. Higher bandwidth regimes can accelerate moves, which is beneficial for trend-following only if direction is confirmed; otherwise, they can amplify whipsaw risk around levels.
Importantly, momentum and volatility are not isolated here: the broader 18-signal confluence is -0.389 (Bearish), and the overall technical score is -0.433 (Bearish). That combination suggests that, even if a rebound emerges from oversold RSI, the higher-level confirmation threshold remains: improving MACD behavior and evidence that the market is reducing bearish pressure at key zones.
4) Support / Resistance zones
Support ~ 3.0296 | Resistance ~ 5.4919
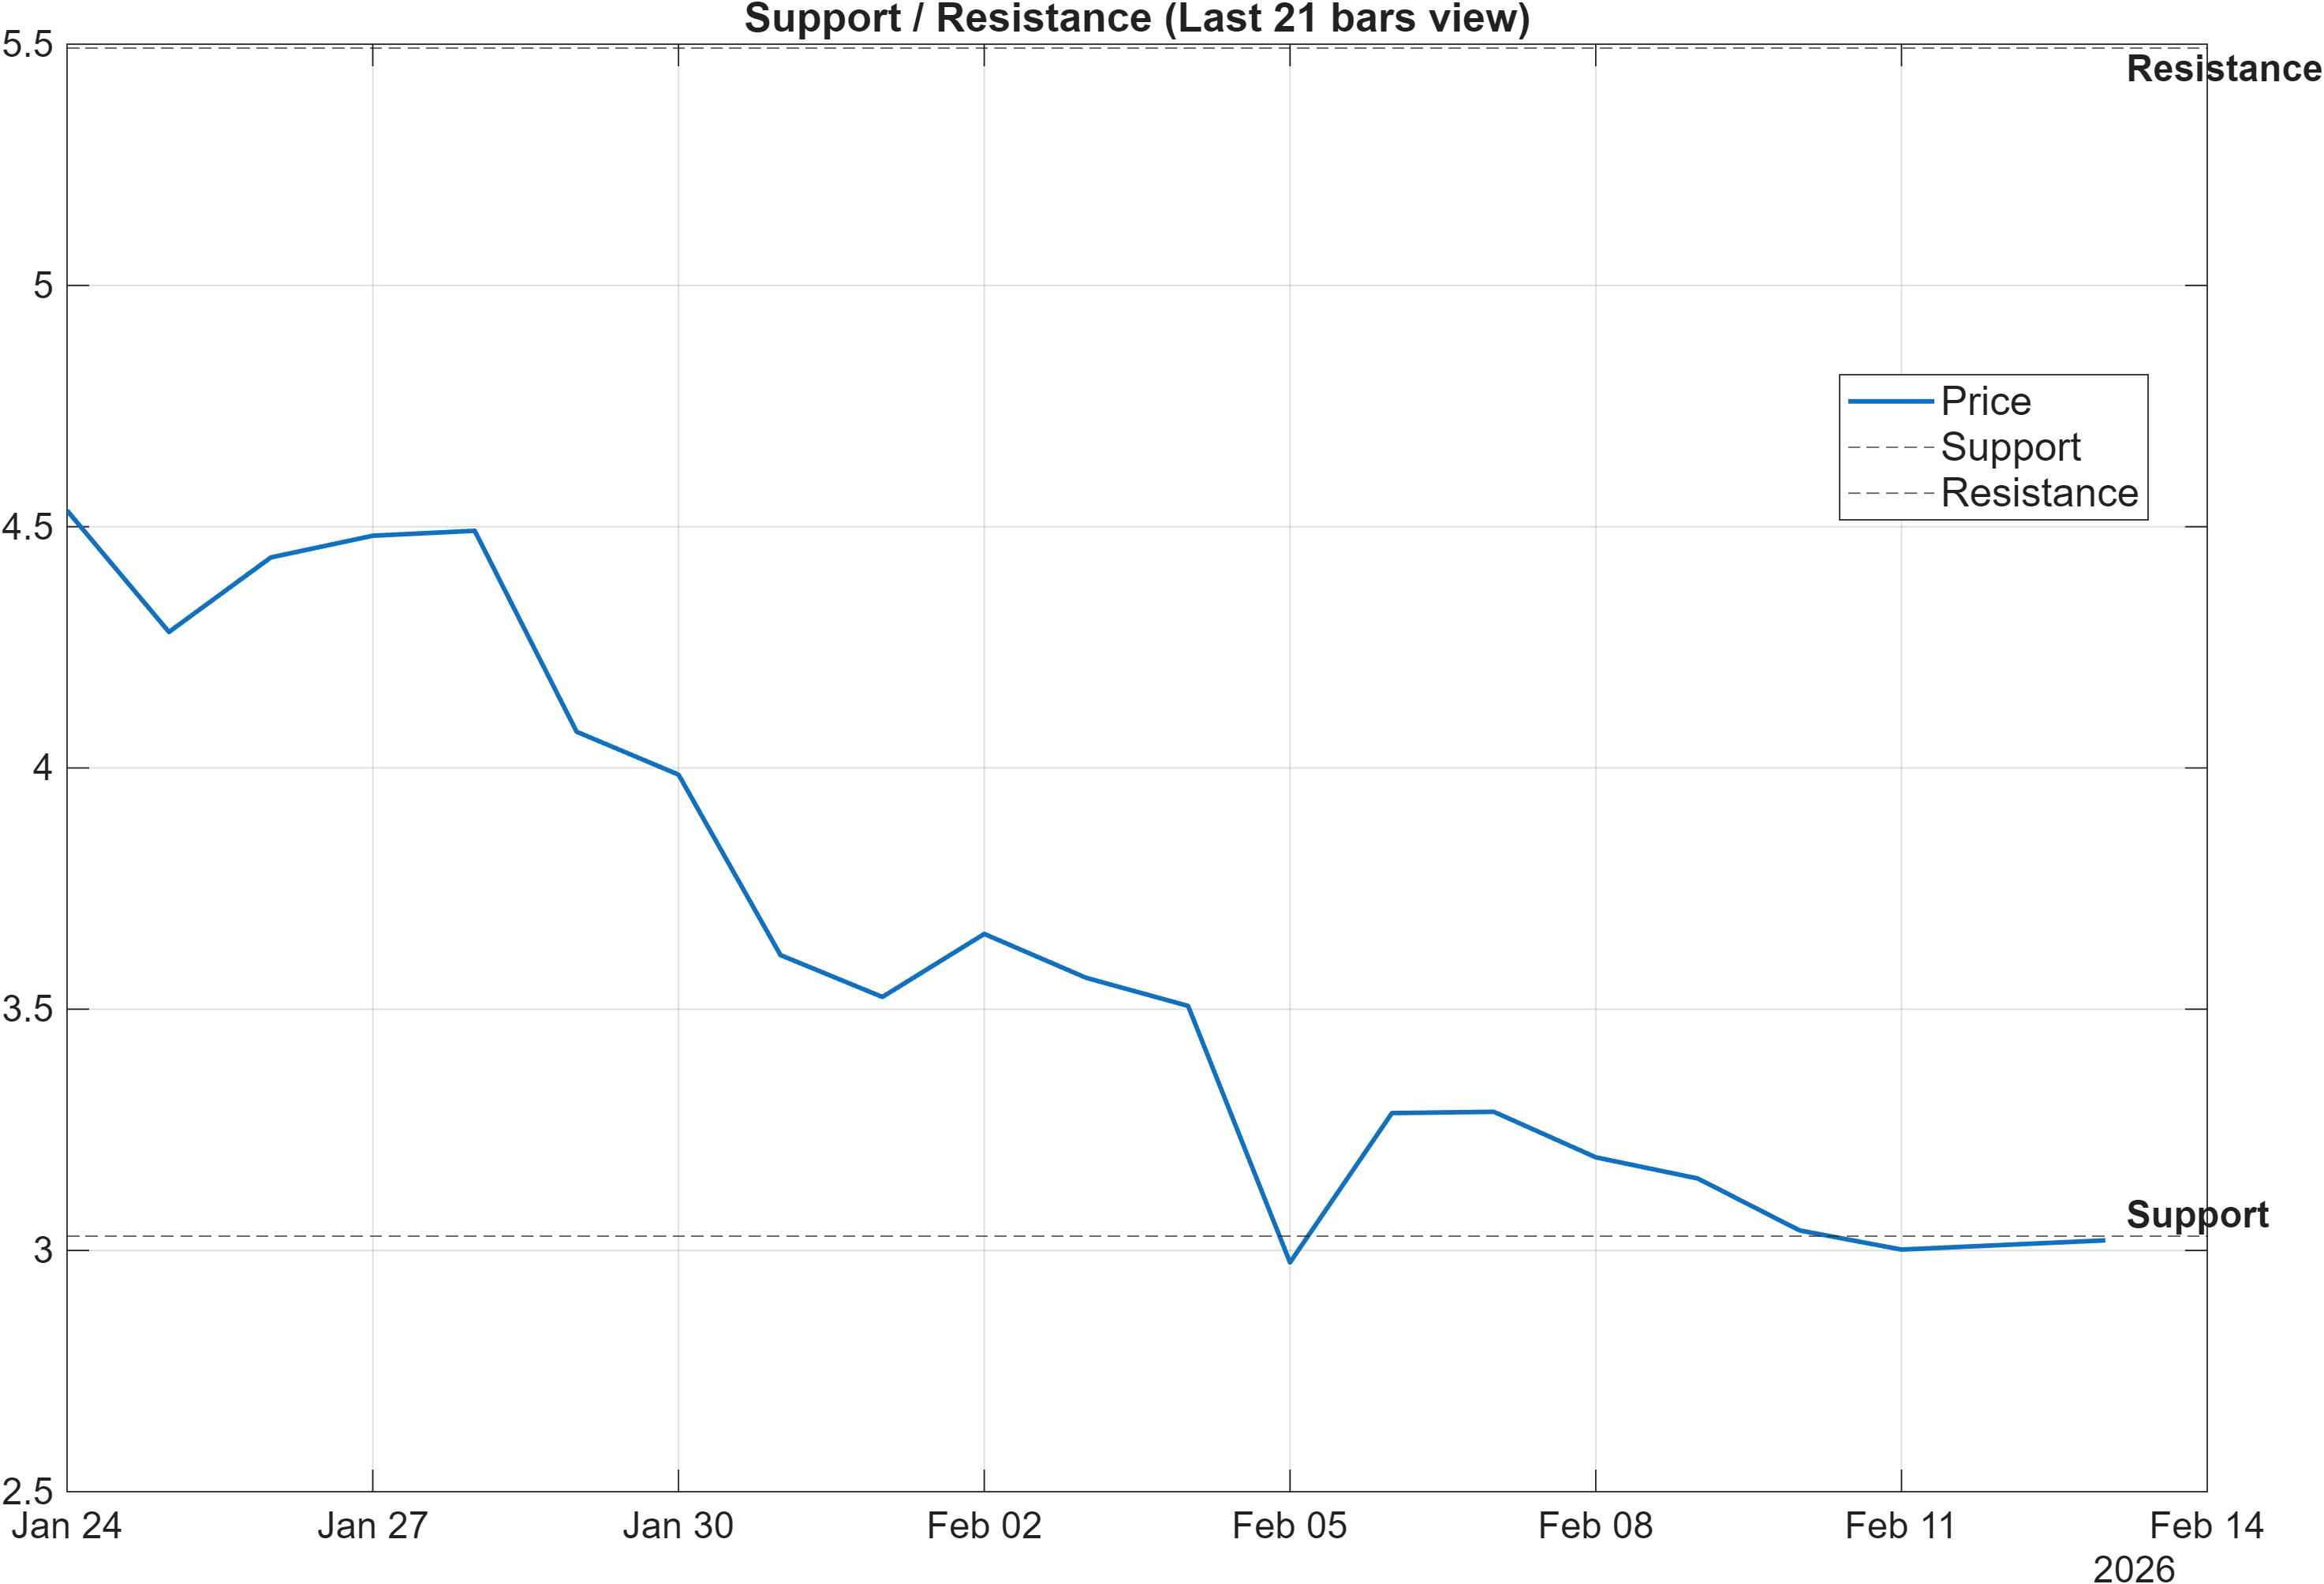
Scenario view: Break above resistance with volume → continuation. Close below support → signal deterioration risk.
The level map is tight and decision-oriented: 3.0296 defines the support zone, while 5.4919 defines the resistance zone. With trend signals bearish (close vs MA50 bearish; MA50 vs MA200 bearish) and confluence bearish (overall technical -0.433), these levels function less as “targets” and more as validation gates for whether selling pressure is easing or reasserting.
The report’s scenario language is explicit: a break above resistance with volume would support continuation. Given the current momentum setup—MACD histogram -0.0162 and RSI bias bearish (with RSI(14) 24.46 shown in the dashboard)—a breakout interpretation is typically stronger if it coincides with improving momentum measures rather than purely price-based thresholding.
On the downside, a close below 3.0296 is framed as deterioration risk. In a bearish MA structure, that outcome can matter disproportionately because it tends to reinforce the prevailing regime rather than merely extend noise. For risk control, these two zones can be treated as the nearest high-information boundaries, particularly while higher-level ranks remain mixed (daily #28 vs weekly #266).
5) Quant Technical Dashboard (18 Signals)
KGNAI AI Technical Analysis Score (Deep Reinforcement Learning): Rank #615 out of 800 (Rank 1 represents the strongest technical positioning and a higher probability of favorable price behavior. As ranks increase toward the maximum, the probability of favorable outcomes weakens and bearish positioning becomes more dominant.) | Label: Neutral | Score: -0.538
18-Signal Technical Confluence Score: -0.389 (Bearish)
Overall Technical Score (18-signal confluence + DRL rank blend): -0.433 (Bearish)
Note: The blended score reflects signal strength weighted against broader AI technical ranking, which may temporarily diverge.
Blended technical score breakdown: -0.433 (Bearish | Bull 3 / Bear 10 / Neutral 5)
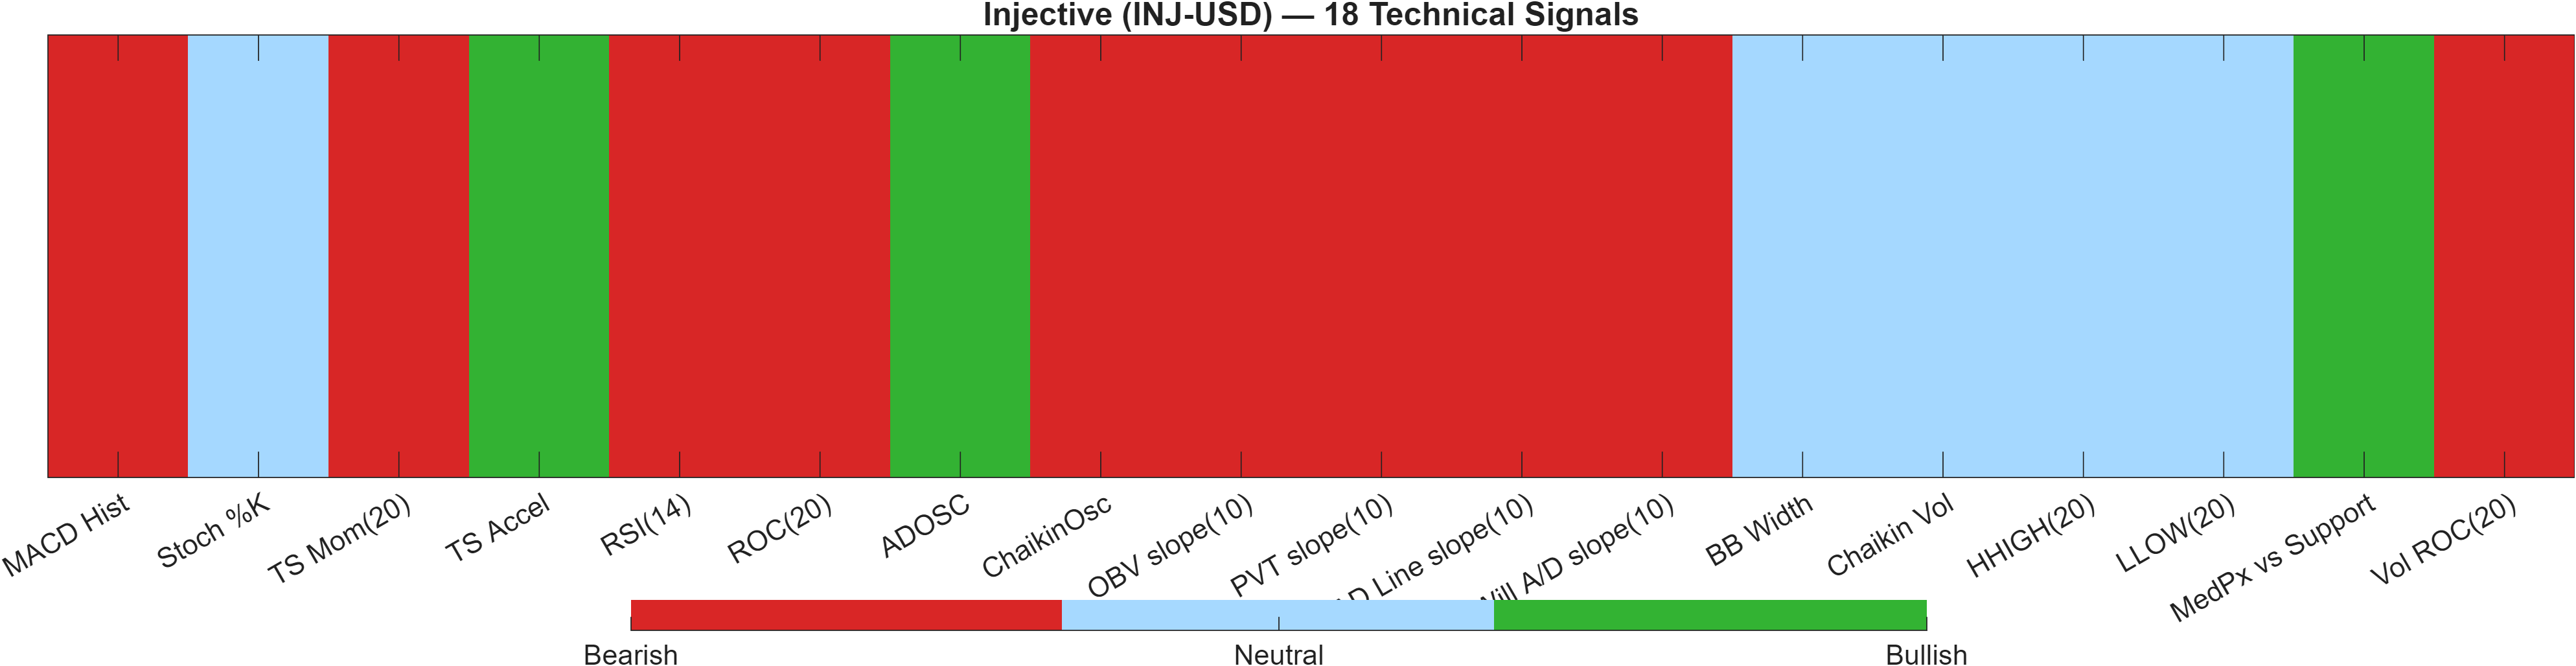
Signal table (Bull/Bear/Neutral)
| Indicator | Value | Signal |
|---|---|---|
| MACD Hist | -0.0162 | Bearish |
| Stoch %K | 30.22 | Neutral |
| TS Mom(20) | -1.28 | Bearish |
| TS Accel | 0.03536 | Bullish |
| RSI(14) | 24.46 | Bearish |
| ROC(20) | -29.45 | Bearish |
| ADOSC | 37.95 | Bullish |
| ChaikinOsc | -2.951e+07 | Bearish |
| OBV slope(10) | -1.532e+08 | Bearish |
| PVT slope(10) | -1.009e+07 | Bearish |
| AD Line slope(10) | -9.321e+07 | Bearish |
| Will A/D slope(10) | -0.4307 | Bearish |
| BB Width | 0.5974 | Neutral |
| Chaikin Vol | -23.82 | Neutral |
| HHIGH(20) | 4.557 | Neutral |
| LLOW(20) | 2.708 | Neutral |
| MedPx vs Support | 0.001496 | Bullish |
| Vol ROC(20) | -2.552 | Bearish |
Interpretation: Indicator-level signals form the base confluence, which is then adjusted using a separate AI-driven technical ranking model. The final technical score summarizes this combined view.
The technical dashboard highlights a breadth of bearish signals despite a “Neutral” label on the DRL rank line. The DRL technical rank is #615 out of 800 with a score of -0.538, while the 18-signal confluence is -0.389 (Bearish) and the blended overall technical is -0.433 (Bearish). This mix is exactly what the note flags: the blended score can diverge as the model weights confluence against broader technical ranking.
Within the indicator set, momentum pressure is visible via RSI(14) at 24.46, ROC(20) at -29.45, and TS Mom(20) at -1.28. Meanwhile, a smaller set of positives—such as TS Accel at 0.03536, ADOSC at 37.95, and MedPx vs Support at 0.001496—suggests that some stabilization forces exist, but they are not dominant in the aggregate (Bull 3 vs Bear 10).
From an alignment perspective, the central takeaway is that the market is not simply “oversold”; it is oversold while many participation/flow proxies remain bearish (e.g., OBV slope and AD line slope readings are flagged bearish in the table). That backdrop tends to make level-based confirmation (e.g., behavior around 3.0296 and 5.4919) more informative than single-indicator rebounds.
6) News sentiment + extractive gist
Note: Some headlines were matched using a looser (title-only) rule to avoid missing relevant coverage.
Sentiment score (avg): 0.000 | Positive: 0% | Neutral: 100% | Negative: 0%
KGNAI AI News Sentiment Score (normalized -1 to +1): 0.00 (as of 2025-03-20) | Label: Neutral | Overall news score: 0.00
Positive Developments
Recent coverage across major financial outlets, as represented in the provided feed, is broadly non-directional for INJ-USD, but the available item references a constructive tone around crypto market expectations and capital formation activity in the wider digital-asset landscape. Even when not directly tied to Injective, this type of backdrop can matter at the margin: it can improve risk appetite and stabilize flows when technicals are stretched (for example, with RSI(14) at 24.46). That said, the quantified sentiment in this report remains 0.000 average with 0% positive and an overall normalized score of 0.00, so the net takeaway is that any constructive narrative has not translated into measurable positive sentiment for the ticker in the provided dataset. In this context, price-level behavior around 3.0296 and 5.4919 is likely to remain the primary arbiter of confirmation.
Neutral / Mixed Developments
The sentiment panel is effectively flat: Neutral 100%, Negative 0%, and Positive 0%, with a normalized reading of 0.00 (as of 2025-03-20). This indicates the news input used here is not providing a directional edge, and it can also imply limited coverage specificity for INJ-USD in the captured items. When sentiment is neutral while technical confluence is bearish (overall technical -0.433), the setup often becomes a technically led tape where catalysts are absent or not being priced as narrative shifts. Practically, this increases the importance of confirmation mechanics: momentum stabilization (e.g., improvement from MACD histogram -0.0162) and reclaiming key zones rather than relying on headline-driven reversals.
Negative / Risk Signals
While the sentiment score does not register negativity (Negative 0%), risk is still present in the form of technical-vs-rank tension. The daily rank is strong at #28, but the technical structure remains bearish (18-signal confluence -0.389; DRL score -0.538; overall technical -0.433). This mismatch can create false starts: short-term relative strength appears, but the broader signal stack does not yet support sustained follow-through. In addition, the scenario framework flags a clear deterioration condition: a close below support ~3.0296. With volatility regime indicated by bandwidth at 0.5974, downside moves can accelerate if that level fails, even absent negative news flow. In short, the risk signal here is primarily market-structure driven rather than sentiment driven.
- Whether price holds 3.0296 on a closing basis or begins to break down through the zone.
- Any improvement in momentum confirmation (e.g., MACD histogram -0.0162 moving toward neutral) alongside trend repair versus MA50.
- Follow-through behavior if price approaches 5.4919, particularly on higher participation.
Snapshot: AI Rank (Short–Mid–Long): Neutral (Neutral–Neutral–Neutral) · Technical Confluence: Bearish · Key Levels: Support ~3.03 | Resistance ~5.49 · News Sentiment: Neutral
Sources referenced: Reuters, Bloomberg, Yahoo Finance, MarketWatch, Investing.com
7) Sources
Not available in the provided data.
You may also like: How KGNAI AI ranks instruments across global markets
Disclaimer: KGNAI provides AI-generated analytics and educational market commentary only. This is not financial advice. Markets involve risk. Always do your own research.