
Kaspa (KAS-USD) Technical & Rank Snapshot — 15-Feb-2026 (Nuanced Positive, With Defined Risk Controls)
Kaspa (KAS-USD) screens as a high-relative-strength candidate inside KGNAI’s CRYPTO universe, with rank strength concentrated in longer horizons while shorter-term chart structure remains more mixed. Within an 800-instrument universe, the model places KAS-USD at #8 daily and #17 weekly, while the longer windows are even stronger at #1 monthly and #1 3-monthly. That rank profile is constructive, but the technical layer is not uniformly confirming: the price/MA relationship is flagged as Close vs MA50 = Bearish and MA50 vs MA200 = Bearish, while momentum indicators lean closer to balance (RSI bias Neutral, MACD hist 0.0005). Volatility conditions also matter here, with Bollinger Bandwidth at 0.3938, implying a regime where breakouts can accelerate but false moves are common. Key decision zones are clearly defined at support ~0.0305 and resistance ~0.0491.
- Rank stance: Short-term Bullish (#8/800); Mid-term Bullish (#17/800); Long-term Bullish (#1/800 monthly and #1/800 3-monthly).
- Technical confluence: Neutral (18-signal confluence 0.278; overall technical score 0.238).
- Key levels: Support ~ 0.0305 | Resistance ~ 0.0491.
- News sentiment bias: Slightly negative/neutral (avg -0.034; 19% positive / 56% neutral / 25% negative).
- Confirmation / invalidation: A break above 0.0491 with volume favors continuation; a close below 0.0305 raises deterioration risk.
What KGNAI Measures
KGNAI ranks instruments by relative positioning across large universes, emphasizing where signals cluster versus conflict. The goal is probabilistic: identify historically stronger behavioral setups (trend persistence, mean reversion conditions, and volatility regimes) without relying on any single indicator.
How to Read This Report
- Ranks are comparative within the stated universe size, not absolute guarantees.
- Confluence reflects agreement across multiple signals and models.
- Support/resistance are decision zones where risk often compresses or expands.
- Sentiment provides context and bias, not a standalone trading signal.
1) KGNAI AI Analysis
Region: CRYPTO
Total universe size: 800 ranked instruments
- Daily rank: #8 out of 800 — Bullish
- Weekly rank: #17 out of 800 — Bullish
- Monthly rank: #1 out of 800 — Bullish
- 3-Monthly rank: #1 out of 800 — Bullish
The rank curve is notably asymmetric: KAS-USD sits in the top decile on the daily view (#8/800) and remains in the upper quartile on the weekly view (#17/800), while the longer windows are at the very top (#1/800 monthly and #1/800 3-monthly). That pattern typically reflects sustained relative strength versus peers, but it does not remove the need for tactical risk controls—especially when the technical layer (covered below) flags areas of friction.
In this snapshot, the rank strength argues that KAS-USD is still being rewarded by the cross-universe model selection process, even as certain trend filters remain less supportive. When this happens, the practical takeaway is to treat the long-horizon rank leadership as a tailwind, while using near-term confirmation points to avoid paying for strength during a potentially choppy transition phase.
From a portfolio-construction lens, the key nuance is time-horizon alignment: the model is most confident at monthly and 3-month horizons (both #1), while the market’s shorter-term structure can still produce adverse excursions. The tightest discipline tends to come from letting the ranks define the “why this is on the radar,” and letting levels and momentum define “when the market is agreeing.”
2) Price & trend overview
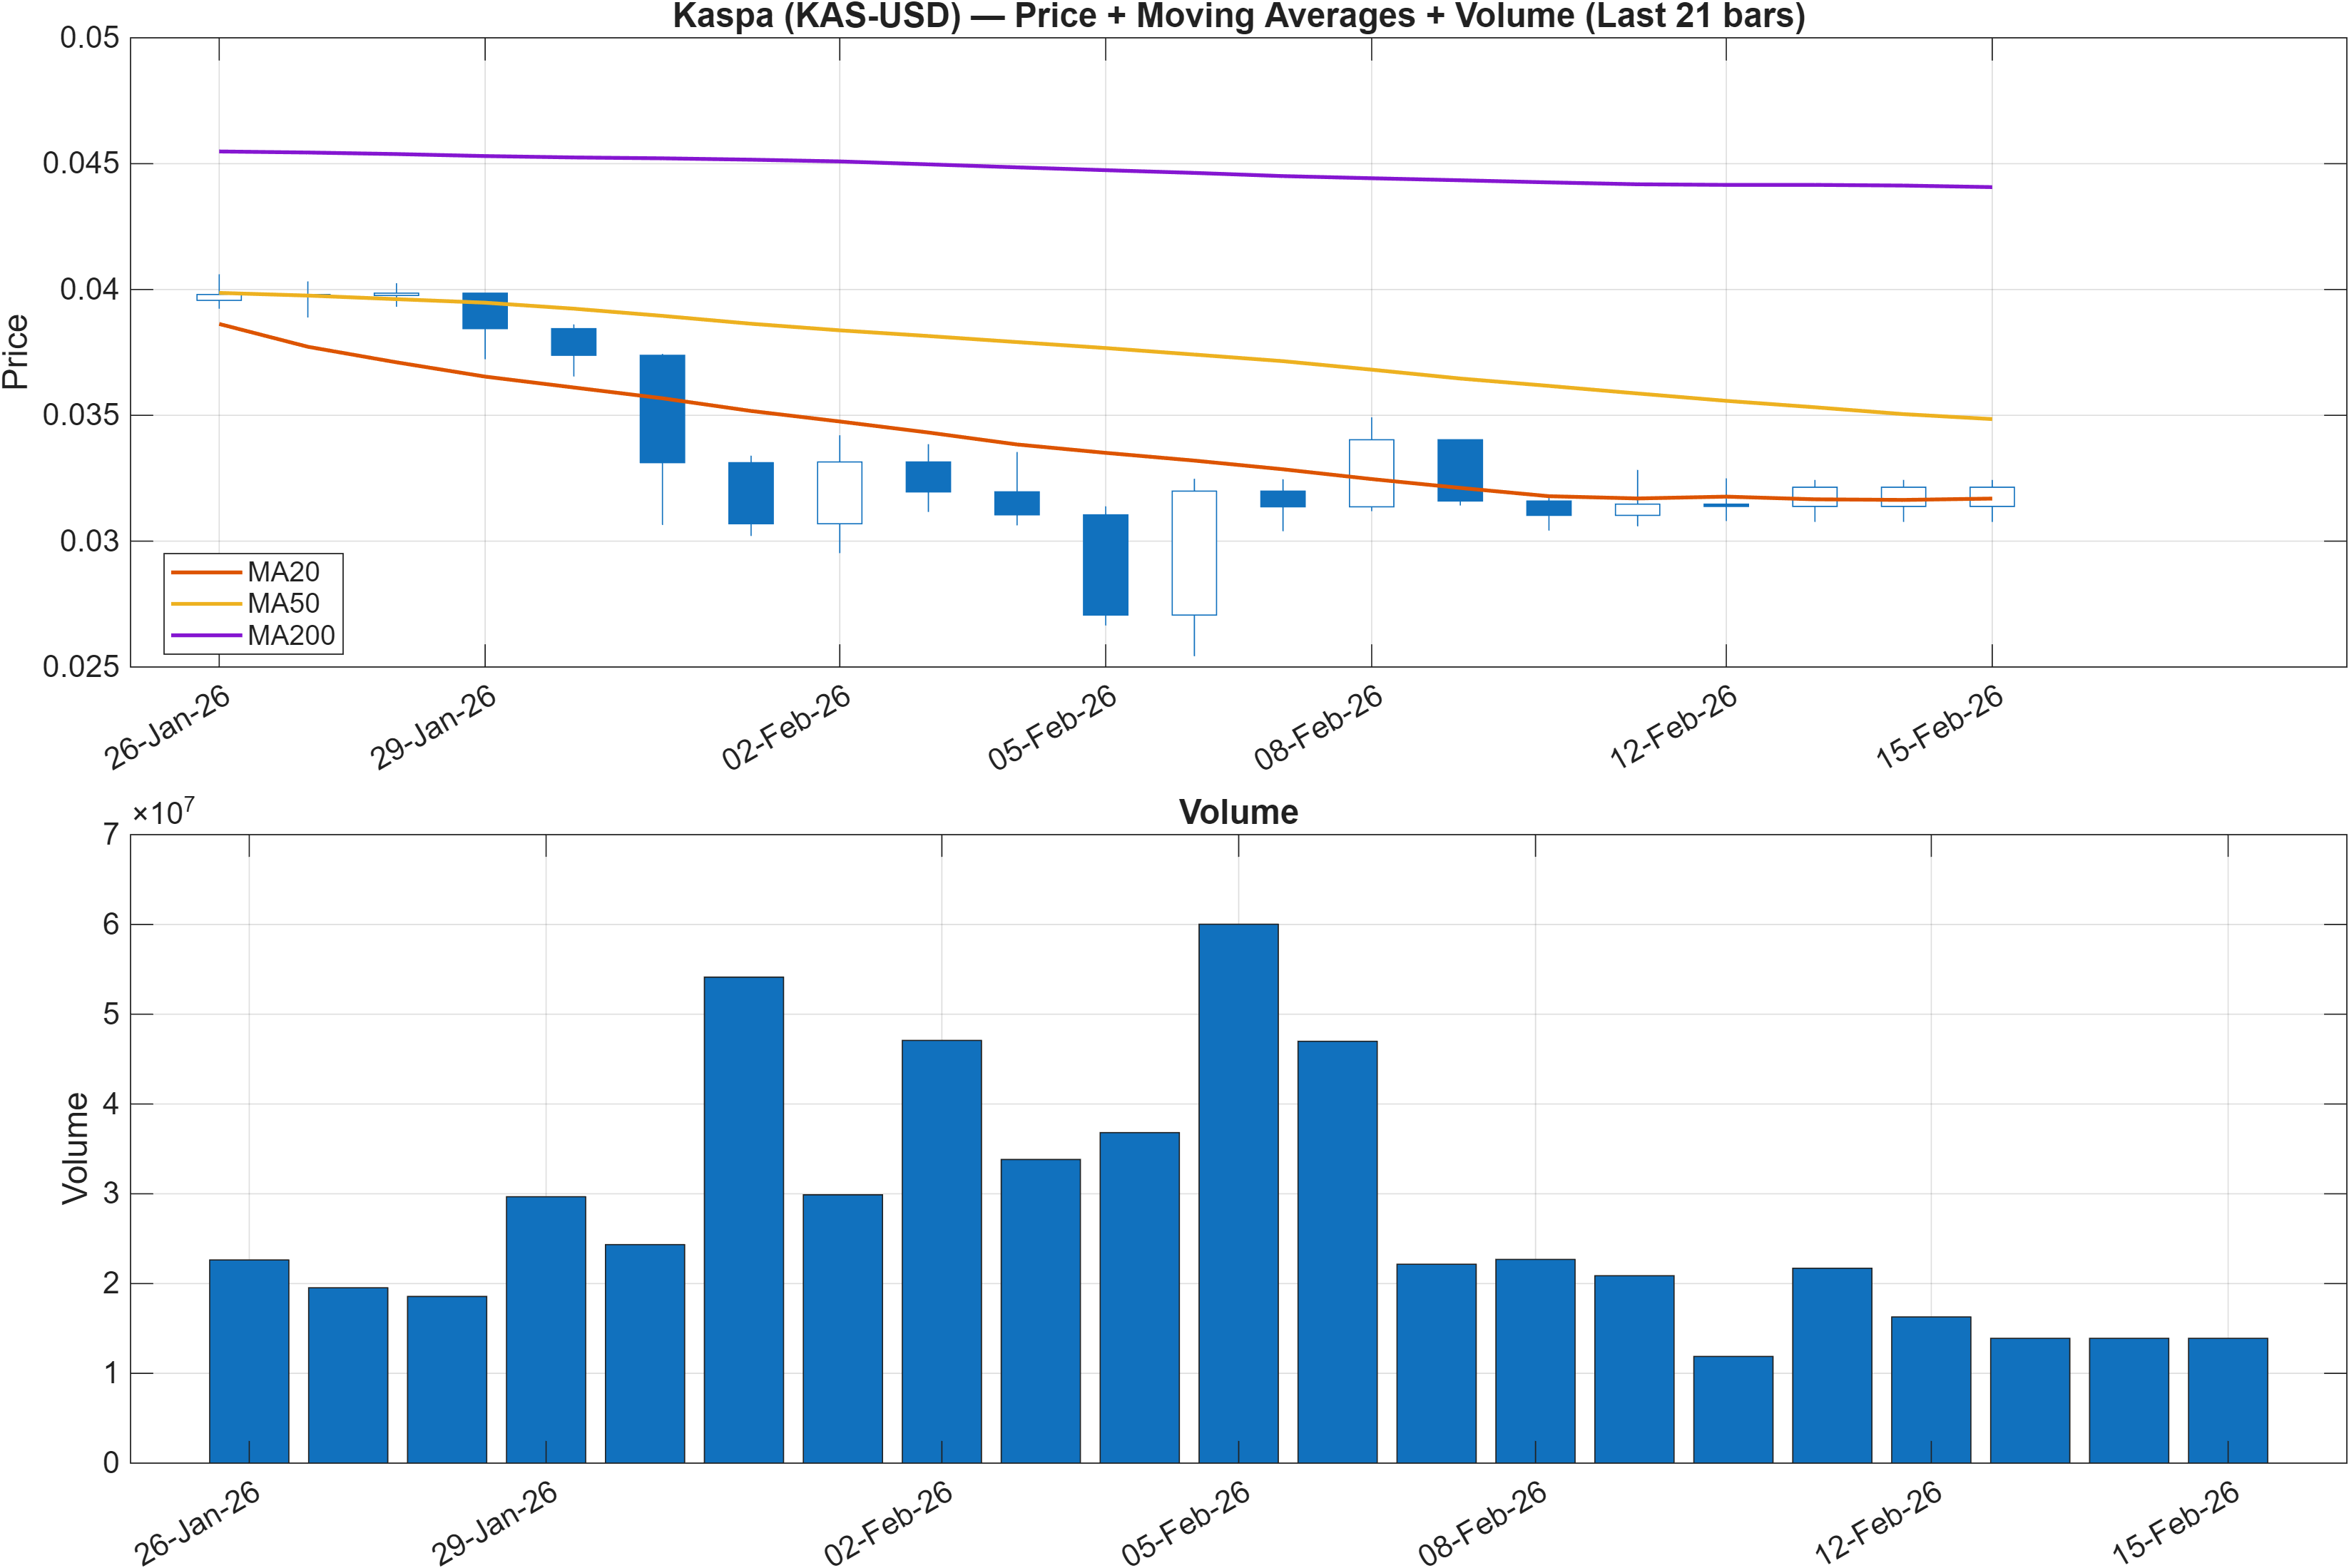
Interpretation: Close vs MA50 = Bearish, MA50 vs MA200 = Bearish.
Trend structure: strong ranks, weaker moving-average posture
The moving-average readout is unambiguously cautious: Close vs MA50 = Bearish and MA50 vs MA200 = Bearish. In classical trend-following terms, that combination often maps to a market still working through repair, where rallies can occur but are more vulnerable to overhead supply until the faster average is reclaimed and the intermediate trend begins to stabilize.
This is where KAS-USD’s rank strength becomes analytically interesting rather than automatically bullish. With the daily rank at #8 and weekly at #17, the cross-universe model is still seeing favorable relative behavior versus peers. When ranks are strong but MA posture is bearish, the market sometimes transitions into a range-bound phase that alternates between sharp rebounds and pullbacks, rather than a clean trend.
The most actionable implication is to anchor trend decisions around the nearby decision zones highlighted later: support ~0.0305 and resistance ~0.0491. A constructive pathway tends to require the price to prove it can regain traction toward resistance while holding above support. Conversely, persistent rejection while the MA configuration remains bearish can keep price action mean-reverting and sensitive to liquidity shifts.
For readers who use multiple timeframes, this section argues for separating relative leadership (ranks) from trend confirmation (moving averages). Right now those two lenses are not perfectly aligned, which elevates the value of confirmation/invalidation rules.
3) Momentum & volatility dashboard
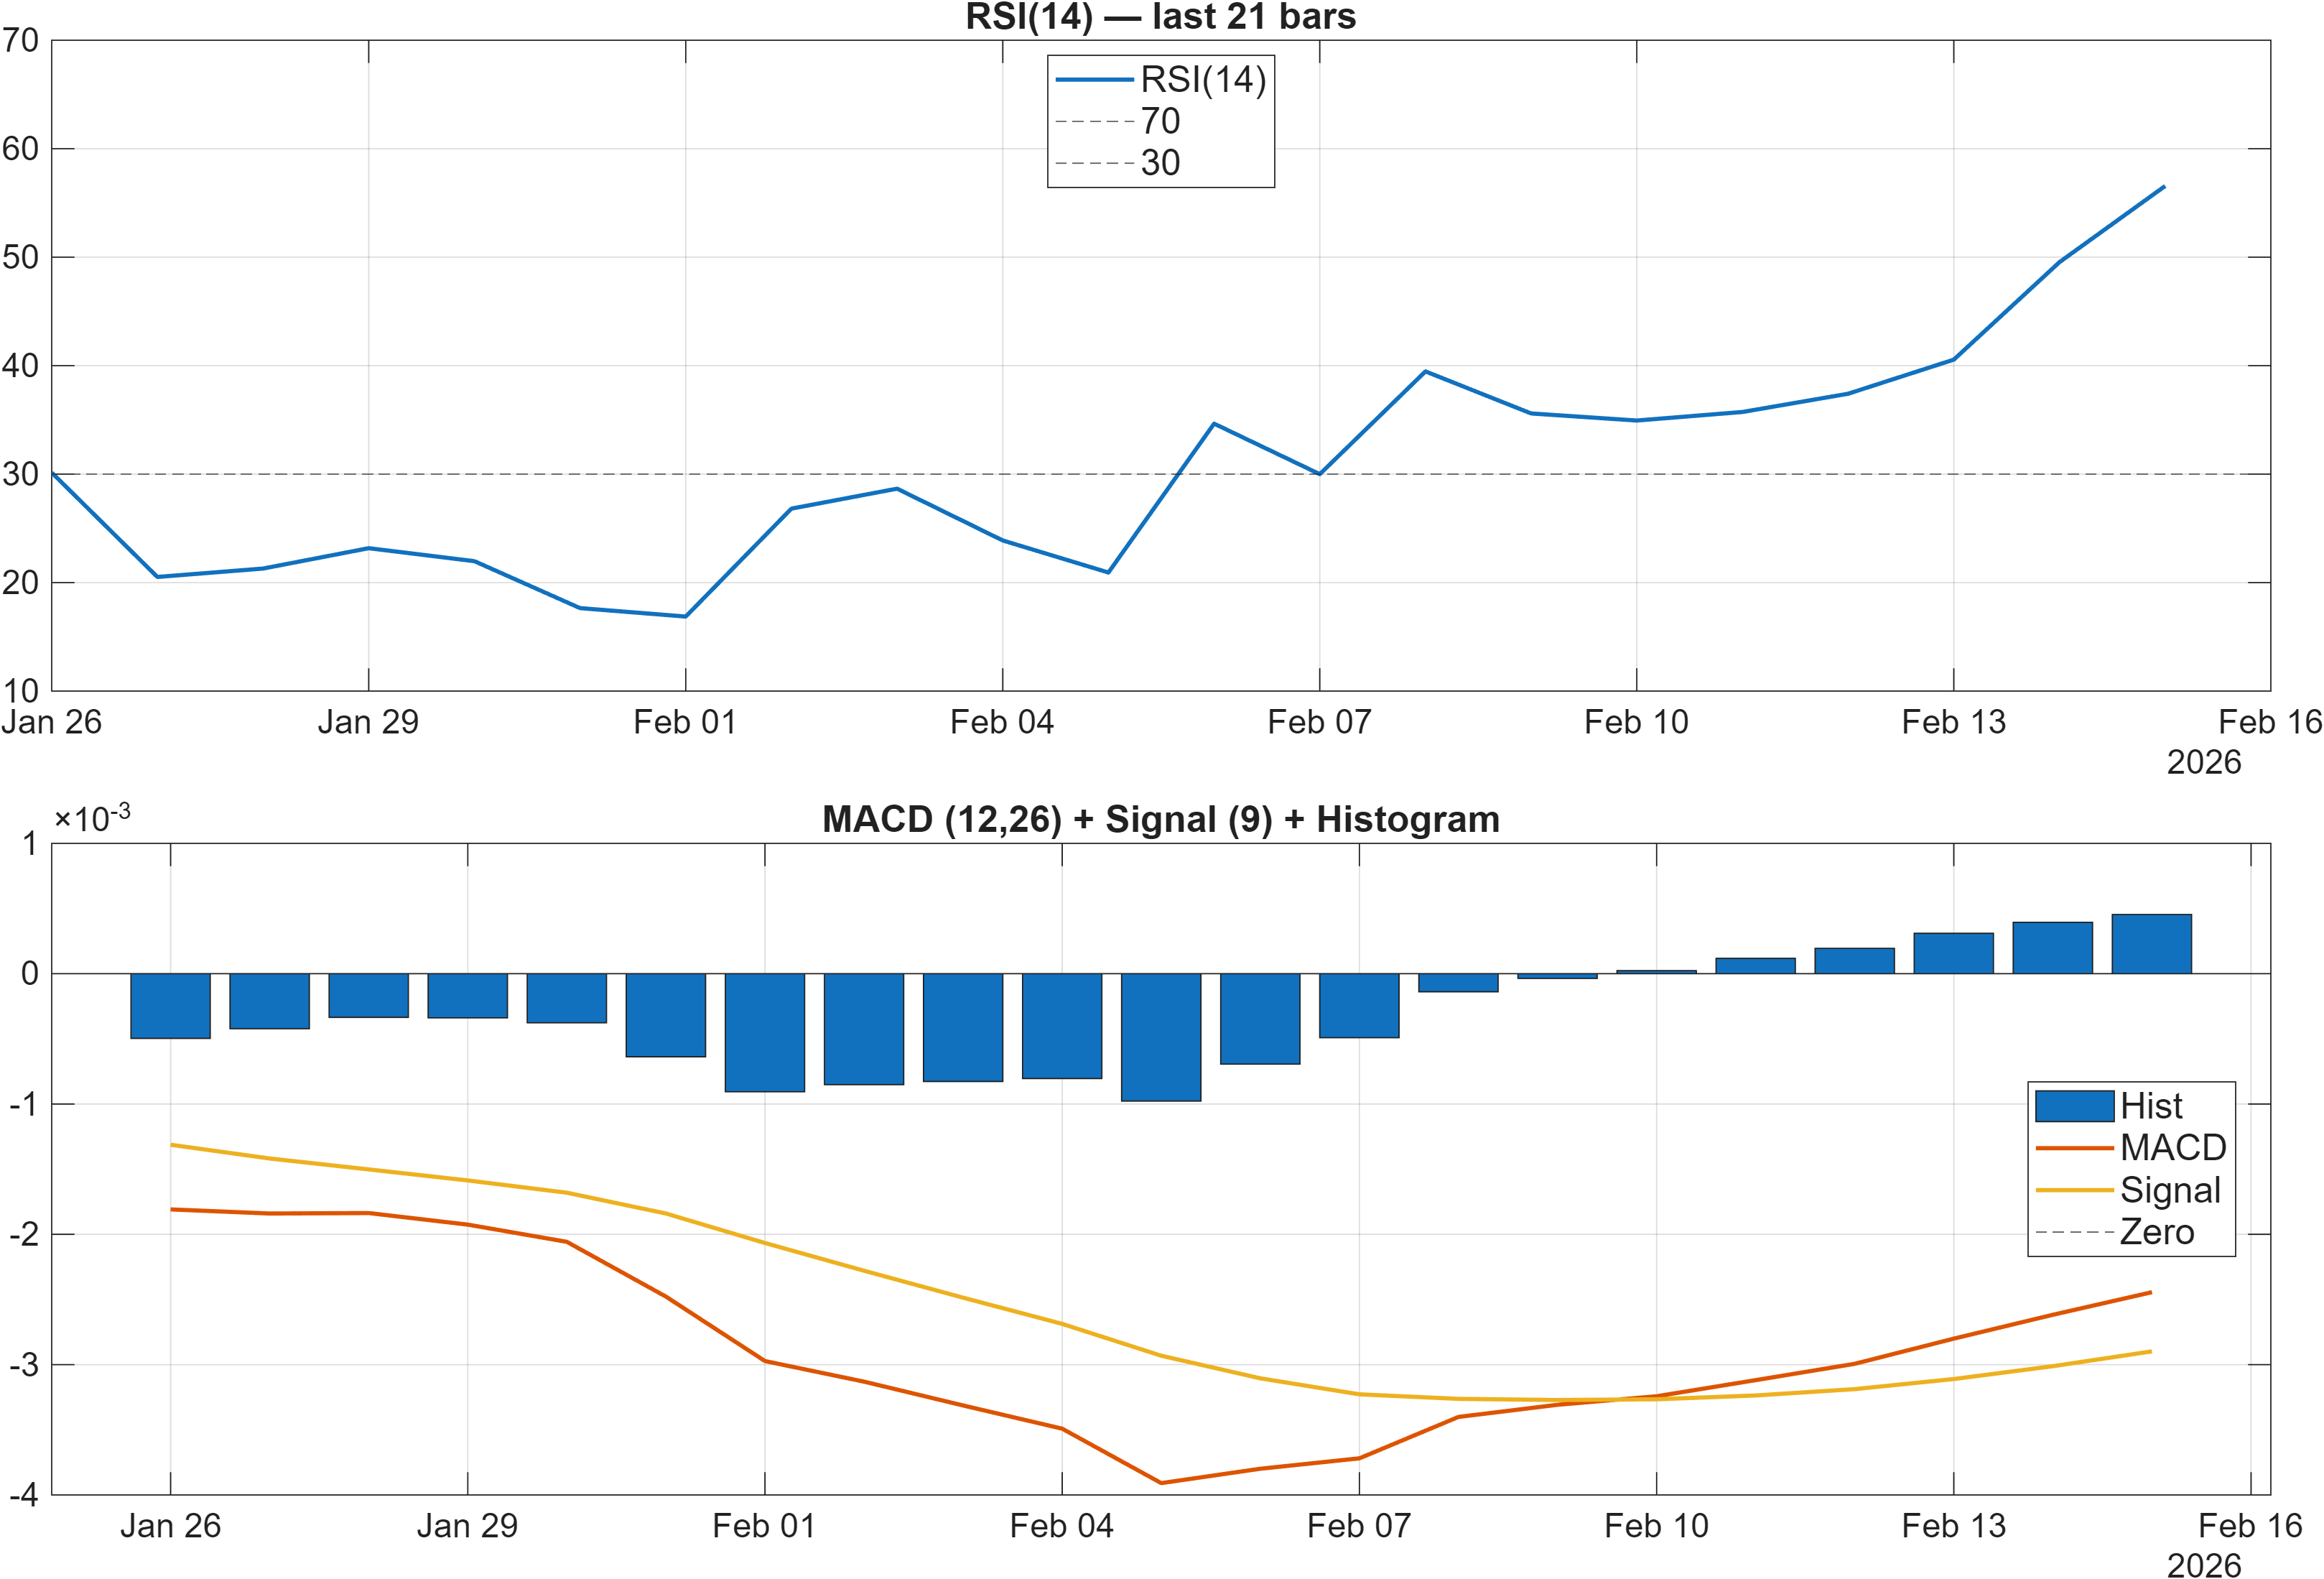
Interpretation: RSI bias = Neutral, MACD hist = 0.0005.
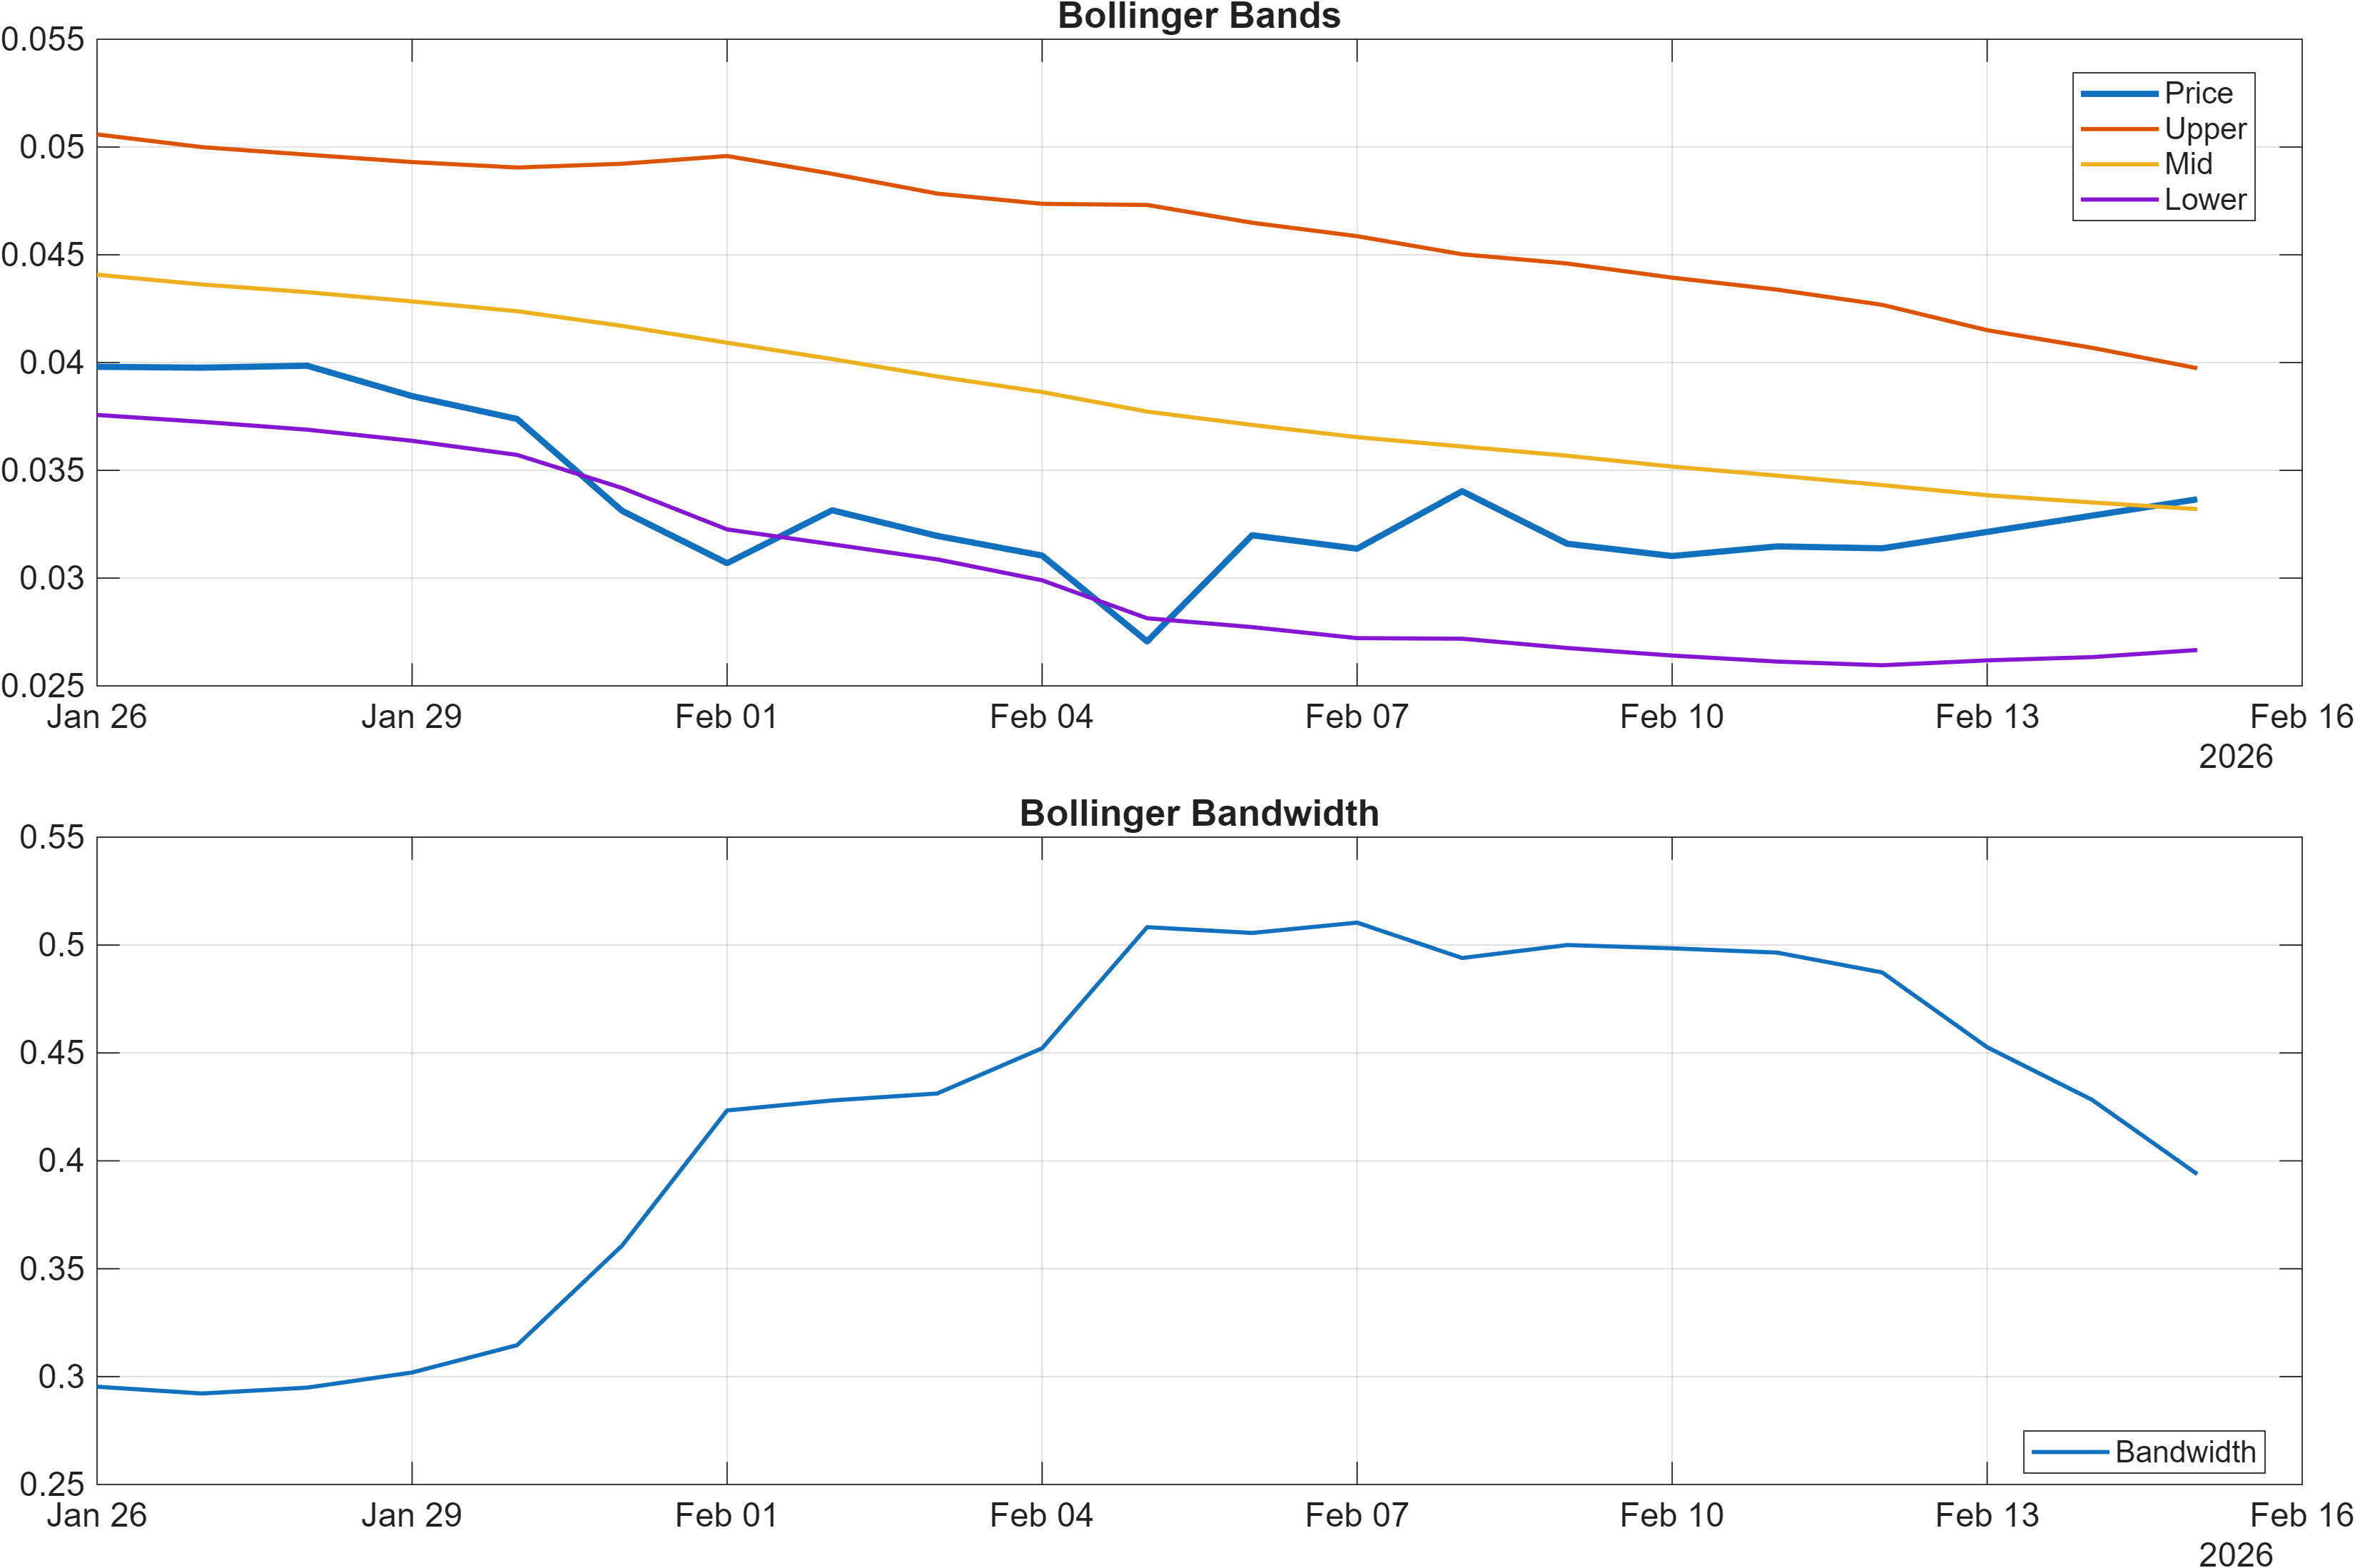
Interpretation: Bandwidth (volatility regime) latest = 0.3938.
Momentum: stabilization signals without a full trend impulse
Momentum reads as more balanced than the moving-average posture. RSI is described as Neutral, which typically aligns with a market that is neither extended nor deeply washed out. At the same time, the MACD histogram is slightly positive at 0.0005, suggesting incremental upside impulse rather than a decisive acceleration.
This “neutral RSI + small positive MACD” blend often appears when price is attempting to base or rebuild after prior weakness. It supports the idea that downside pressure may be moderating, but it is not, by itself, confirmation that trend conditions have flipped—especially given the bearish MA relationships in the trend section.
Volatility regime: bandwidth high enough to amplify both outcomes
Bollinger Bandwidth at 0.3938 matters because volatility is the transmission mechanism for both breakouts and breakdowns. In a wider-band regime, moves through key levels can travel farther than expected, but “failed breaks” can also snap back quickly. That makes the 0.0305 support and 0.0491 resistance particularly relevant as risk-defining zones, not just chart annotations.
Taken together: momentum is leaning toward stabilization (MACD hist 0.0005), volatility is elevated enough to matter (bandwidth 0.3938), and trend filters are still cautious (bearish vs MA50 and MA200). The result is a market where confirmation should be demanded at the level and volume layer before treating any single uptick as durable.
4) Support / Resistance zones
Support ~ 0.0305 | Resistance ~ 0.0491
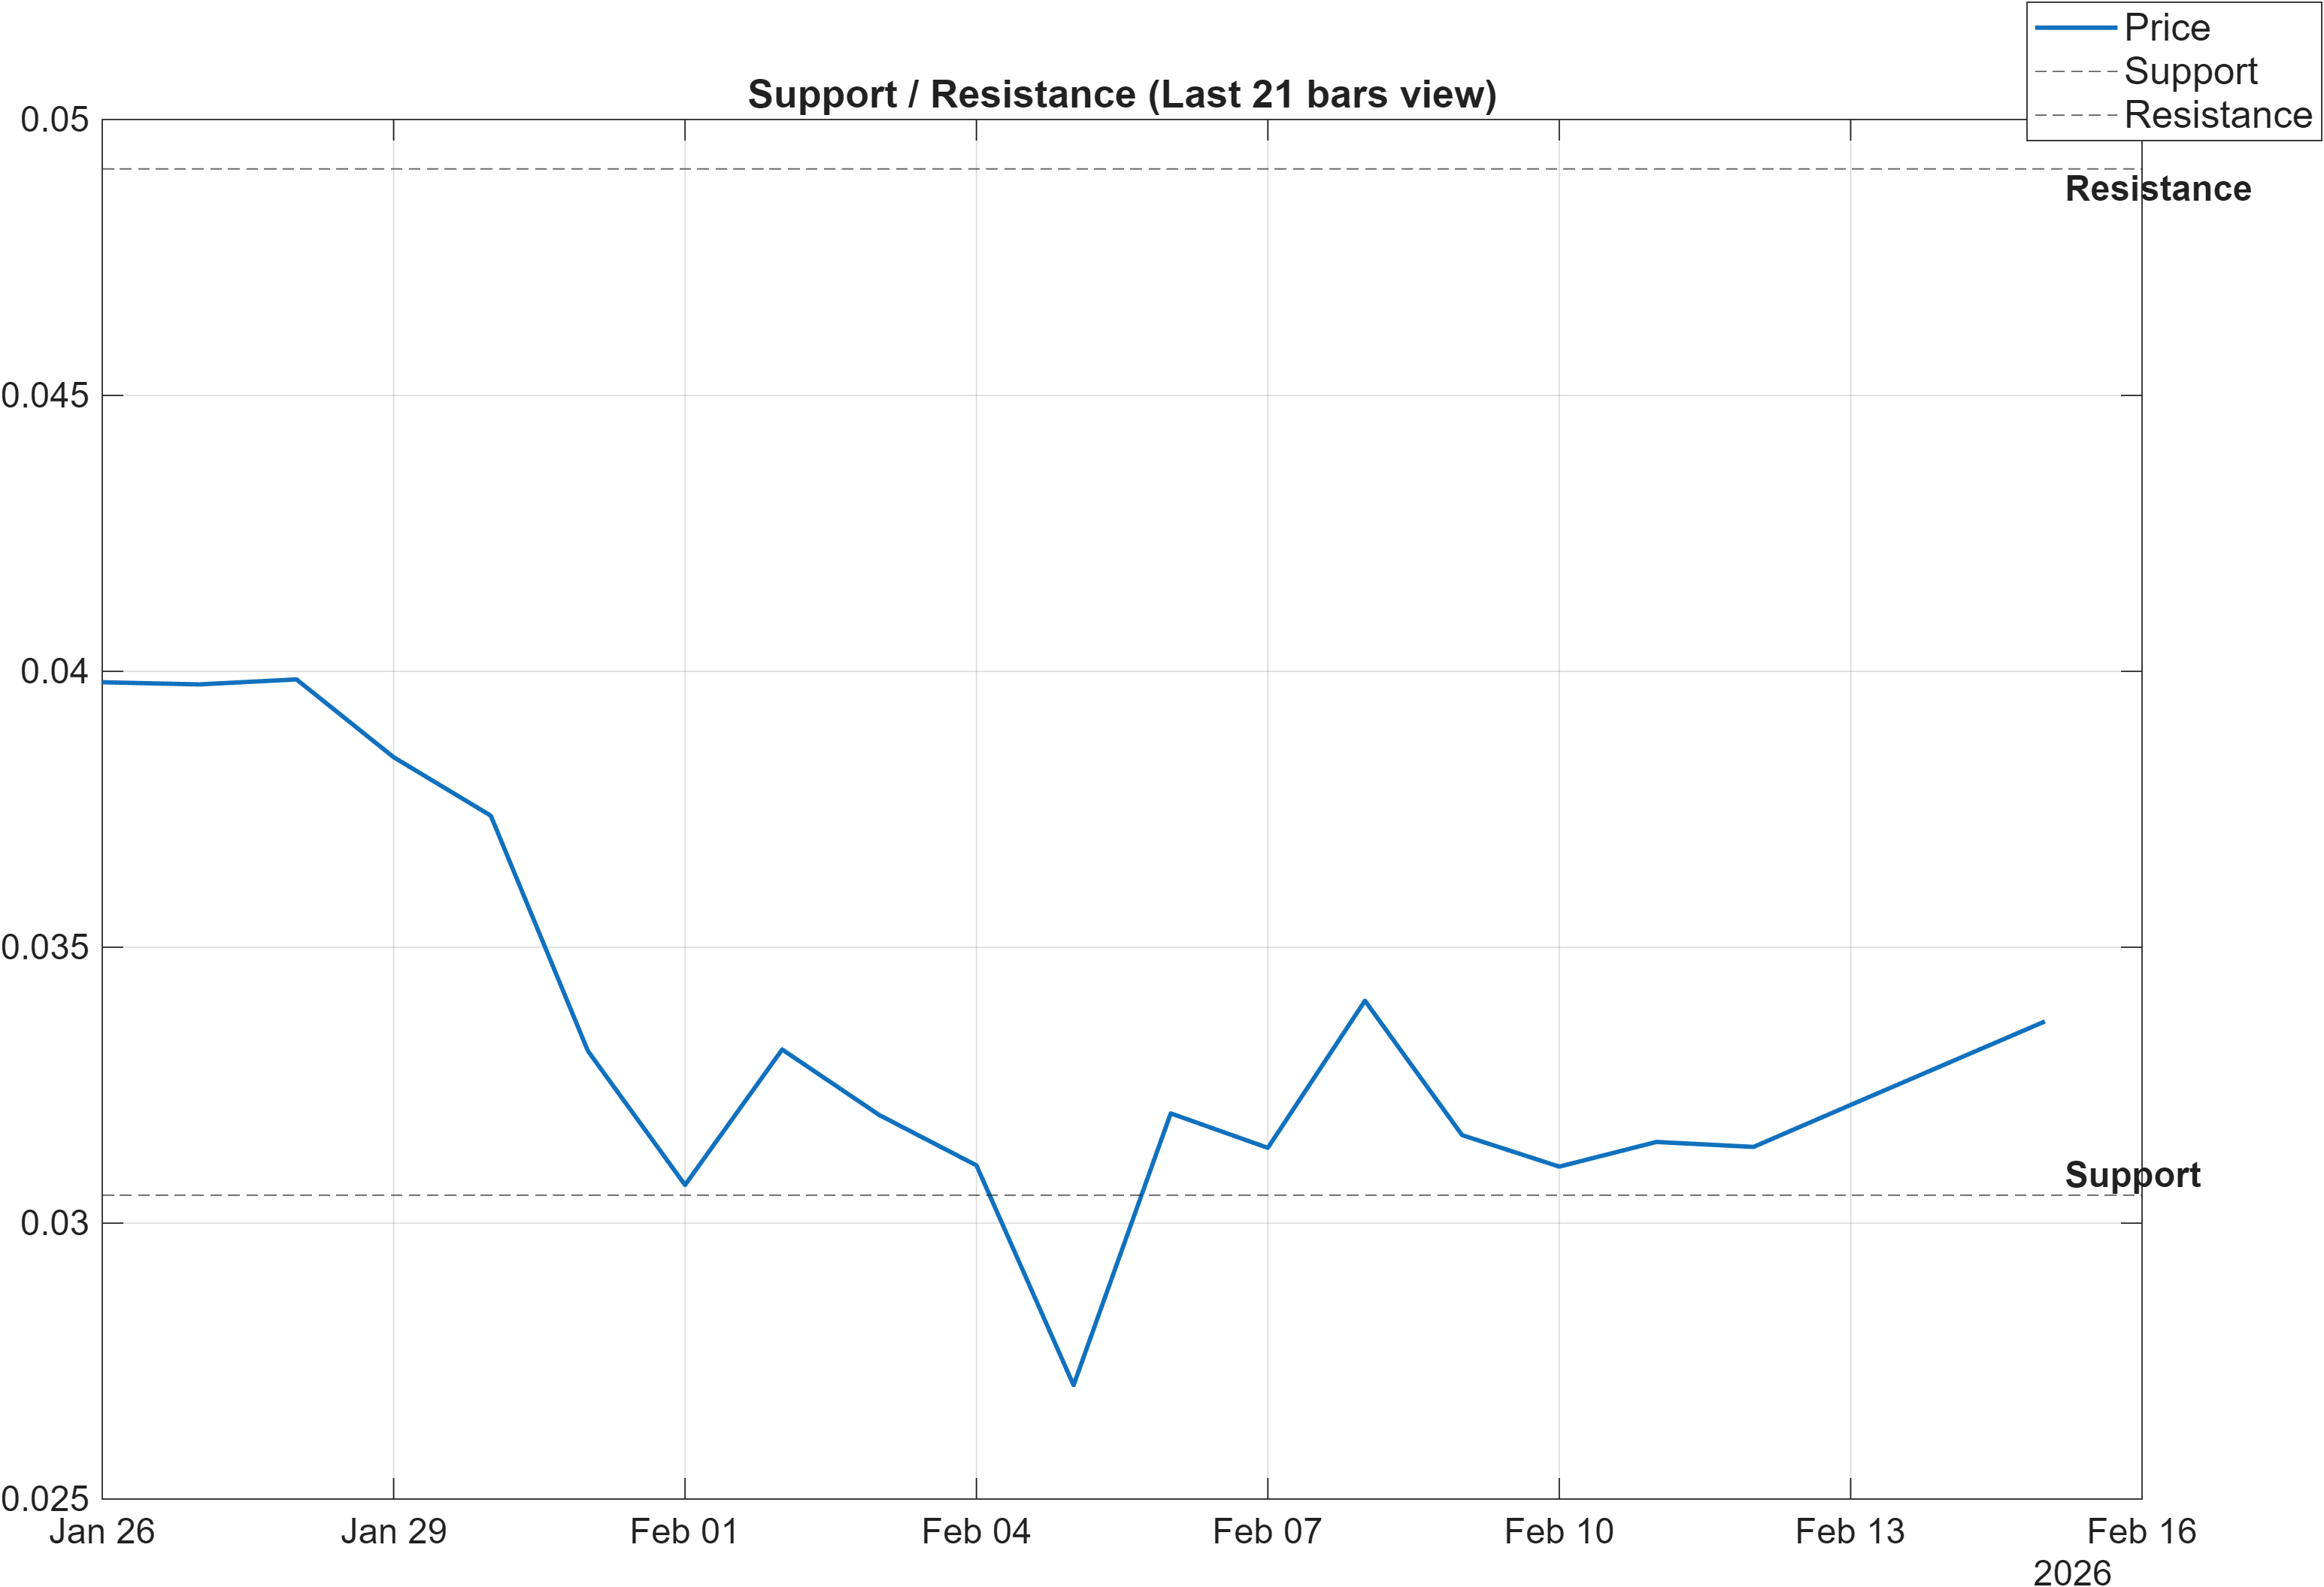
Scenario view: Break above resistance with volume → continuation. Close below support → signal deterioration risk.
Decision zones: where ranks must translate into price acceptance
The defined zones—support ~0.0305 and resistance ~0.0491—operate as the report’s main validation framework. With KAS-USD ranked strongly across horizons (daily #8, weekly #17, and #1 on both monthly and 3-monthly), the key question becomes whether price action can convert that relative strength into a clean acceptance above resistance, rather than repeated rejection.
A break above 0.0491 with volume is explicitly framed as a continuation condition. That aligns with the idea that, in a higher-volatility regime (bandwidth 0.3938), resistance breaks can propagate quickly—assuming the move is supported by participation. If the breakout lacks follow-through, the same volatility regime can punish late entries through sharp retracements.
On the downside, a close below 0.0305 is the stated deterioration risk. With moving-average signals already bearish, losing support would add alignment to the bearish case (trend + levels), potentially overwhelming the more constructive rank picture. In that sense, 0.0305 is less about a “perfect number” and more about protecting against regime transition.
For tactical readers, the most coherent approach is to treat the band between 0.0305 and 0.0491 as the active decision corridor. Within that corridor, signals can rotate quickly; outside it, the market is more likely to declare direction.
5) Quant Technical Dashboard (18 Signals)
KGNAI AI Technical Analysis Score (Deep Reinforcement Learning): Rank #342 out of 800 (Rank 1 represents the strongest technical positioning and a higher probability of favorable price behavior. As ranks increase toward the maximum, the probability of favorable outcomes weakens and bearish positioning becomes more dominant.) | Label: Neutral | Score: 0.145
18-Signal Technical Confluence Score: 0.278 (Neutral)
Overall Technical Score (18-signal confluence + DRL rank blend): 0.238 (Neutral)
Note: The blended score reflects signal strength weighted against broader AI technical ranking, which may temporarily diverge.
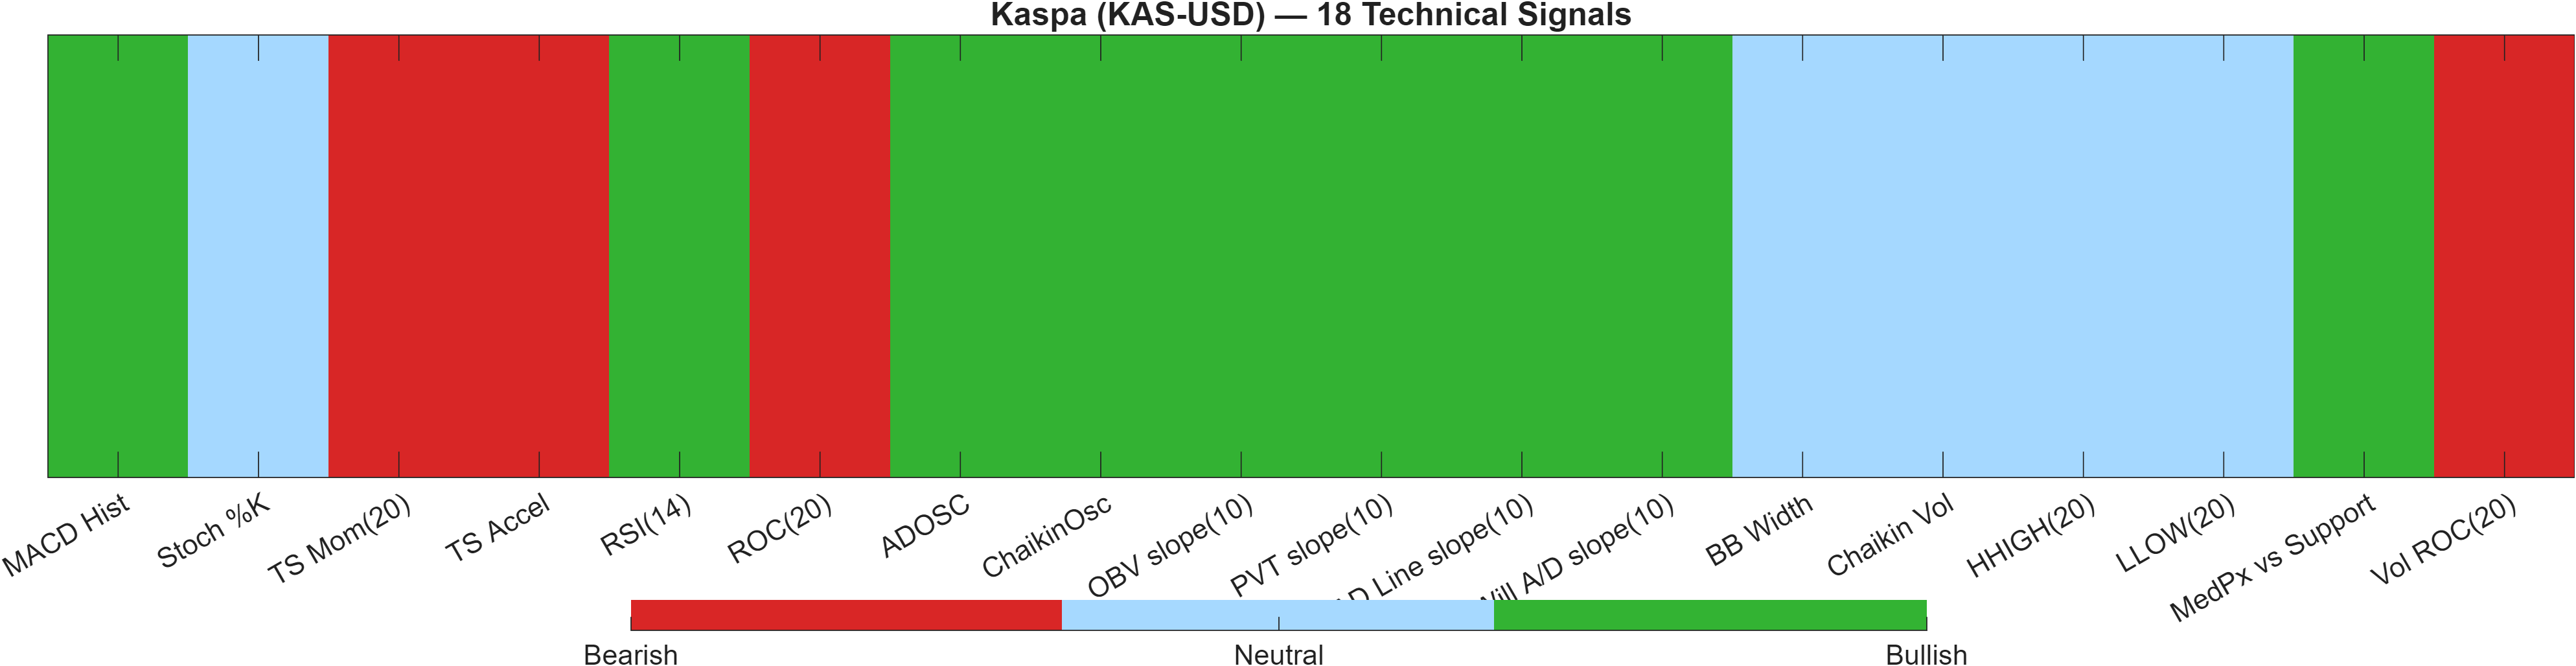
Blended technical score breakdown: 0.238 (Neutral | Bull 9 / Bear 4 / Neutral 5)
Interpreting the blended technical layer
The technical stack is best described as constructive but not fully confirmed. The Deep Reinforcement Learning technical rank is #342 out of 800 with a Neutral label and score 0.145—a middling positioning versus the broader crypto universe. Separately, the 18-signal confluence score is 0.278 (Neutral), and the blended overall technical score is 0.238 (Neutral).
This neutrality is not the same as bearishness; it indicates that the market is presenting both supportive and opposing evidence. The breakdown (Bull 9 / Bear 4 / Neutral 5) implies a slight internal advantage to bullish factors, but the blend remains neutral because higher-level structure (including the AI technical ranking) dampens confidence. That fits the earlier observation: ranks are strong, yet moving-average posture is still bearish.
Signal table (Bull/Bear/Neutral)
| Indicator | Value | Signal |
|---|---|---|
| MACD Hist | 0.0004542 | Bullish |
| Stoch %K | 70.73 | Neutral |
| TS Mom(20) | -0.007621 | Bearish |
| TS Accel | -0.0004051 | Bearish |
| RSI(14) | 56.57 | Bullish |
| ROC(20) | -15.36 | Bearish |
| ADOSC | 72.8 | Bullish |
| ChaikinOsc | 5.696e+05 | Bullish |
| OBV slope(10) | 3.41e+07 | Bullish |
| PVT slope(10) | 8.944e+06 | Bullish |
| AD Line slope(10) | 4.94e+07 | Bullish |
| Will A/D slope(10) | 0.006315 | Bullish |
| BB Width | 0.3938 | Neutral |
| Chaikin Vol | -44.63 | Neutral |
| HHIGH(20) | 0.04032 | Neutral |
| LLOW(20) | 0.02543 | Neutral |
| MedPx vs Support | 0.001094 | Bullish |
| Vol ROC(20) | -28.82 | Bearish |
Interpretation: Indicator-level signals form the base confluence, which is then adjusted using a separate AI-driven technical ranking model. The final technical score summarizes this combined view.
A final nuance: the signal set includes both momentum/oscillator elements (RSI(14) 56.57, MACD hist 0.0004542) and participation/flow proxies (e.g., OBV slope(10) 3.41e+07). When flow signals lean bullish while trend filters lag, the market can be in an accumulation-versus-trend-repair phase—one that still requires the 0.0491 resistance area to resolve cleanly before trend confidence improves.
6) News sentiment + extractive gist
Note: Instrument-specific news matches were not found, so the digest includes broader market/sector headlines. Links are provided for verification.
Sentiment score (avg): -0.034 | Positive: 19% | Neutral: 56% | Negative: 25%
KGNAI AI News Sentiment Score (normalized -1 to +1): Not available (as of —) | Label: Not available | Overall news score: -0.03
Positive Developments
Recent coverage across major financial outlets indicates selective areas of institutional and market-structure progress within crypto, even as price action across large assets remains sensitive to macro and positioning. Deal activity around exchange ownership and consolidation has been discussed as a sign of ongoing strategic investment, which can be interpreted as supportive for infrastructure maturity. Separately, activity in regulated or widely traded crypto-linked products (including options activity tied to large vehicles) has been highlighted as evidence that participation channels continue to broaden beyond spot-only trading. In aggregate, these themes can help explain why some assets maintain strong relative ranks—even when local chart structure is less clean—because liquidity pathways and market access can support periods of resiliency. For KAS-USD, the practical link is indirect: a steadier macro/participation backdrop can improve the odds that a 0.0491 resistance test is met with sustained demand rather than a brief spike.
Neutral / Mixed Developments
The news flow also contains informational threads that do not clearly lean bullish or bearish. Ongoing “daily recap” style coverage tends to emphasize the sector’s rapid narrative rotation, where attention and liquidity can shift quickly between themes. Additionally, discussions of longer-horizon technology risks (for example, system-level security considerations) frequently read as background factors rather than immediate catalysts. These items can keep sentiment anchored in the middle of the distribution—consistent with the reported mix of 56% neutral vs 19% positive and 25% negative. For positioning, this kind of environment tends to reward level discipline: letting price prove acceptance above 0.0491 or, alternatively, respecting 0.0305 if conditions degrade.
Negative / Risk Signals
Risk-oriented coverage has focused on signs of retail participation variability and the fragility that can emerge around exchange operations and rapid liquidation dynamics. Reports discussing declines in certain retail-linked revenue lines can be read as a caution that speculative intensity is not uniform, which can raise the probability of abrupt liquidity gaps when sentiment turns. Separate stories around operational mishaps and fast drawdowns emphasize how quickly volatility can be transmitted through crypto market plumbing—an important overlay given Bollinger Bandwidth at 0.3938. For KAS-USD, the implication is not asset-specific but structural: in a regime where trend filters are already mixed (bearish MA relationships; neutral technical score 0.238), negative sector shocks can make support tests more consequential. That elevates the importance of the 0.0305 invalidation line.
- Whether price acceptance improves above 0.0491 alongside stronger volume/participation.
- Whether volatility (bandwidth 0.3938) expands into a directional move or compresses back into range behavior.
- Whether sentiment remains near-neutral (avg -0.034) or shifts toward a more decisively negative skew.
Sources referenced: Reuters, Bloomberg, Yahoo Finance, MarketWatch, Investing.com
Snapshot: AI Rank (Short–Mid–Long): Bullish (Bullish–Bullish–Bullish) · Technical Confluence: Neutral · Key Levels: Support ~0.03 | Resistance ~0.05 · News Sentiment: Neutral
7) Sources
Not available in the provided data.
You may also like: How KGNAI AI ranks instruments across global markets
Disclaimer: KGNAI provides AI-generated analytics and educational market commentary only. This is not financial advice. Markets involve risk. Always do your own research.