
ARSJPY (Argentine Peso/Japanese Yen) — 18-Feb-2026 Technical & Rank View Shows Bearish Ranks with Neutral Signal Confluence
ARSJPY sits at the intersection of weak cross-universe ranking pressure and a more balanced, indicator-level technical picture. As of 18-Feb-2026, KGNAI’s multi-horizon ranks remain deeply in the lagging cohort (e.g., Daily #938 and Weekly #941 out of 958), suggesting unfavorable comparative positioning versus the broader FOREX universe. At the same time, the technical layer is not uniformly bearish: the 18-signal confluence score is 0.278 (Neutral) and the blended overall technical score is 0.106 (Neutral), with Bull 6 / Bear 1 / Neutral 11 indicating more stabilization than momentum acceleration. Volatility is moderate-to-contained with bandwidth 0.0469, while the market is framed by nearby decision zones at support ~0.1060 and resistance ~0.1104. News sentiment is quantitatively skewed bearish via the normalized news score (-0.87), despite mixed aggregate tone in the headline distribution.
Key Takeaways
- Short / Mid / Long rank stance: Bearish / Bearish / Bearish (Daily #938, Weekly #941, Yearly #853 out of 958)
- Technical confluence label: Neutral (18-signal confluence 0.278; overall technical score 0.106)
- Key levels: Support ~ 0.1060 | Resistance ~ 0.1104
- News sentiment bias: Bearish (normalized score -0.87; avg sentiment 0.052)
- Confirmation / invalidation condition: A sustained break above 0.1104 supports continuation risk-on; a close below 0.1060 elevates deterioration risk
What KGNAI Measures
KGNAI evaluates instruments by combining large-universe relative ranks with independent technical confirmations. The intent is to contextualize an instrument’s positioning versus peers while tracking whether multiple signals agree or conflict. Outputs are framed probabilistically across broad universes rather than as point forecasts.
How to Read This Report
- Ranks are comparative across a universe of 958 instruments, not absolute measures
- Confluence reflects signal agreement (breadth) across indicators such as RSI, MACD, and Bollinger Bands
- Support/resistance levels are decision zones where confirmation or invalidation often occurs
- Sentiment provides contextual bias that may diverge from price-based signals
1) KGNAI AI Analysis
Region: FOREX
Total universe size: 958 ranked instruments
- Daily rank: #938 out of 958 — Bearish
- Weekly rank: #941 out of 958 — Bearish
- Monthly rank: #932 out of 958 — Bearish
- 3-Monthly rank: #910 out of 958 — Bearish
- 6-Monthly rank: #878 out of 958 — Bearish
- Yearly rank: #853 out of 958 — Bearish
ARSJPY is positioned in the bottom tail of the ranked universe across every monitored horizon. The short-horizon readings (Daily #938, Weekly #941, Monthly #932) cluster close to the maximum rank value of 958, consistent with persistent relative weakness rather than a one-off dislocation. The longer windows improve only marginally (6-Monthly #878, Yearly #853), which still places the cross in a lagging cohort in comparative terms.
The key analytical tension in this report is that ranks remain bearish even as several underlying technical diagnostics later in the dashboard show stabilization—an environment that typically requires confirmation through price acceptance above resistance or a renewed breakdown through support. In other words, the rank layer argues for caution on the broader regime, while the technical layer suggests the near-term tape may be transitioning toward balance.
Term view: Short-term: Bearish. Mid-term: Bearish. Long-term: Bearish.
Want the full universe and complete rank tables? Unlock full access on KGNAI: https://www.kgnai.com/pricing
2) Price & trend overview
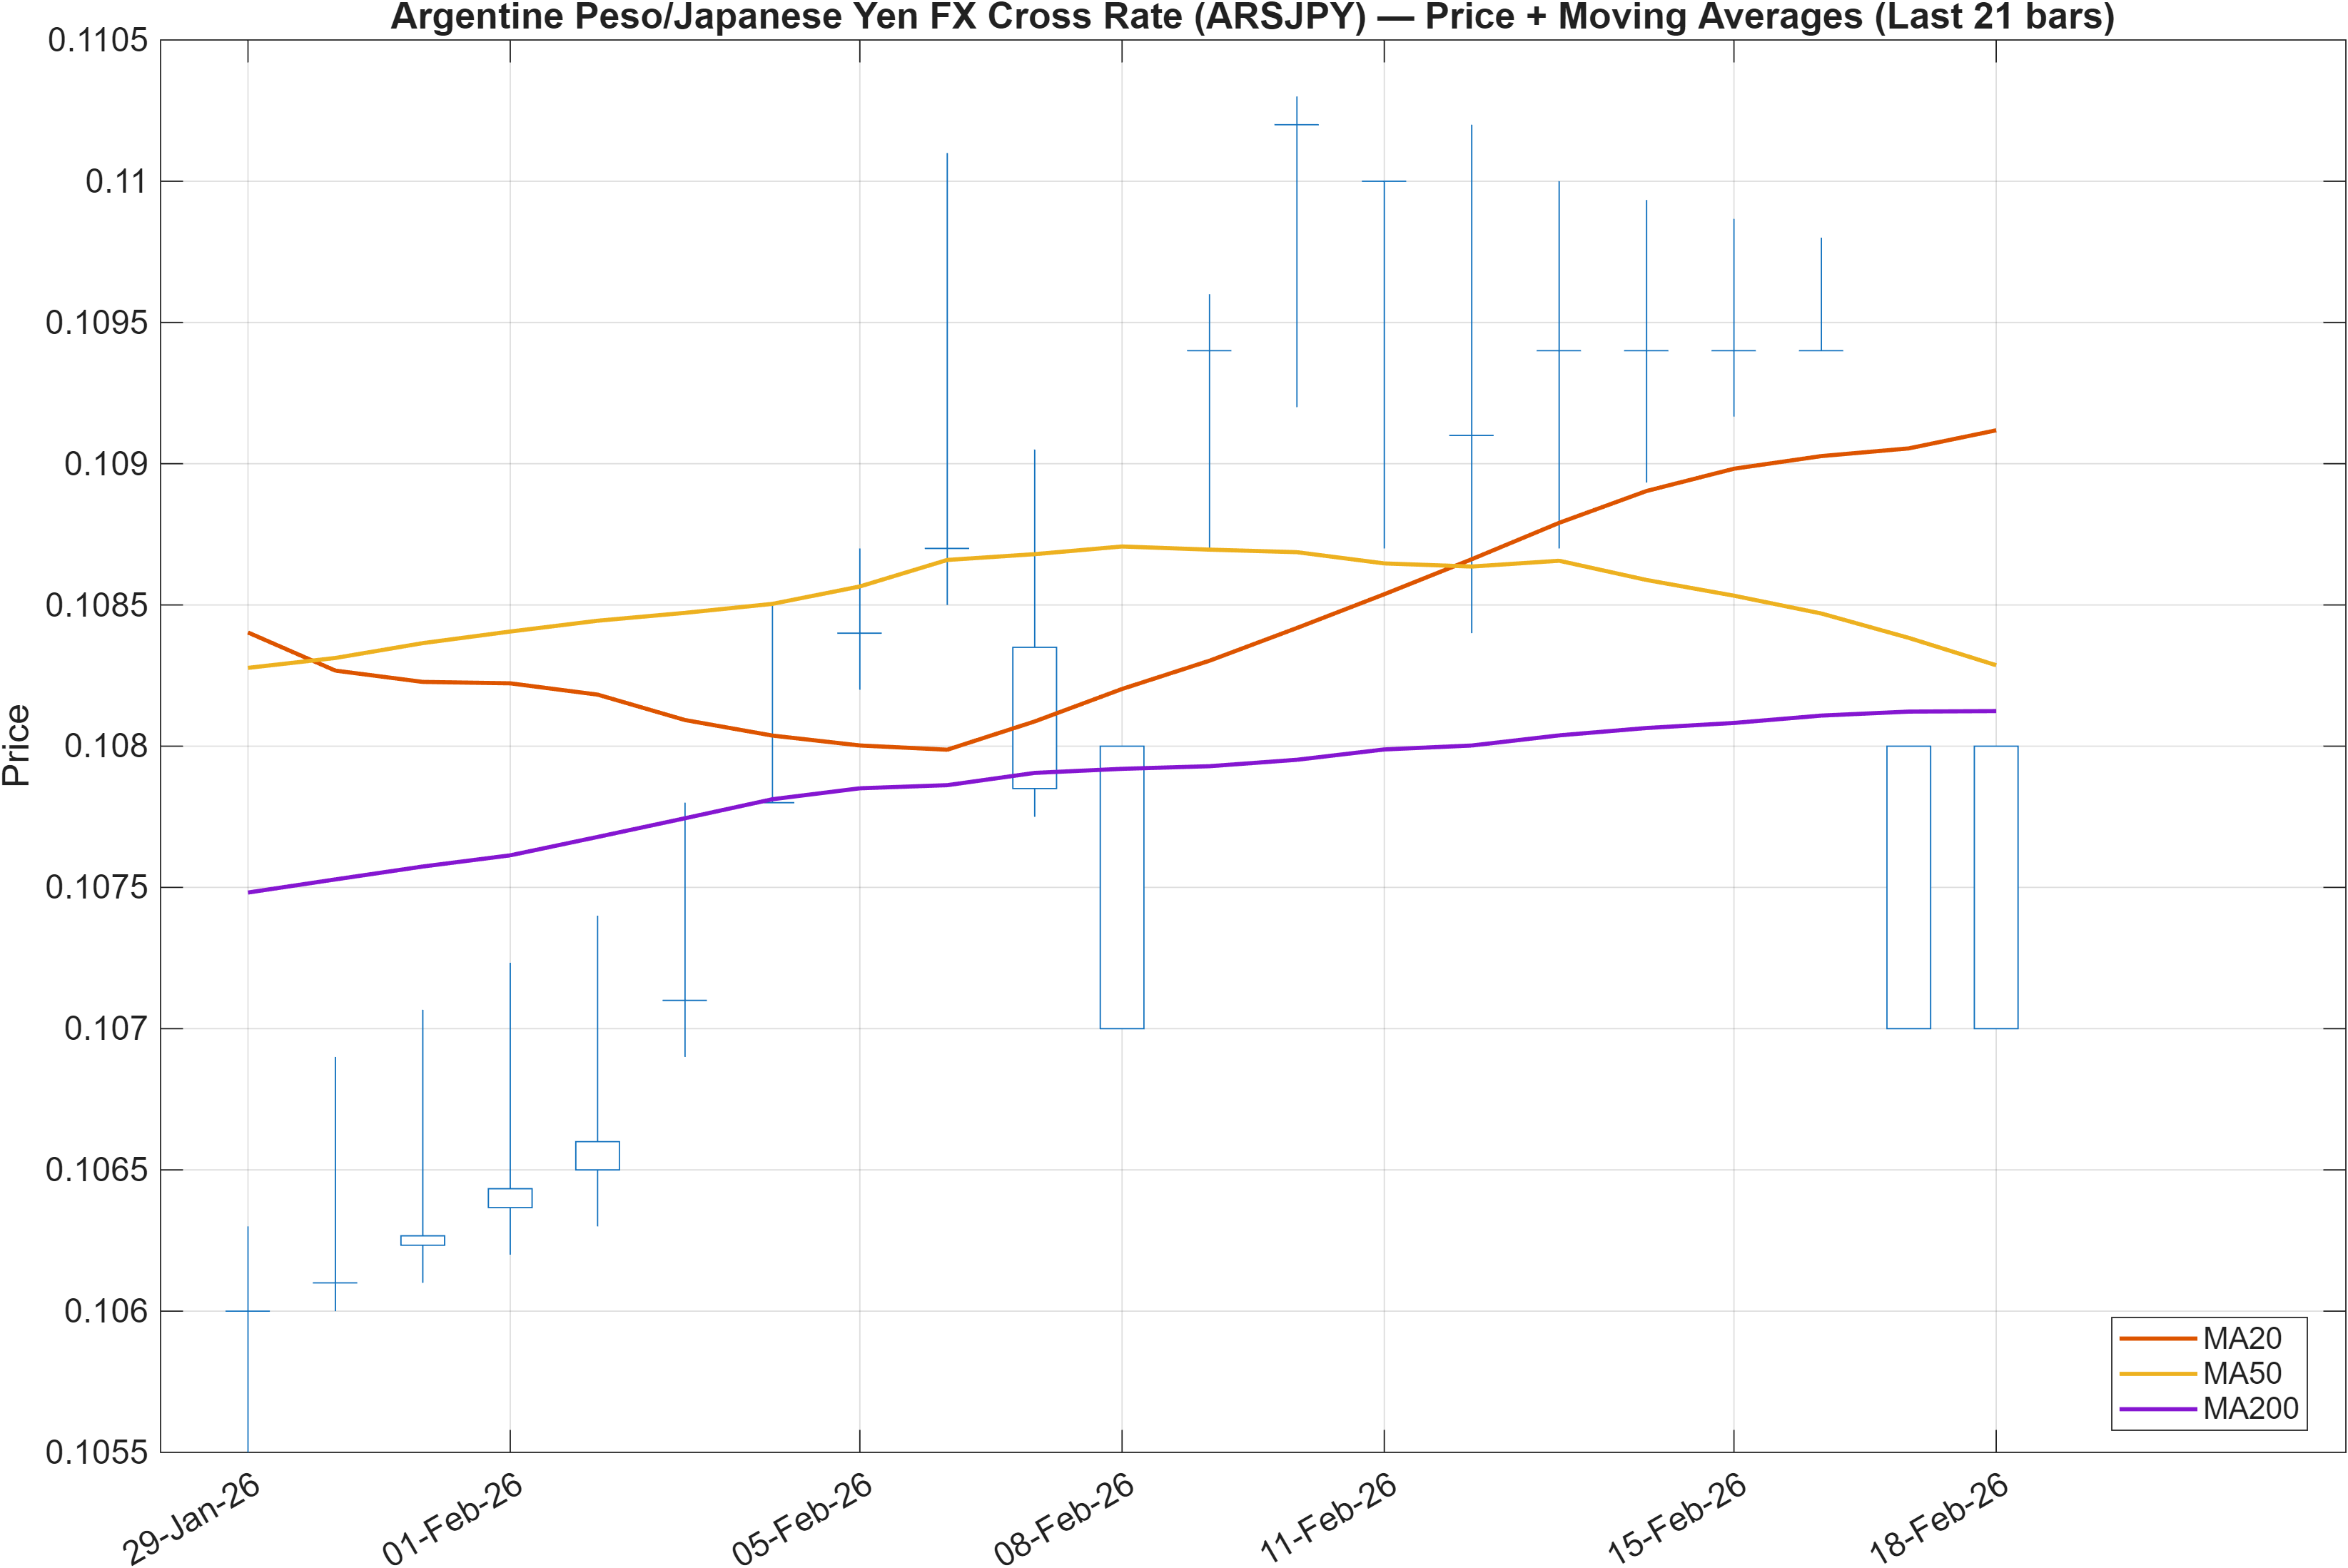
Interpretation: Close vs MA50 = Bearish, MA50 vs MA200 = Bullish.
Trend signals are split across timeframes. The close sitting below the MA50 flags weaker near-term control by buyers, consistent with the bearish short-horizon ranks (Daily #938, Weekly #941). However, the MA50 above the MA200 remains a constructive longer-term configuration, implying that the broader trend structure has not fully rolled over.
This type of alignment—short-term weakness within a still-positive longer moving-average stack—often behaves like a compression phase rather than a decisive trend. It also helps explain why later sections can show a neutral confluence score (0.278) even while ranks remain bearish: the market may be experiencing a pullback within a longer regime that has not yet been invalidated by trend deterioration.
For ARSJPY, the practical read is that follow-through is likely to be level-dependent. Acceptance above the nearby resistance band discussed later (0.1104) would better reconcile the moving-average structure with renewed upward participation, while sustained weakness that drags price action toward and through support (0.1060) would shift the balance toward a clearer regime downgrade that is already hinted at by the rank layer.
3) Momentum & volatility dashboard
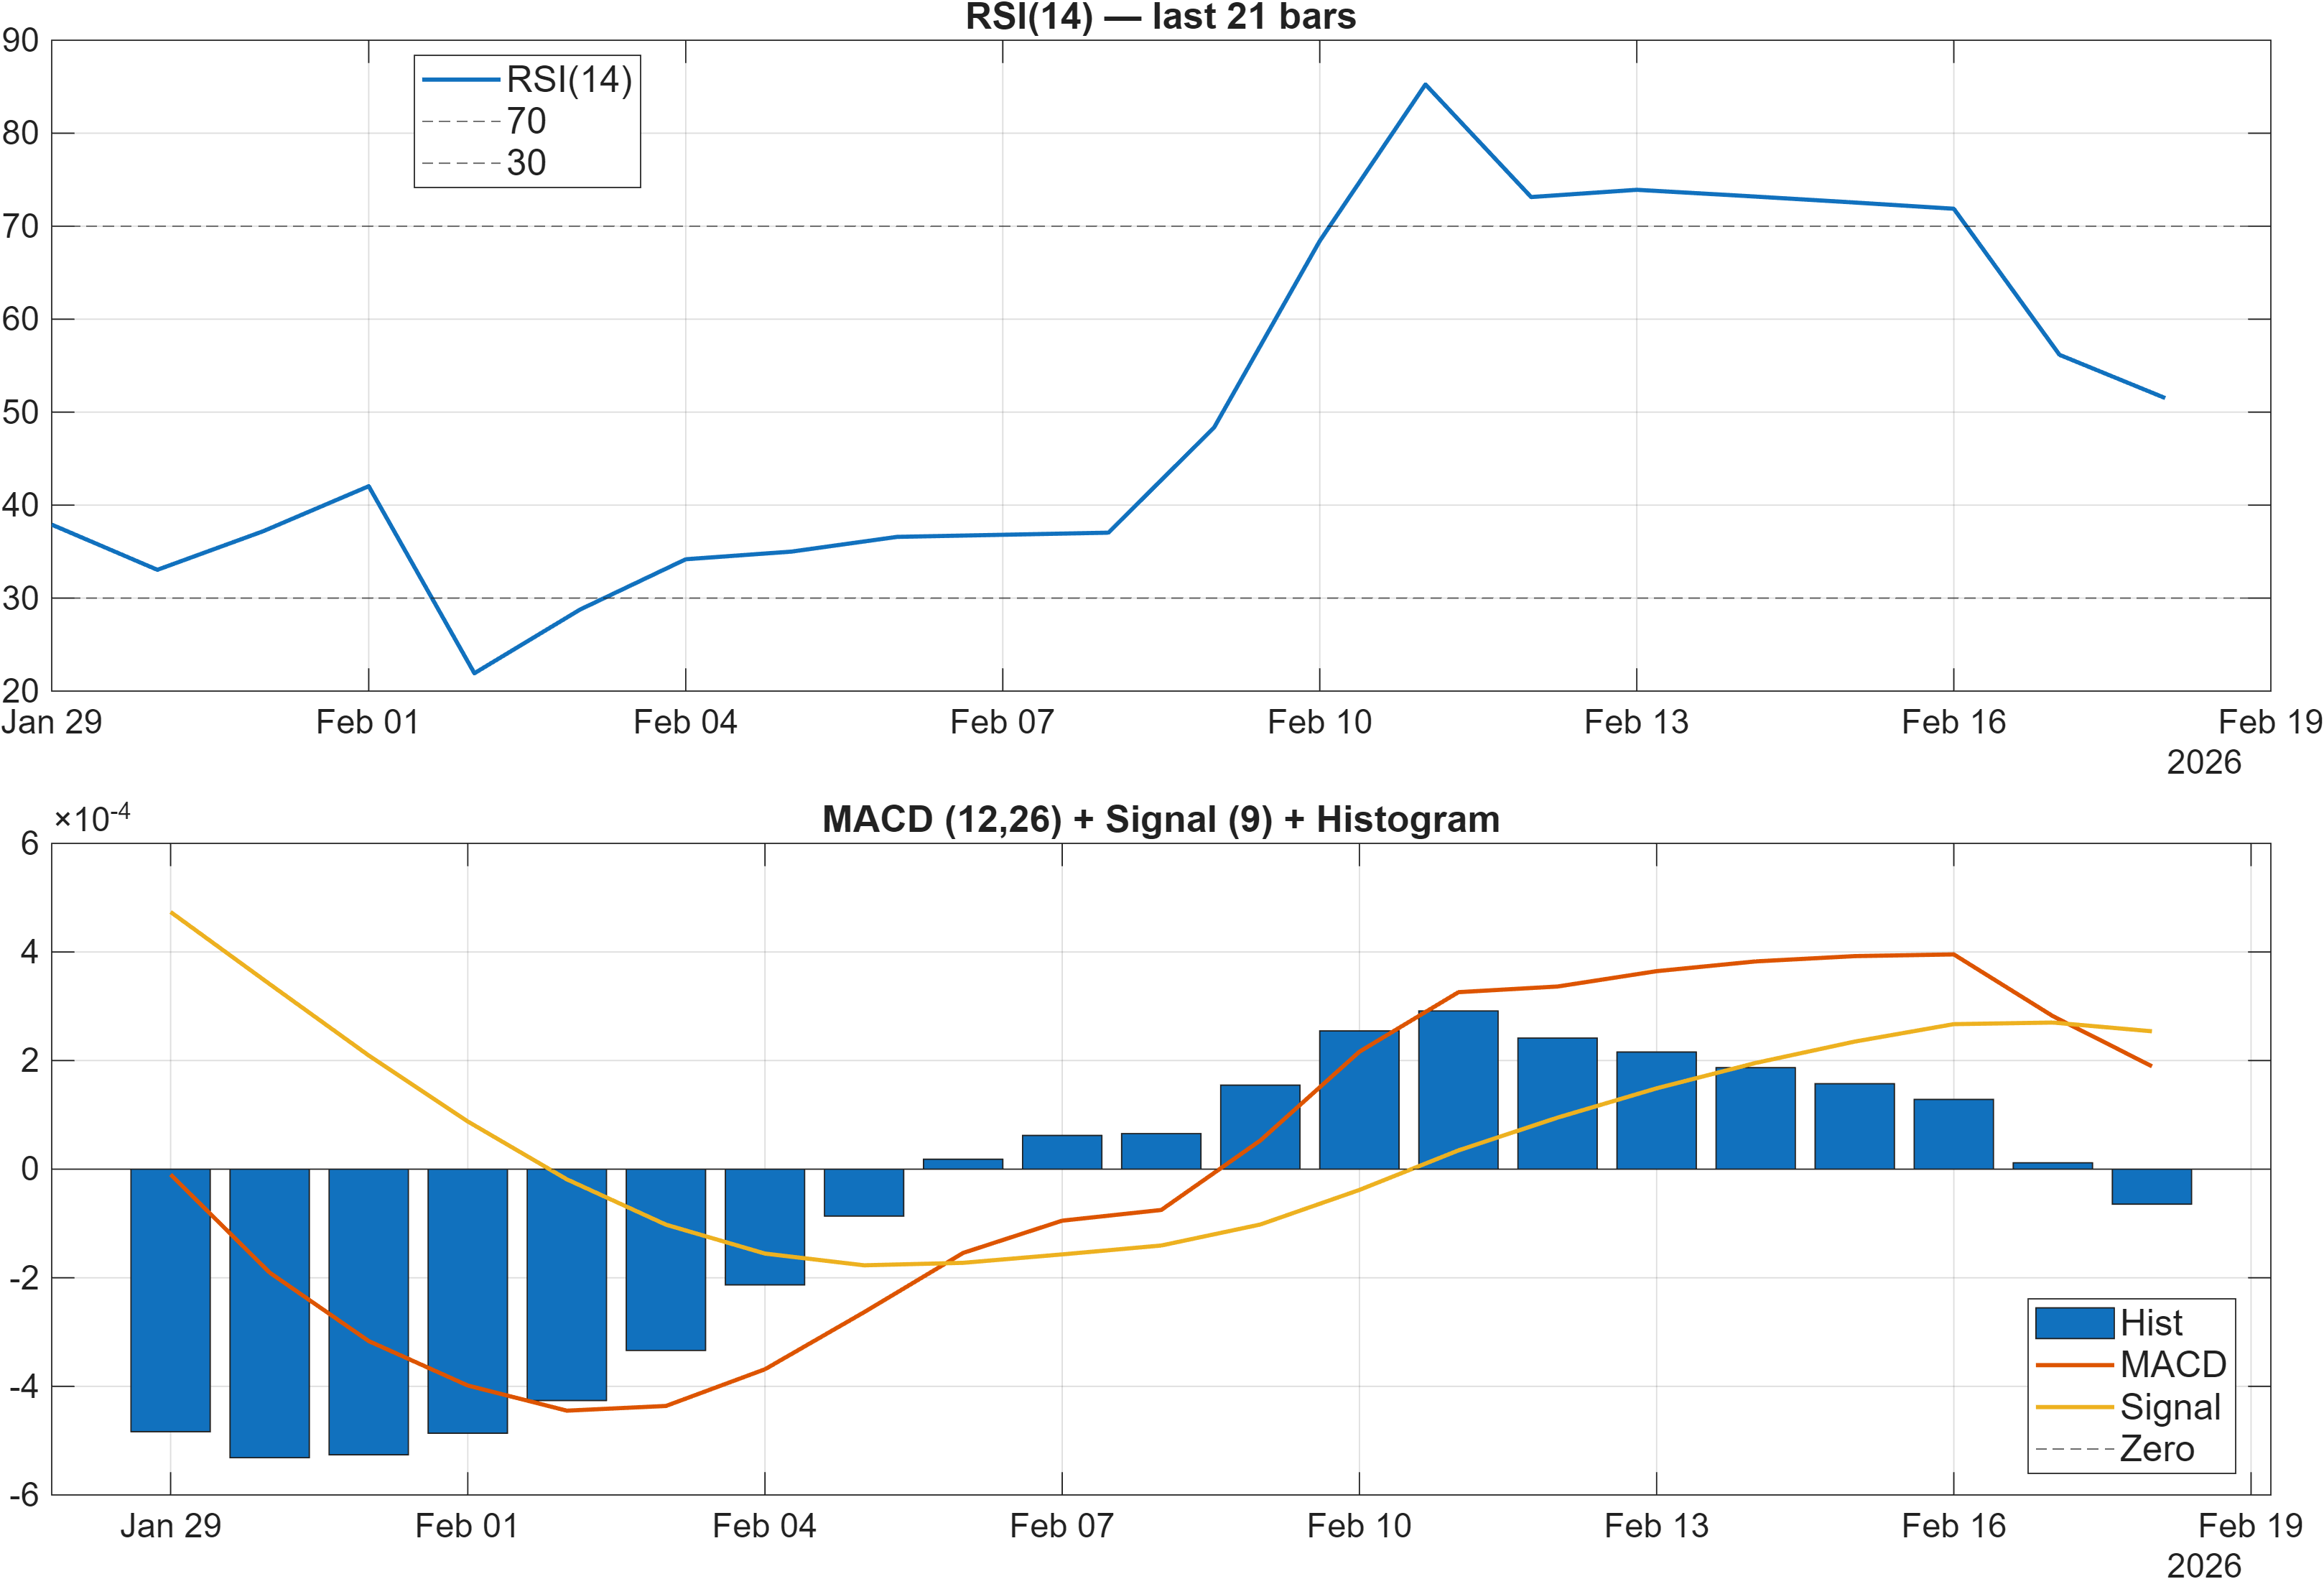
Interpretation: RSI bias = Neutral, MACD hist = -0.0001.
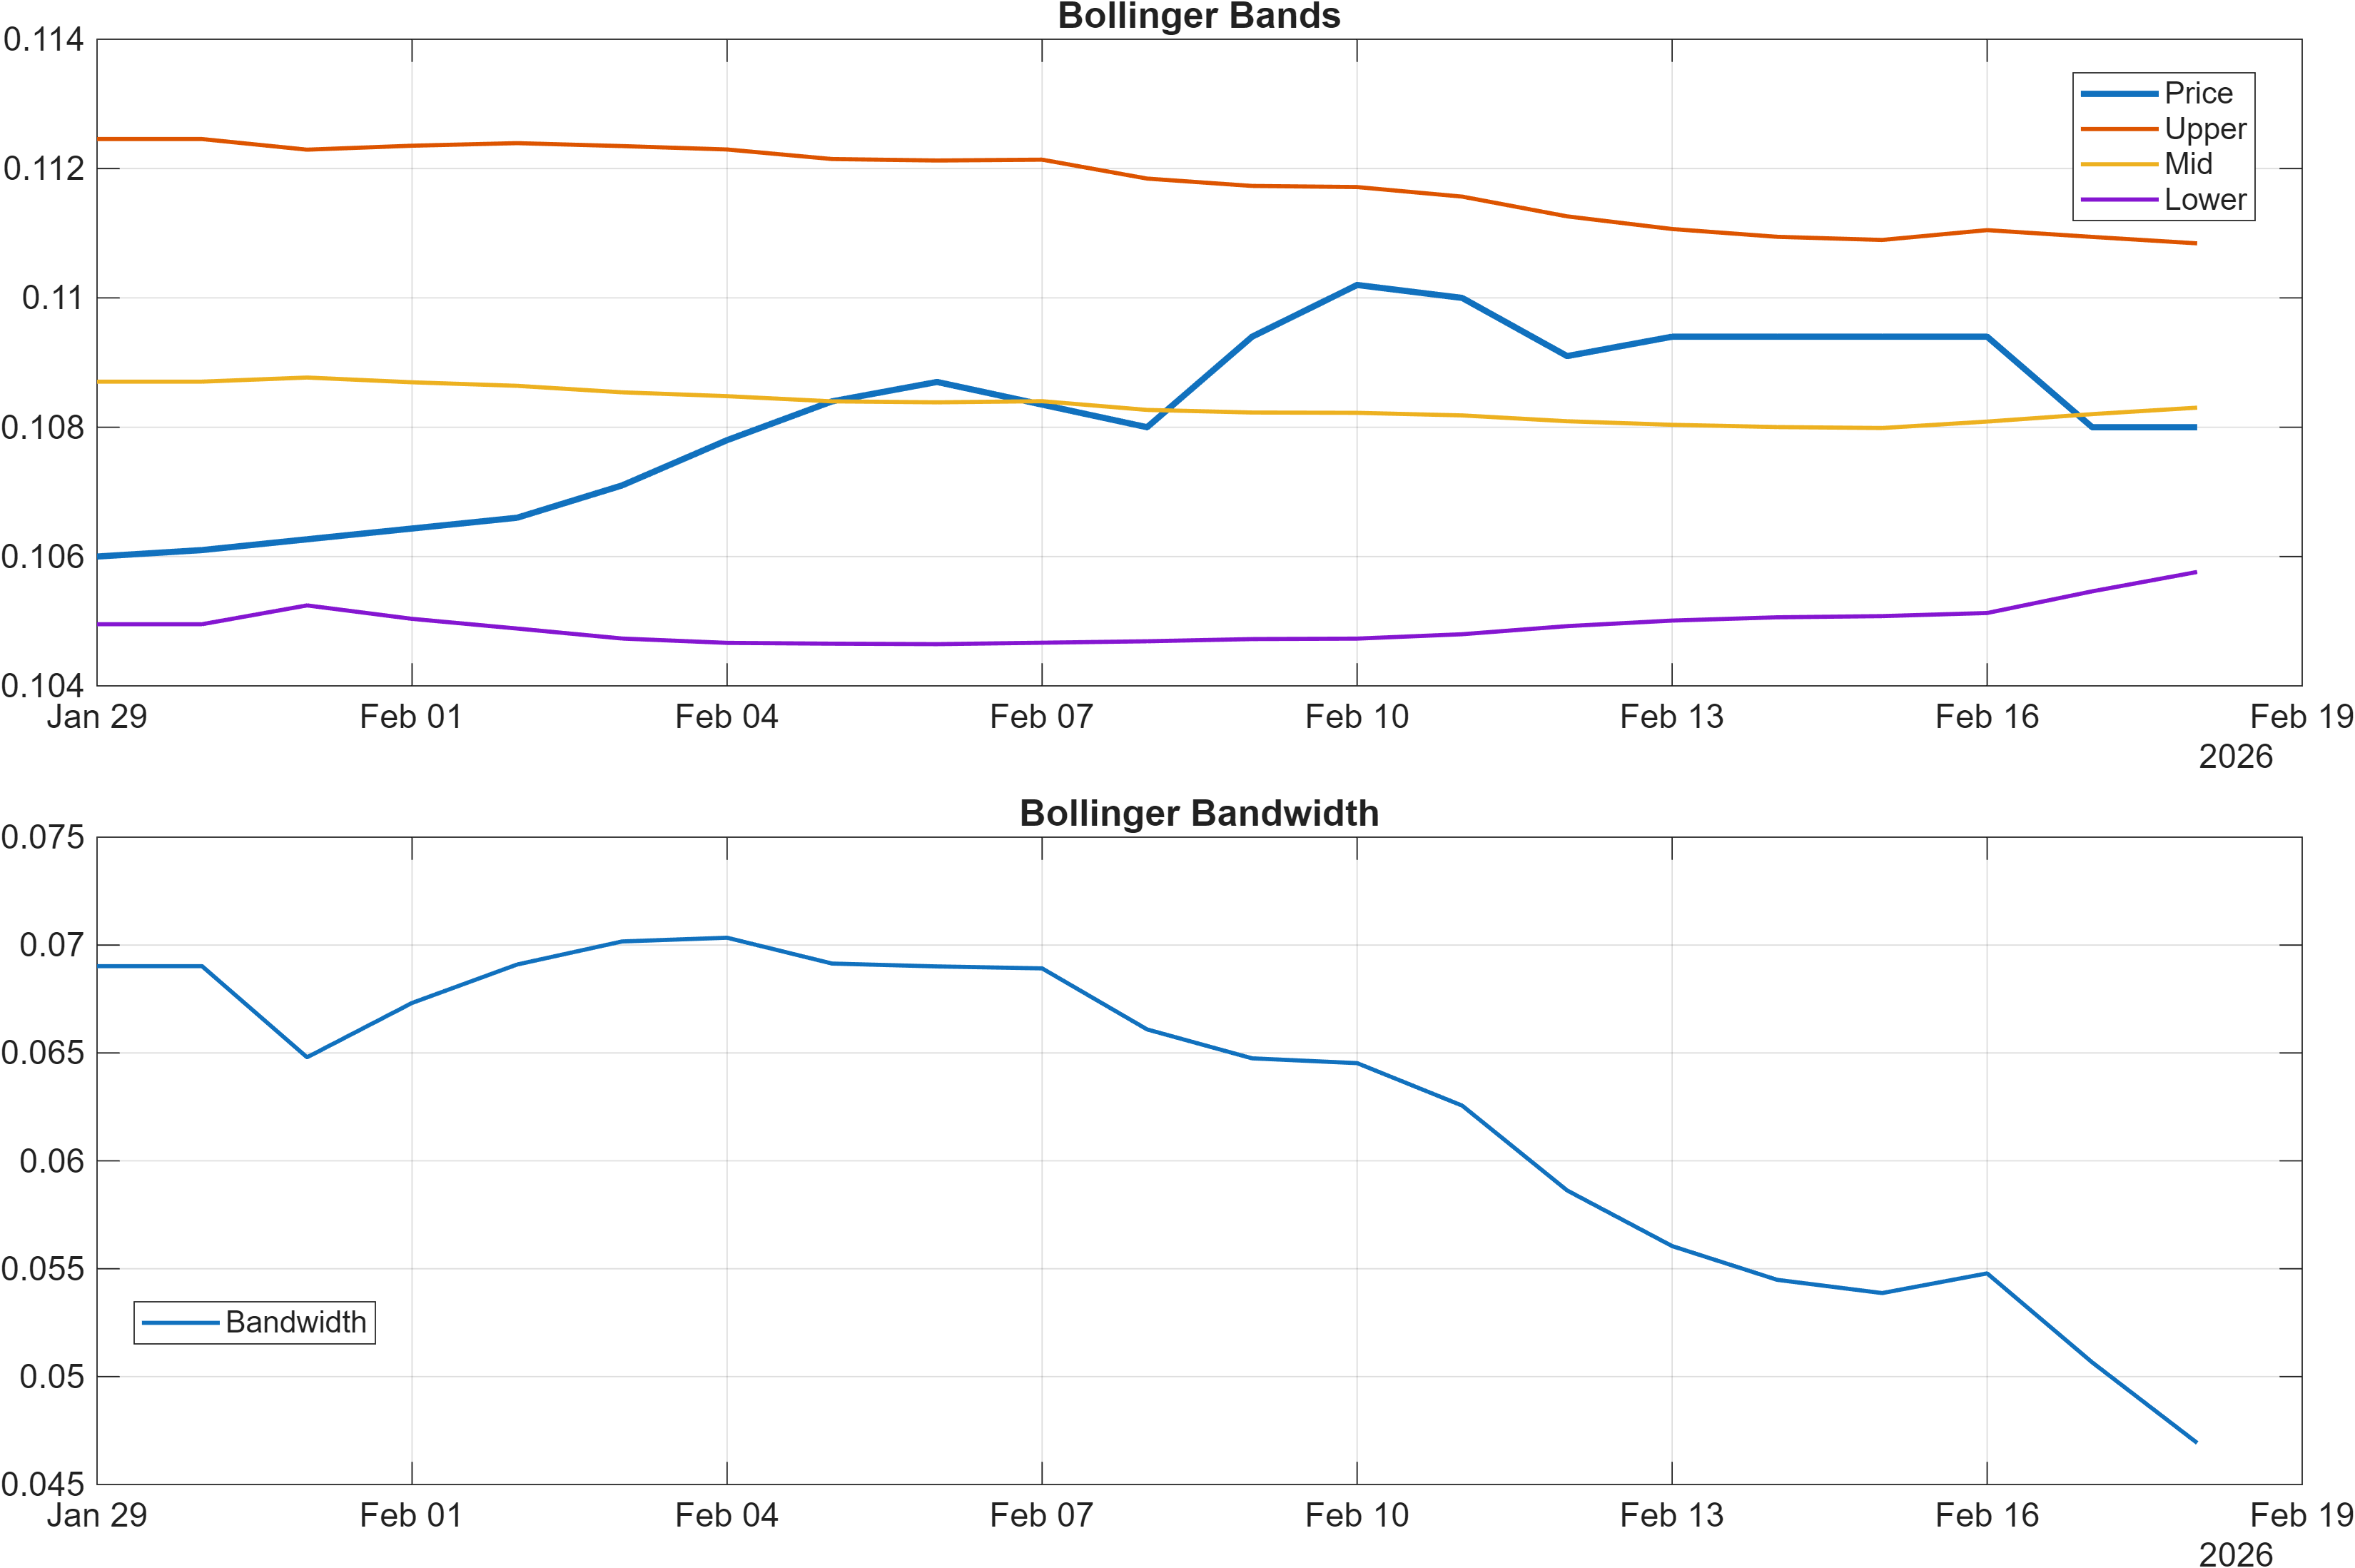
Interpretation: Bandwidth (volatility regime) latest = 0.0469.
Momentum is currently not confirming strong directional continuation. RSI is explicitly characterized as Neutral, which aligns with the more granular reading later where RSI(14) is 51.52—close to a midpoint regime rather than overbought/oversold behavior. By contrast, MACD is slightly negative (histogram -0.0001), implying mild downside pressure but not a decisive momentum breakdown.
Volatility conditions reinforce the “balanced” interpretation. Bollinger bandwidth at 0.0469 indicates a relatively contained regime, which often corresponds to tighter mean-reversion dynamics and a higher dependence on nearby levels for signal confirmation. In these environments, small momentum shifts (such as a marginally negative MACD histogram) can oscillate without producing durable trends unless price clears a defined boundary.
The implication for ARSJPY is that the momentum/volatility layer is more consistent with the platform’s neutral blended technical posture (overall technical score 0.106) than with the strongly bearish ranks (e.g., #938 Daily). If volatility remains compressed, attention typically shifts to whether subsequent candles build acceptance above resistance (0.1104) or whether downside pressure expands and forces a close below support (0.1060), which would likely move the momentum stack away from neutral.
4) Support / Resistance zones
Support ~ 0.1060 | Resistance ~ 0.1104
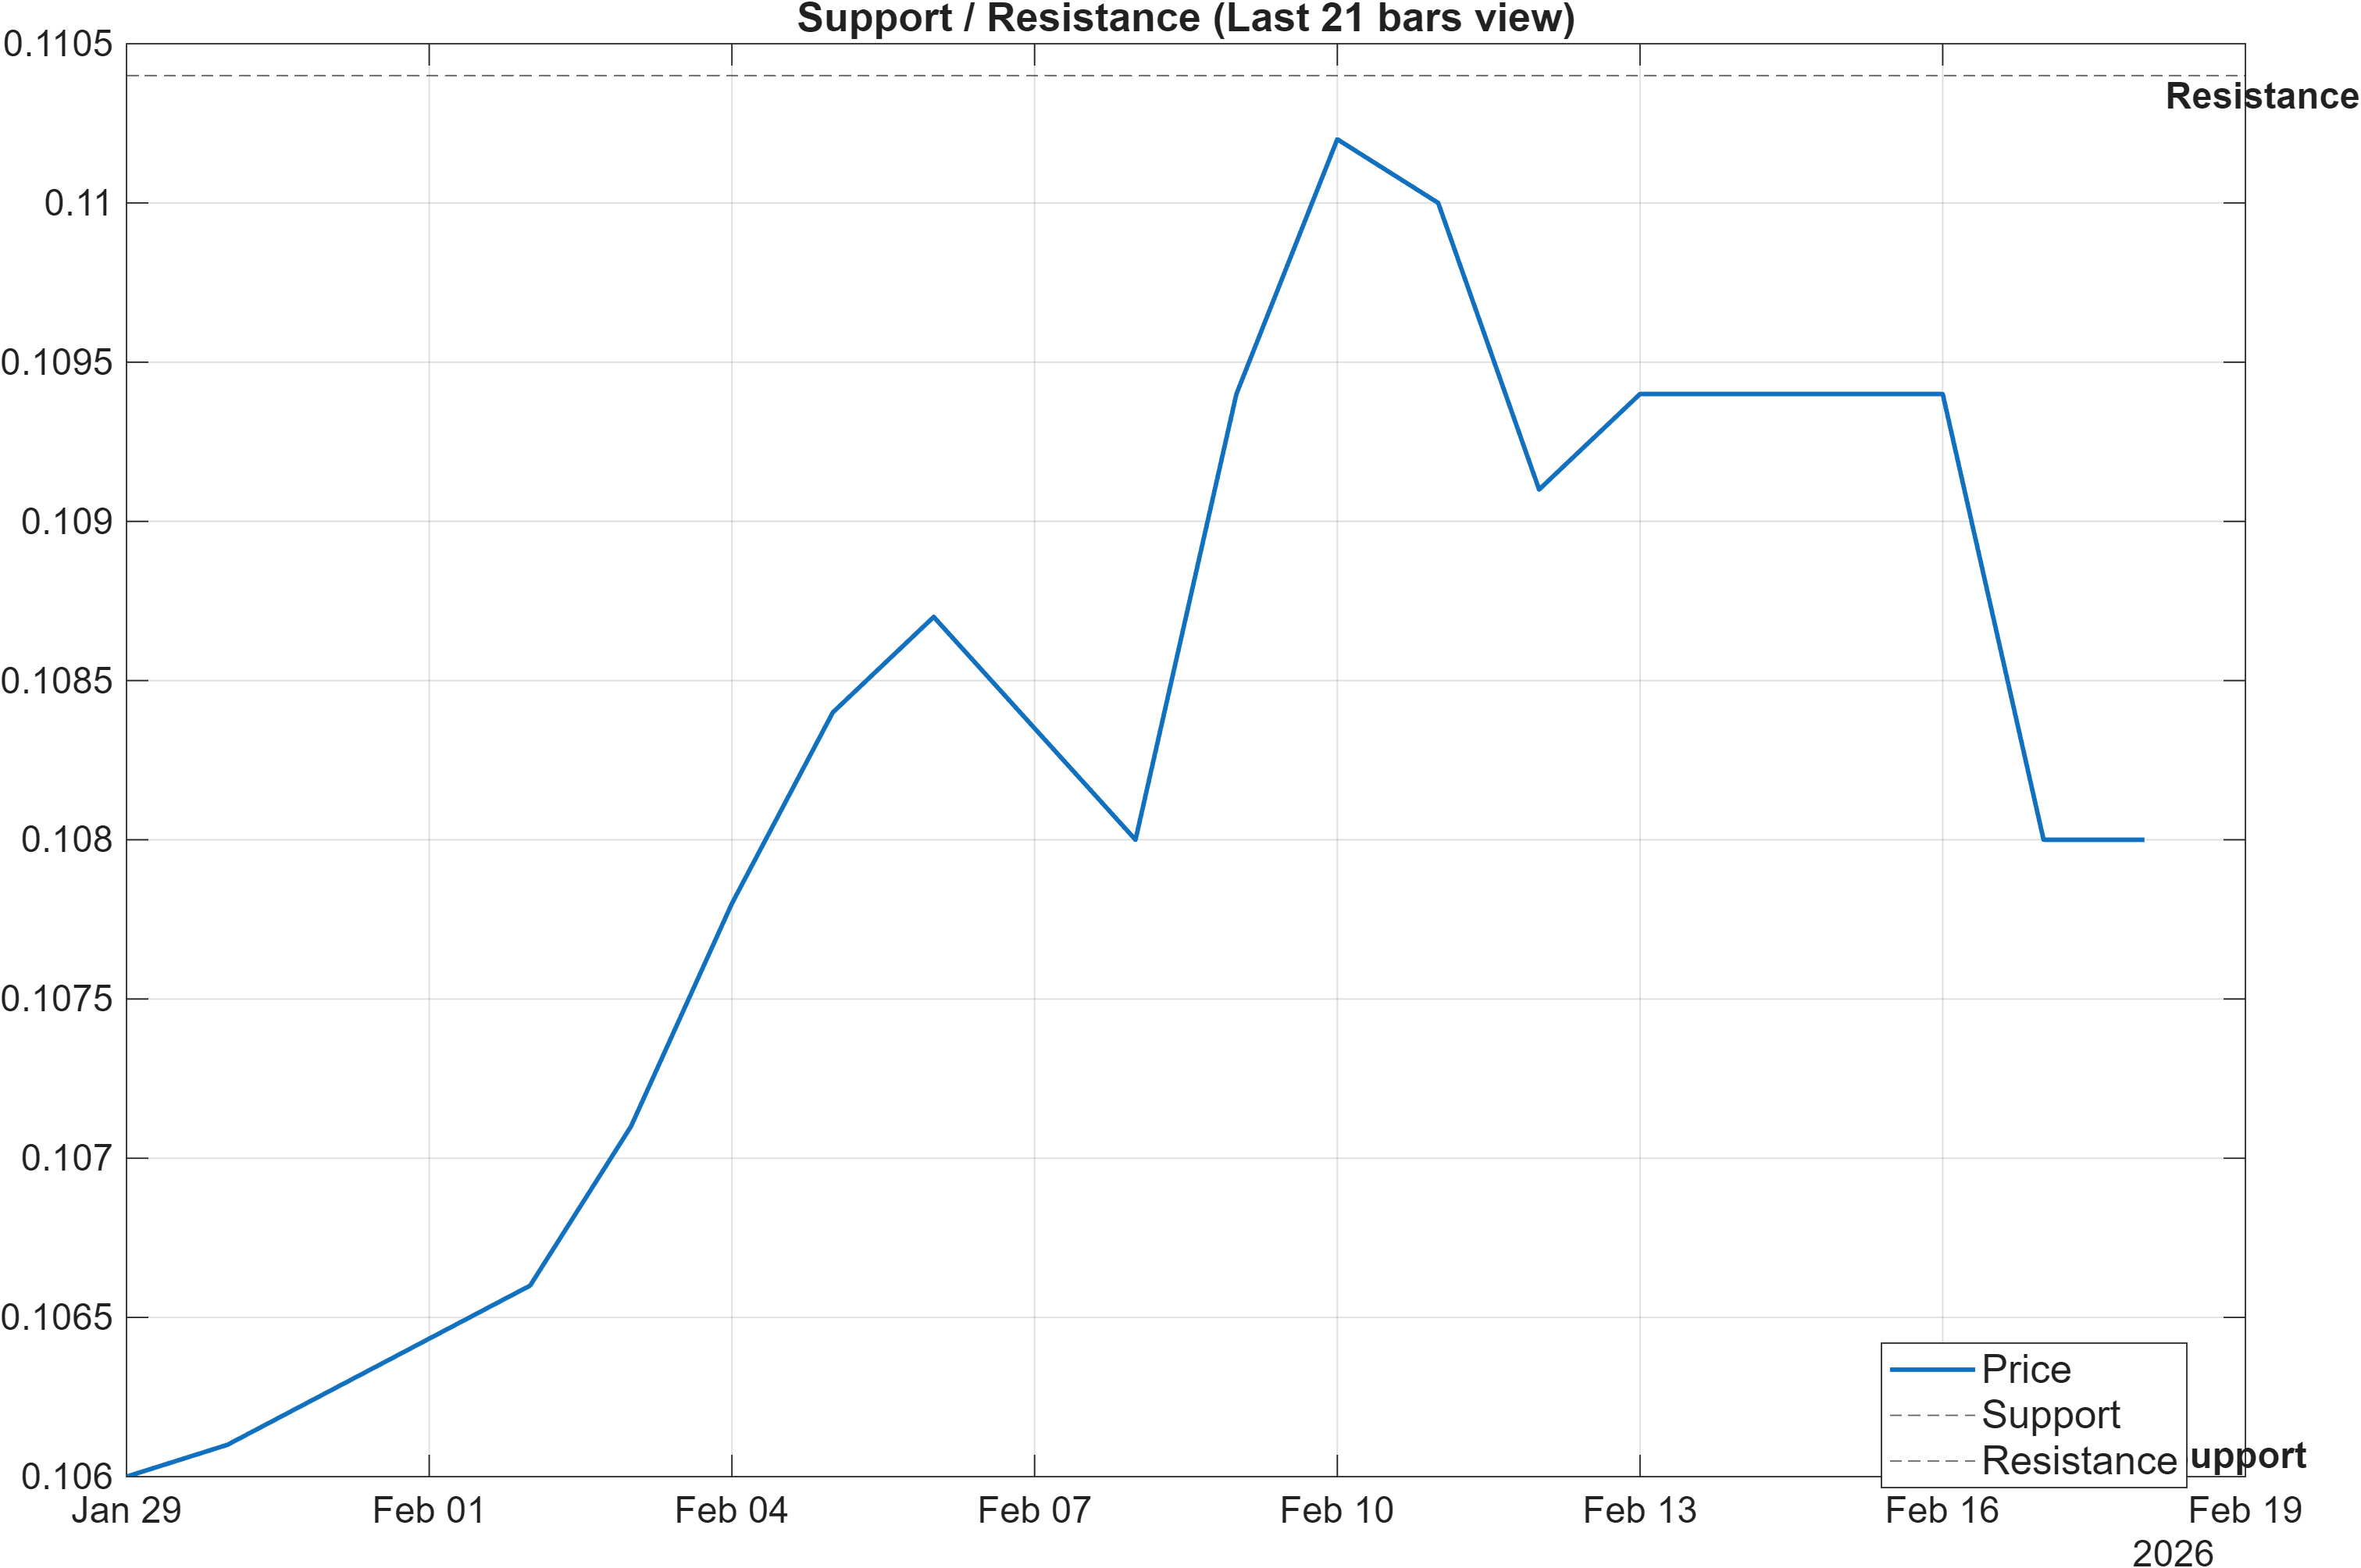
Scenario view: Break above resistance with volume → continuation. Close below support → signal deterioration risk.
ARSJPY is framed by a compact trading corridor that cleanly anchors the rest of the dashboard. The support zone near 0.1060 corresponds to the short-window low reference later captured as LLOW(20) = 0.106, while resistance near 0.1104 sits alongside the upper boundary behavior reflected by HHIGH(20) = 0.1103. With volatility measured as moderate/contained (bandwidth 0.0469), these boundaries are likely to behave as primary decision points.
A constructive read requires more than intraday probing: a break above 0.1104 that is sustained would better align with the longer moving-average configuration (MA50 above MA200) and reduce the probability that the bearish rank regime dominates near-term behavior. Conversely, a close below 0.1060 would be consistent with the “close vs MA50 bearish” condition and could convert the currently neutral momentum stack into broader deterioration, particularly if MACD’s slightly negative tone (-0.0001) expands.
Given the platform’s mixed stack—bearish ranks but neutral confluence—this section carries disproportionate weight: ARSJPY does not need a large move to clarify direction; it needs acceptance beyond the boundary. Until that happens, mean reversion and false breaks become more plausible outcomes than clean trend extension.
5) Quant Technical Dashboard (18 Signals)
KGNAI AI Technical Analysis Score (Deep Reinforcement Learning): Rank #620 out of 958 (Rank 1 represents the strongest technical positioning and a higher probability of favorable price behavior. As ranks increase toward the maximum, the probability of favorable outcomes weakens and bearish positioning becomes more dominant.) | Label: Neutral | Score: -0.294
18-Signal Technical Confluence Score: 0.278 (Neutral)
Overall Technical Score (18-signal confluence + DRL rank blend): 0.106 (Neutral)
Note: The blended score reflects signal strength weighted against broader AI technical ranking, which may temporarily diverge.
Blended technical score breakdown: 0.106 (Neutral | Bull 6 / Bear 1 / Neutral 11)
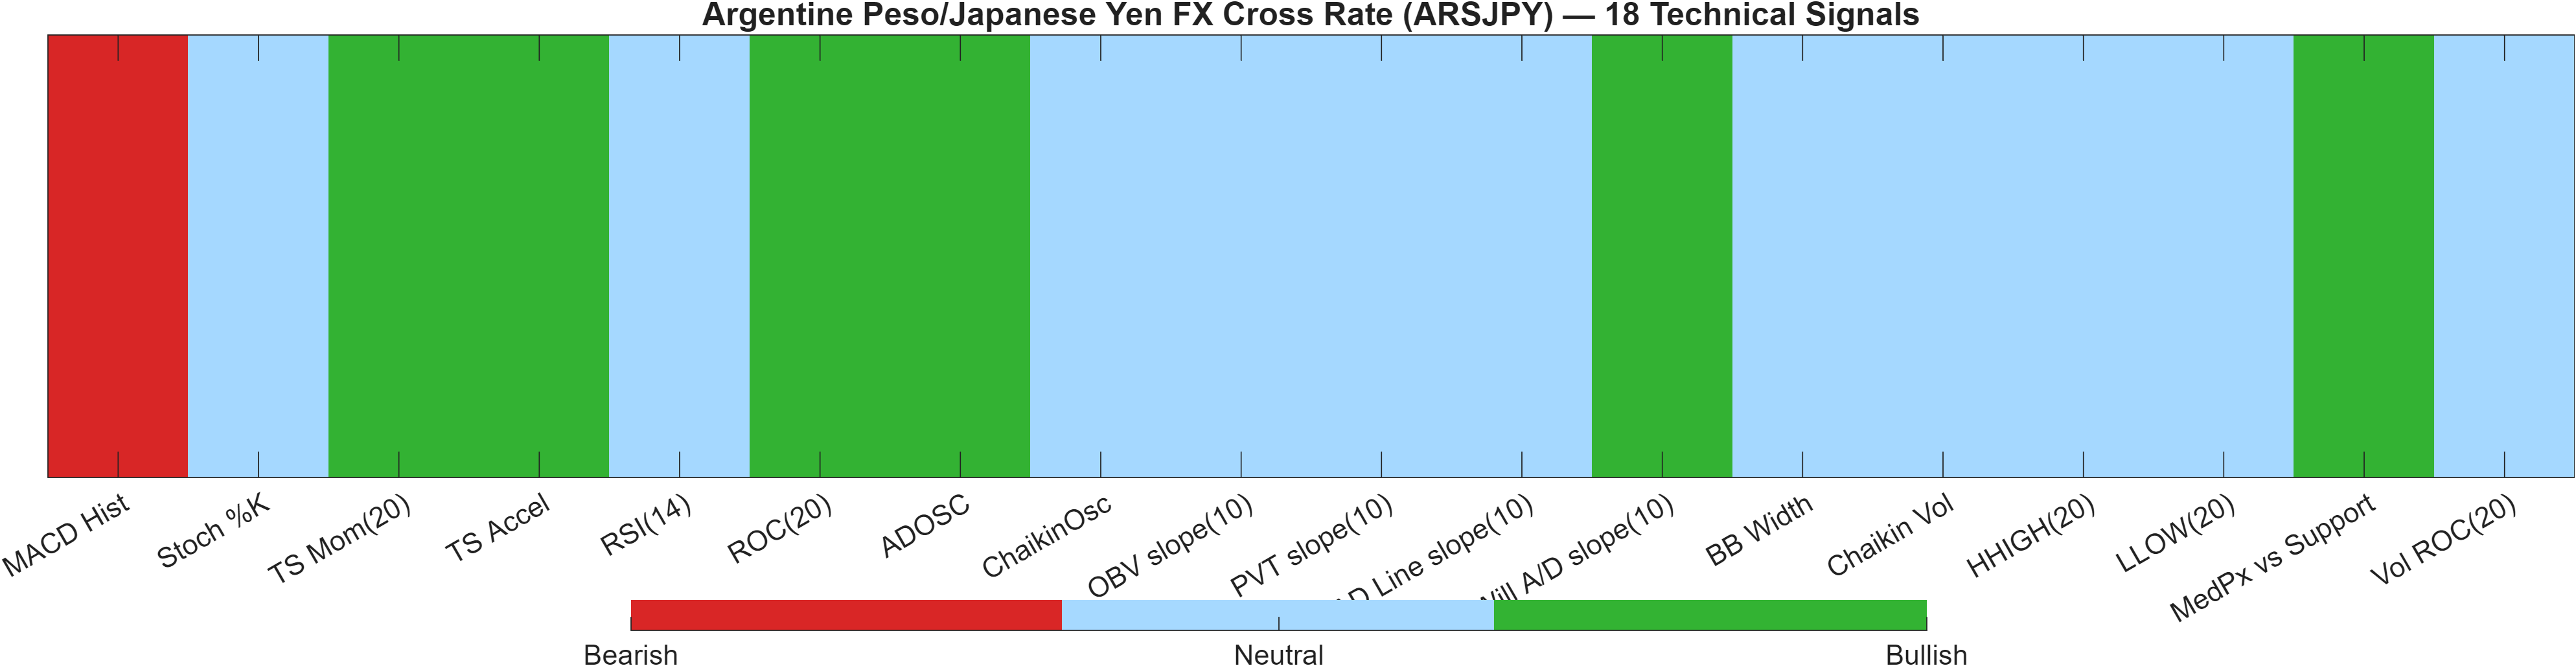
The technical layer is best described as neutral with selective bullish undercurrents. Despite the DRL technical rank sitting at #620 out of 958 (Neutral label; score -0.294), the rule-based confluence leans toward balance rather than trend breakdown: 0.278 on the 18-signal score and a blended 0.106 overall, with 11 neutral signals dominating the stack.
This composition matters. A dashboard with only 1 bearish signal can still coexist with bearish cross-universe ranks (Daily #938), particularly when price is below a shorter moving average and momentum is soft. But the presence of multiple constructive readings—such as TS Mom(20) = 0.0019, ROC(20) = 1.791, and an explicitly bullish accumulation/distribution signal (ADOSC = 100)—argues that selling pressure is not broadly confirmed across the indicator set.
The more cautious elements remain visible: MACD Hist is bearish at -6.444e-05, and many participation proxies are flat (several slopes listed as 0), which can be consistent with a market that is pausing rather than building directional sponsorship. With BB Width = 0.04693 categorized as neutral, the evidence supports a regime where the next move likely requires a level break rather than incremental indicator drift.
Signal table (Bull/Bear/Neutral)
| Indicator | Value | Signal |
|---|---|---|
| MACD Hist | -6.444e-05 | Bearish |
| Stoch %K | 30.3 | Neutral |
| TS Mom(20) | 0.0019 | Bullish |
| TS Accel | 0.0008 | Bullish |
| RSI(14) | 51.52 | Neutral |
| ROC(20) | 1.791 | Bullish |
| ADOSC | 100 | Bullish |
| ChaikinOsc | 0 | Neutral |
| OBV slope(10) | 0 | Neutral |
| PVT slope(10) | 0 | Neutral |
| AD Line slope(10) | 0 | Neutral |
| Will A/D slope(10) | 0.0004 | Bullish |
| BB Width | 0.04693 | Neutral |
| Chaikin Vol | -7.146 | Neutral |
| HHIGH(20) | 0.1103 | Neutral |
| LLOW(20) | 0.106 | Neutral |
| MedPx vs Support | 0.0015 | Bullish |
| Vol ROC(20) | — | Neutral |
Interpretation: Indicator-level signals form the base confluence, which is then adjusted using a separate AI-driven technical ranking model. The final technical score summarizes this combined view.
6) News sentiment + extractive gist
Note: Instrument-specific news matches were not found, so the digest includes broader market/sector headlines. Links are provided for verification.
Sentiment score (avg): 0.052 | Positive: 19% | Neutral: 63% | Negative: 19%
KGNAI AI News Sentiment Score (normalized -1 to +1): -0.87 (as of 2025-07-13) | Label: Bearish | Overall news score: -0.87
Positive Developments
Recent coverage across major financial outlets indicates pockets of constructive macro tone centered on growth resilience and policy optionality. Commentary pointing to China meeting 5.0% GDP growth in 2025, alongside discussion about a potential shift toward more proactive domestic-demand support in 2026, contributes to a risk-stabilizing narrative for global cyclical expectations. In parallel, updates around Japan’s external sector have been framed as relatively firm, with exports described as notably strong versus recent history, and broader alignment themes in cross-border investment discussions. For FX markets, this mix can reduce one-way positioning and encourage range behavior—consistent with ARSJPY’s technical “neutral” stack (overall technical score 0.106) and midline momentum posture (e.g., RSI characterized as neutral). The positive stream is not instrument-specific, but it can still shape broader JPY and EM-FX sensitivity through rates and global growth expectations.
Neutral / Mixed Developments
The neutral set is dominated by event-driven macro framing: monetary policy communications, upcoming data releases, and debates about AI’s longer-run influence on inflation and volatility. Market attention remains oriented around central-bank signaling and the balance between rate expectations and risk appetite, with some narratives emphasizing uncertainty rather than direction. This backdrop tends to raise the importance of technical decision zones over macro conviction, particularly when volatility is contained (Bollinger bandwidth 0.0469). For ARSJPY, that “wait for confirmation” condition is already evident in the proximity of defined levels (support 0.1060, resistance 0.1104) and the indicator mix that is heavily neutral (11 of 18 signals). In short, the news flow does not provide a clean directional catalyst in the provided data.
Negative / Risk Signals
Risk coverage in the provided digest emphasizes geopolitical escalation scenarios and their potential spillovers into energy prices and broader risk conditions. Even absent direct linkage to ARSJPY, these narratives can pressure liquidity-sensitive crosses and amplify JPY-safe-haven dynamics, especially if volatility regimes shift from compressed to expanding. Importantly, KGNAI’s normalized news sentiment score sits at -0.87 (Bearish), which is materially more negative than the simple distribution metrics (Positive 19%, Neutral 63%, Negative 19%). That divergence suggests the model is detecting a heavier-weighted risk tone in the text set, even though surface-level classification looks balanced. In a market already carrying bearish ranks (e.g., Daily #938), a risk-off impulse could be the incremental factor that turns a neutral technical stance into a more directional downside resolution.
- Whether price acceptance develops above 0.1104 or breaks down below 0.1060
- Whether MACD histogram negativity (-0.0001) expands or reverts toward zero
- Whether volatility remains contained (bandwidth 0.0469) or begins to widen
Sources referenced: Reuters, Bloomberg, Yahoo Finance, MarketWatch, Investing.com
Snapshot: AI Rank (Short–Mid–Long): Bearish (Bearish–Bearish–Bearish) · Technical Confluence: Neutral · Key Levels: Support ~0.11 | Resistance ~0.11 · News Sentiment: Neutral
7) Sources
- Fed: AI, rates and volatility – Rabobank — https://www.fxstreet.com/news/fed-ai-rates-and-volatility-rabobank-202602181153
- AUD/USD Price Forecast: Sees more upside above three-year high of around 0.7150 — https://www.fxstreet.com/news/aud-usd-price-forecast-sees-more-upside-above-three-year-high-of-around-07150-202602181140
- EUR/USD: Range trading on Lagarde talk – ING — https://www.fxstreet.com/news/eur-usd-range-trading-on-lagarde-talk-ing-202602181132
- Gold steadies as easing geopolitical tensions and firm US Dollar cap gains — https://www.fxstreet.com/news/gold-steadies-as-easing-geopolitical-tensions-and-firm-us-dollar-cap-gains-202602181128
- GBP/USD Price Forecast: Tests Symmetrical Triangle breakdown near 1.3580 — https://www.fxstreet.com/news/gbp-usd-price-forecast-tests-symmetrical-triangle-breakdown-near-13580-202602181110
- AUD: Labour strength supports RBA hike view – TD Securities — https://www.fxstreet.com/news/aud-labour-strength-supports-rba-hike-view-td-securities-202602181108
- NZD/USD returns above 0.6000 as post-RNBZ weakness eases — https://www.fxstreet.com/news/nzd-usd-returns-above-06000-as-post-rnbz-weakness-eases-202602181100
- Silver Price Forecast: XAG/USD rises further to near $76.30 ahead of FOMC minutes — https://www.fxstreet.com/news/silver-price-forecast-xag-usd-rises-further-to-near-7630-ahead-of-fomc-minutes-202602181032
You may also like: How KGNAI AI ranks instruments across global markets
Disclaimer: KGNAI provides AI-generated analytics and educational market commentary only. This is not financial advice. Markets involve risk. Always do your own research.