
BDT/JPY (BDTJPY) Technical Analysis — Neutral Multi-Signal Profile (20-Feb-2026)
BDT/JPY (BDTJPY) enters 20-Feb-2026 with a neutral technical posture when signals are combined across trend, momentum, and volatility. KGNAI’s cross-universe ranking is notably time-frame dependent: the weekly rank (#6 of 961) sits in the top decile, while the monthly rank (#916 of 961) resides near the bottom—an internal divergence that often reflects regime uncertainty rather than a clean directional edge. On the chart side, the trend read is split (Close vs MA50 bullish, MA50 vs MA200 bearish), while momentum is restrained with RSI(14) at 46.79 and a modestly positive MACD histogram (0.0005249). Volatility remains contained with Bollinger bandwidth near 0.0498, keeping the focus on well-defined decision zones: support ~1.2363 and resistance ~1.2824. News sentiment is slightly positive-leaning but overall neutral in mix.
- Rank stance: Short-term Bullish | Mid-term Bearish | Long-term Neutral
- Technical confluence: Neutral (18-signal confluence 0.222; overall technical score 0.155)
- Key levels: Support ~1.2363 | Resistance ~1.2824
- News sentiment bias: Neutral (avg 0.119; 37% positive / 50% neutral / 12% negative)
- Confirmation / invalidation: A break above 1.2824 supports continuation; a close below 1.2363 raises deterioration risk.
What KGNAI Measures
KGNAI evaluates instruments by relative positioning within a large ranked universe, emphasizing how signals behave across comparable markets rather than in isolation. Outputs prioritize signal alignment and the stability of multi-factor patterns that tend to repeat probabilistically across regimes. The result is a comparative framework designed for consistency across equities, forex, and digital assets.
How to Read This Report
- Ranks are comparative across the 961-instrument universe, not absolute forecasts.
- Confluence reflects agreement across multiple indicators (RSI, MACD, Bollinger Bands, and others).
- Support/resistance levels are decision zones where risk management often tightens.
- Sentiment provides contextual bias and can diverge from price/technicals.
1) KGNAI AI Analysis
Region: FOREX
Total universe size: 961 ranked instruments
- Daily rank: #111 out of 961 — Bullish
- Weekly rank: #6 out of 961 — Bullish
- Monthly rank: #916 out of 961 — Bearish
- 3-Monthly rank: #693 out of 961 — Neutral
- 6-Monthly rank: #711 out of 961 — Neutral
- Yearly rank: #595 out of 961 — Neutral
KGNAI ranks each instrument across large universes using multiple proprietary AI tests and statistical models (millions of data points). Lower ranks generally indicate stronger probability of favorable performance behavior, while higher ranks indicate weaker probability and more bearish positioning.
The current profile is time-horizon split. On the fast end, BDTJPY screens as constructive with a daily rank of #111 (upper quartile) and a weekly rank of #6 (top decile). That strength does not carry through the medium horizon: the monthly rank of #916 is near the bottom of the universe, a pattern commonly associated with an uneven trend structure or recent price recovery that has not repaired longer-window damage.
Longer horizons revert to a more balanced reading, with 3-month (#693), 6-month (#711), and yearly (#595) all labeled neutral. This combination often behaves like a market that can exhibit short bursts of relative strength while still lacking sustained multi-month follow-through. From a risk lens, the key is whether short-term leadership persists long enough to drag intermediate ranks higher, or whether the monthly weakness reasserts itself.
Term view: Short-term: Bullish. Mid-term: Bearish. Long-term: Neutral.
Want the full universe and complete rank tables? Unlock full access on KGNAI: https://www.kgnai.com/pricing
2) Price & trend overview
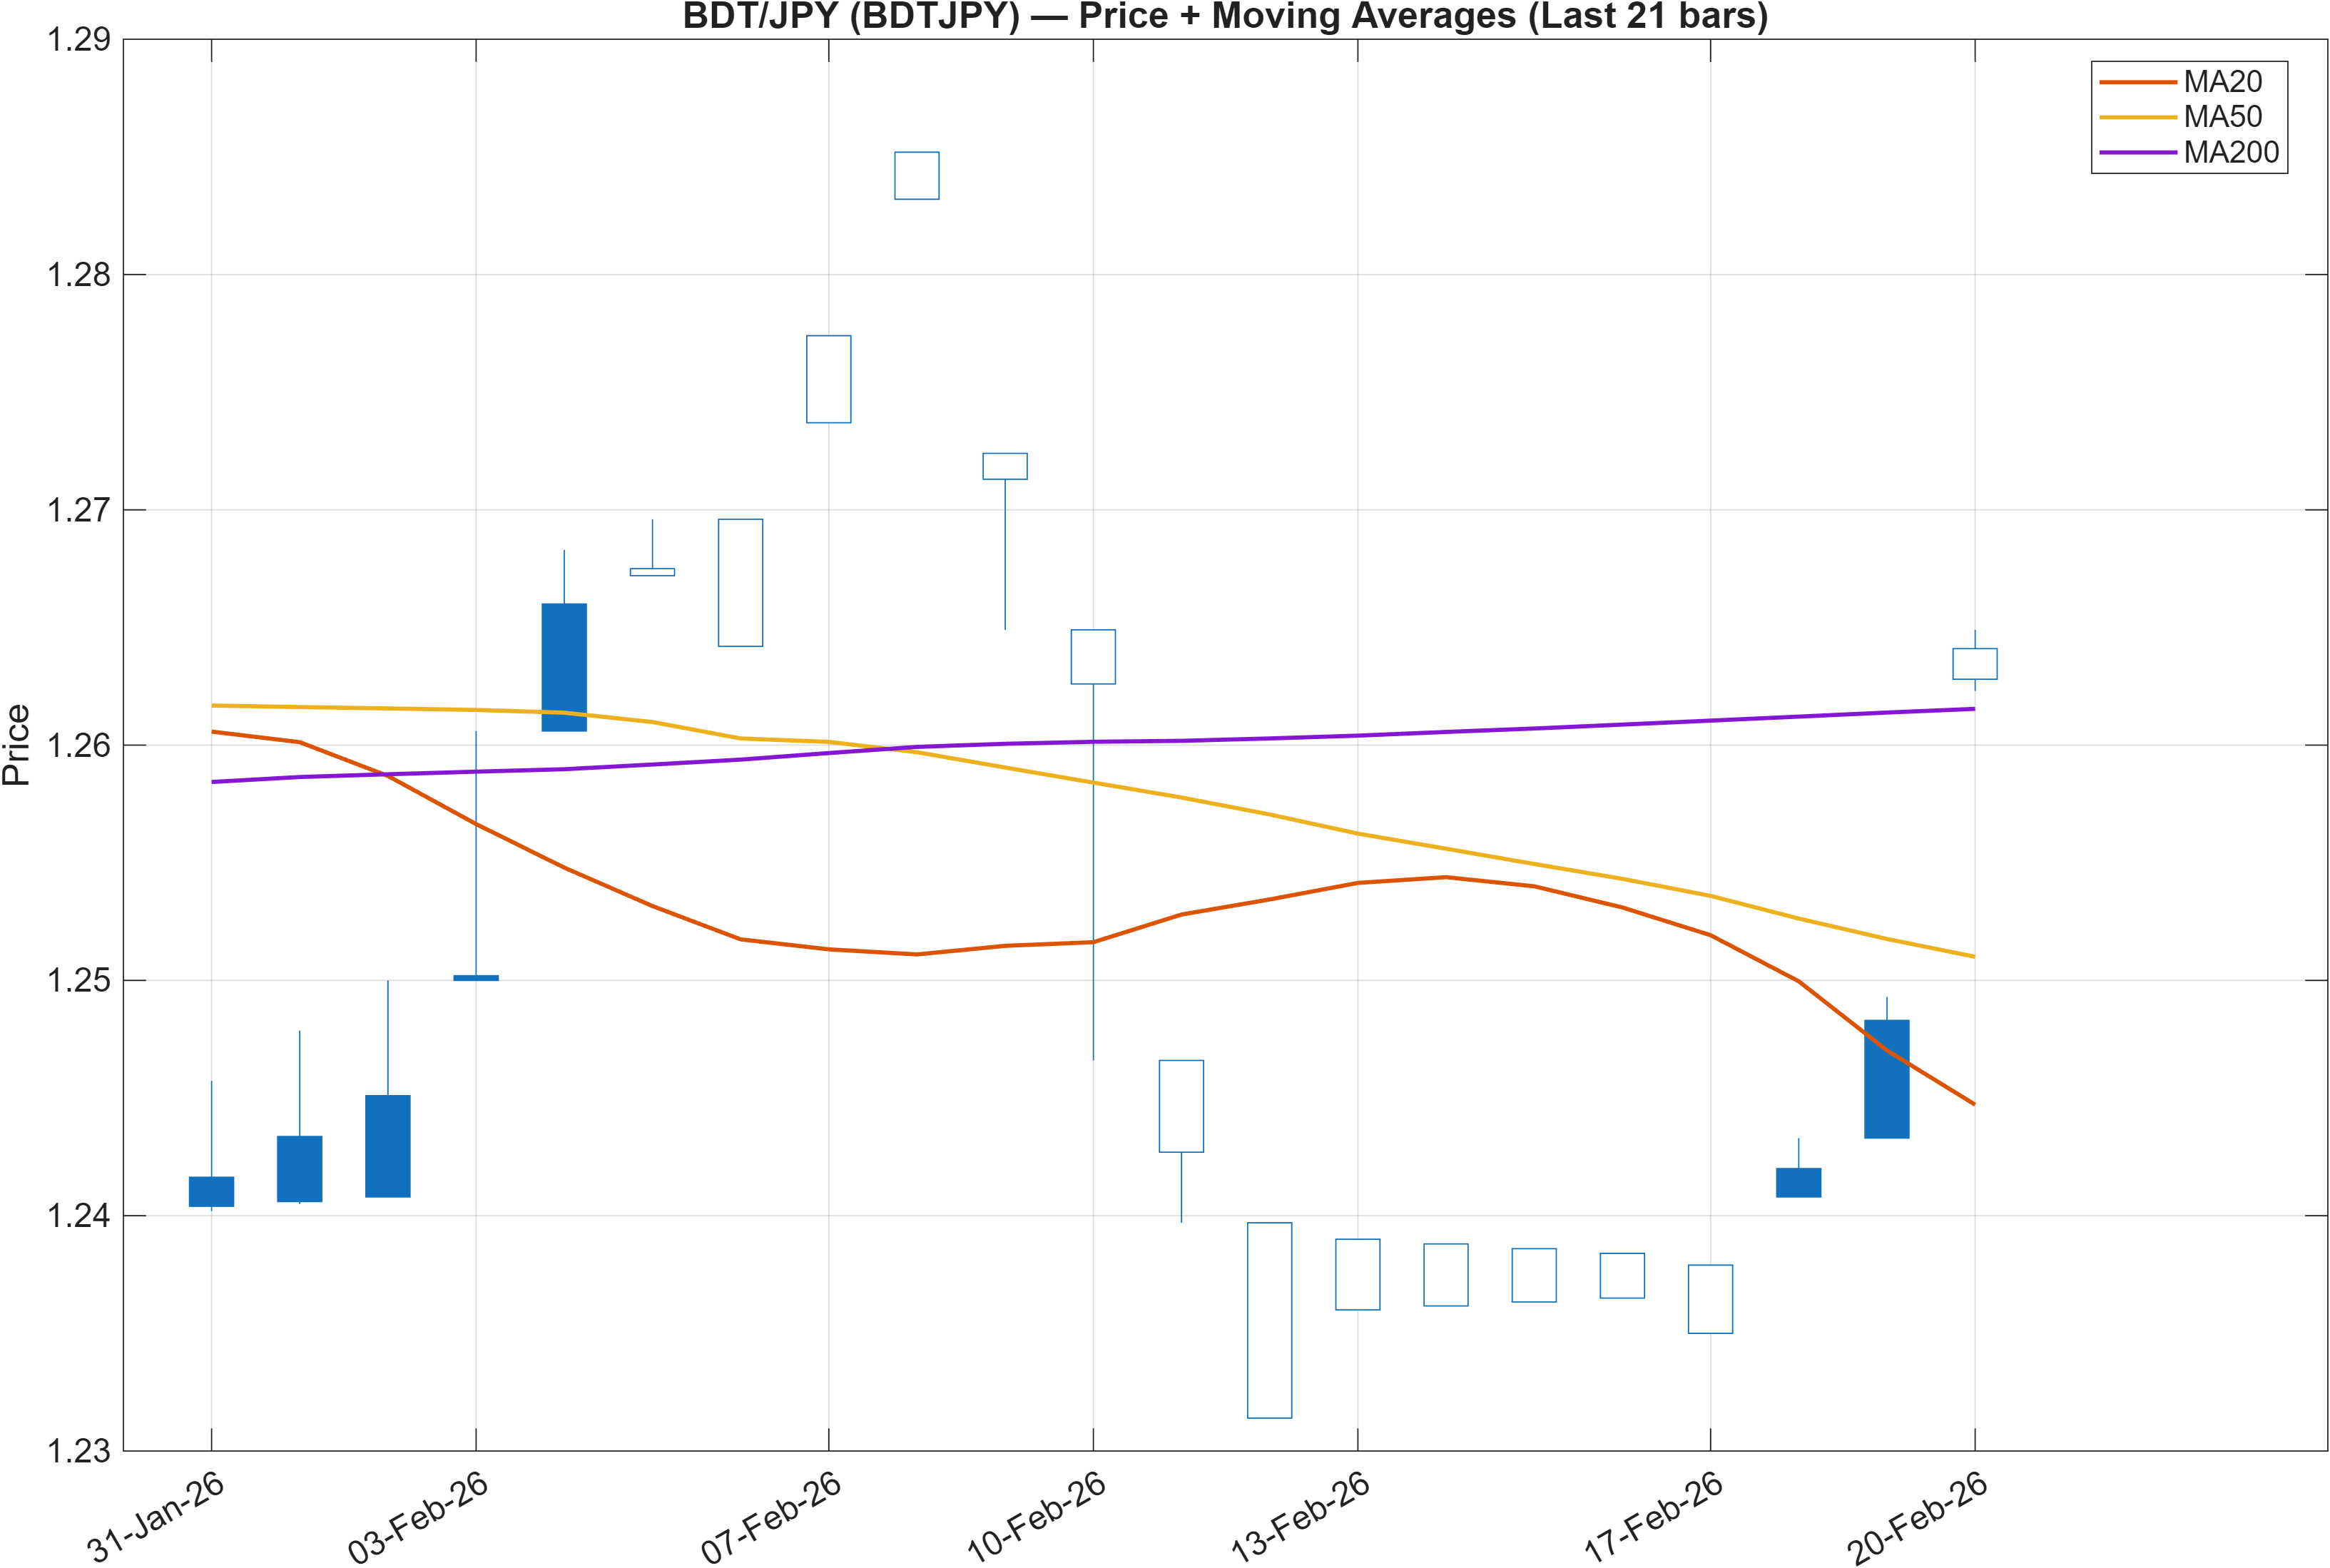
Interpretation: Close vs MA50 = Bullish, MA50 vs MA200 = Bearish.
Trend signals are non-uniform, matching the rank divergence. The price closing above the MA50 supports near-term stability and aligns with the daily #111 and weekly #6 standings. However, the MA50 below the MA200 keeps the broader structure cautious, consistent with the monthly #916 bearish positioning.
When fast trend improves while the slower trend remains negative, the typical analytical question is whether the move is a counter-trend rebound or the early phase of a regime repair. Without changing any inputs, the report already highlights the most actionable element: trend confirmation should be judged around the chart’s decision zones (see support/resistance) rather than by a single moving-average relationship.
The fact that the longer horizons are neutral rather than strongly bearish (yearly #595 and 3-month #693) suggests the pair may be spending more time in a range-to-transition state than in an uninterrupted downtrend. That interpretation is compatible with the contained volatility regime shown later (bandwidth 0.0498), where breakouts tend to matter more than incremental drift.
3) Momentum & volatility dashboard
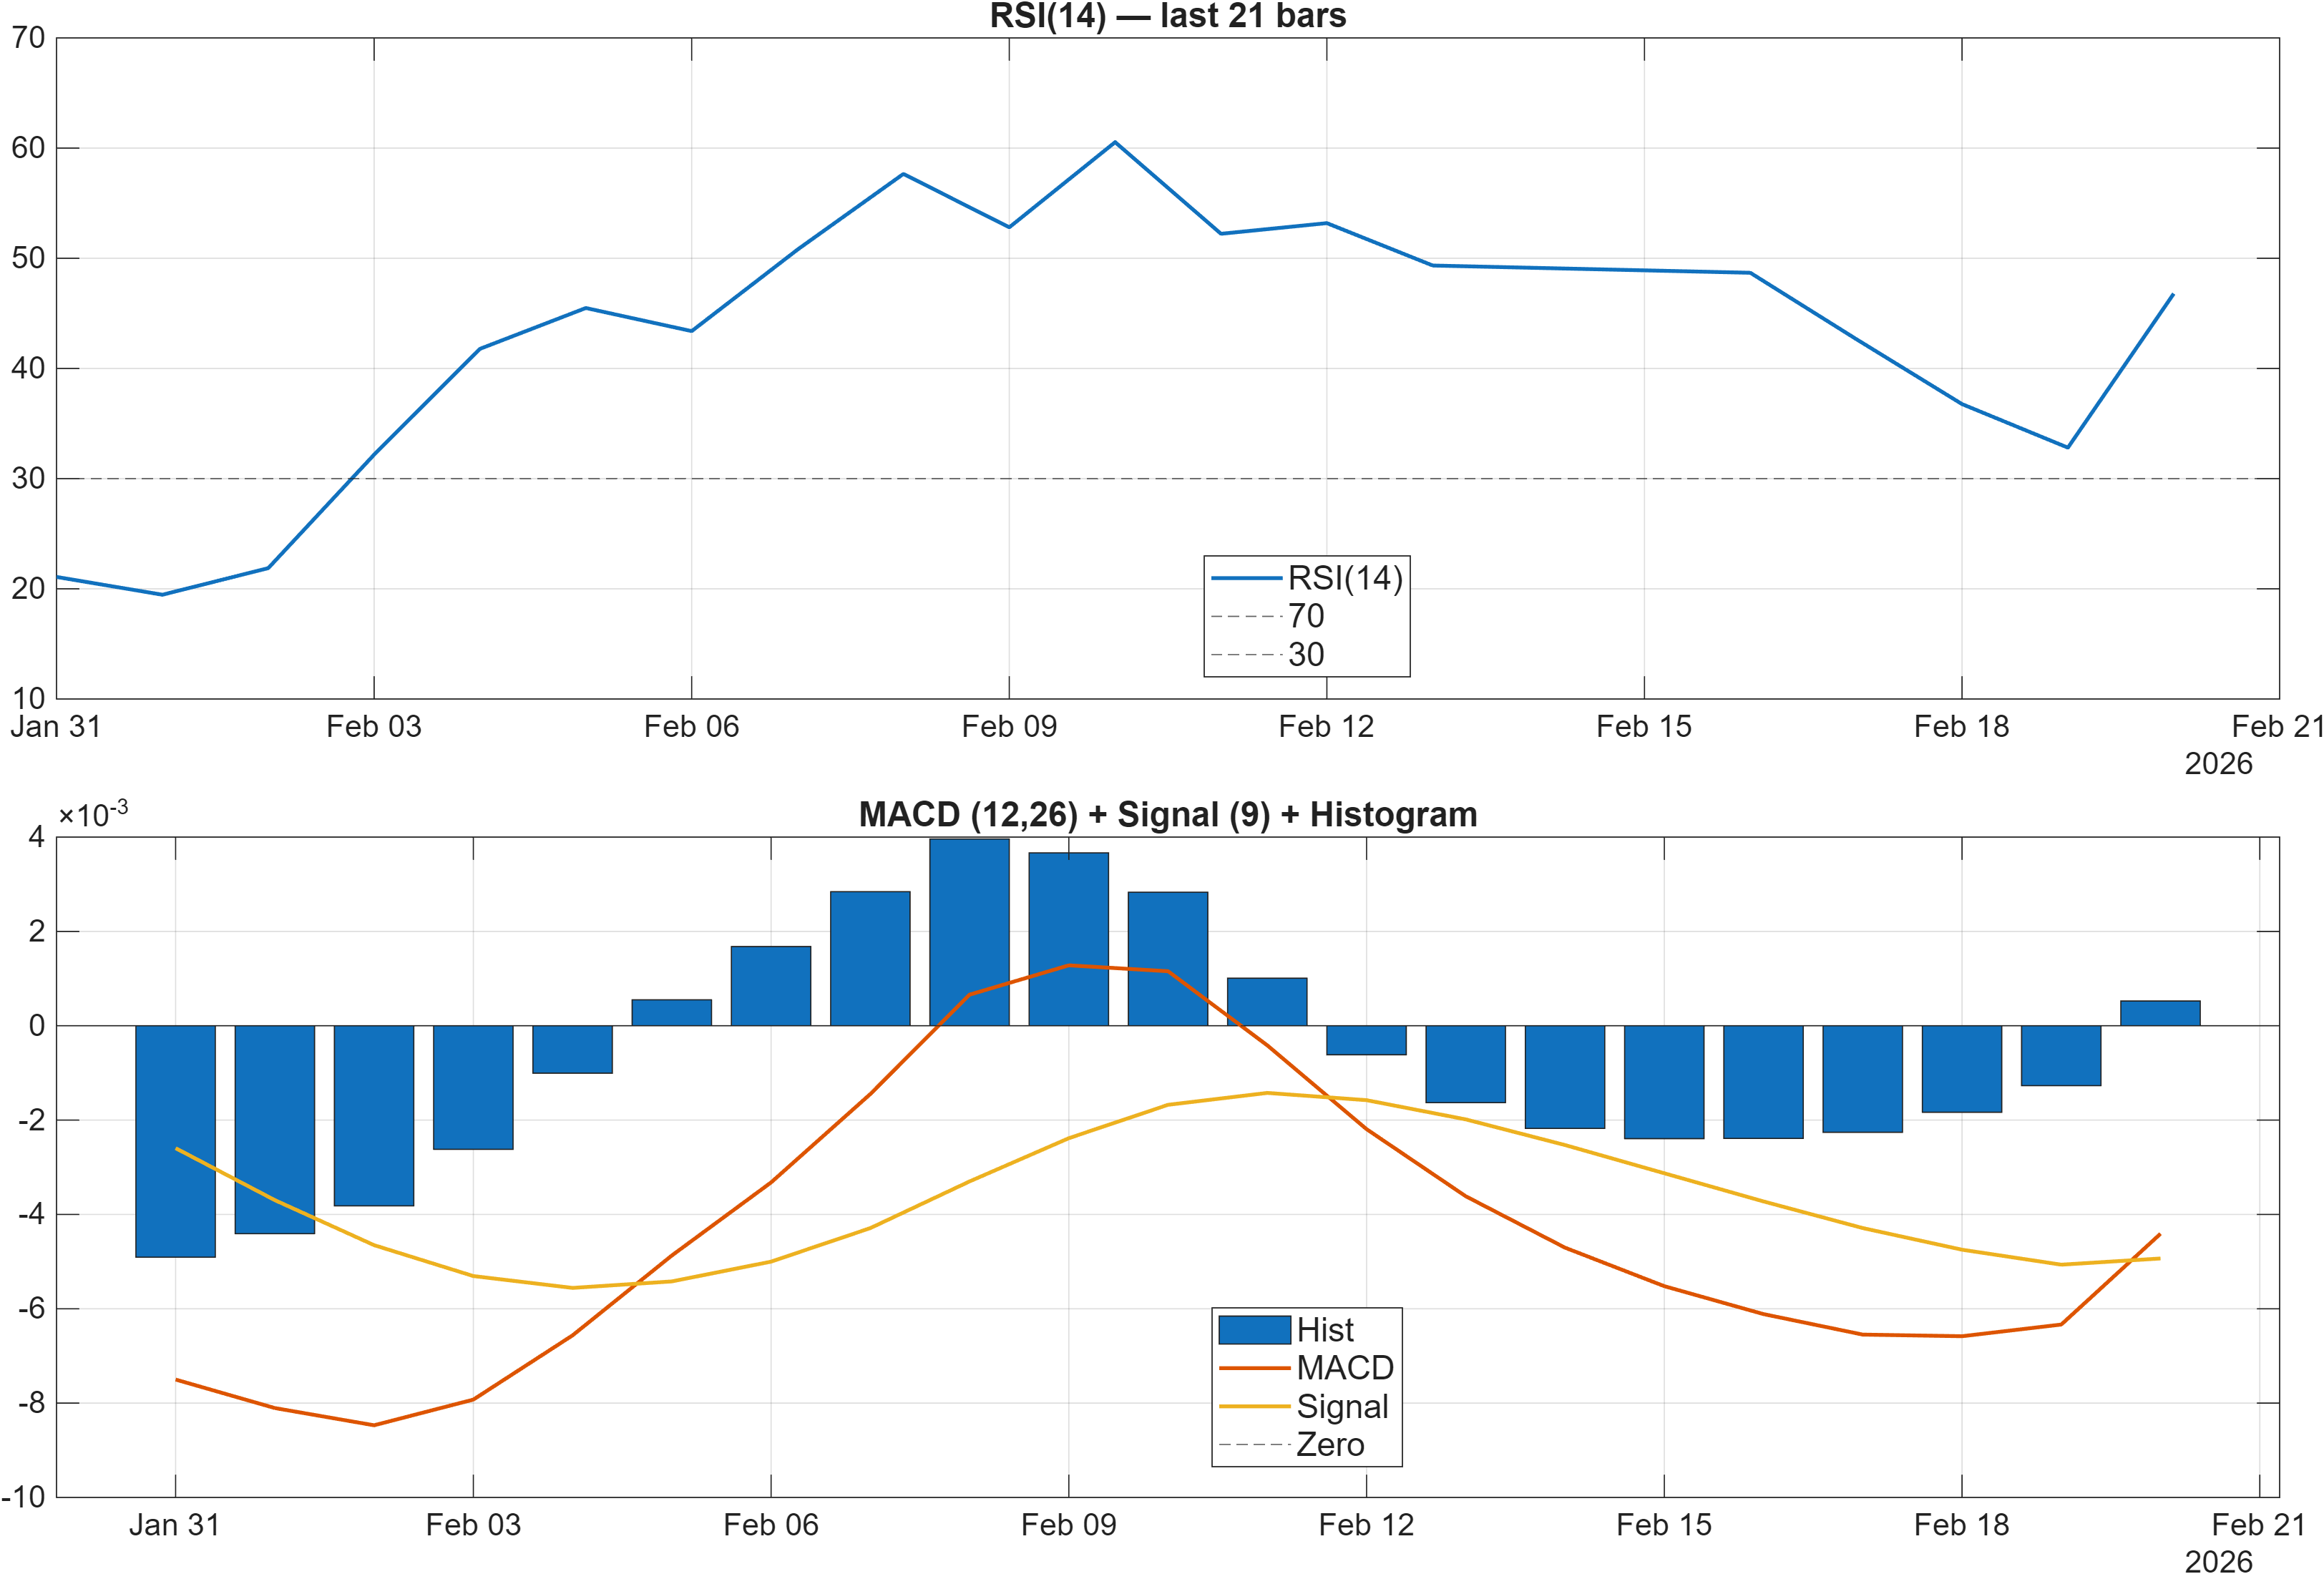
Interpretation: RSI bias = Neutral, MACD hist = 0.0005.
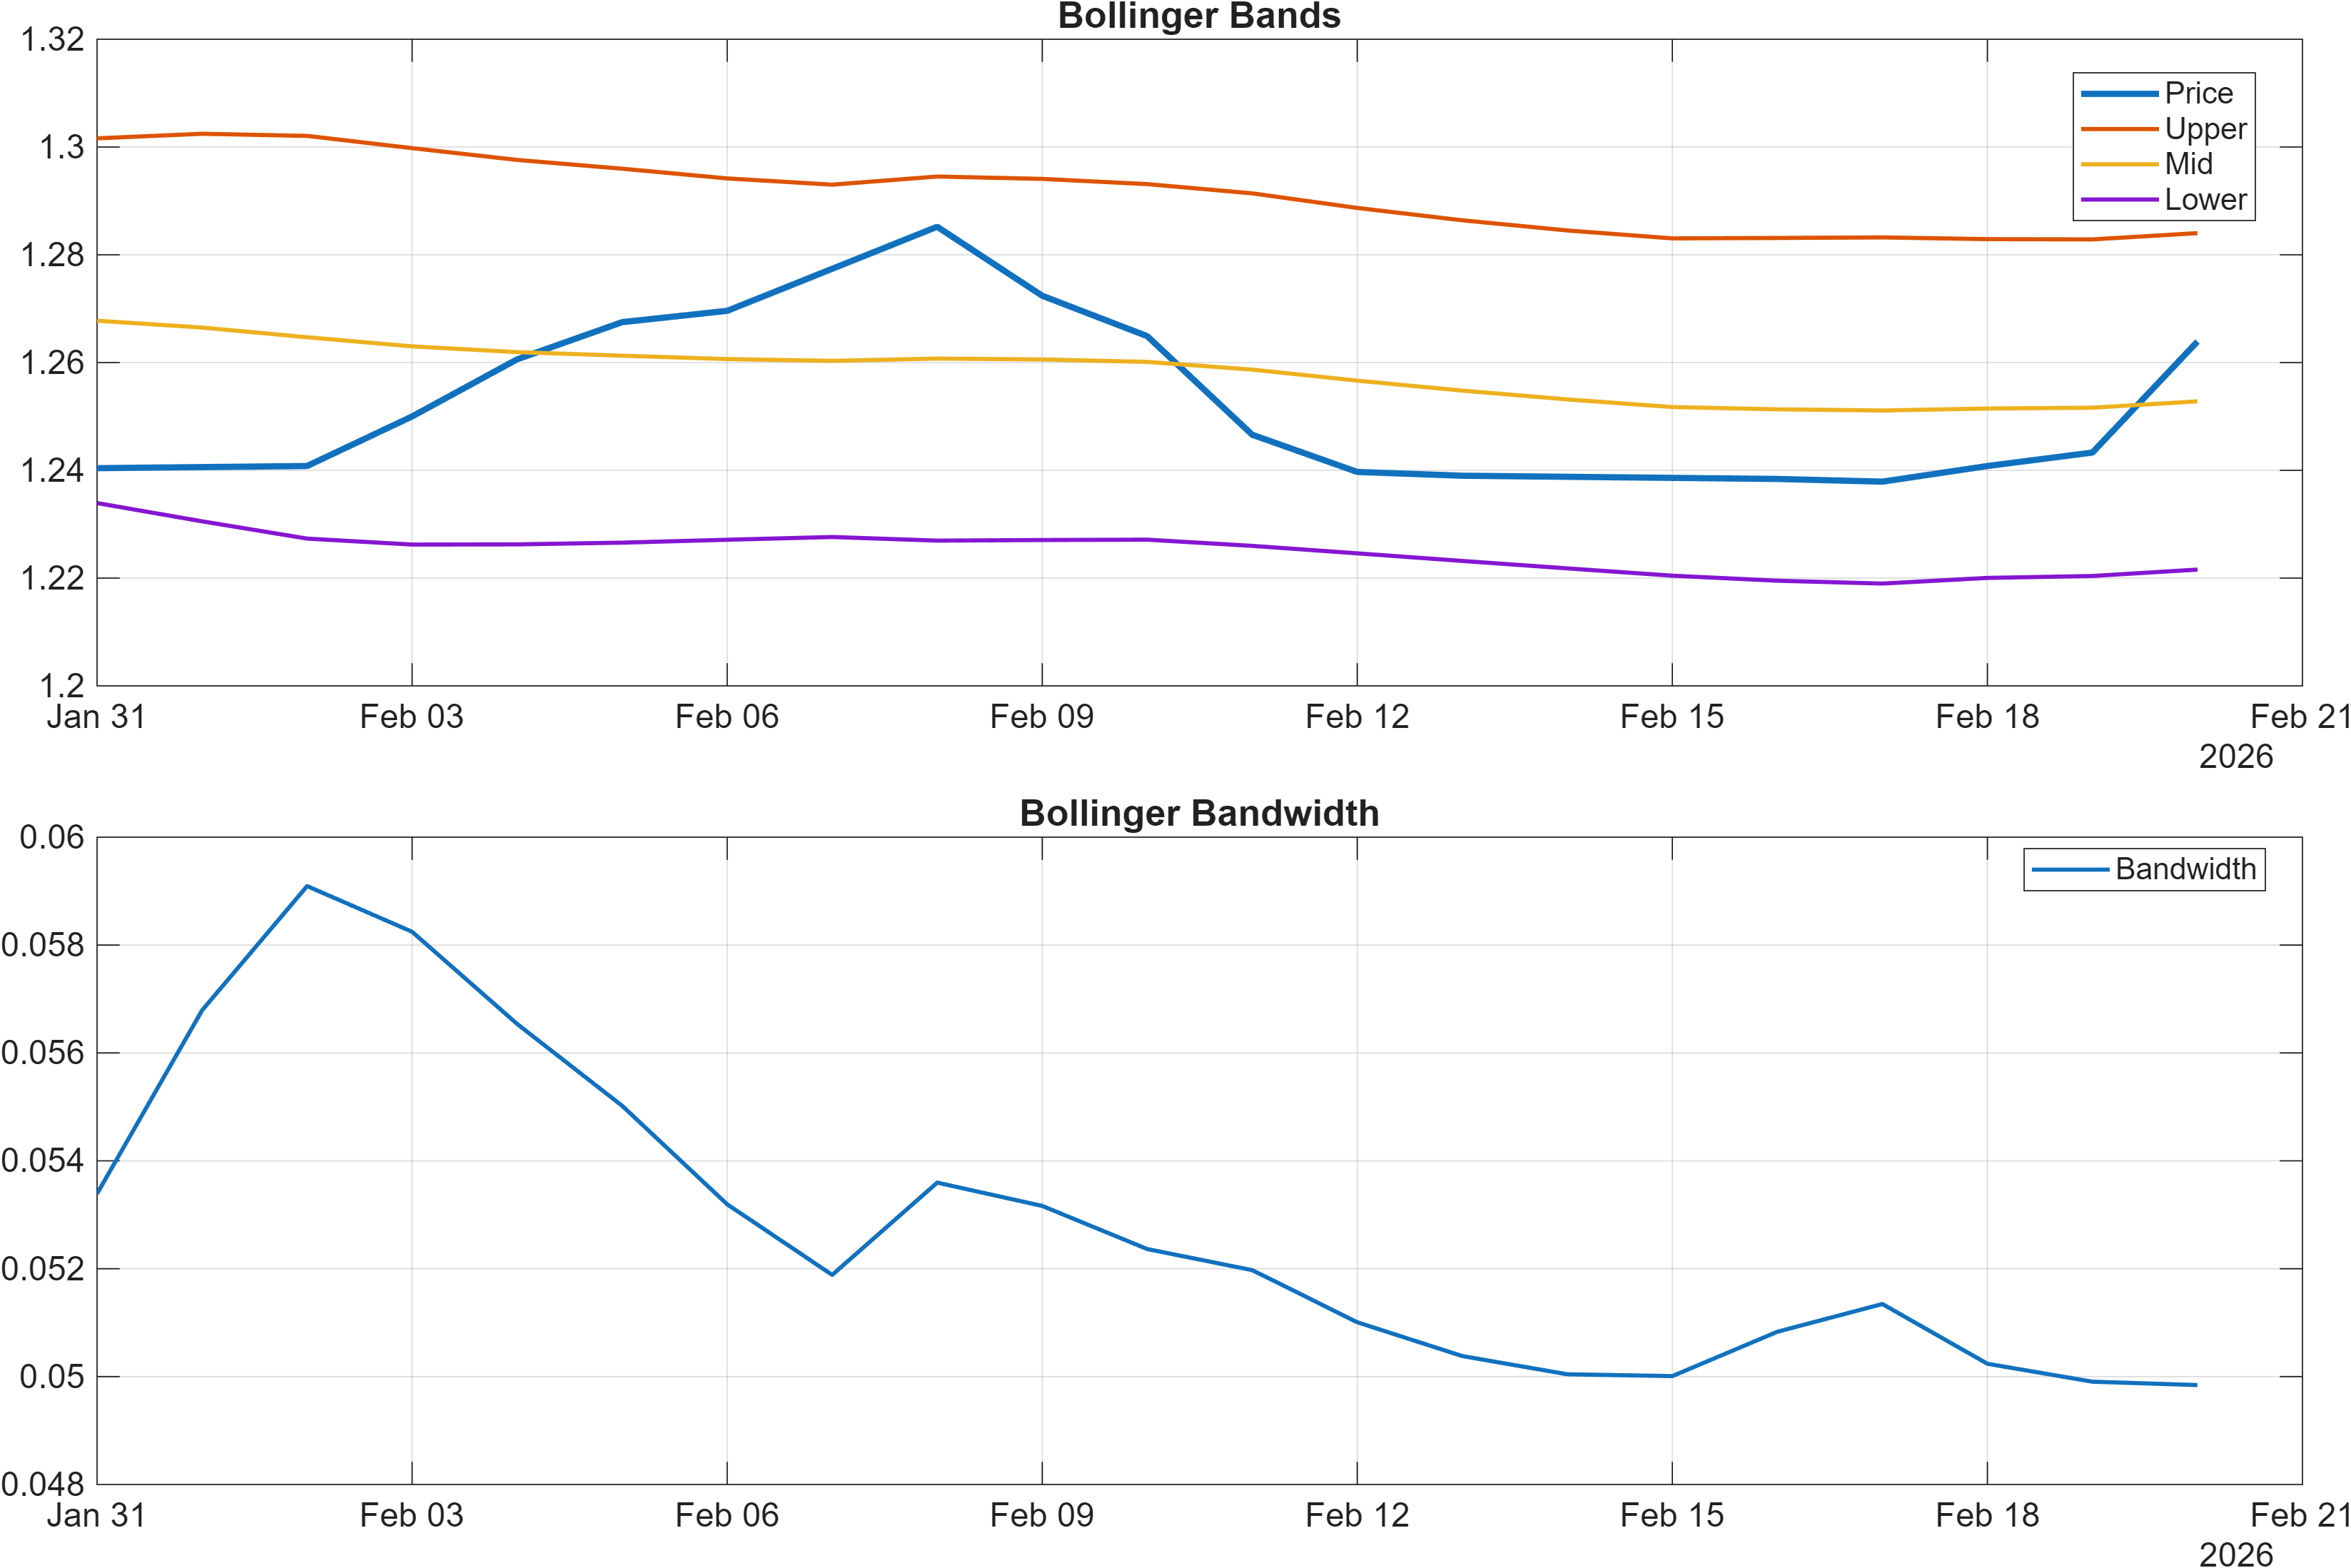
Interpretation: Bandwidth (volatility regime) latest = 0.0498.
Momentum is best described as tentatively constructive but not extended. The RSI(14) at 46.79 sits in neutral territory, implying neither persistent upside pressure nor clear capitulation. At the same time, a positive MACD histogram of 0.0005249 indicates incremental upside momentum is present, though modest in magnitude.
The signal mix supports a “compression with directionality” framing: momentum is not strong enough to dominate, but it is not fading aggressively either. This aligns with the technical dashboard’s distribution (Bull 6 / Bear 2 / Neutral 10) where neutrality is the modal outcome, yet bullish votes outnumber bearish ones.
Volatility remains contained with Bollinger Bandwidth at 0.0498 (and BB Width 0.04984 in the signal table). In lower-volatility regimes, markets often respect nearby structural levels more cleanly; breakouts can be meaningful, but they typically require a clear catalyst or persistent follow-through. For BDTJPY, the volatility backdrop argues for treating 1.2363 and 1.2824 as the primary “line-in-the-sand” references while momentum remains mixed.
4) Support / Resistance zones
Support ~ 1.2363 | Resistance ~ 1.2824
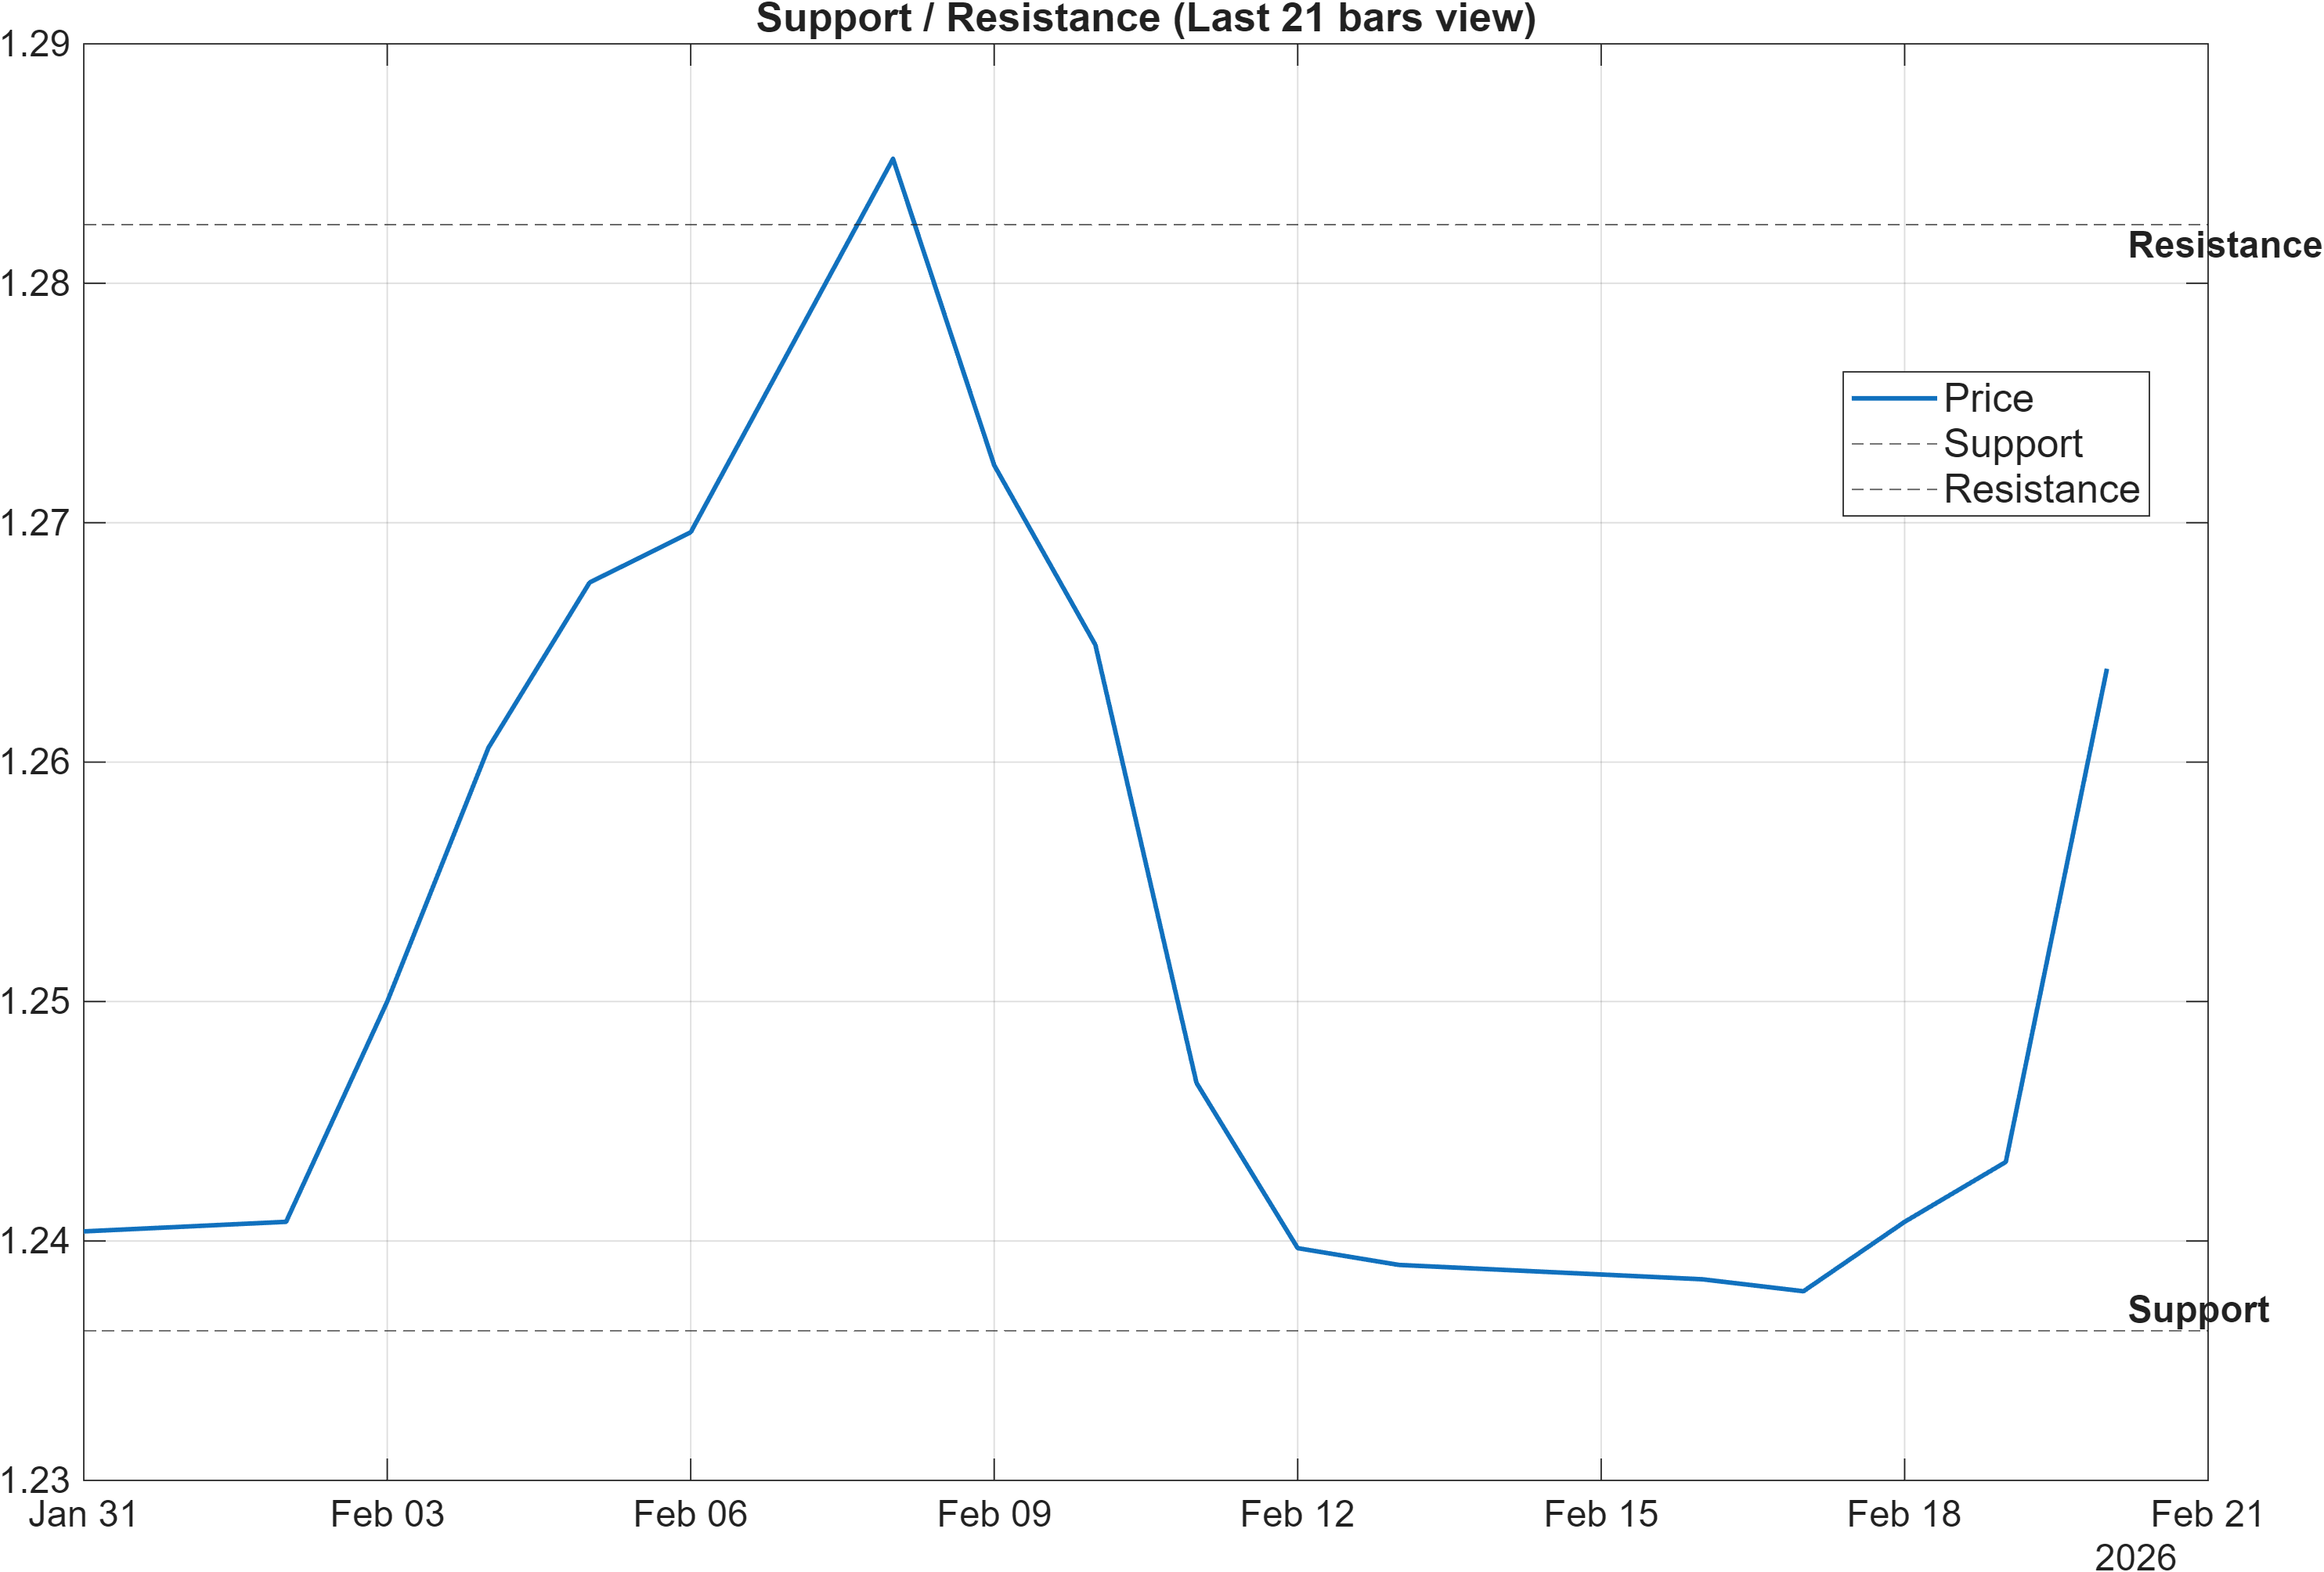
Scenario view: Break above resistance with volume → continuation. Close below support → signal deterioration risk.
The level structure is tight enough to be operational. Support near 1.2363 functions as the key downside reference where bullish short-term ranks (weekly #6) would be expected to defend. A decisive close below that zone would likely align the price structure with the weaker medium-term positioning (monthly #916), increasing the probability that neutral signals tilt defensive.
On the upside, resistance near 1.2824 is the principal threshold for validating that the positive elements (MACD histogram 0.0005249, trend “close above MA50”) are more than a short-lived bounce. The 20-day range context in the signal table reinforces this: HHIGH(20) 1.285 sits close to the resistance marker, implying that a clean break would also be a break of recent extremes rather than a minor uptick.
The immediate range can also be cross-checked against the 20-day low reference (LLOW(20) 1.231), which is proximate to the stated support band. With volatility subdued (bandwidth 0.0498), markets often oscillate between these boundaries until a new impulse arrives. The practical stance here is not directional conviction, but level-based validation: upside continuation becomes more credible above 1.2824, while deterioration risk increases below 1.2363.
5) Quant Technical Dashboard (18 Signals)
KGNAI AI Technical Analysis Score (Deep Reinforcement Learning): Rank #482 out of 961 (Rank 1 represents the strongest technical positioning and a higher probability of favorable price behavior. As ranks increase toward the maximum, the probability of favorable outcomes weakens and bearish positioning becomes more dominant.) | Label: Neutral | Score: -0.003
18-Signal Technical Confluence Score: 0.222 (Neutral)
Overall Technical Score (18-signal confluence + DRL rank blend): 0.155 (Neutral)
Note: The blended score reflects signal strength weighted against broader AI technical ranking, which may temporarily diverge.
Blended technical score breakdown: 0.155 (Neutral | Bull 6 / Bear 2 / Neutral 10)
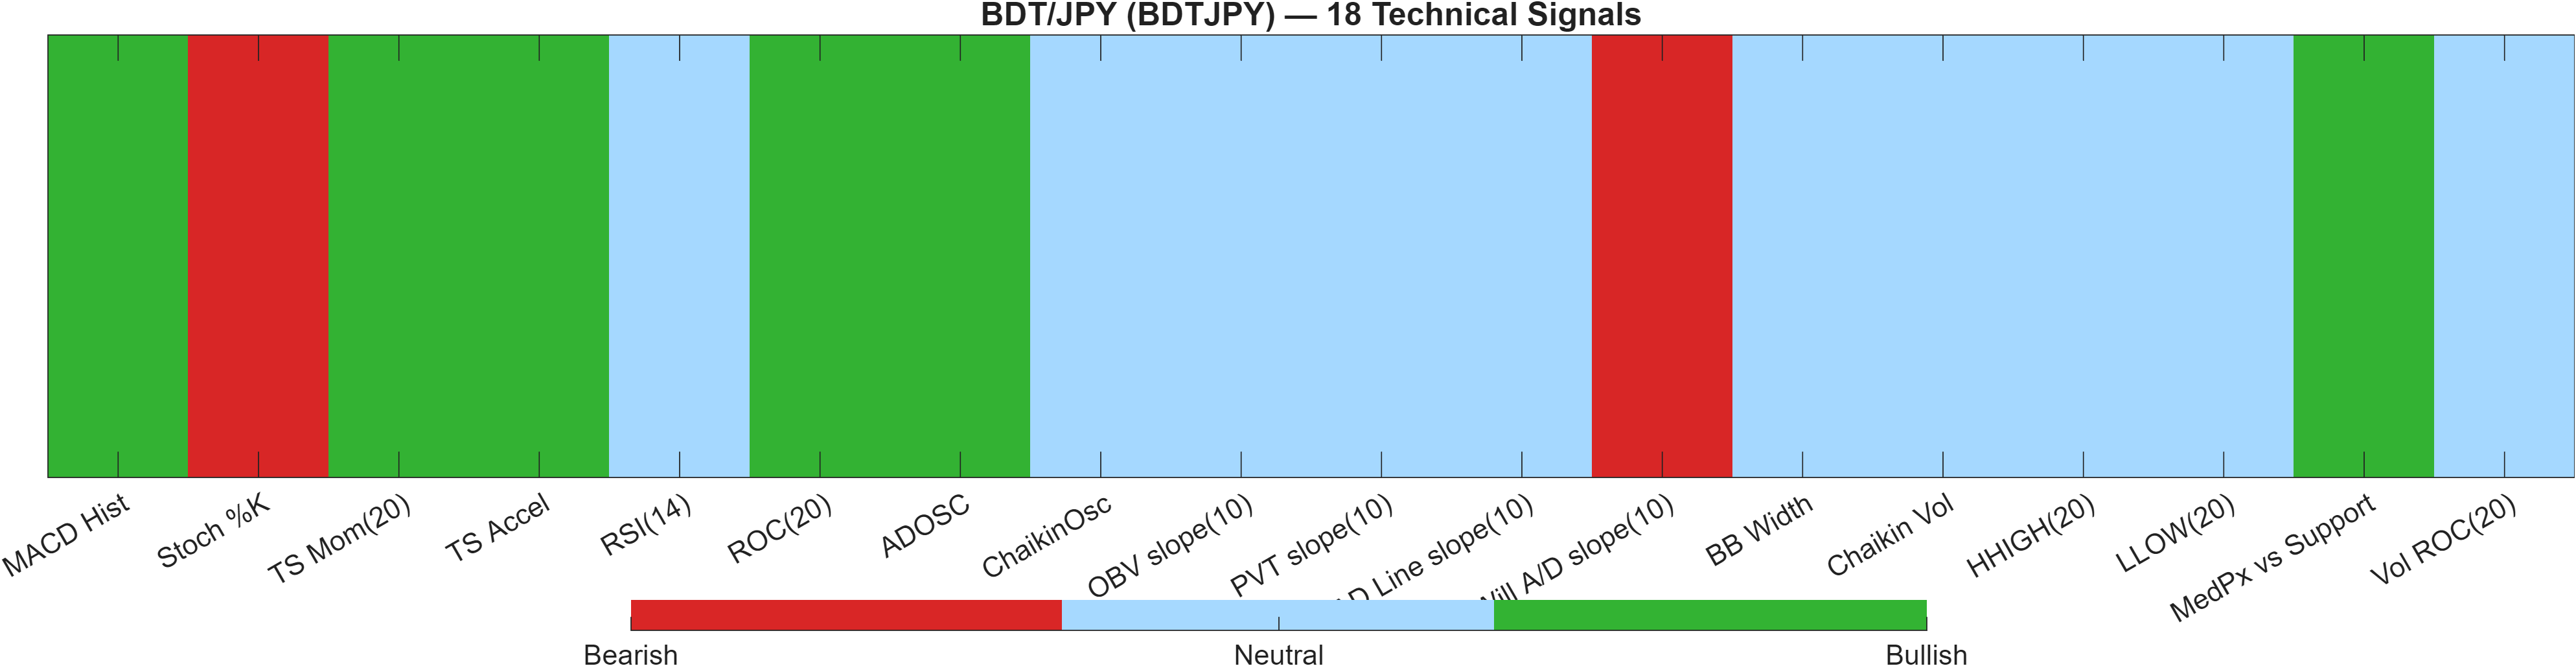
Signal table (Bull/Bear/Neutral)
| Indicator | Value | Signal |
|---|---|---|
| MACD Hist | 0.0005249 | Bullish |
| Stoch %K | 97.61 | Bearish |
| TS Mom(20) | 0.0235 | Bullish |
| TS Accel | 0.0597 | Bullish |
| RSI(14) | 46.79 | Neutral |
| ROC(20) | 1.878 | Bullish |
| ADOSC | 75 | Bullish |
| ChaikinOsc | 0 | Neutral |
| OBV slope(10) | 0 | Neutral |
| PVT slope(10) | 0 | Neutral |
| AD Line slope(10) | 0 | Neutral |
| Will A/D slope(10) | -0.0008 | Bearish |
| BB Width | 0.04984 | Neutral |
| Chaikin Vol | -47.75 | Neutral |
| HHIGH(20) | 1.285 | Neutral |
| LLOW(20) | 1.231 | Neutral |
| MedPx vs Support | 0.02735 | Bullish |
| Vol ROC(20) | — | Neutral |
Interpretation: Indicator-level signals form the base confluence, which is then adjusted using a separate AI-driven technical ranking model. The final technical score summarizes this combined view.
The dashboard is internally consistent with a neutral regime that contains pockets of short-term strength. The DRL technical rank #482 of 961 sits near the middle of the universe, and the model score (-0.003) reinforces the absence of a strong directional edge at the composite level. In parallel, the 18-signal confluence score of 0.222 and overall technical score of 0.155 keep the combined read neutral.
Within the indicator set, the bullish signals cluster around incremental momentum and support-relative positioning: MACD Hist 0.0005249, ROC(20) 1.878, and MedPx vs Support 0.02735 are supportive of stabilization above key downside zones. At the same time, overbought risk appears in the oscillator stack: Stoch %K at 97.61 is explicitly bearish, which often coincides with reduced upside efficiency unless price breaks out cleanly.
The heavy weight of neutral readings (10 of 18) is also informative. Several flow/volume-derived slopes print at 0 (ChaikinOsc, OBV slope(10), PVT slope(10), AD Line slope(10)), which is consistent with a market that is not showing strong accumulation/distribution pressure. With BB Width 0.04984 neutral and volatility compressed, the confluence suggests waiting for either level resolution or a shift in oscillator confirmation rather than over-interpreting small changes in single indicators.
6) News sentiment + extractive gist
Note: Instrument-specific news matches were not found, so the digest includes broader market/sector headlines. Links are provided for verification.
Sentiment score (avg): 0.119 | Positive: 37% | Neutral: 50% | Negative: 12%
KGNAI AI News Sentiment Score (normalized -1 to +1): Not available (as of —) | Label: Not available | Overall news score: 0.12
Positive Developments
Recent coverage across major financial outlets indicates a mildly constructive macro tone, particularly around signs of stabilization in parts of Europe. Survey-based activity updates have been framed as consistent with expansion in several services readings, while manufacturing has been discussed as improving off prior weakness. This type of backdrop can reduce near-term risk-off pressure in FX crosses, which can matter when the technical setup is already balanced. In this report, the slight positive lean in the sentiment mix (0.119 average; 37% positive) aligns with the short-horizon strength in KGNAI ranks (notably the weekly #6 and daily #111) and with modest positive momentum shown by the MACD histogram (0.0005249). However, the sentiment signal remains contextual rather than decisive, especially given that the news is broader-market in nature rather than instrument-specific.
Neutral / Mixed Developments
The neutral share of coverage is dominant (50%), reflecting an environment where scheduled macro data and policy-related commentary are being treated as incremental inputs rather than turning points. Market attention has been oriented around upcoming releases (growth and inflation proxies) and central-bank signaling, which can generate short-lived volatility without necessarily changing trend. For BDTJPY, that “watch-and-react” texture fits with a neutral technical confluence (18-signal score 0.222, overall 0.155) and a volatility regime that looks contained (bandwidth 0.0498). In this kind of tape, price often oscillates within defined levels—making 1.2363 and 1.2824 more important than narrative drift.
Negative / Risk Signals
Risk-oriented commentary has centered on event risk and the potential for abrupt repricing tied to policy uncertainty and macro surprises. Even with a relatively small negative share (12%), these themes can matter disproportionately in FX because they can shift rate expectations and safe-haven demand quickly. This is relevant given the report’s internal divergence: a very strong weekly rank (#6) exists alongside a notably weak monthly rank (#916), leaving the pair more sensitive to catalysts that could decide whether the rebound persists or fades. From a technical standpoint, the most direct expression of downside risk remains level-based: a close below 1.2363 would align with the deterioration scenario, especially while oscillators show mixed signals (e.g., Stoch %K 97.61 bearish versus RSI 46.79 neutral).
- Whether price can hold above 1.2363 during data-driven volatility.
- Whether upside attempts can clear 1.2824 and remain above nearby 20-day highs (1.285).
- Whether momentum confirms via sustained improvement beyond neutral (RSI currently 46.79).
Sources referenced: Reuters, Bloomberg, Yahoo Finance, MarketWatch, Investing.com
Snapshot: AI Rank (Short–Mid–Long): Mixed (Bullish–Bearish–Neutral) · Technical Confluence: Neutral · Key Levels: Support ~1.24 | Resistance ~1.28 · News Sentiment: Neutral
7) Sources
Not available in the provided data.
You may also like: How KGNAI AI ranks instruments across global markets
Disclaimer: KGNAI provides AI-generated analytics and educational market commentary only. This is not financial advice. Markets involve risk. Always do your own research.