
ZAR/THB (ZARTHB) — 27-May-2026 Technicals Firm but Cross-Universe Ranks Stay Bearish
ZAR/THB (ZARTHB) currently presents a notable split between improving technical structure and weak cross-universe relative ranking. Within a 947-instrument FOREX universe, the short-, mid-, and long-horizon rank stack remains biased to the weaker end of the distribution, yet the technical dashboard leans constructive: the blended 18-signal framework is Bullish with an overall technical score of 0.400, while the DRL technical rank sits at #272, a more neutral-to-constructive placement versus the broader ranks. Momentum gauges also read firmer, with RSI(14) at 66.36 and a positive MACD histogram at 0.003143, while volatility appears contained with Bollinger Bandwidth at 0.0299. Key decision zones remain clearly defined at support ~1.9136 and resistance ~1.9826, framing the near-term validation levels for the current technical bid.
Key Takeaways
- Rank stance (Short / Mid / Long): Bearish / Bearish / Bearish (daily rank #815, monthly rank #896, yearly rank #860 out of 947)
- Technical confluence: Bullish (overall technical score 0.400; 18-signal confluence 0.389)
- Key levels: Support ~ 1.9136 | Resistance ~ 1.9826
- News sentiment bias: Neutral-leaning (avg sentiment 0.097; 31% positive, 69% neutral, 0% negative; normalized score: Not available in the provided data.)
- Confirmation / invalidation: A sustained move above 1.9826 supports continuation risk-on; a close below 1.9136 increases deterioration risk versus the bullish technical read.
What KGNAI Measures
KGNAI evaluates assets using large cross-sectional datasets built from millions of structured data points. Inputs incorporate fundamental metrics, technical structures, and systematically processed news sentiment. Statistical models, machine learning, and AI frameworks are used to assess relative positioning, signal alignment, and probabilistic behavior across broad universes.
How to Read This Report
- Ranks are comparative across the tracked universe, not absolute price targets.
- Confluence reflects alignment among independent signal groups.
- Support/resistance levels are probabilistic decision zones, not guarantees.
- Sentiment provides contextual bias within the broader analytical framework.
1) KGNAI AI Analysis
Region: FOREX | Total universe size: 947 ranked instruments
- Daily rank: #815 out of 947 — Bearish
- Weekly rank: #381 out of 947 — Neutral
- Monthly rank: #896 out of 947 — Bearish
- 3-Monthly rank: #782 out of 947 — Bearish
- 6-Monthly rank: #813 out of 947 — Bearish
- Yearly rank: #860 out of 947 — Bearish
The rank stack places ZARTHB predominantly in the lower tail of the 947-instrument universe, with the daily rank at #815 and the monthly rank at #896 reinforcing a weak near-to-intermediate comparative posture. The yearly rank at #860 keeps the longer-horizon backdrop similarly soft, suggesting the instrument has not accumulated broad relative strength versus peers across regimes.
The exception is the weekly rank at #381, which sits closer to the middle of the distribution and reads Neutral. That configuration often aligns with a market that can trade tactically better than its strategic profile: short bursts of stability or rebound can coexist with an unfavorable cross-sectional score over longer windows.
In practical portfolio terms, the term view remains explicitly Bearish across short-, mid-, and long-term, which places a higher burden of proof on price and indicator confirmation before treating bullish technical readings as durable. When the broader ranks remain in the weaker deciles while the weekly stabilizes, the key question becomes whether strength can persist long enough to pull higher-horizon ranks upward—or whether the weekly improvement is a brief counter-trend reprieve.
2) Price & trend overview
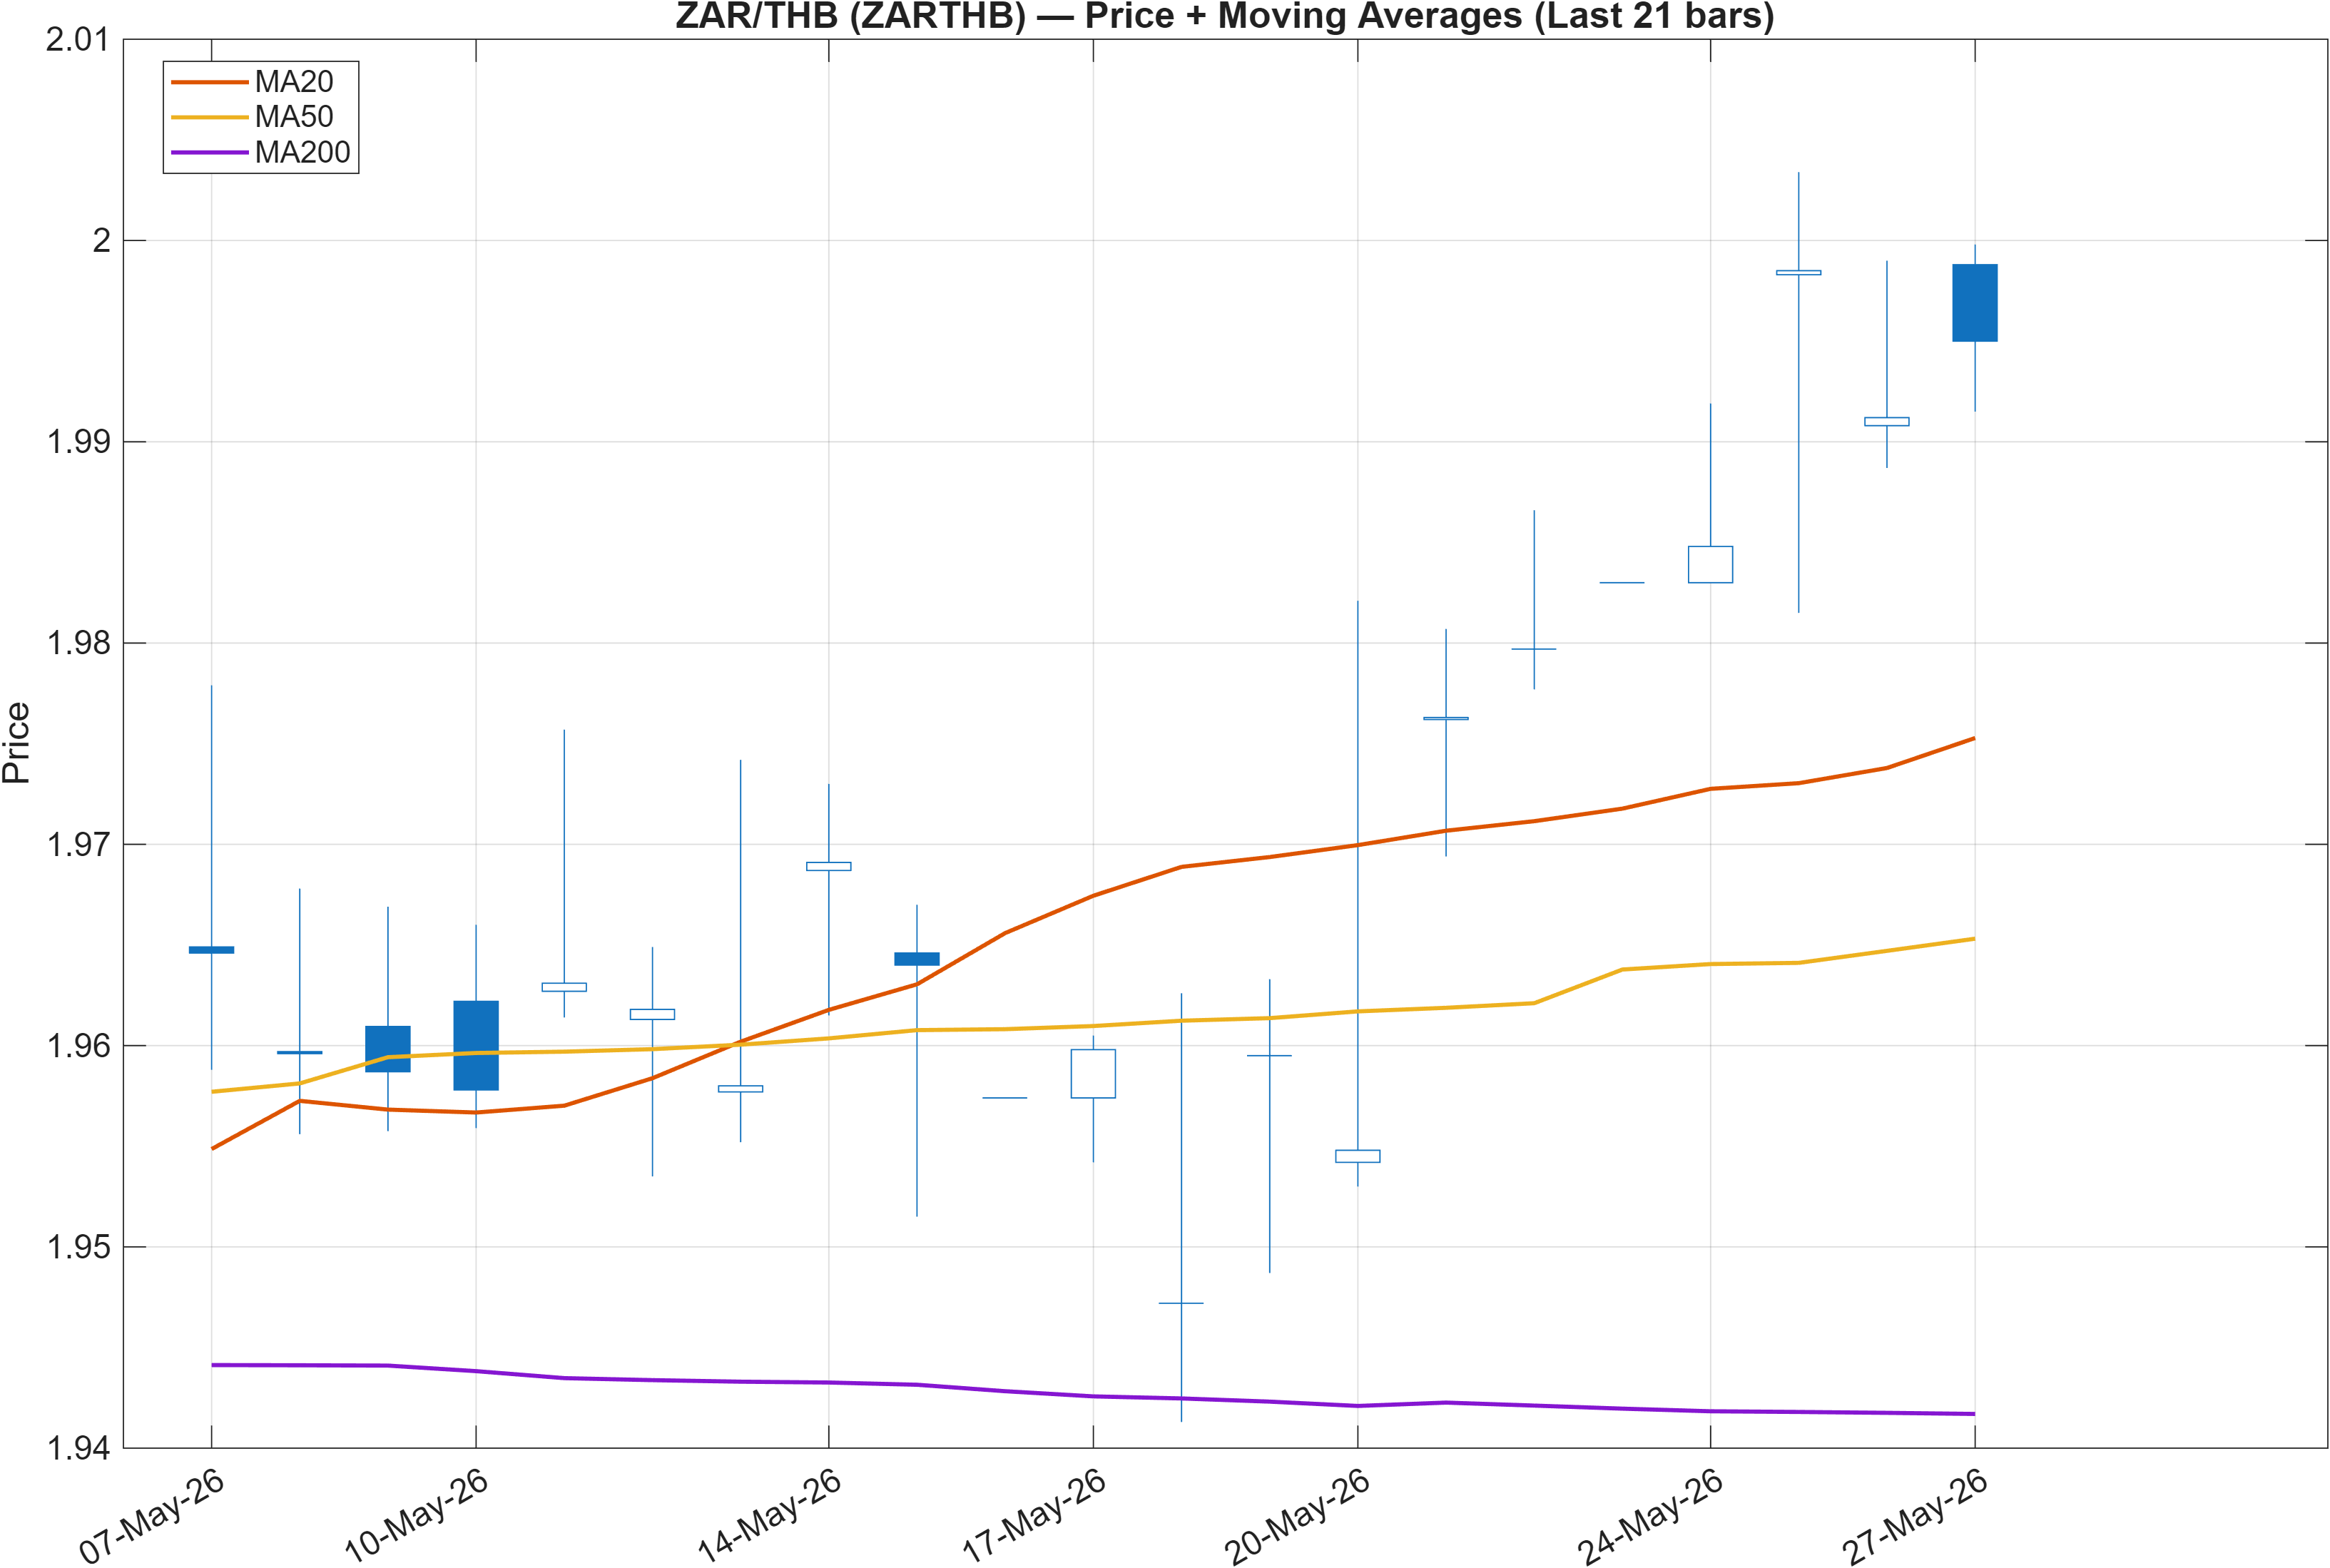
Trend signals from the moving-average structure are internally consistent: Close vs MA50 = Bullish and MA50 vs MA200 = Bullish. This combination usually reflects a market trading above its intermediate baseline while the intermediate trend remains above the longer-term baseline—often associated with a constructive trend backbone rather than a purely mean-reverting tape.
The analytical tension is that this trend structure sits alongside a weak cross-universe posture (for example, daily #815 and yearly #860). That divergence can arise when a pair is trending positively in absolute terms but still underperforming a broader set of alternatives, or when the trend is young and has not yet translated into better relative behavior.
From a regime standpoint, the moving-average alignment suggests trend persistence risk remains present, but it should be assessed against nearby decision zones: resistance ~1.9826 acts as a ceiling where trend-following demand must prove depth, while support ~1.9136 is the level where the bullish MA configuration is most vulnerable to being reframed as late-cycle rather than early-cycle strength.
In this context, the MA signals are best treated as a trend filter—supporting bullish interpretations when price remains supported—rather than as a standalone override of the broader rank-based softness.
3) Momentum & volatility dashboard
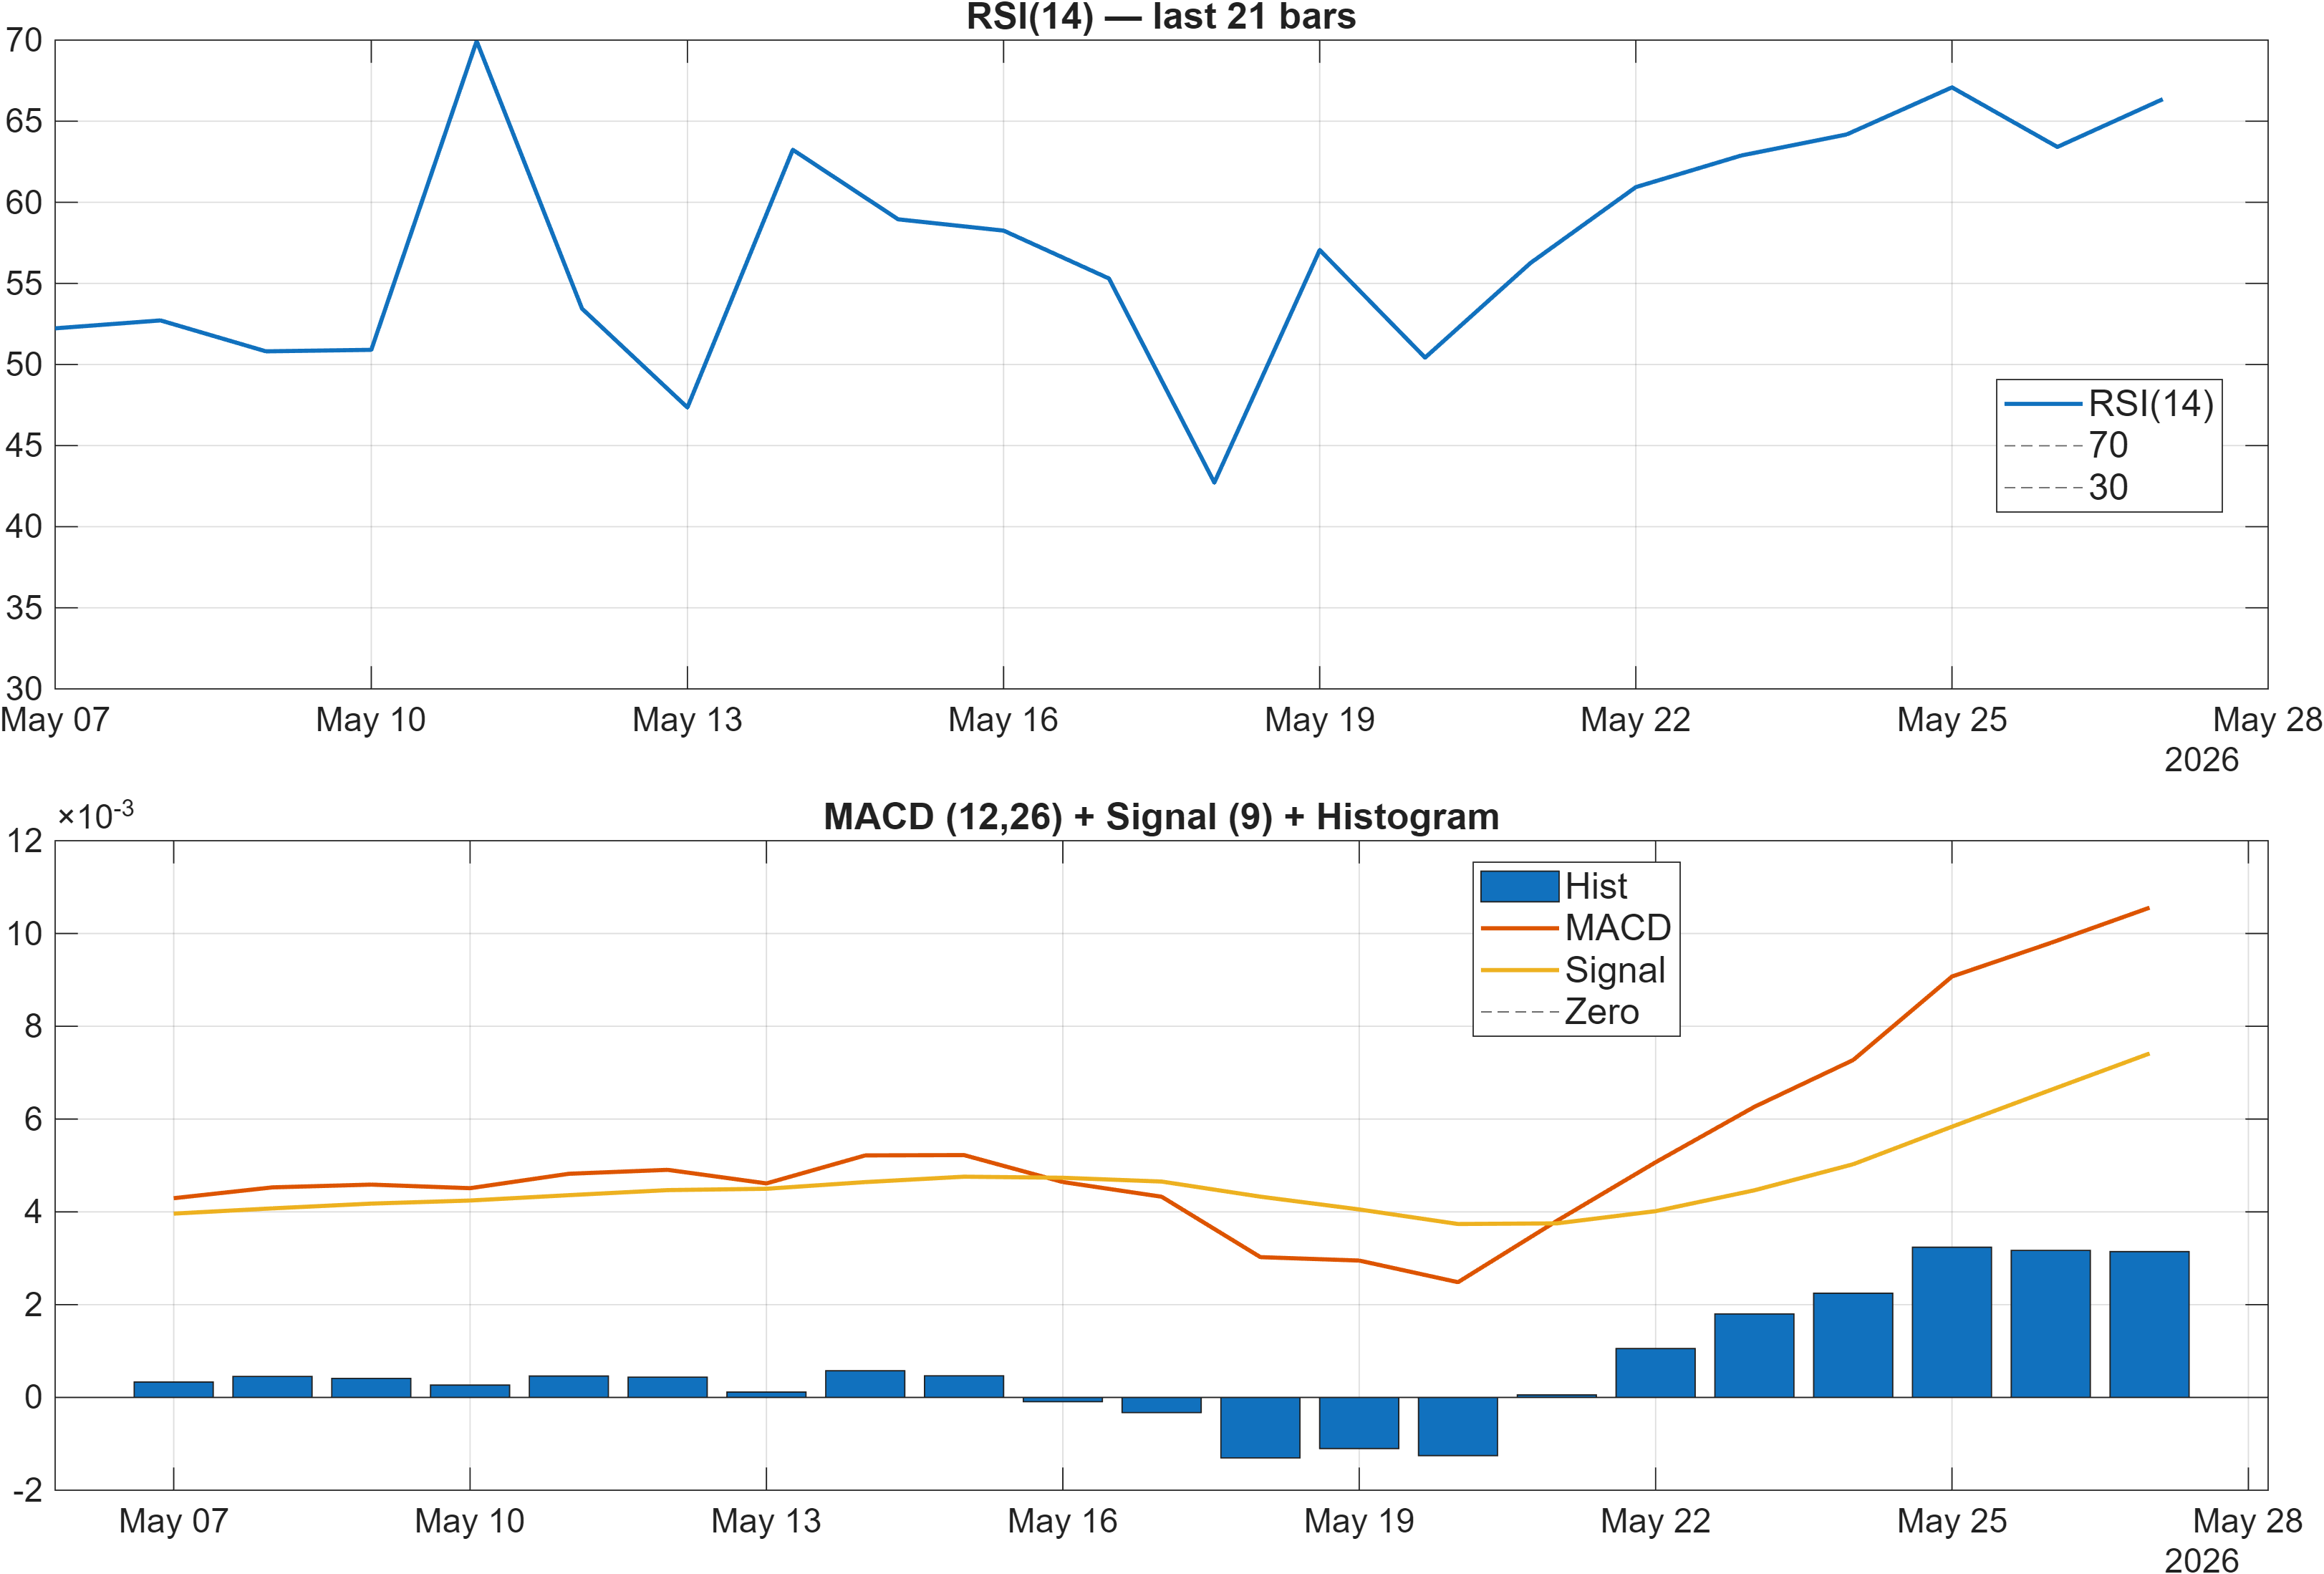
Momentum reads constructive but not euphoric. The dashboard flags RSI bias = Bullish, with RSI(14) at 66.36 in the signal table—an area often associated with firm upside pressure while still short of the extreme band where momentum frequently becomes fragile. In parallel, the MACD histogram is positive (0.0031 in the interpretation line; 0.003143 in the signal table), consistent with improving trend momentum rather than a fading bounce.
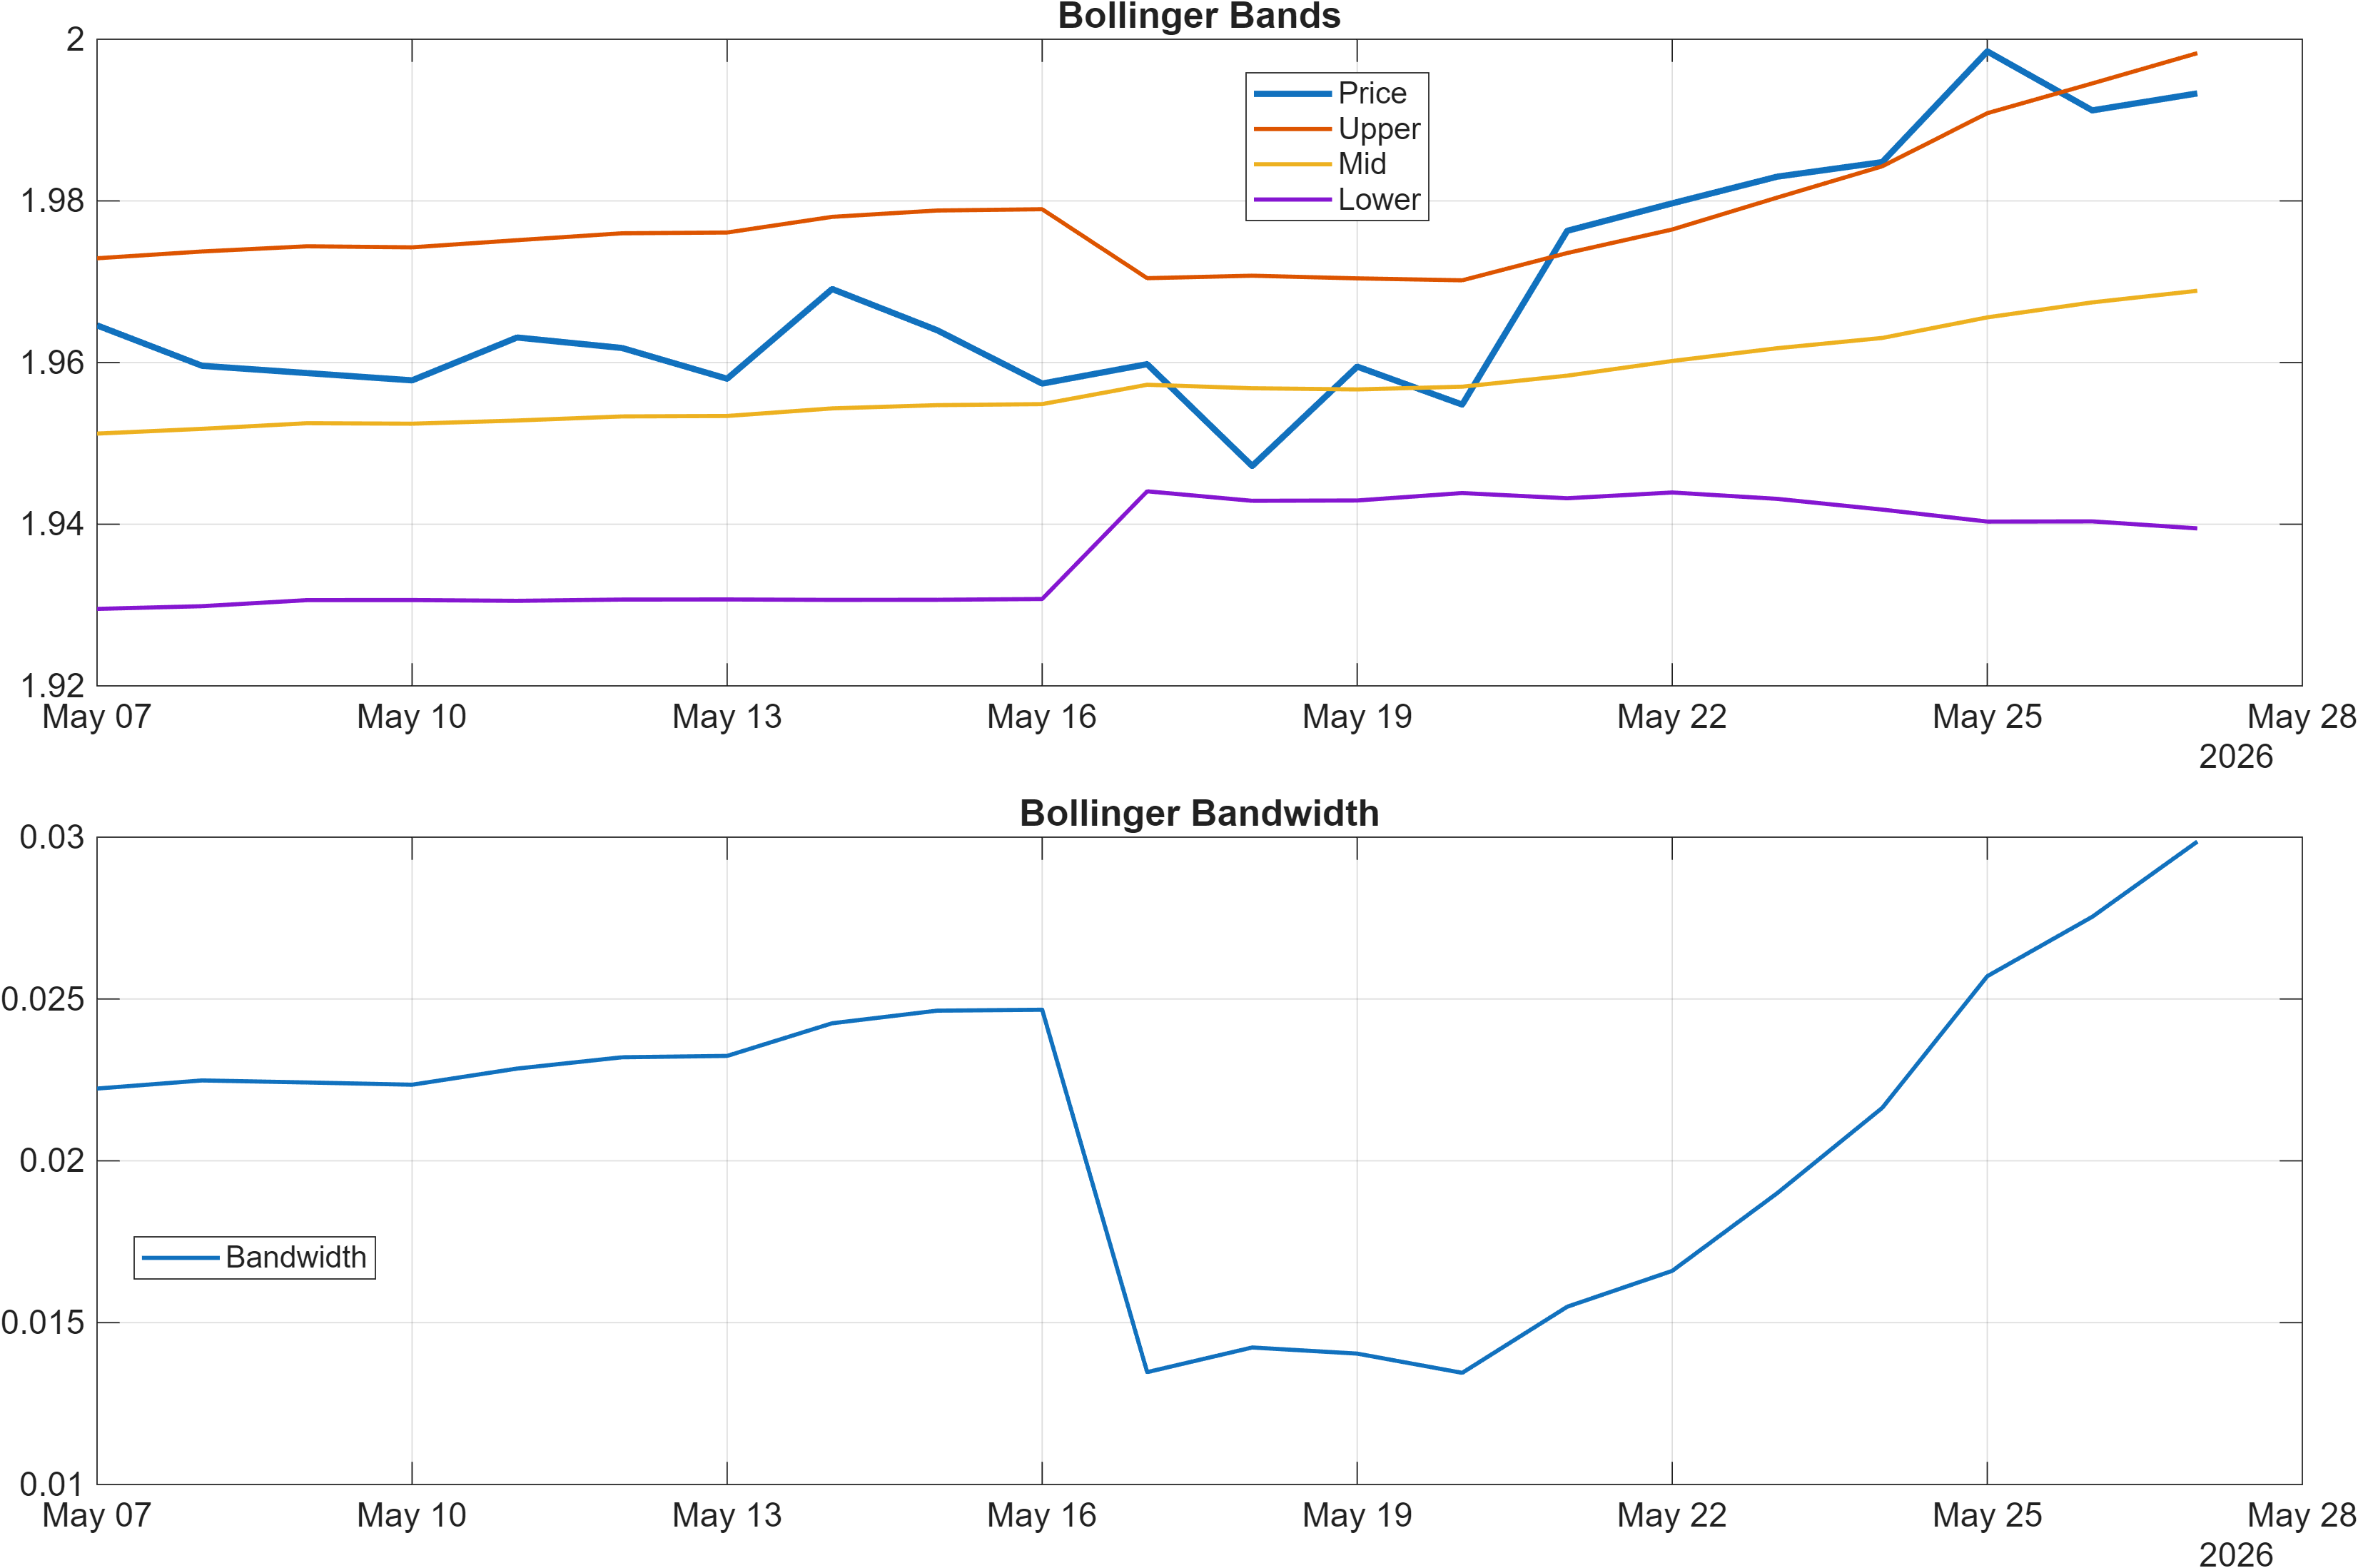
Volatility conditions appear contained, with Bollinger Bandwidth at 0.0299 (and BB Width 0.02986 in the table) reading as a relatively tight regime. Tight bandwidth can support trend continuation if price walks the band, but it can also precede sharper directional moves when the range breaks—particularly relevant as price approaches defined resistance (1.9826).
The main caution signal inside the momentum complex is Stoch %K at 86.47 tagged Bearish, which often reflects stretched short-horizon positioning. When RSI is bullish and MACD is positive while stochastic is elevated, the more common failure mode is not immediate trend reversal, but slower upside follow-through and a higher probability of consolidation near resistance.
4) Support / Resistance zones
Support ~ 1.9136 | Resistance ~ 1.9826
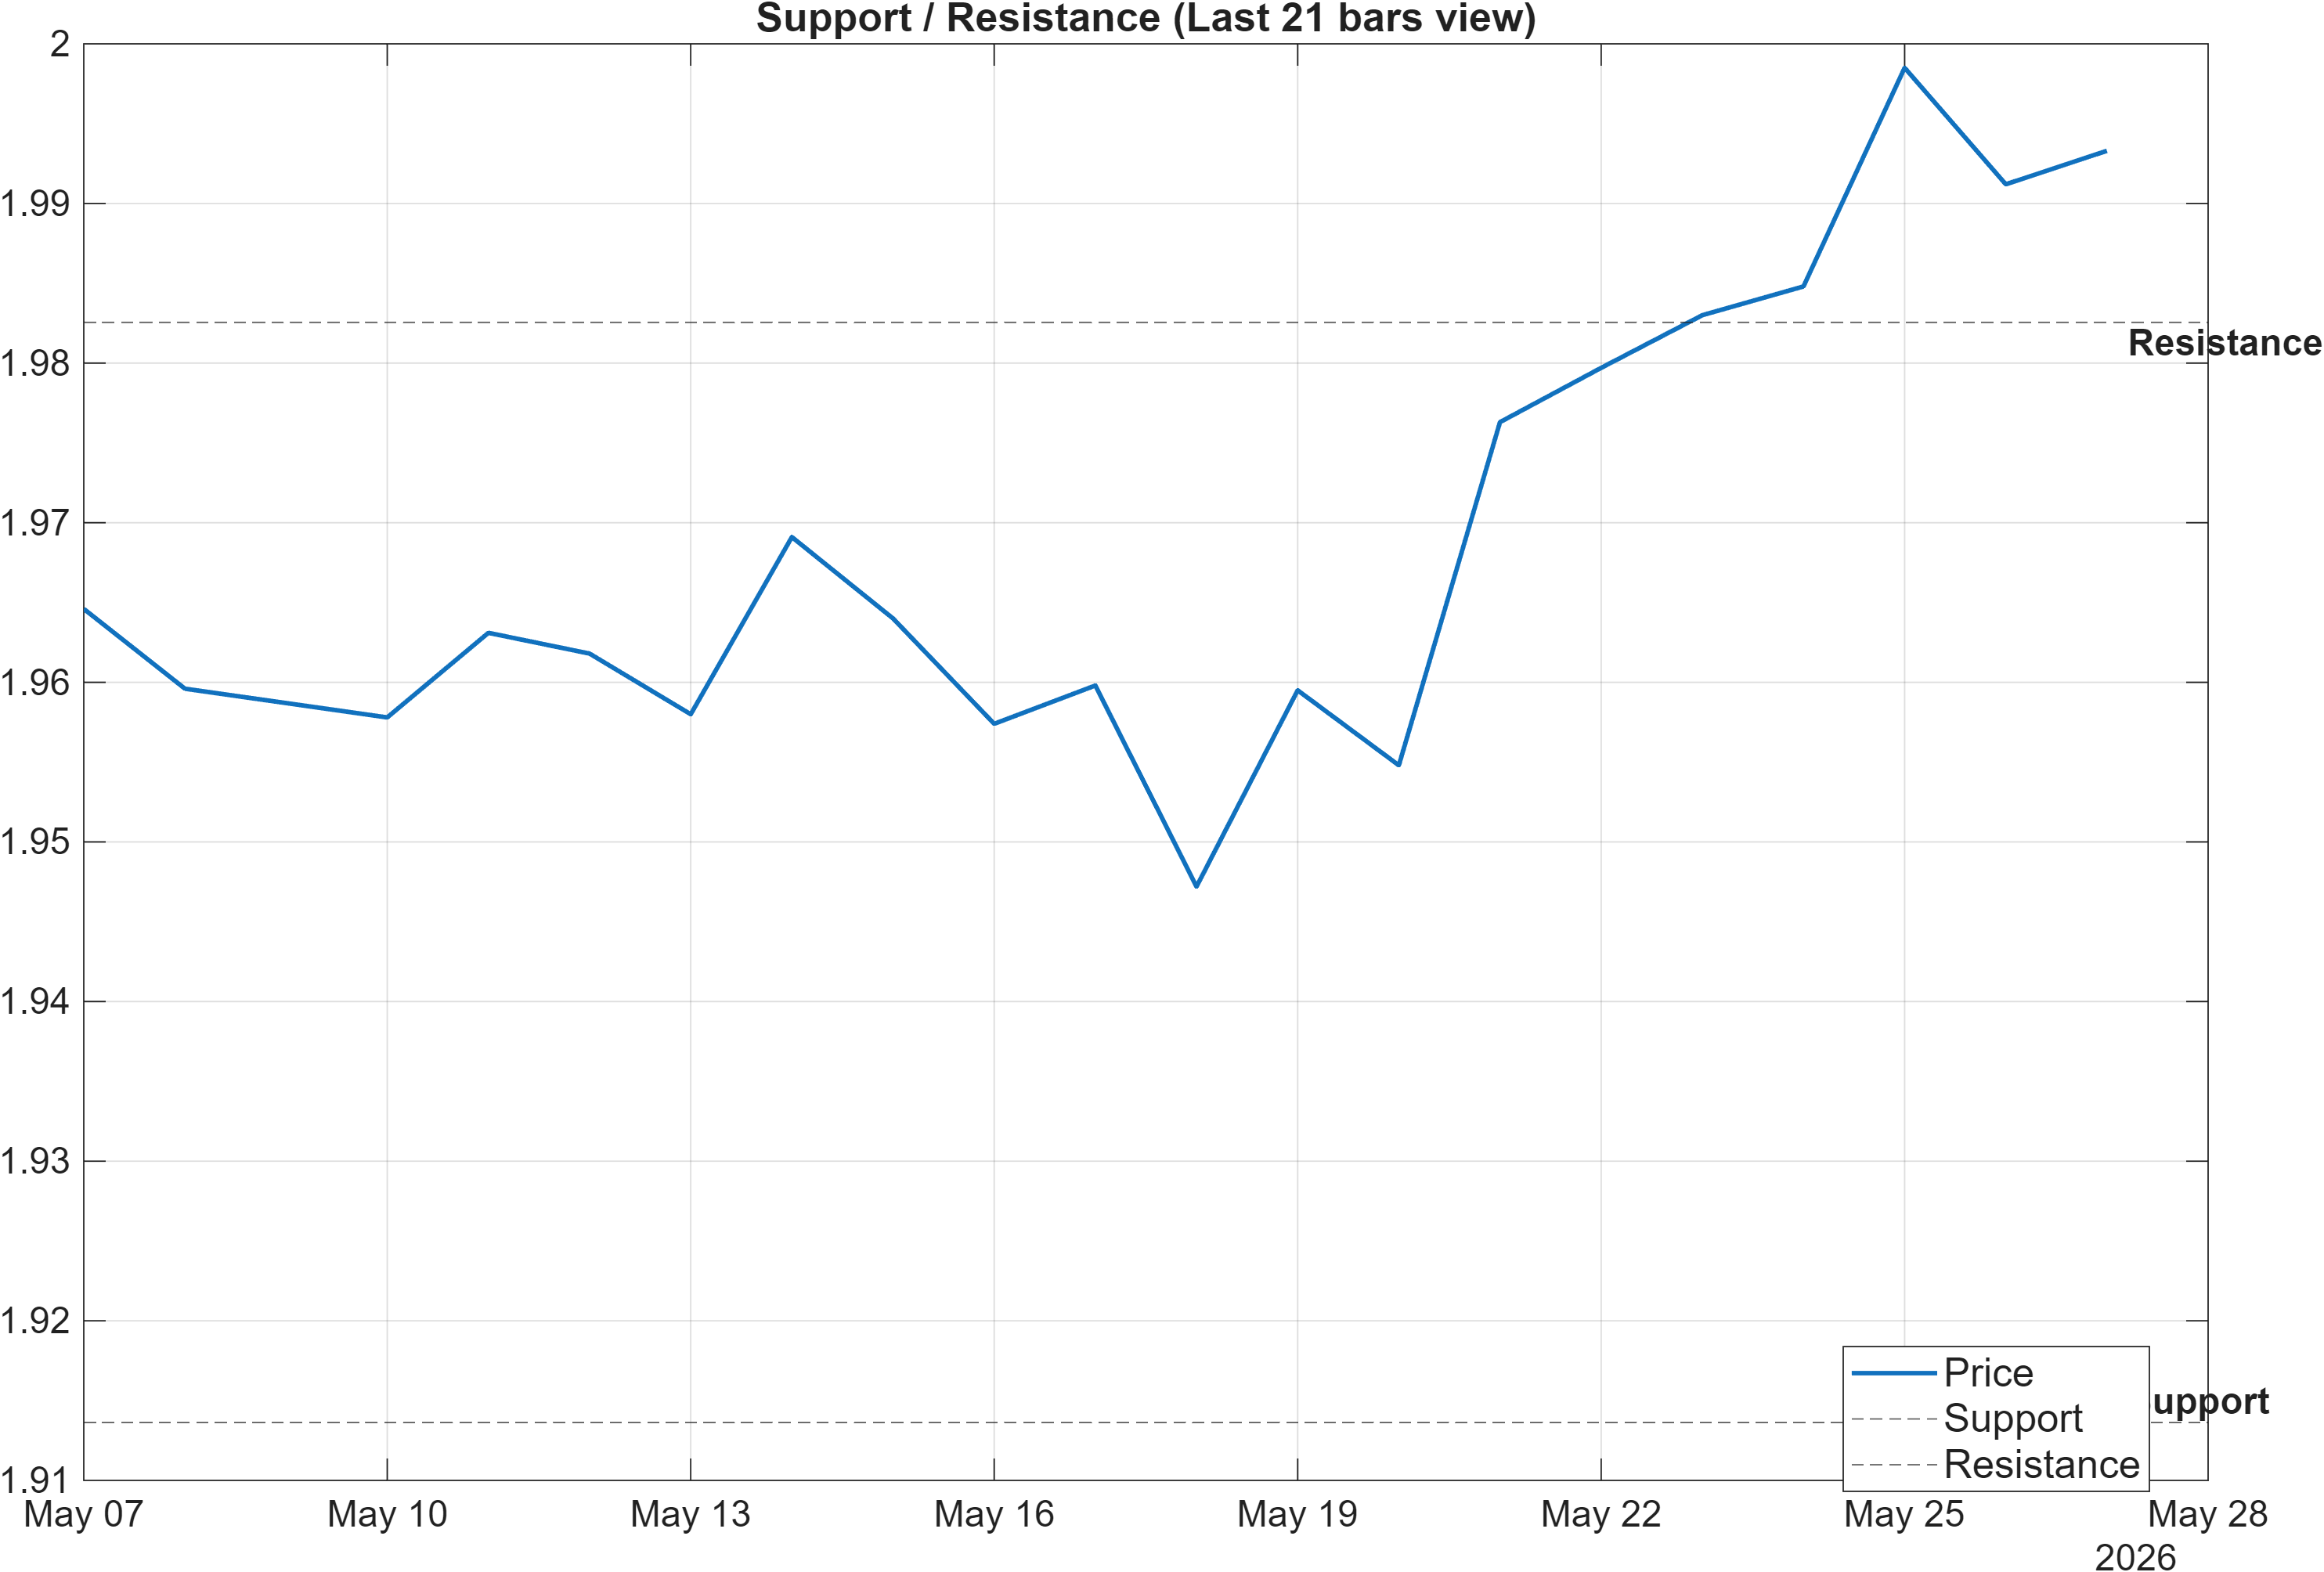
The level map is tight and decision-oriented: 1.9136 defines the nearby support zone while 1.9826 defines the primary resistance zone. With the moving-average stack bullish (close above MA50; MA50 above MA200) and momentum constructive (RSI 66.36, MACD histogram 0.003143), the market is positioned such that resistance is the immediate test of whether the technical bid has depth.
The scenario framing remains binary and probabilistic rather than deterministic: a break above resistance aligns with continuation conditions, while a close below support increases deterioration risk. That risk becomes more relevant given the weak cross-sectional ranks (for example, monthly #896 and yearly #860), which imply that—despite current constructive technicals—relative performance behavior has historically been less favorable than the majority of the universe.
In practice, these levels can be treated as validation points for signal agreement. A clean move through 1.9826 would help reconcile the bullish technical confluence with the softer rank backdrop. Conversely, weakness below 1.9136 would shift the interpretation toward a failed breakout attempt, especially with short-term oscillators already stretched (Stoch %K 86.47).
5) Quant Technical Dashboard (18 Signals)
KGNAI AI Technical Analysis Score (Deep Reinforcement Learning): Rank #272 out of 947 (Rank 1 represents the strongest technical positioning and a higher probability of favorable price behavior. As ranks increase toward the maximum, the probability of favorable outcomes weakens and bearish positioning becomes more dominant.) | Label: Neutral | Score: 0.426
18-Signal Technical Confluence Score: 0.389 (Bullish)
Overall Technical Score (18-signal confluence + DRL rank blend): 0.400 (Bullish)
Note: The blended score reflects signal strength weighted against broader AI technical ranking, which may temporarily diverge.
Blended technical score breakdown: 0.400 (Bullish | Bull 8 / Bear 1 / Neutral 9)
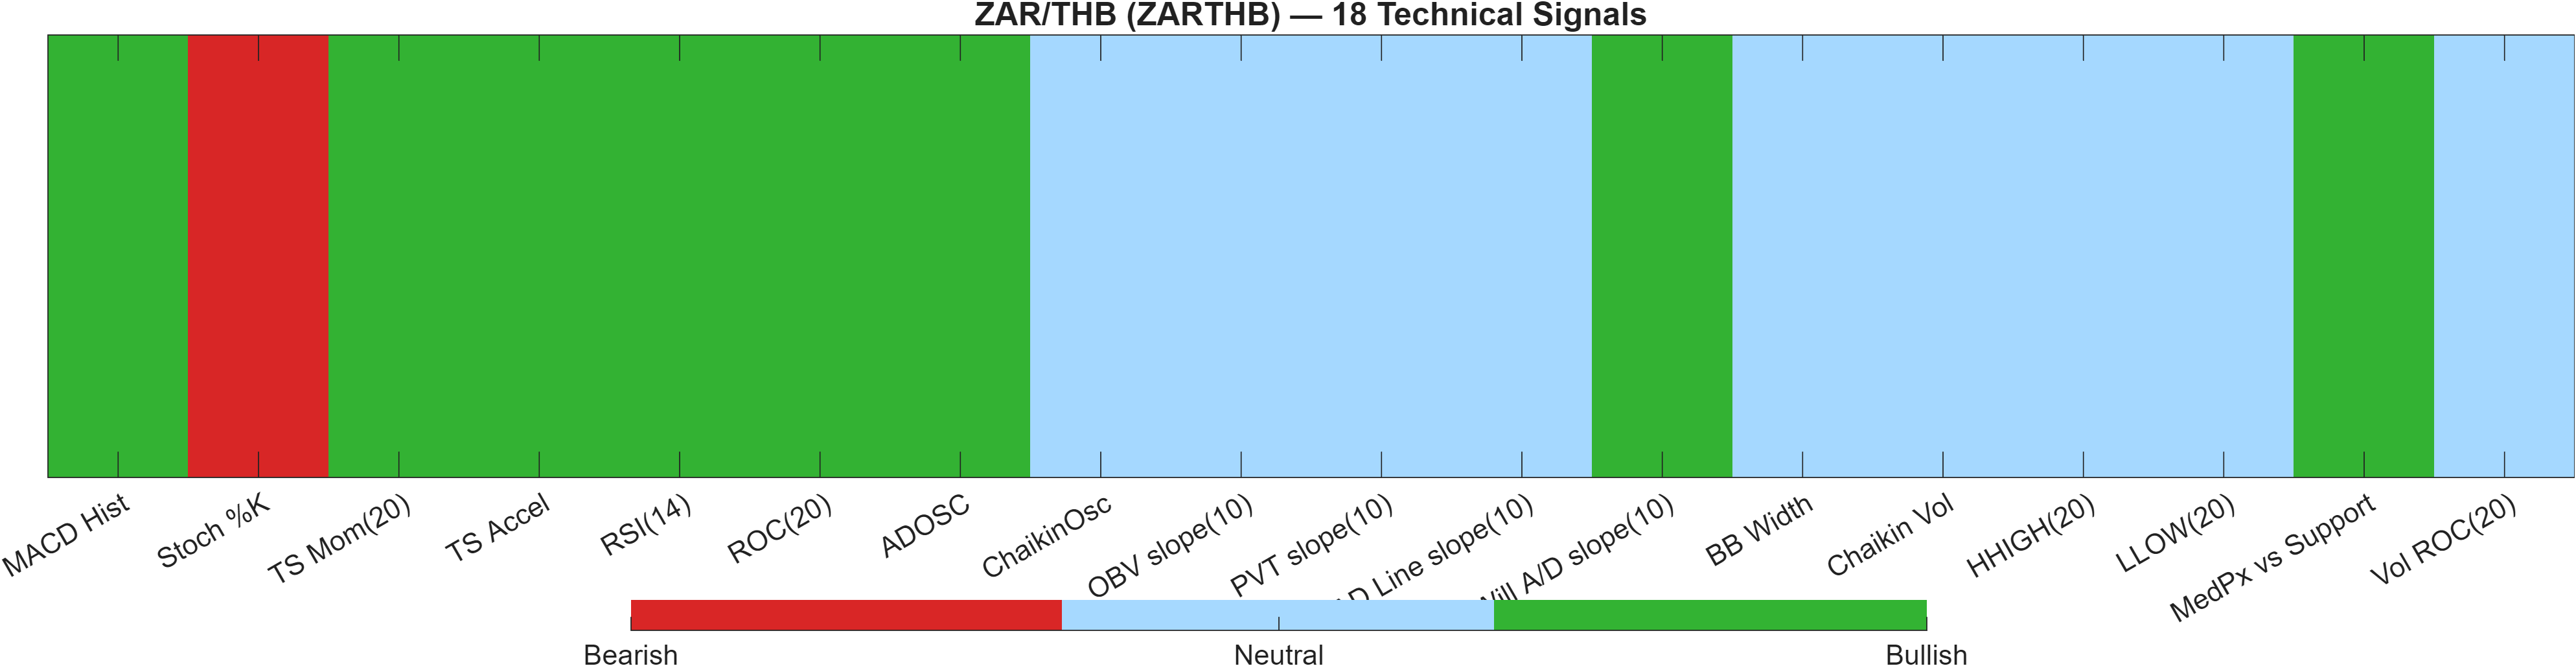
The technical dashboard is constructive on balance, but it is a measured bullish read rather than a one-sided signal. The 18-signal confluence registers 0.389 (Bullish), and the blended output rises modestly to 0.400 (Bullish) when integrated with the DRL model, which itself sits Neutral at #272 with a 0.426 score.
The internal mix—Bull 8 / Bear 1 / Neutral 9—is important: bullish evidence exists, but a large neutral block suggests signal compression rather than broad-based breakout consensus. That profile often coincides with markets that are trending but still sensitive to level-based catalysts, especially around well-defined resistance (1.9826).
Signal table (Bull/Bear/Neutral)
| Indicator | Value | Signal |
|---|---|---|
| MACD Hist | 0.003143 | Bullish |
| Stoch %K | 86.47 | Bearish |
| TS Mom(20) | 0.0354 | Bullish |
| TS Accel | 0.0206 | Bullish |
| RSI(14) | 66.36 | Bullish |
| ROC(20) | 1.72 | Bullish |
| ADOSC | 27.11 | Bullish |
| ChaikinOsc | 0 | Neutral |
| OBV slope(10) | 0 | Neutral |
| PVT slope(10) | 0 | Neutral |
| AD Line slope(10) | 0 | Neutral |
| Will A/D slope(10) | 0.0126 | Bullish |
| BB Width | 0.02986 | Neutral |
| Chaikin Vol | -6.617 | Neutral |
| HHIGH(20) | 2.003 | Neutral |
| LLOW(20) | 1.941 | Neutral |
| MedPx vs Support | 0.08202 | Bullish |
| Vol ROC(20) | — | Neutral |
Within the signal set, the bullish side is led by momentum/flow metrics (e.g., ROC(20) at 1.72, ADOSC at 27.11, and MedPx vs Support at 0.08202), while the principal caution flag is the Bearish stochastic at 86.47. The large neutral cluster (including BB Width and several volume-slope proxies) suggests the market is not broadcasting a broad risk-on surge—more consistent with a trend that remains technically intact but still needs level-based confirmation.
6) News sentiment + extractive gist
Note: Instrument-specific news matches were not found, so the digest includes broader market/sector headlines. Links are provided for verification.
Sentiment score (avg): 0.097 | Positive: 31% | Neutral: 69% | Negative: 0%
KGNAI AI News Sentiment Score (normalized -1 to +1): Not available (as of —) | Label: Not available | Overall news score: 0.10
Positive Developments
Recent coverage across major financial outlets indicates a modestly constructive tone driven by periodic improvements in broader risk appetite. Market narratives emphasize episodes where geopolitical negotiations appear to reduce immediate tail risk, which can support higher-beta positioning in global assets and stabilize FX crosses. In parallel, the macro backdrop described in the coverage includes cooling segments of rates pressure (e.g., references to easing longer-dated yields) and a generally firmer tone in parts of equities, both of which tend to be consistent with a less defensive positioning impulse. For ZARTHB, this matters less as a direct causal driver and more as a context filter: the reported 31% positive and 0% negative distribution aligns with a backdrop that is not overtly hostile to carry- and risk-sensitive exposures, even while the instrument’s cross-universe ranks remain weak.
Neutral / Mixed Developments
The dominant informational thread is “macro cross-currents”: central bank messaging, inflation uncertainty, and mixed FX performance across majors and regional currencies. This tends to produce range-like behavior and uneven follow-through, consistent with the sentiment profile being mostly Neutral (69%) despite a mildly positive average score (0.097). For a pair like ZARTHB, this kind of environment often translates into technical signals that can look constructive while still requiring clean confirmation at key levels. The absence of an available normalized news sentiment score is also a reminder that the current read is context-driven rather than instrument-specific.
Negative / Risk Signals
Risk language in the news flow remains centered on geopolitical uncertainty and the potential for sudden shifts in energy and rate expectations, both of which can reprice FX rapidly. Even when near-term optimism appears, coverage still highlights that negotiations can stall and that intermittent escalation can return volatility quickly. This matters given the current tight volatility regime signaled by Bollinger Bandwidth (0.0299): compressed conditions can amplify the impact of a surprise catalyst. In addition, any renewed risk-off rotation would be consistent with the instrument’s persistently weak longer-horizon ranks (e.g., monthly #896, yearly #860), which already frame ZARTHB as comparatively soft versus the wider universe.
- Whether price acceptance develops above 1.9826 or rejects back into the prior range.
- Whether momentum stays constructive with RSI(14) holding its bullish bias while Stoch %K works off elevated readings.
- Whether volatility expands from 0.0299 bandwidth alongside directional follow-through.
Sources referenced: Reuters, Bloomberg, Yahoo Finance, MarketWatch, Investing.com
Snapshot: AI Rank (Short–Mid–Long): Bearish (Bearish–Bearish–Bearish) · Technical Confluence: Bullish · Key Levels: Support ~1.91 | Resistance ~1.98 · News Sentiment: Neutral
7) Sources
- WTI slumps below $91.00 on US–Iran peace progress while fresh strikes cloud outlook — https://www.fxstreet.com/news/wti-slumps-below-9100-on-us-iran-peace-progress-while-fresh-strikes-cloud-outlook-202605270456
- Euro advances on hawkish sentiment surrounding ECB outlook — https://www.fxstreet.com/news/euro-advances-on-hawkish-sentiment-surrounding-ecb-outlook-202605270447
- India Gold price today: Gold falls, according to FXStreet data — https://www.fxstreet.com/news/india-gold-price-today-gold-falls-according-to-fxstreet-data-202605270434
- NZD/USD Price Forecast: Hawkish RBNZ-led rally stalls near 0.5880, ahead of 200-SMA on H4 — https://www.fxstreet.com/news/nzd-usd-price-forecast-hawkish-rbnz-led-rally-stalls-near-05880-ahead-of-200-sma-on-h4-202605270430
- Gold remains on the back foot as Iran risks and hawkish Fed bets underpin US Dollar — https://www.fxstreet.com/news/gold-remains-on-the-back-foot-as-iran-risks-and-hawkish-fed-bets-underpin-us-dollar-202605270415
- Swiss Franc edges higher as fading risk aversion weighs on USD — https://www.fxstreet.com/news/swiss-franc-edges-higher-as-fading-risk-aversion-weighs-on-usd-202605270413
- United States Dollar Index softens to near 99.00 amid US-Iran conflict risks — https://www.fxstreet.com/news/us-dollar-index-softens-to-near-9900-amid-us-iran-conflict-risks-202605270404
- Breman Speech: RBNZ Governor sheds light on policy outlook after the hawkish interest rate hold — https://www.fxstreet.com/news/rbnz-set-to-hold-interest-rate-though-a-hike-cant-be-ruled-out-as-inflation-pressures-mount-202605262115
You may also like: How KGNAI AI ranks instruments across global markets
Disclaimer: KGNAI provides AI-generated analytics and educational market commentary only. This is not financial advice. Markets involve risk. Always do your own research.