
AUD/CNH (AUDCNH) Technical, Rank & Sentiment Analysis — 24-May-2026 | Long-term Bullish, Near-term Neutral-to-Bearish Tension
AUD/CNH (AUDCNH) is currently characterized by a split regime: KGNAI’s cross-sectional ranks lean Neutral in the short and mid horizons (Daily #637, Weekly #698 out of 961), while the long horizon remains constructive (6-Month #22, Yearly #43). The technical layer, however, is more cautious. The blended technical view prints an Overall Technical Score of -0.373 (Bearish), with several momentum readings under pressure—most visibly RSI(14) at 28.81 and MACD histogram at -0.00764. Volatility is present but not extreme, with Bollinger Bandwidth near 0.0256, suggesting the market may be in a decision phase rather than a full expansion. Key levels frame the near-term risk/reward: support ~4.7363 and resistance ~4.9268. News sentiment is mildly positive on balance (avg 0.099) but should be treated as contextual rather than instrument-specific.
Key Takeaways
- Rank stance: Short-term Neutral (Daily #637) | Mid-term Neutral (Weekly #698) | Long-term Bullish (6-Month #22; Yearly #43)
- Technical confluence: Neutral on 18-signal score (-0.222) but Bearish on blended technical (-0.373)
- Key levels: Support ~4.7363 | Resistance ~4.9268
- News sentiment bias: Neutral (avg 0.099; 37% positive / 38% neutral / 25% negative)
- Confirmation / invalidation condition: A sustained push above 4.9268 would improve continuation odds; a close below 4.7363 increases deterioration risk.
What KGNAI Measures
KGNAI evaluates assets using large cross-sectional datasets built from millions of structured data points. Inputs incorporate fundamental metrics, technical structures, and systematically processed news sentiment. Statistical models, machine learning, and AI frameworks are used to assess relative positioning, signal alignment, and probabilistic behavior across broad universes.
How to Read This Report
- Ranks are comparative across the tracked universe, not absolute price targets.
- Confluence reflects alignment among independent signal groups.
- Support/resistance levels are probabilistic decision zones, not guarantees.
- Sentiment provides contextual bias within the broader analytical framework.
1) KGNAI AI Analysis
AUDCNH is ranked within the FOREX region across a 961-instrument universe. The rank structure currently points to a time-horizon mismatch rather than a clean directional agreement. Daily (#637) and weekly (#698) sit in the weaker half of the universe, consistent with a market that lacks near-term leadership. By contrast, the monthly rank (#217) moves the pair into a stronger relative bucket, and the long horizon is notably stronger with the 6-month rank at #22 and yearly at #43—both in the upper tier of the universe.
That configuration typically reflects one of two conditions: either a longer-term regime remains favorable while the short-term is undergoing a corrective phase, or the long-horizon strength is a residual artifact that has not yet been fully challenged by recent price action. KGNAI’s own term summary captures this directly: Short-term Neutral, Mid-term Neutral, Long-term Bullish. Importantly, “Neutral” here is not an absence of movement; it is a positioning state where the model sees insufficient cross-test agreement for directional conviction.
The missing 3-month horizon is Not available in the provided data. That gap matters because, in practice, 3-month signals often act as the bridge between monthly and 6-month regimes. Without it, the safest interpretation is to treat the long-horizon bullish ranks (#22 and #43) as an anchoring tailwind, while the higher daily/weekly ranks (#637, #698) imply the market may still be working through shorter-cycle pressure.
Region: FOREX
Total universe size: 961 ranked instruments
- Daily rank: #637 out of 961 — Neutral
- Weekly rank: #698 out of 961 — Neutral
- Monthly rank: #217 out of 961 — Neutral
- 3-Monthly rank: Not available for this horizon — Not available
- 6-Monthly rank: #22 out of 961 — Bullish
- Yearly rank: #43 out of 961 — Bullish
KGNAI ranks each instrument across large universes using multiple proprietary AI tests and statistical models (millions of data points). Lower ranks generally indicate stronger probability of favorable performance behavior, while higher ranks indicate weaker probability and more bearish positioning.
Term view: Short-term: Neutral. Mid-term: Neutral. Long-term: Bullish.
Want the full universe and complete rank tables? Unlock full access on KGNAI: https://www.kgnai.com/pricing
2) Price & trend overview
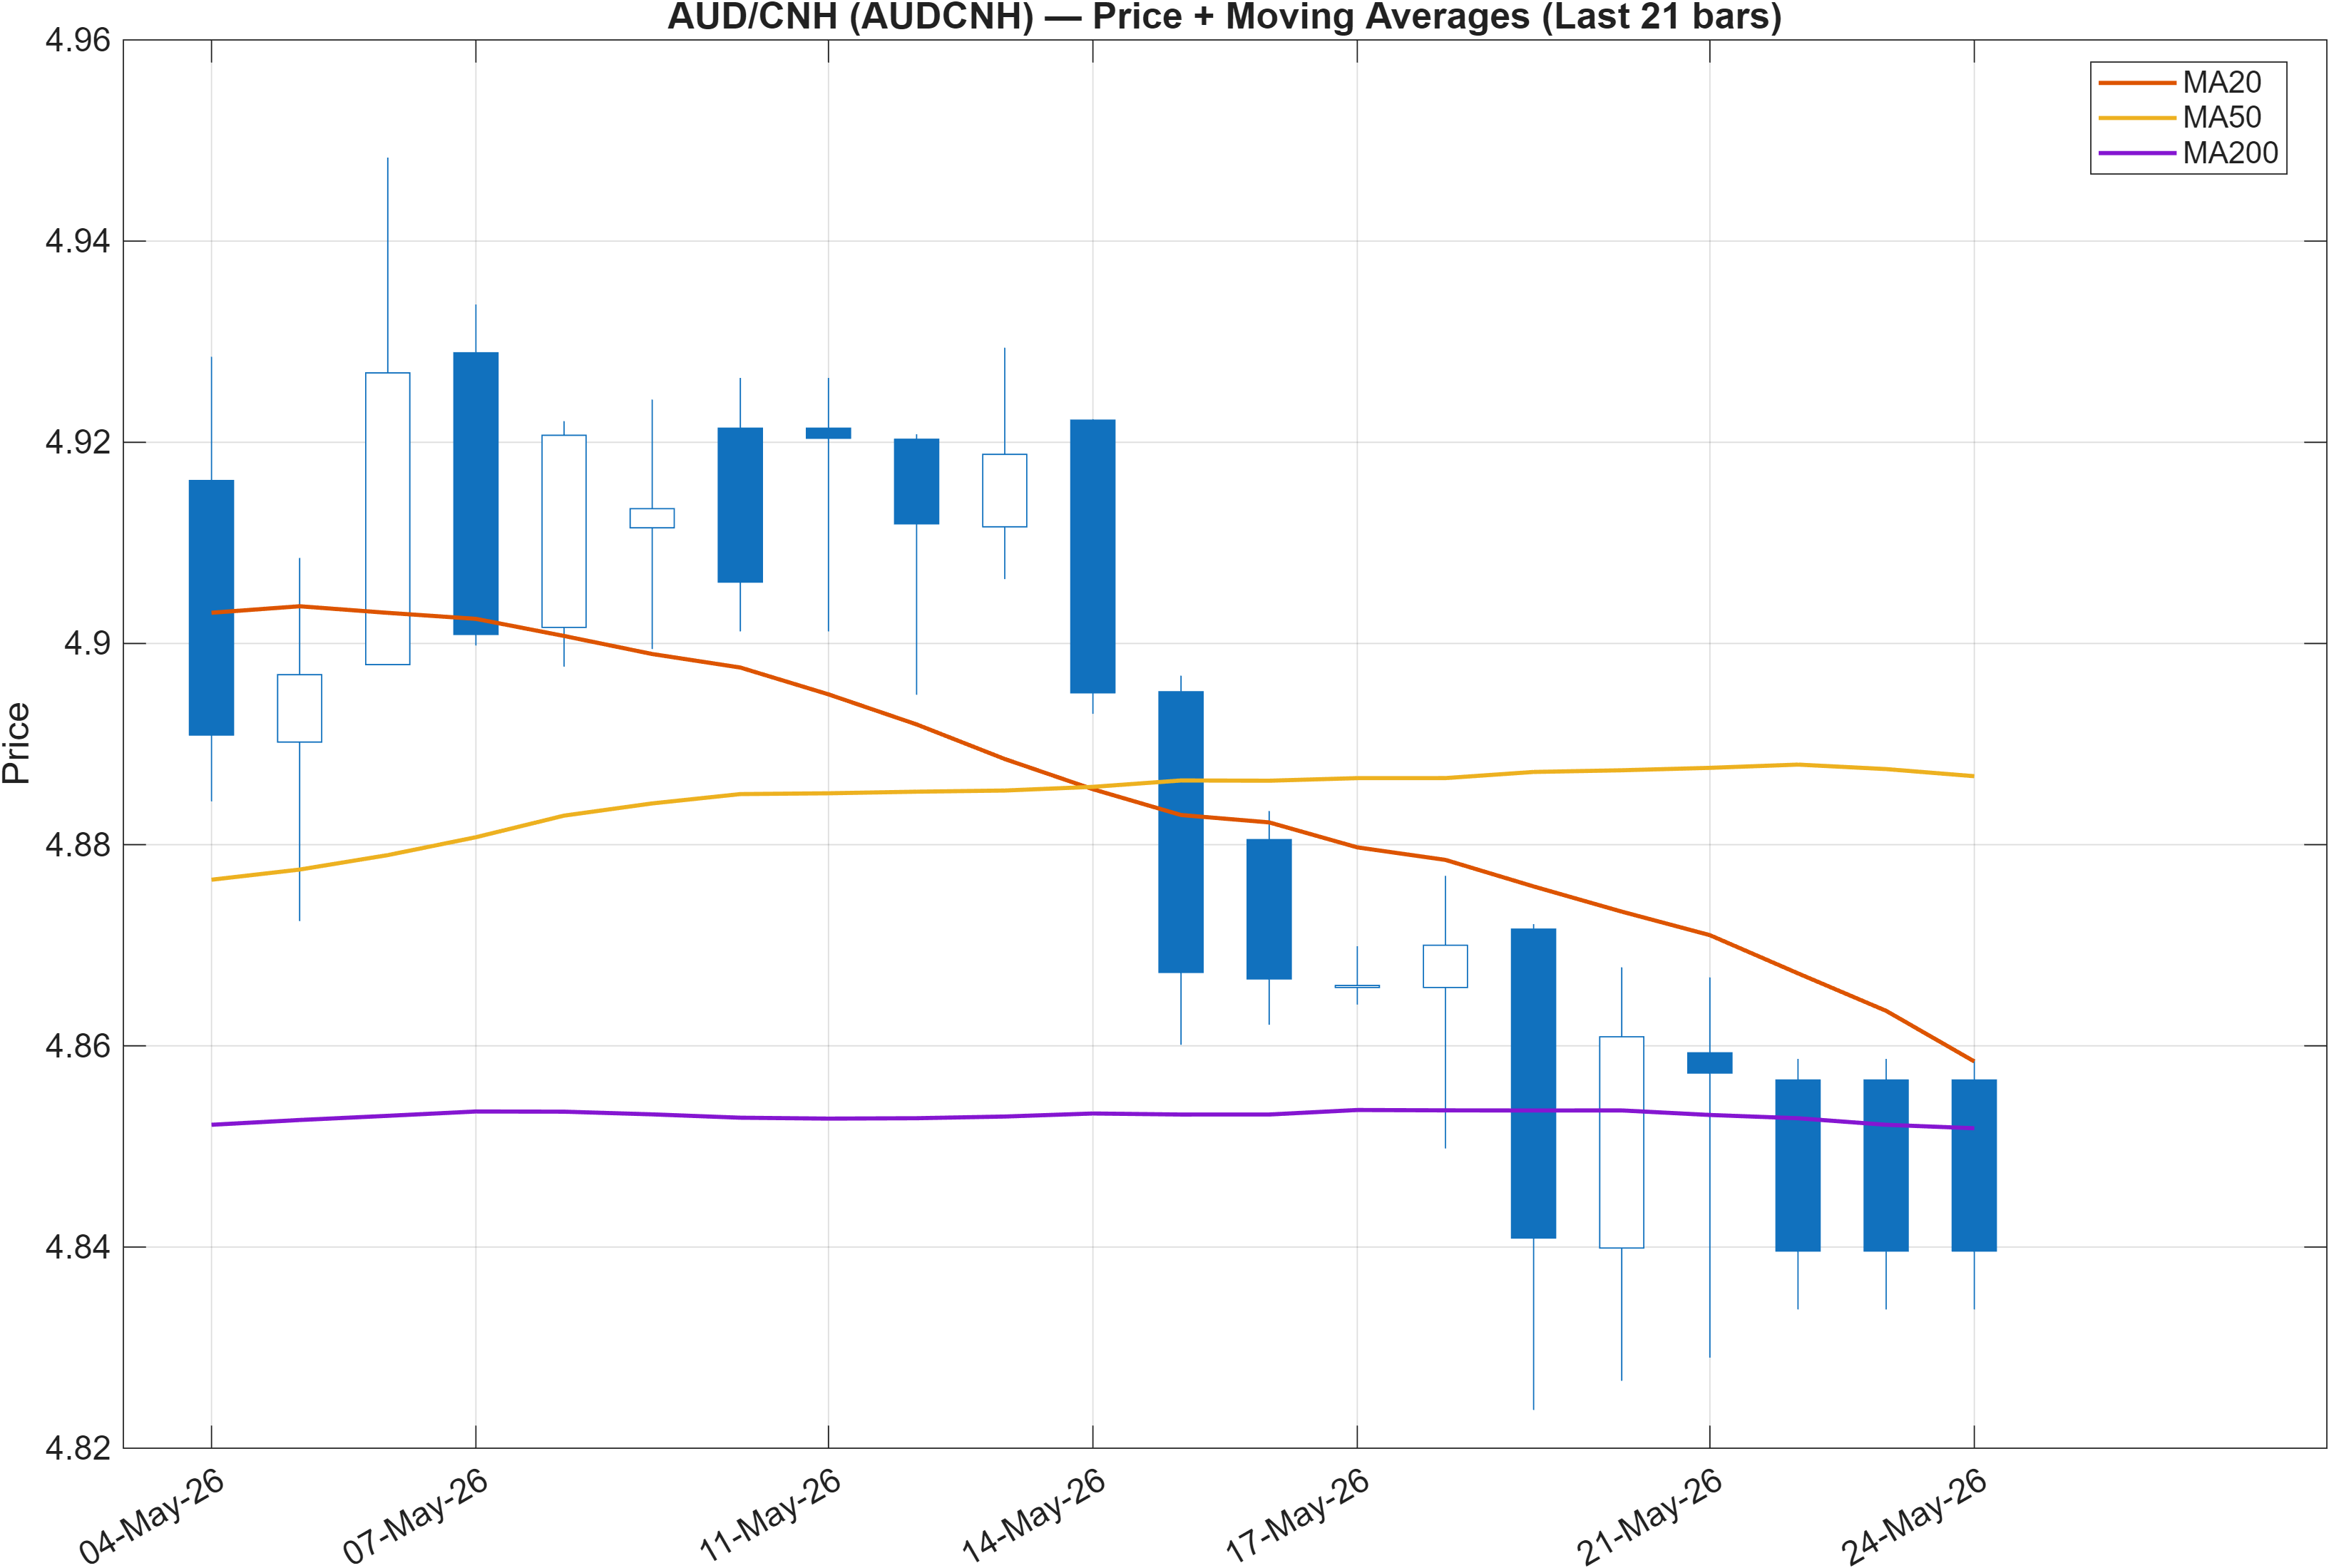
The moving-average structure is explicitly mixed: Close vs MA50 = Bearish while MA50 vs MA200 = Bullish. In market-structure terms, that combination often points to a pullback inside a larger uptrend (or, at minimum, a long-horizon bias that has not fully broken). This aligns with the cross-sectional rank profile where long-term ranks remain in the upper tier (6-Month #22, Yearly #43) even as short horizons lag (Daily #637, Weekly #698).
The key analytical question is whether the MA50 “bearish” relationship is simply a mean-reversion phase or a sign that the market’s intermediate trend is transitioning. With the monthly rank at #217 (still Neutral but materially better than daily/weekly), the balance of evidence suggests the trend is not uniformly weak; instead, the pair appears to be in a regime negotiation where longer-cycle strength is being tested by shorter-cycle selling pressure.
This is where level discipline becomes central. The report’s defined zones—support near 4.7363 and resistance near 4.9268—act as the practical boundaries for interpreting the moving-average conflict. A market with MA50/MA200 bullish alignment can remain structurally constructive even when the close dips below MA50, but only as long as downside probes are contained and subsequent rebounds rebuild momentum.
As a result, the trend read here is less about “up vs down” and more about trend persistence vs exhaustion. The data does not show a clean confirmation of either outcome; instead it highlights a market that is vulnerable to short-term whipsaws while still retaining longer-term structural support from the broader trend configuration.
Interpretation: Close vs MA50 = Bearish, MA50 vs MA200 = Bullish.
3) Momentum & volatility dashboard
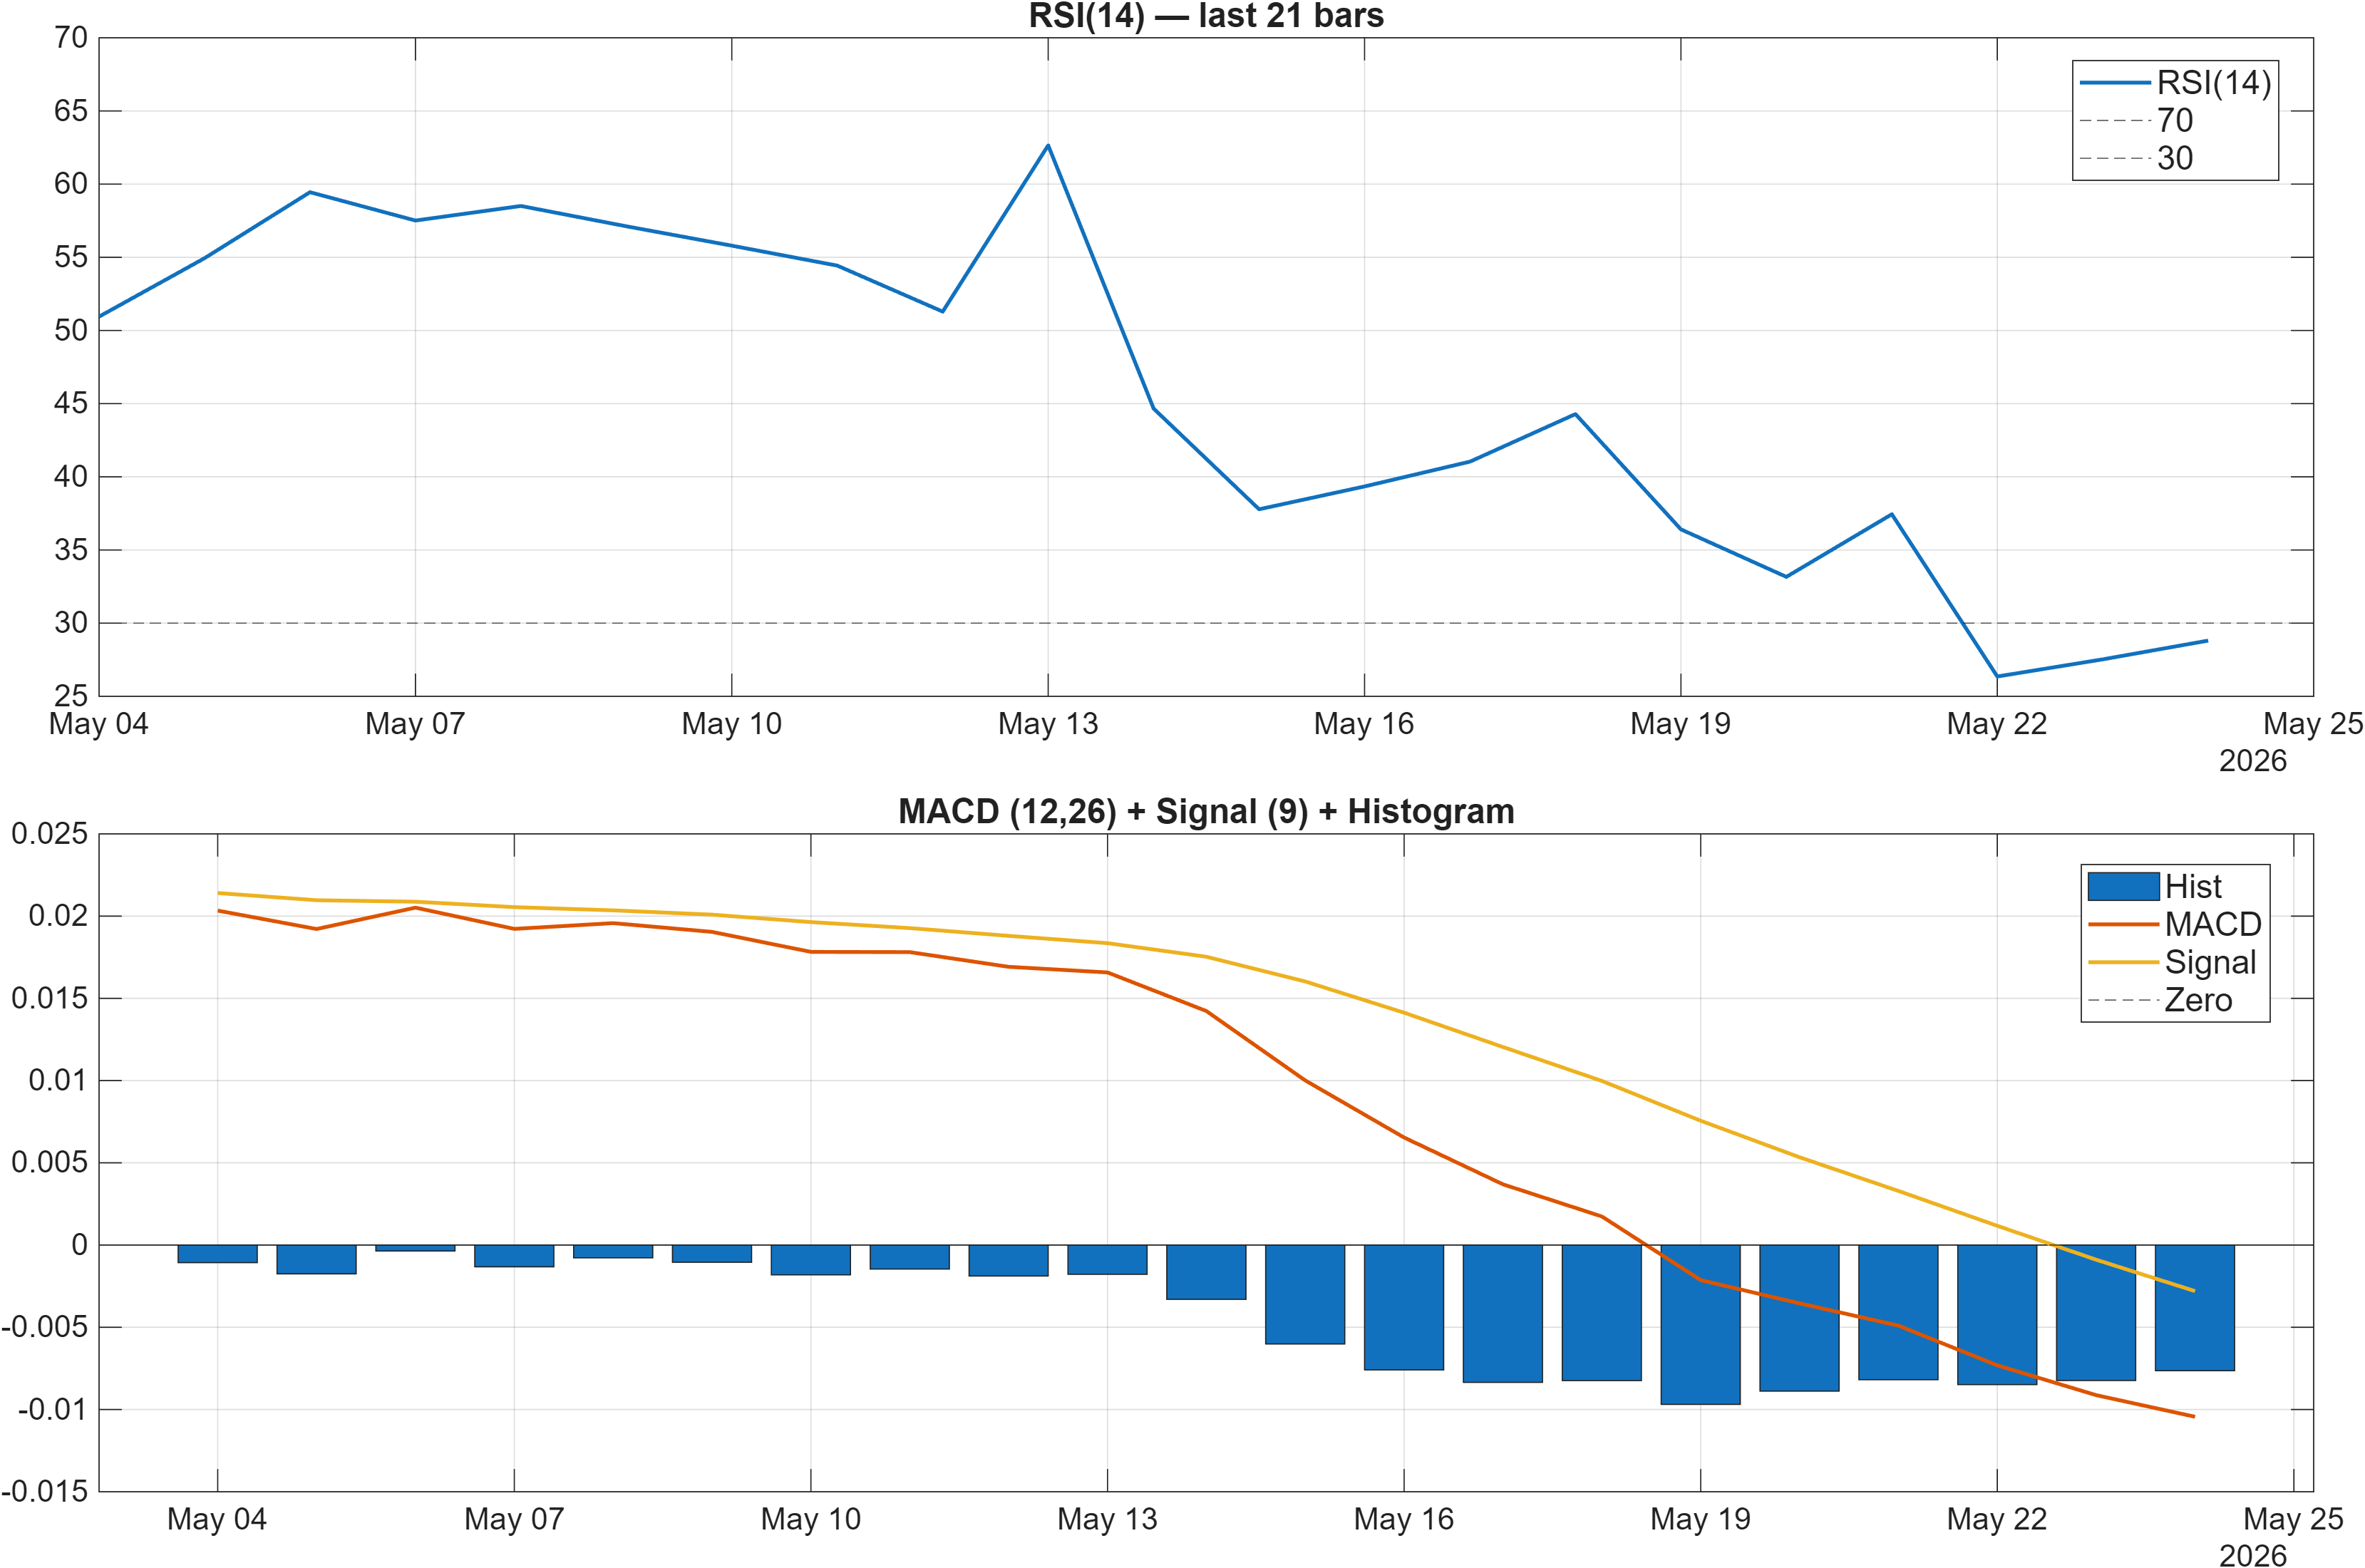
Momentum readings tilt defensive. The RSI bias is flagged Bearish, and the specific RSI(14) print in the signal set is 28.81, a level that commonly coincides with downside momentum dominance rather than balanced two-way trade. At the same time, MACD is not merely soft—it is directionally negative with a MACD histogram of -0.00764 (also summarized as -0.0076 in the dashboard interpretation). Together, those two indicators argue that recent price pressure has been persistent enough to keep trend-following momentum models on the sell side.
The volatility backdrop is more nuanced. Bollinger Bandwidth is reported at 0.0256 (signal table: BB Width 0.02558), which suggests moderate dispersion rather than a high-volatility breakout regime. That matters because bearish momentum combined with only moderate volatility can indicate a controlled drift lower, not necessarily capitulation. It also means reversal attempts may struggle to gain traction unless volatility expands alongside improving momentum.
Looking across the momentum cluster, additional measures reinforce the bearish tone without implying a full trend collapse. The 20-period rate-of-change shows ROC(20) at -1.17, and time-series momentum prints TS Mom(20) at -0.0573 with TS Accel at -0.0751. This combination is consistent with downside persistence (momentum negative) and limited evidence of stabilization (acceleration also negative).
The net read is a momentum-heavy divergence versus the longer-horizon ranks: models anchored to longer windows remain favorable (#22 and #43), while shorter-cycle oscillators and trend accelerations are still pointing lower. Until RSI recovers from 28.81 and MACD histogram improves from -0.00764, momentum remains the stricter constraint on bullish follow-through.
Interpretation: RSI bias = Bearish, MACD hist = -0.0076.
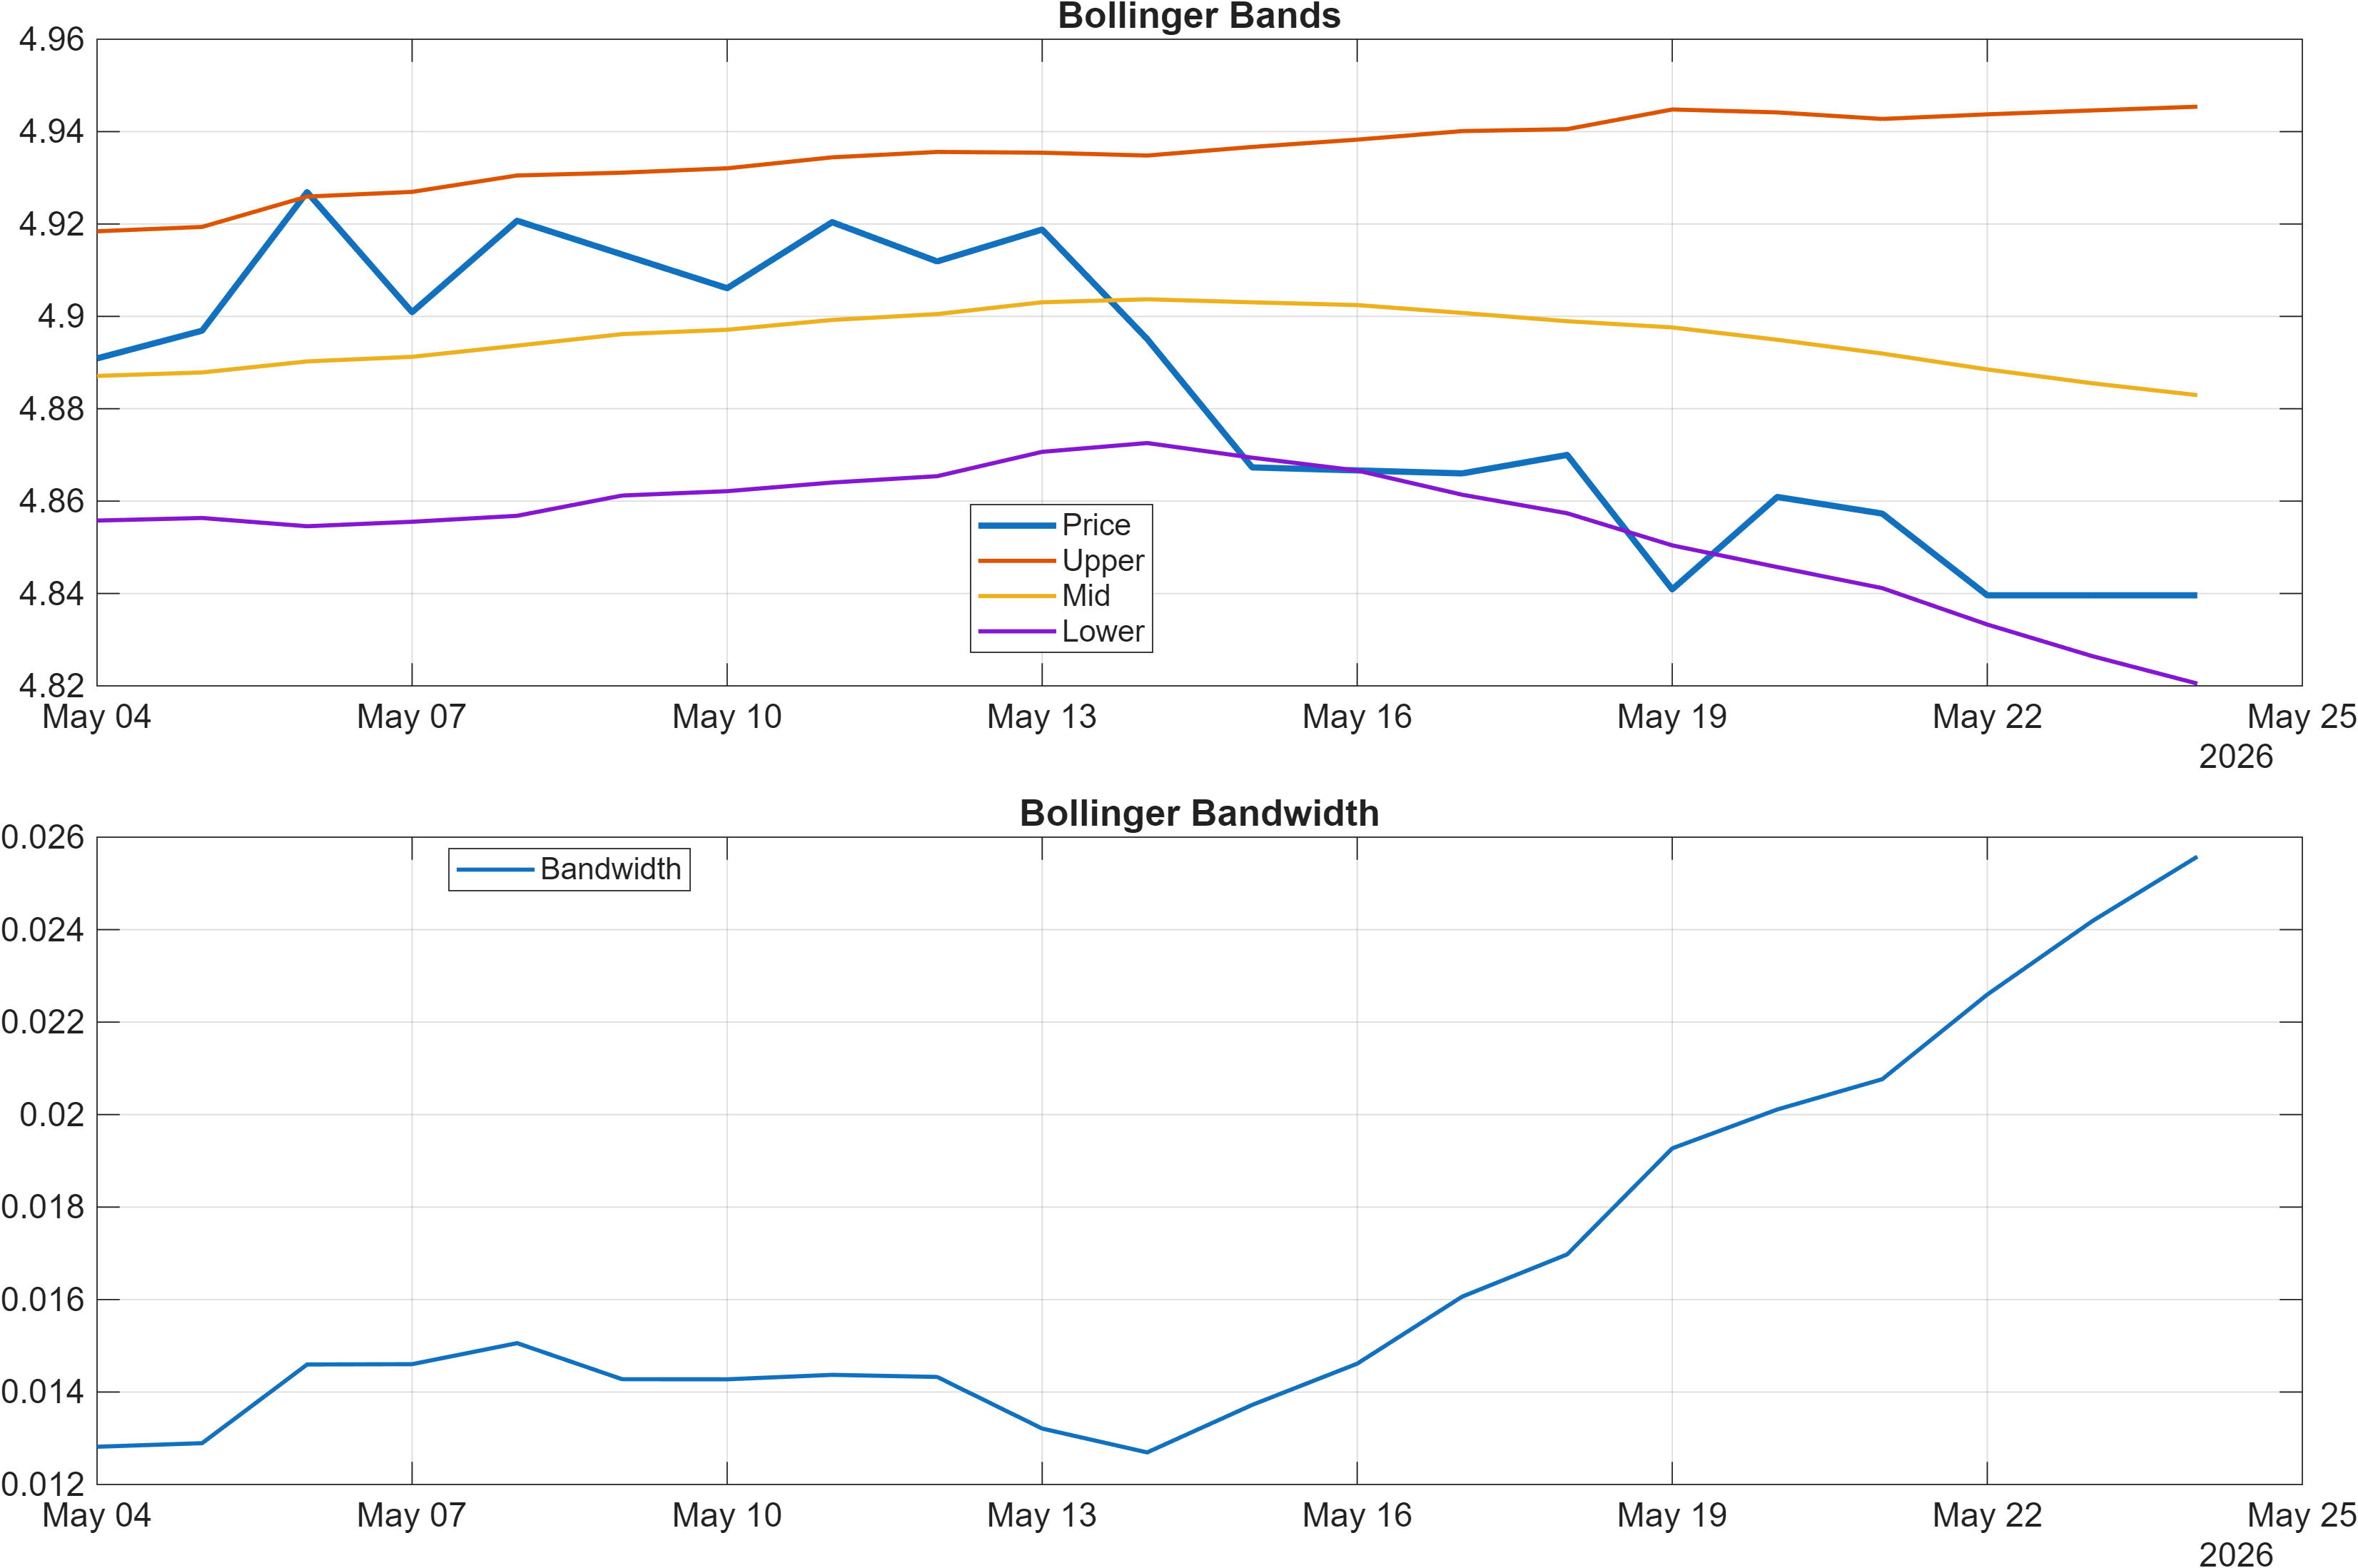
Interpretation: Bandwidth (volatility regime) latest = 0.0256.
4) Support / Resistance zones
The level map is clean and tight enough to matter: support ~4.7363 and resistance ~4.9268. With the moving-average view mixed (close below MA50 but MA50 above MA200) and momentum bearish (RSI(14) 28.81; MACD histogram -0.00764), these zones function less like simple “targets” and more like regime boundaries.
From a structure standpoint, the near-term bears typically need repeated acceptance below resistance and failed rebounds to keep pressure on. Conversely, a bullish continuation case requires the market to demonstrate that the recent momentum drawdown is not a trend break. The provided scenario guidance is consistent with that framework: a break above 4.9268 supports continuation, while a close below 4.7363 increases deterioration risk.
Volatility context helps interpret how these levels might behave. With Bollinger Bandwidth around 0.0256, the market is not signaling an aggressive expansion phase. In moderate-volatility regimes, support/resistance zones often contain price longer, and breaches—when they occur—tend to be more meaningful because they happen without the “excuse” of broad volatility shock. That increases the analytical weight of a confirmed close below 4.7363, especially given the bearish momentum stack.
The signal table also adds subtle context: the 20-day high is 4.948 (HHIGH(20)) and the 20-day low is 4.824 (LLOW(20)). Resistance at 4.9268 sits near the recent high region, reinforcing it as a plausible supply area. Meanwhile, support at 4.7363 is below the reported 20-day low, implying that a move into that zone would represent a deeper drawdown than the immediate 20-day range.
Net: treat 4.7363–4.9268 as the decision corridor where the market either re-asserts the longer-horizon constructive bias (ranks #22/#43) or validates the near-term bearish momentum impulse.
Support ~ 4.7363 | Resistance ~ 4.9268
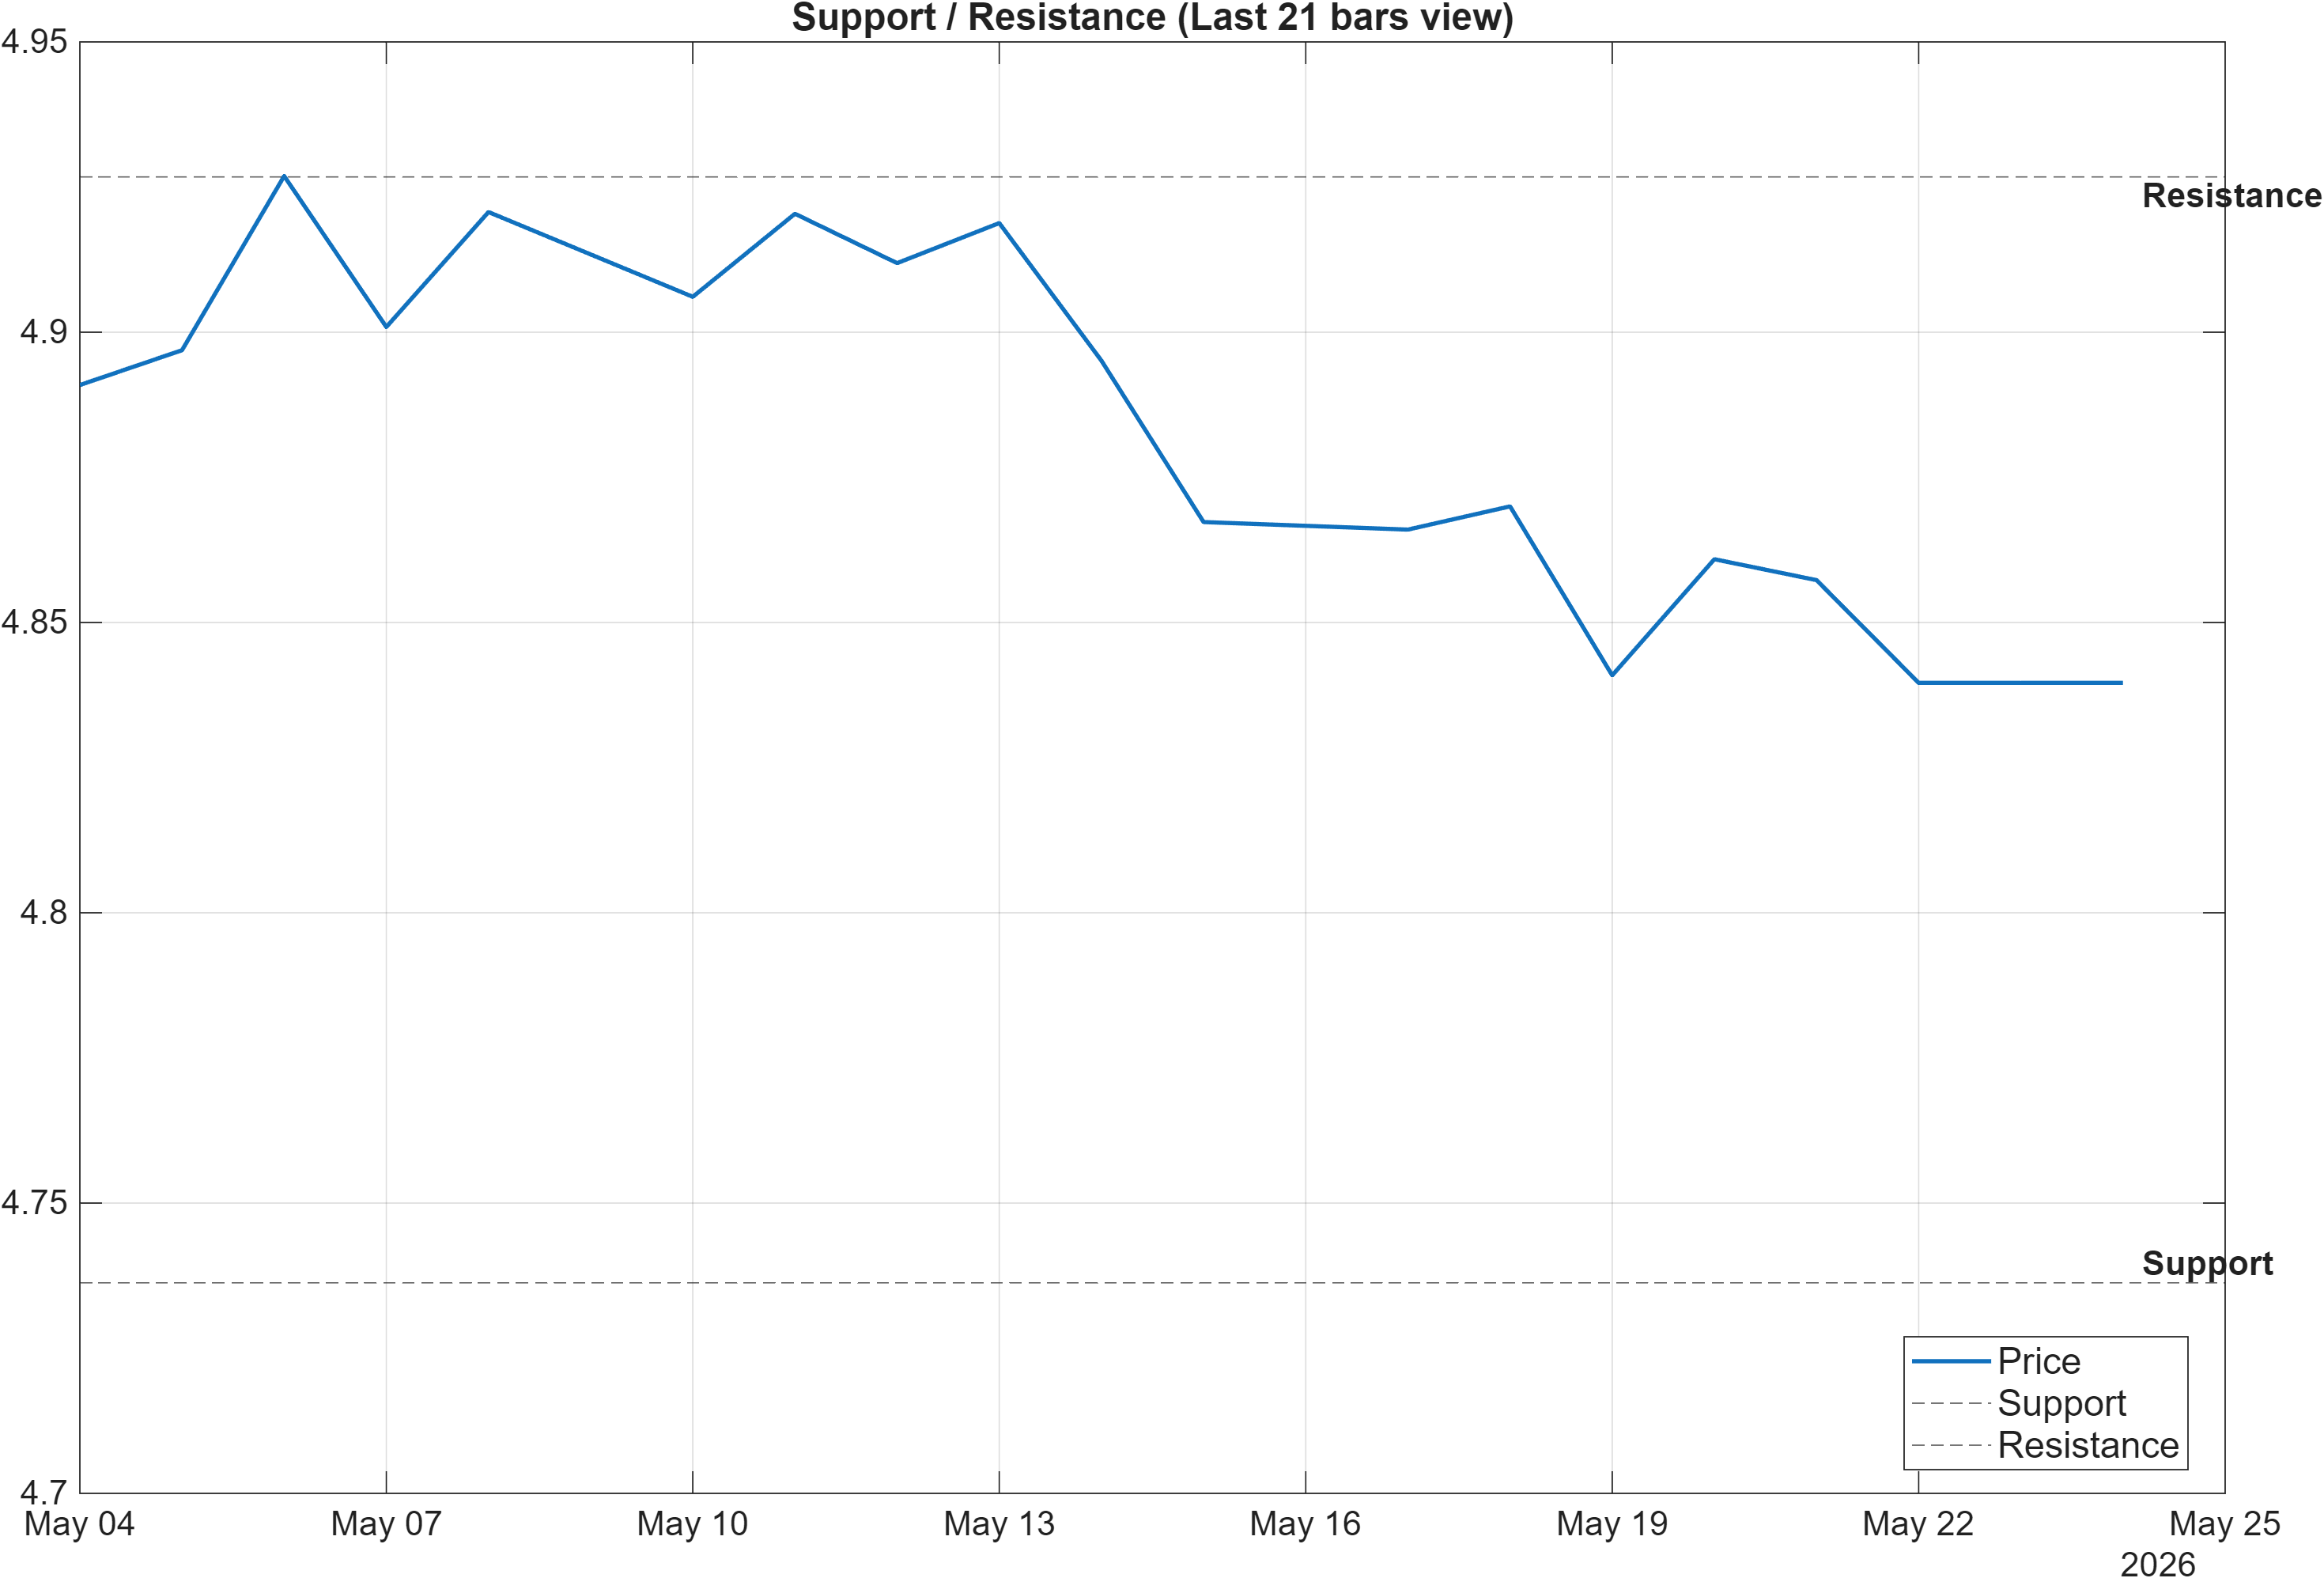
Scenario view: Break above resistance with volume → continuation. Close below support → signal deterioration risk.
5) Quant Technical Dashboard (18 Signals)
KGNAI AI Technical Analysis Score (Deep Reinforcement Learning): Rank #829 out of 961 (Rank 1 represents the strongest technical positioning and a higher probability of favorable price behavior. As ranks increase toward the maximum, the probability of favorable outcomes weakens and bearish positioning becomes more dominant.) | Label: Bearish | Score: -0.725
18-Signal Technical Confluence Score: -0.222 (Neutral)
Overall Technical Score (18-signal confluence + DRL rank blend): -0.373 (Bearish)
Note: The blended score reflects signal strength weighted against broader AI technical ranking, which may temporarily diverge.
Blended technical score breakdown: -0.373 (Bearish | Bull 2 / Bear 6 / Neutral 10)
The technical dashboard is a study in score compression: most indicators are neutral (10 of 18), yet the blended output still tilts bearish. The first layer—the 18-signal confluence—prints -0.222, labeled Neutral. The second layer—the AI technical ranking model—comes in materially weaker with a Deep Reinforcement Learning rank of #829 out of 961 and a score of -0.725, labeled Bearish. When blended, the Overall Technical Score is -0.373 (Bearish).
This blend matters because it indicates the system is penalizing the setup not due to broad-based bearish agreement across all indicators, but because the AI rank model reads the technical state as lower quality relative to the full universe. In practical interpretation, that often corresponds to fragile trend conditions: the market may show many “neutral” oscillators, yet the dominant features (trend, persistence, and drawdown behavior) still screen poorly in cross-sectional terms.
At the indicator level, the bearish drivers are concentrated in momentum and rate-of-change: MACD histogram -0.00764, RSI(14) 28.81, TS Mom(20) -0.0573, TS Accel -0.0751, ROC(20) -1.17, and Will A/D slope(10) -0.0555. Offsetting signals are limited: ADOSC 15.86 and MedPx vs Support 0.11 are labeled Bullish, suggesting pockets of accumulation/positioning support despite weak price momentum.
The resulting posture is not “uniform bearishness,” but a bearish tilt dominated by momentum decay—consistent with the near-term rank weakness (Daily #637; Weekly #698) even while the longer-horizon ranks stay supportive (#22; #43).
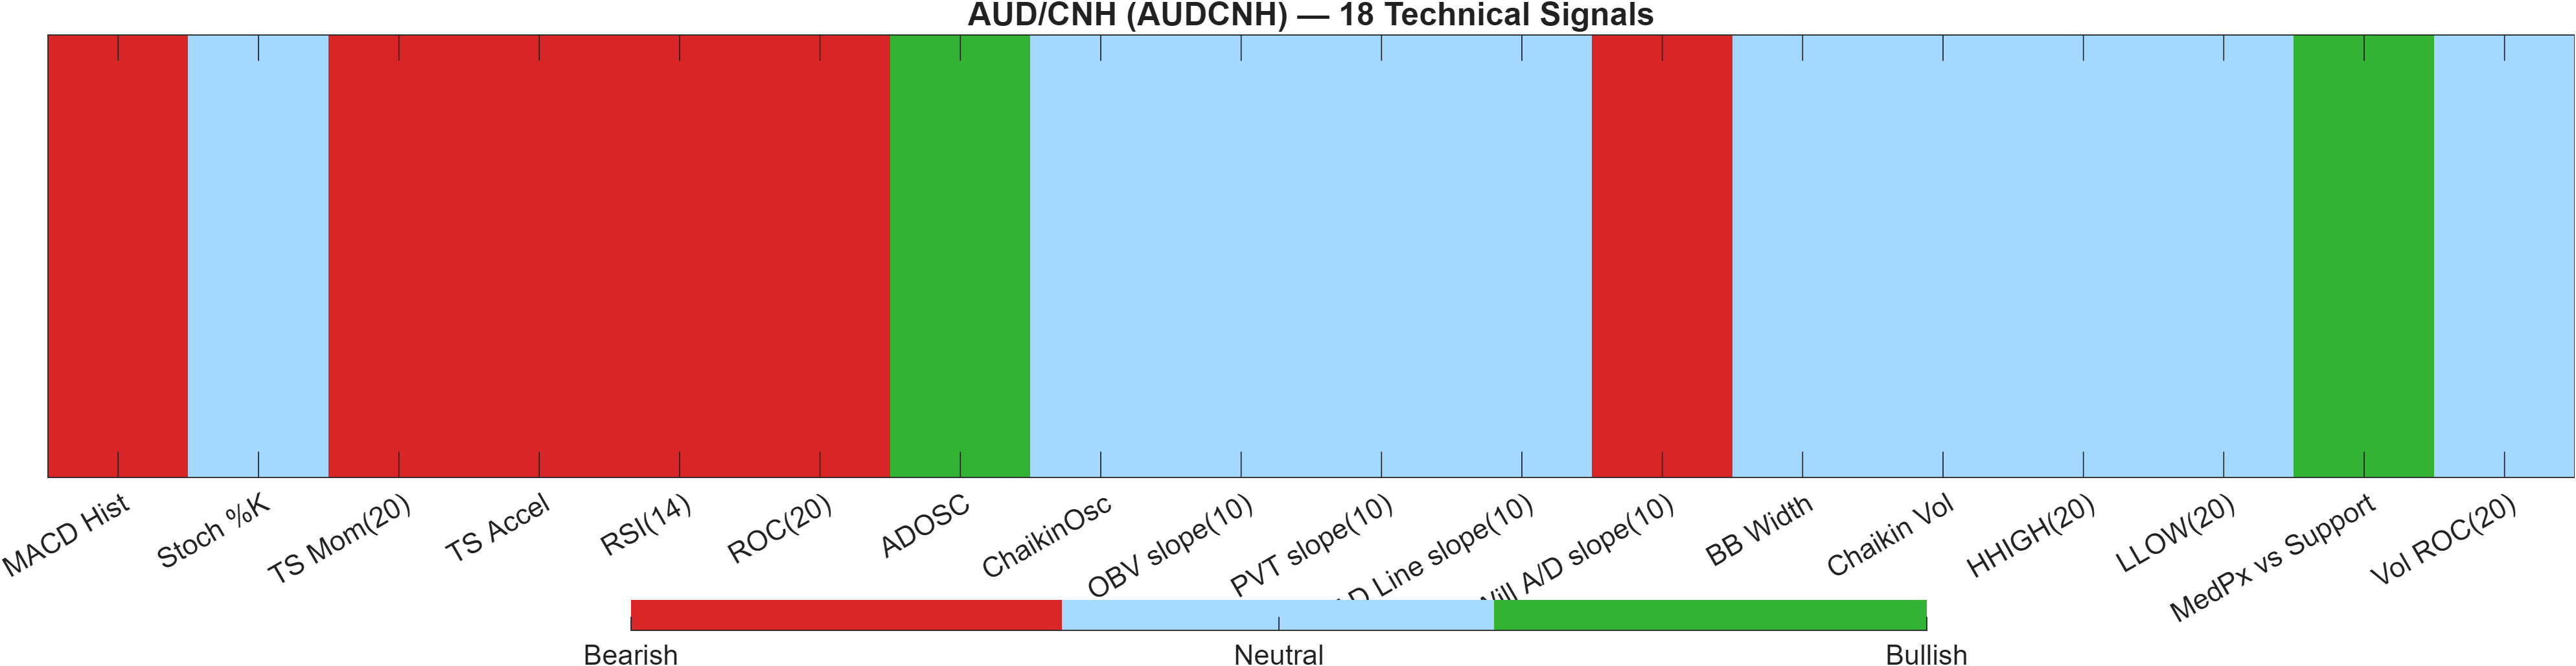
Signal table (Bull/Bear/Neutral)
| Indicator | Value | Signal |
|---|---|---|
| MACD Hist | -0.00764 | Bearish |
| Stoch %K | 21.64 | Neutral |
| TS Mom(20) | -0.0573 | Bearish |
| TS Accel | -0.0751 | Bearish |
| RSI(14) | 28.81 | Bearish |
| ROC(20) | -1.17 | Bearish |
| ADOSC | 15.86 | Bullish |
| ChaikinOsc | 0 | Neutral |
| OBV slope(10) | 0 | Neutral |
| PVT slope(10) | 0 | Neutral |
| AD Line slope(10) | 0 | Neutral |
| Will A/D slope(10) | -0.0555 | Bearish |
| BB Width | 0.02558 | Neutral |
| Chaikin Vol | -2.981 | Neutral |
| HHIGH(20) | 4.948 | Neutral |
| LLOW(20) | 4.824 | Neutral |
| MedPx vs Support | 0.11 | Bullish |
| Vol ROC(20) | — | Neutral |
Interpretation: Indicator-level signals form the base confluence, which is then adjusted using a separate AI-driven technical ranking model. The final technical score summarizes this combined view.
6) News sentiment + extractive gist
Note: Instrument-specific news matches were not found, so the digest includes broader market/sector headlines. Links are provided for verification.
Sentiment score (avg): 0.099 | Positive: 37% | Neutral: 38% | Negative: 25%
KGNAI AI News Sentiment Score (normalized -1 to +1): Not available (as of —) | Label: Not available | Overall news score: 0.10
Positive Developments
Recent coverage across major financial outlets indicates a modestly constructive macro-news mix, dominated by shifting expectations around central bank policy and intermittent optimism tied to geopolitical negotiation headlines. The aggregate tone is not instrument-specific for AUD/CNH, but it can still influence FX risk appetite and USD/CNH dynamics through rates, energy-linked inflation sensitivity, and broader volatility conditions. In this digest, the positive skew is reflected in the distribution—37% positive versus 25% negative—while the average sentiment remains only mildly above neutral at 0.099. In practical market terms, that profile is consistent with “supportive headlines” that may stabilize risk pricing without reliably driving trend continuation. For AUDCNH, this matters because technical momentum is currently weak (RSI(14) 28.81; MACD histogram -0.00764), meaning positive macro tone is more likely to act as a buffer than as a catalyst unless it coincides with a technical reclaim of resistance near 4.9268.
Neutral / Mixed Developments
The neutral bucket remains substantial at 38%, reinforcing that the information flow is largely interpretive rather than definitive. Coverage has emphasized range conditions and data dependence—an environment where FX pairs can oscillate around technical reference points without producing durable trend signals. For AUDCNH, that neutrality aligns with KGNAI’s short- and mid-horizon ranks (Daily #637, Weekly #698), which also read as Neutral rather than strongly directional. When the news tape is mixed and the volatility regime is moderate (Bollinger Bandwidth ~0.0256), markets often prioritize positioning and level-based execution. This reinforces the value of treating 4.7363 and 4.9268 as decision zones rather than expecting the sentiment balance (avg 0.099) to dominate price behavior on its own.
Negative / Risk Signals
Risk signals in the broader digest are primarily associated with elevated uncertainty and episodic headline-driven moves. Even with a slightly positive average sentiment (0.099), the 25% negative share matters because it can amplify downside follow-through when technicals are already stressed. That is the current setup for AUDCNH: momentum readings are bearish (RSI(14) 28.81) and the blended technical output is -0.373 (Bearish) alongside a weak AI technical rank (#829 of 961). In such conditions, negative macro surprises or risk-off impulses can more easily translate into support tests. The key risk marker in this report is structural: a confirmed close below 4.7363 would shift the technical narrative from “pullback within structure” toward “deterioration,” especially if MACD histogram remains negative near -0.00764 and volatility begins to expand from the current bandwidth baseline (~0.0256).
- Whether price action can reclaim and hold above 4.9268 alongside improving momentum (RSI and MACD).
- Any shift from moderate to expanding volatility (Bandwidth ~0.0256) that would increase breakout/trend risk.
- Whether downside probes hold 4.7363, limiting confirmation of the bearish blended technical score (-0.373).
Sources referenced: Reuters, Bloomberg, Yahoo Finance, MarketWatch, Investing.com
Snapshot: AI Rank (Short–Mid–Long): Mixed (Neutral–Neutral–Bullish) · Technical Confluence: Neutral · Key Levels: Support ~4.74 | Resistance ~4.93 · News Sentiment: Neutral
7) Sources
- Singapore Dollar: Mild bullish against US Dollar within tight range – UOB — https://www.fxstreet.com/news/singapore-dollar-mild-bullish-against-us-dollar-within-tight-range-uob-202605222112
- AUD/USD Price Forecast: Stuck between key SMAs as RSI turns bearish — https://www.fxstreet.com/news/aud-usd-price-forecast-stuck-between-key-smas-rsi-turns-bearish-202605222007
- ASEAN-6 inflation: Pipeline pressures and rate risks – DBS — https://www.fxstreet.com/news/asean-6-inflation-pipeline-pressures-and-rate-risks-dbs-202605221951
- Chinese Yuan: Neutral within tight onshore band – UOB — https://www.fxstreet.com/news/chinese-yuan-neutral-within-tight-onshore-band-uob-202605221908
- Singapore Dollar: Buy dips against dollar in choppy range – OCBC — https://www.fxstreet.com/news/singapore-dollar-buy-dips-against-dollar-in-choppy-range-ocbc-202605221835
- Silver Price Forecast: XAG/USD remains range-bound with RSI and MACD signaling weak momentum — https://www.fxstreet.com/news/silver-price-forecast-xag-usd-remains-range-bound-with-rsi-and-macd-signaling-weak-momentum-202605221816
- Gold price slips as Waller’s hawkish comments lift USD — https://www.fxstreet.com/news/gold-price-slips-as-wallers-hawkish-comments-lift-usd-202605221810
- South Korea: Hawkish BoK tilt supports Won – ING — https://www.fxstreet.com/news/south-korea-hawkish-bok-tilt-supports-won-ing-202605221734
You may also like: How KGNAI AI ranks instruments across global markets
Disclaimer: KGNAI provides AI-generated analytics and educational market commentary only. This is not financial advice. Markets involve risk. Always do your own research.