
CZKDKK (Czech Koruna/Danish Krone) — 22-May-2026 Neutral ranks with modest bullish technical confluence
CZKDKK is currently characterized by neutral cross-universe positioning alongside a mildly constructive technical backdrop. KGNAI’s multi-horizon ranks remain centered in the middle of the 959-instrument universe (e.g., daily rank #454 and weekly rank #544), indicating the market is not displaying strong relative leadership or stress versus peers. By contrast, the technical layer shows improving structure: the Deep Reinforcement Learning technical rank is #163, and the blended technical score is 0.470 (Bullish), suggesting incremental upside bias without a fully directional regime shift. Momentum readings reinforce this “balanced” profile—RSI(14) at 52.94 and a MACD histogram near 0.0000 point to contained momentum, while Bollinger bandwidth at 0.0066 signals a relatively tight volatility regime. Key decision levels remain well-defined at support ~0.3040 and resistance ~0.3078.
- Rank stance (Short / Mid / Long): Neutral / Neutral / Neutral (daily #454, weekly #544, yearly #253 out of 959)
- Technical confluence label: Bullish (overall technical score 0.470; DRL rank #163)
- Key levels: Support ~0.3040 | Resistance ~0.3078
- News sentiment bias: Neutral (avg sentiment 0.062; 75% neutral)
- Confirmation / invalidation condition: A close above 0.3078 supports continuation; a close below 0.3040 increases deterioration risk
KGNAI evaluates assets using large cross-sectional datasets built from millions of structured data points. Inputs incorporate fundamental metrics, technical structures, and systematically processed news sentiment. Statistical models, machine learning, and AI frameworks are used to assess relative positioning, signal alignment, and probabilistic behavior across broad universes.
- Ranks are comparative across the tracked universe, not absolute price targets.
- Confluence reflects alignment among independent signal groups.
- Support/resistance levels are probabilistic decision zones, not guarantees.
- Sentiment provides contextual bias within the broader analytical framework.
1) KGNAI AI Analysis
Region: FOREX
Total universe size: 959 ranked instruments
- Daily rank: #454 out of 959 — Neutral
- Weekly rank: #544 out of 959 — Neutral
- Monthly rank: #372 out of 959 — Neutral
- 3-Monthly rank: #430 out of 959 — Neutral
- 6-Monthly rank: #302 out of 959 — Neutral
- Yearly rank: #253 out of 959 — Neutral
Cross-horizon KGNAI ranks place CZKDKK in a middle-of-universe posture rather than in the upper quartile (leadership) or lower third (weakness). The weekly rank (#544) sits more defensive than the daily rank (#454), a subtle sign that very short-term behavior may be marginally firmer than the intermediate backdrop. Meanwhile, the yearly rank (#253) is relatively stronger than the near-term ranks, implying that longer-horizon behavior has been more constructive even if current conditions are not expressing strong trend leadership.
This rank configuration is consistent with a market that is range-oriented or transitioning: enough stability to avoid poor long-run placement, but insufficient persistent impulse to climb into top-decile short-term positioning. For FX crosses, that typically aligns with periods where incremental price drift exists, but the broader opportunity set offers clearer relative setups elsewhere. The stated term view remains Neutral across short-, mid-, and long-term, reinforcing that KGNAI is not flagging a pronounced regime.
Practically, the rank layer argues for selectivity: treat upside signals as conditional on technical follow-through rather than as a stand-alone directional cue. The most useful application is comparing the technical layer (which is currently constructive) against the neutral ranks to identify whether the market is improving from average or merely oscillating within a stable band.
Term view: Short-term: Neutral. Mid-term: Neutral. Long-term: Neutral.
Want the full universe and complete rank tables? Unlock full access on KGNAI: https://www.kgnai.com/pricing
2) Price & trend overview
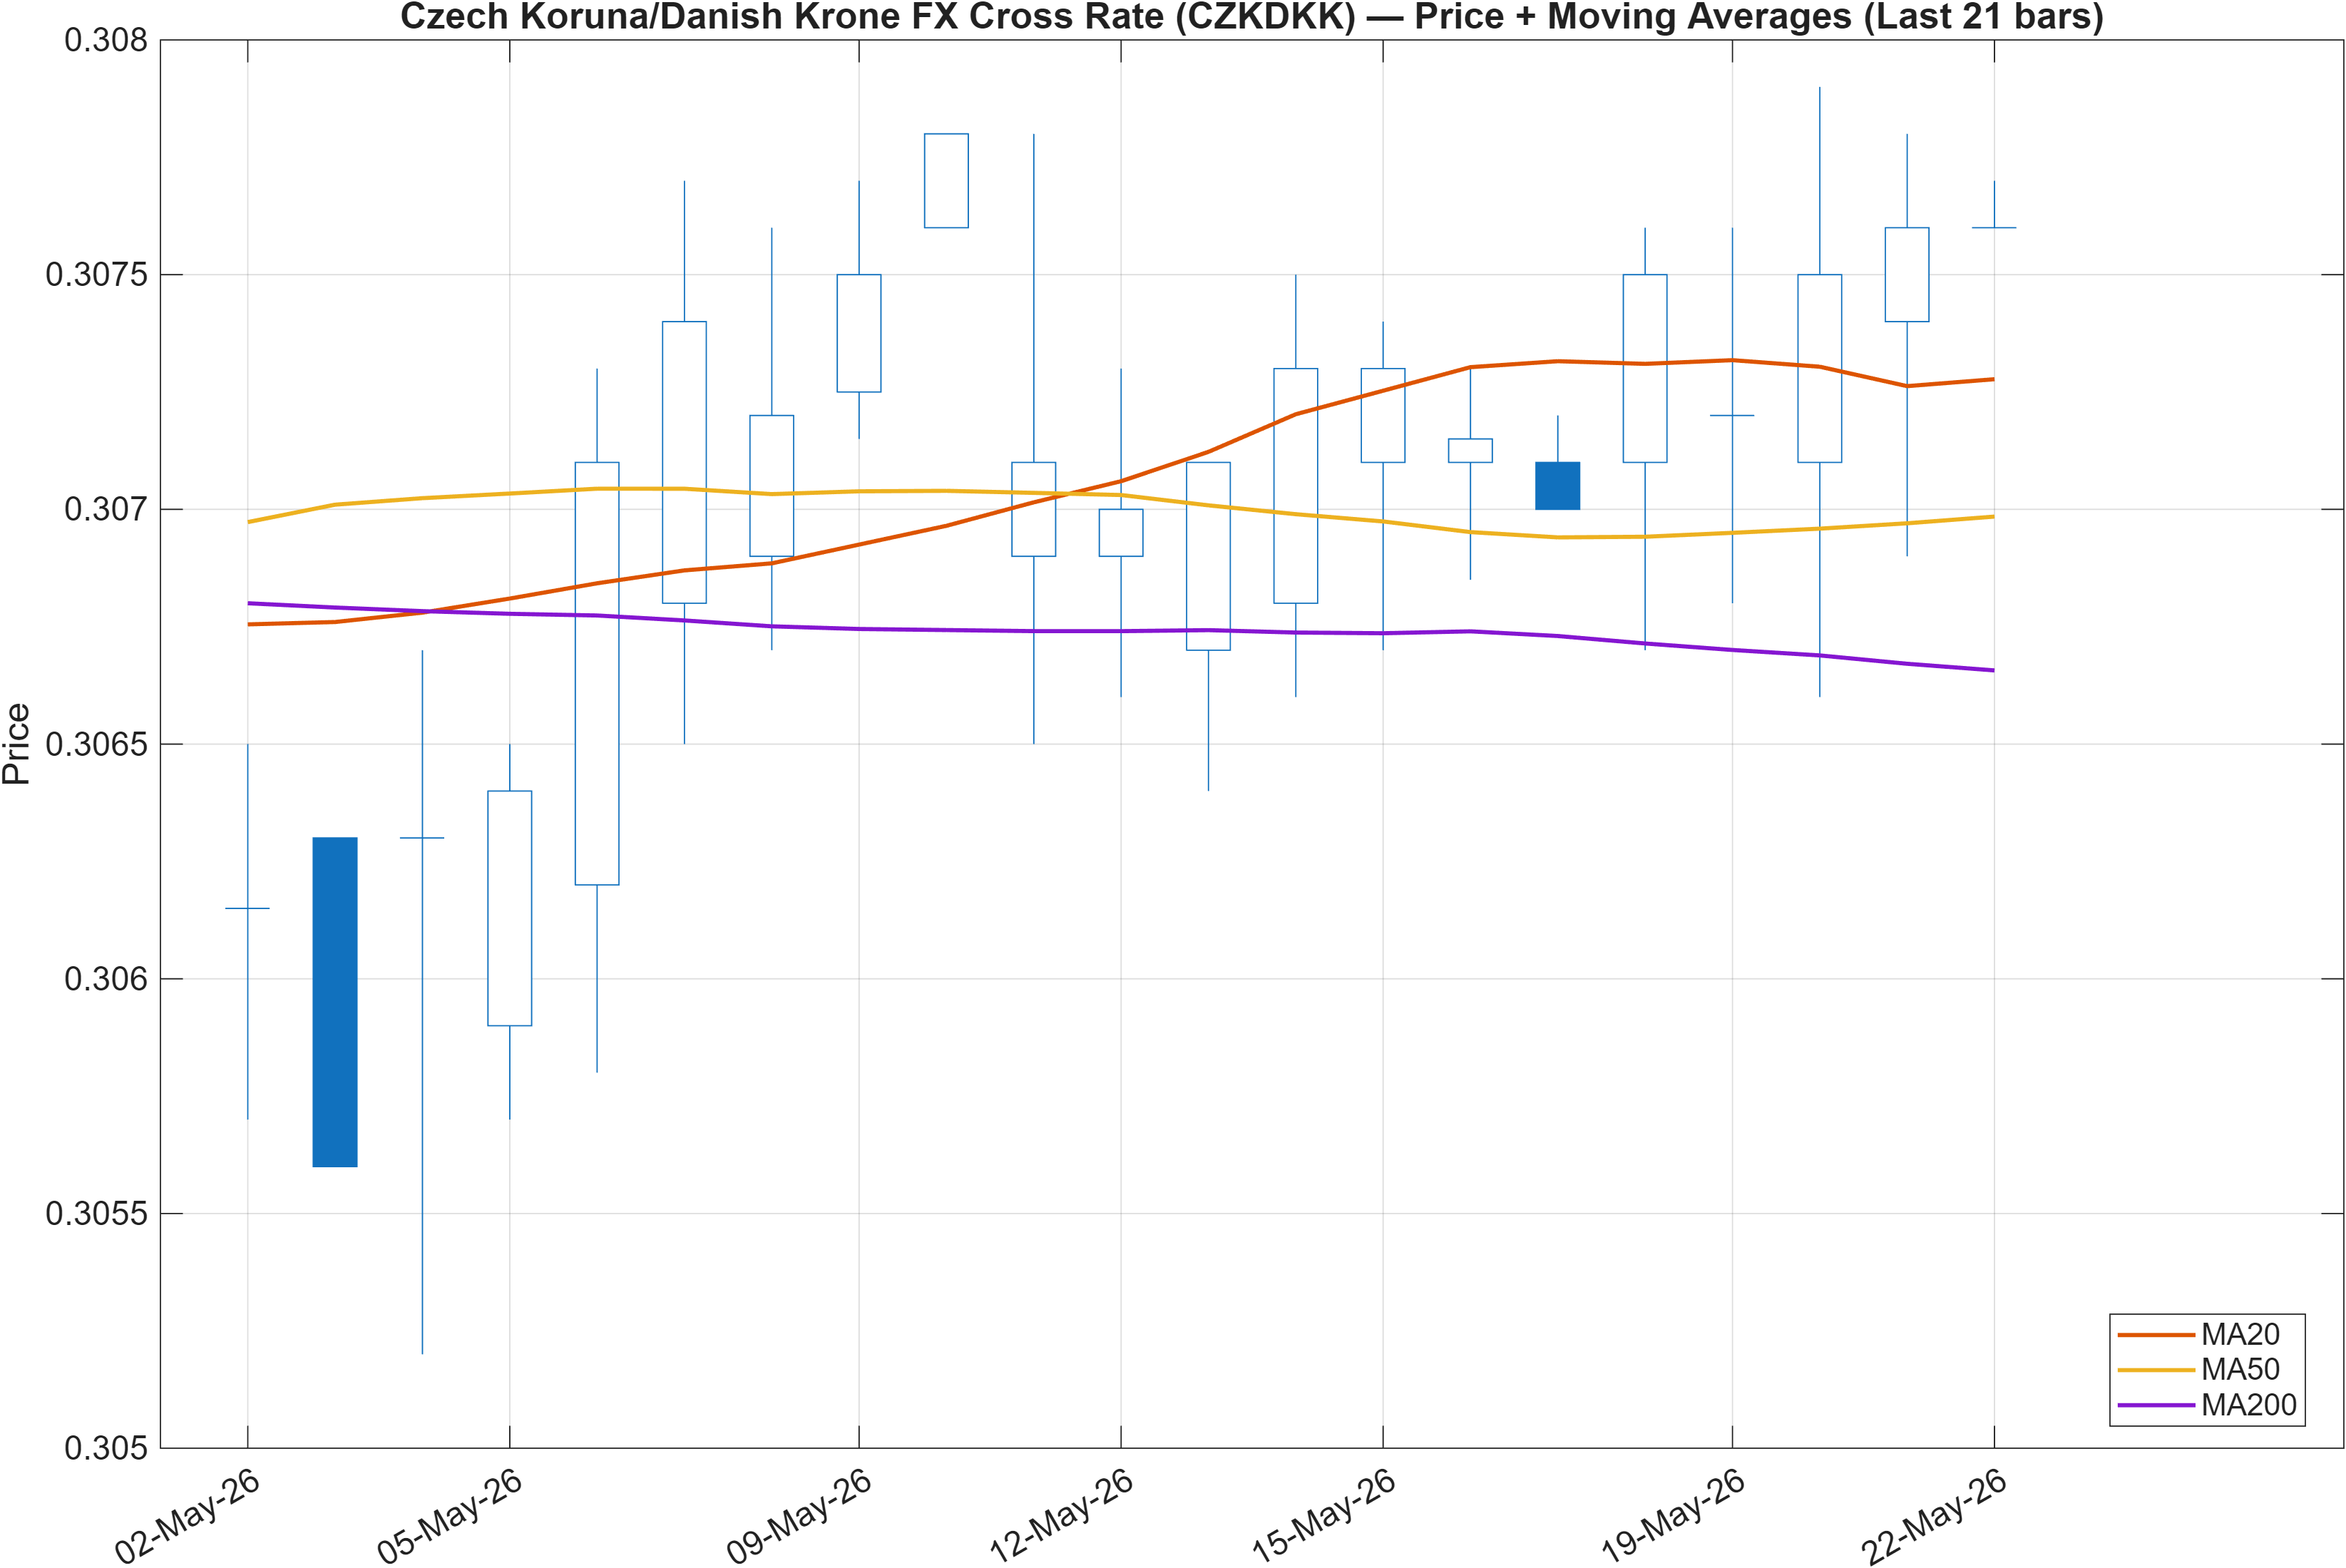
Interpretation: Close vs MA50 = Bullish, MA50 vs MA200 = Bullish.
The moving-average structure leans constructive: the close is above the MA50, and the MA50 is above the MA200. That pairing typically reflects a market with a positive trend “spine,” even when day-to-day momentum is muted. For a cross like CZKDKK, this configuration often corresponds to steady directional drift rather than sharp breakouts, particularly when volatility is contained elsewhere in the dashboard.
The analytical tension is that trend structure is positive while the rank layer is neutral (daily #454, weekly #544). This can occur when trend is present but not distinctive versus the broader FX universe—i.e., the pair is moving, but not with enough relative strength or persistence to be classified as a top opportunity. In that context, trend-following signals are best treated as conditional on continued support from momentum (RSI/MACD) and on a clean interaction with nearby structural levels.
When MA relationships are bullish but ranks remain mid-pack, the most common failure mode is trend fatigue that resolves into a sideways band. That is why pairing the MA read with the 0.3040 / 0.3078 decision zone is important: constructive MA structure is more actionable when price can sustain above resistance, and less reliable if price compresses back toward support while momentum remains neutral.
3) Momentum & volatility dashboard
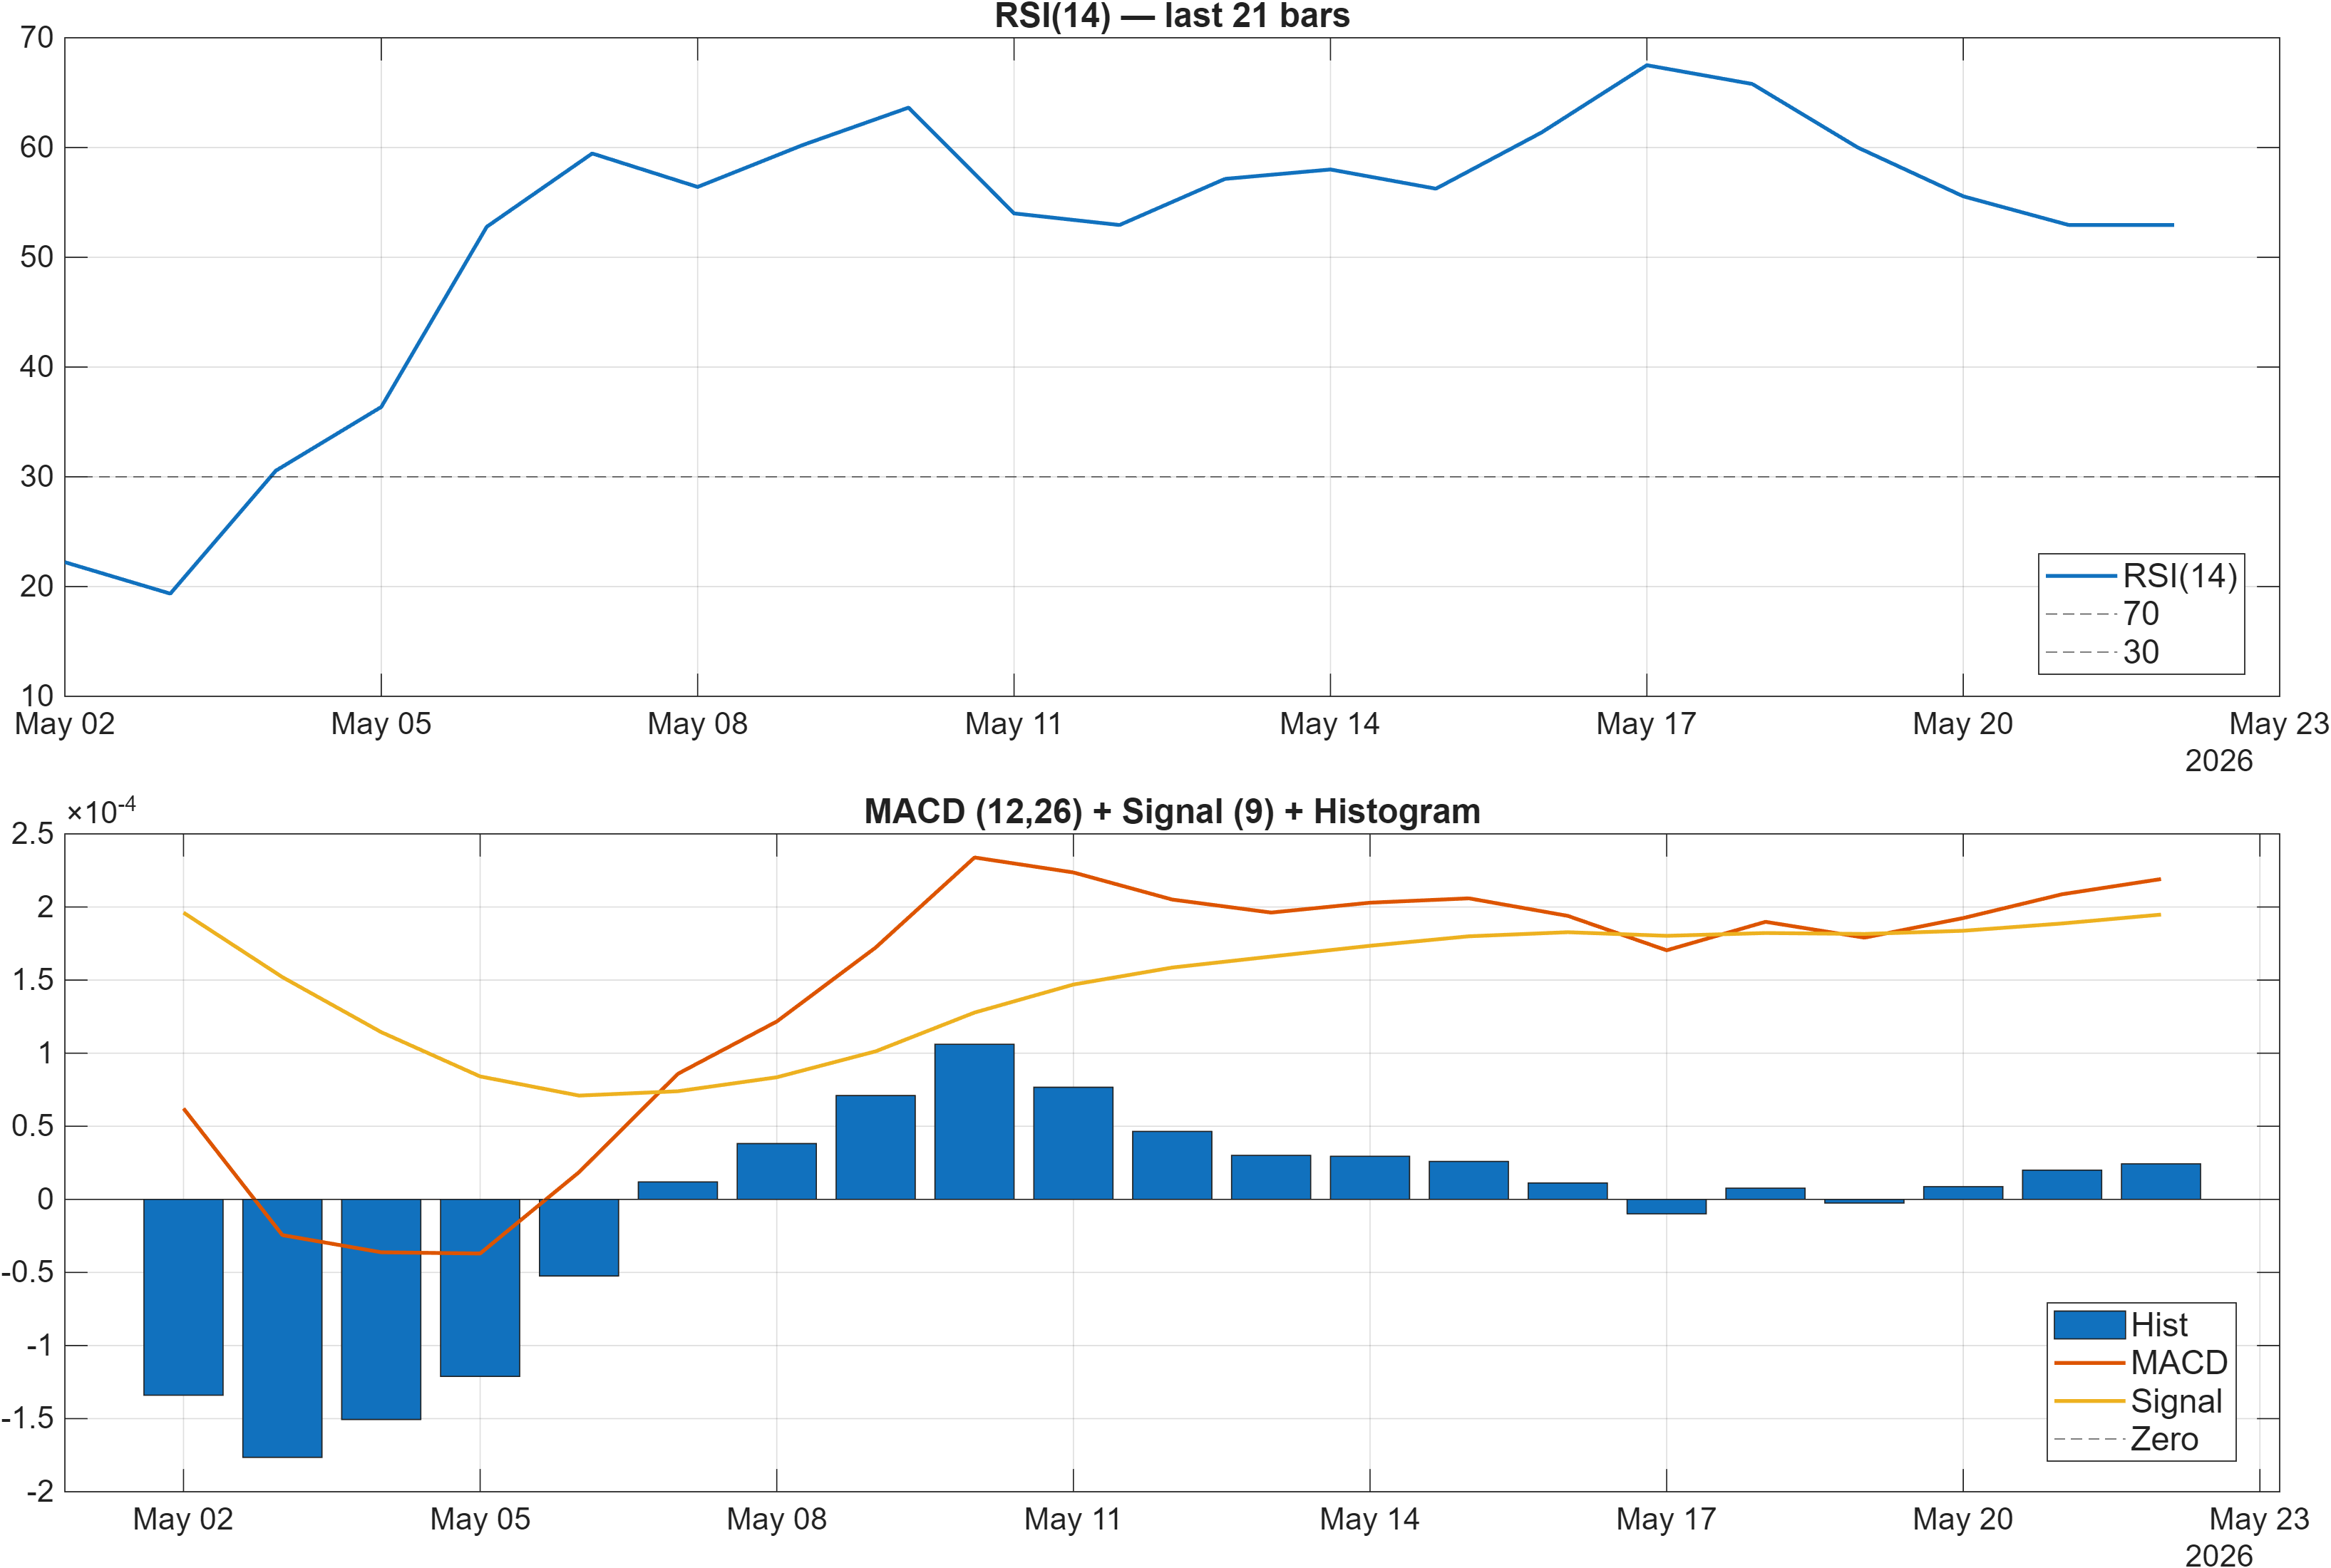
Interpretation: RSI bias = Neutral, MACD hist = 0.0000.
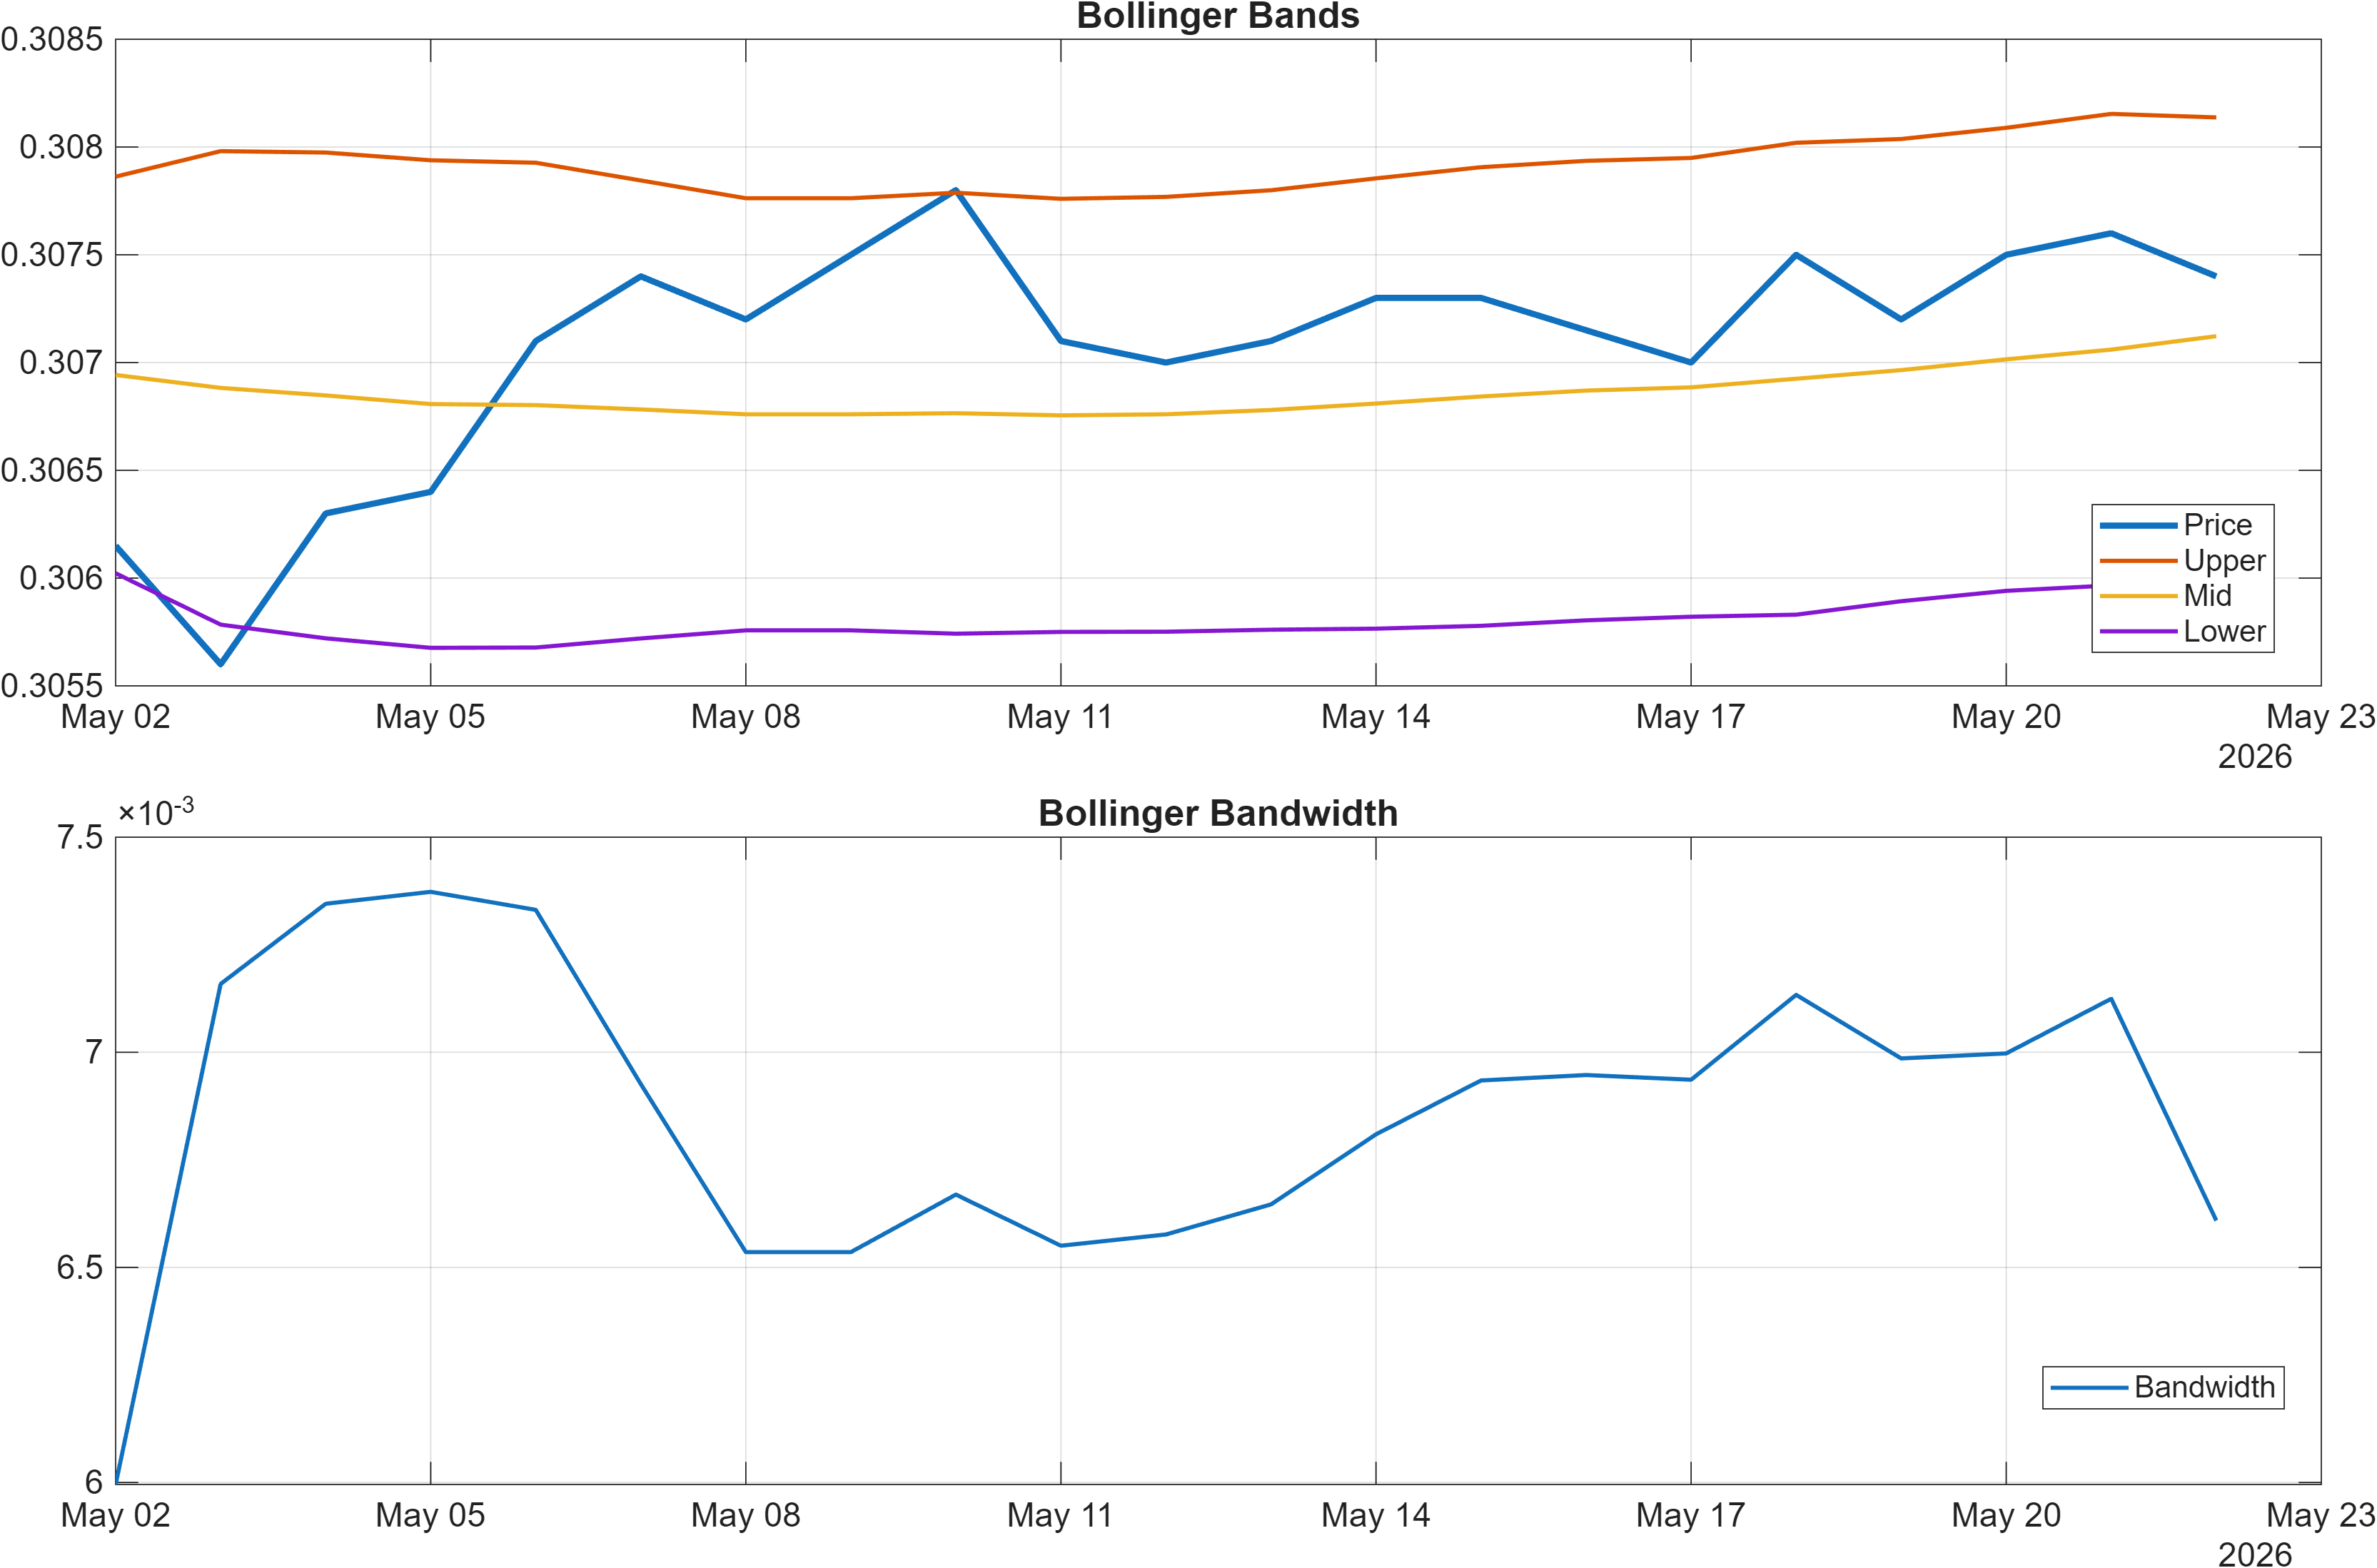
Interpretation: Bandwidth (volatility regime) latest = 0.0066.
Momentum is currently non-committal rather than overextended. RSI(14) at 52.94 sits close to the midline, consistent with balanced flows and limited directional urgency. The MACD histogram at 0.0000 reinforces the idea of a market near equilibrium—positive trend structure exists (per moving averages), but the incremental impulse is subdued.
Volatility conditions support that read. With Bollinger bandwidth at 0.0066, CZKDKK appears to be operating in a relatively tight regime, which tends to reduce follow-through on marginal momentum swings and increases the probability of “mean-reverting” behavior inside established boundaries. In practical analytical terms, tight bandwidth often precedes expansion—but it does not specify direction. Directional bias must therefore come from confluence across independent signals and from level breaks.
This is where the subtle divergence matters: the technical composite later flags bullish confluence, yet RSI/MACD are neutral. That combination typically describes a market with early-stage improvement (trend/micro-structure turning up) that has not yet converted into broad momentum confirmation. The cleaner confirmation would be a momentum lift while volatility begins to expand, ideally occurring near or through the 0.3078 resistance boundary.
4) Support / Resistance zones
Support ~ 0.3040 | Resistance ~ 0.3078
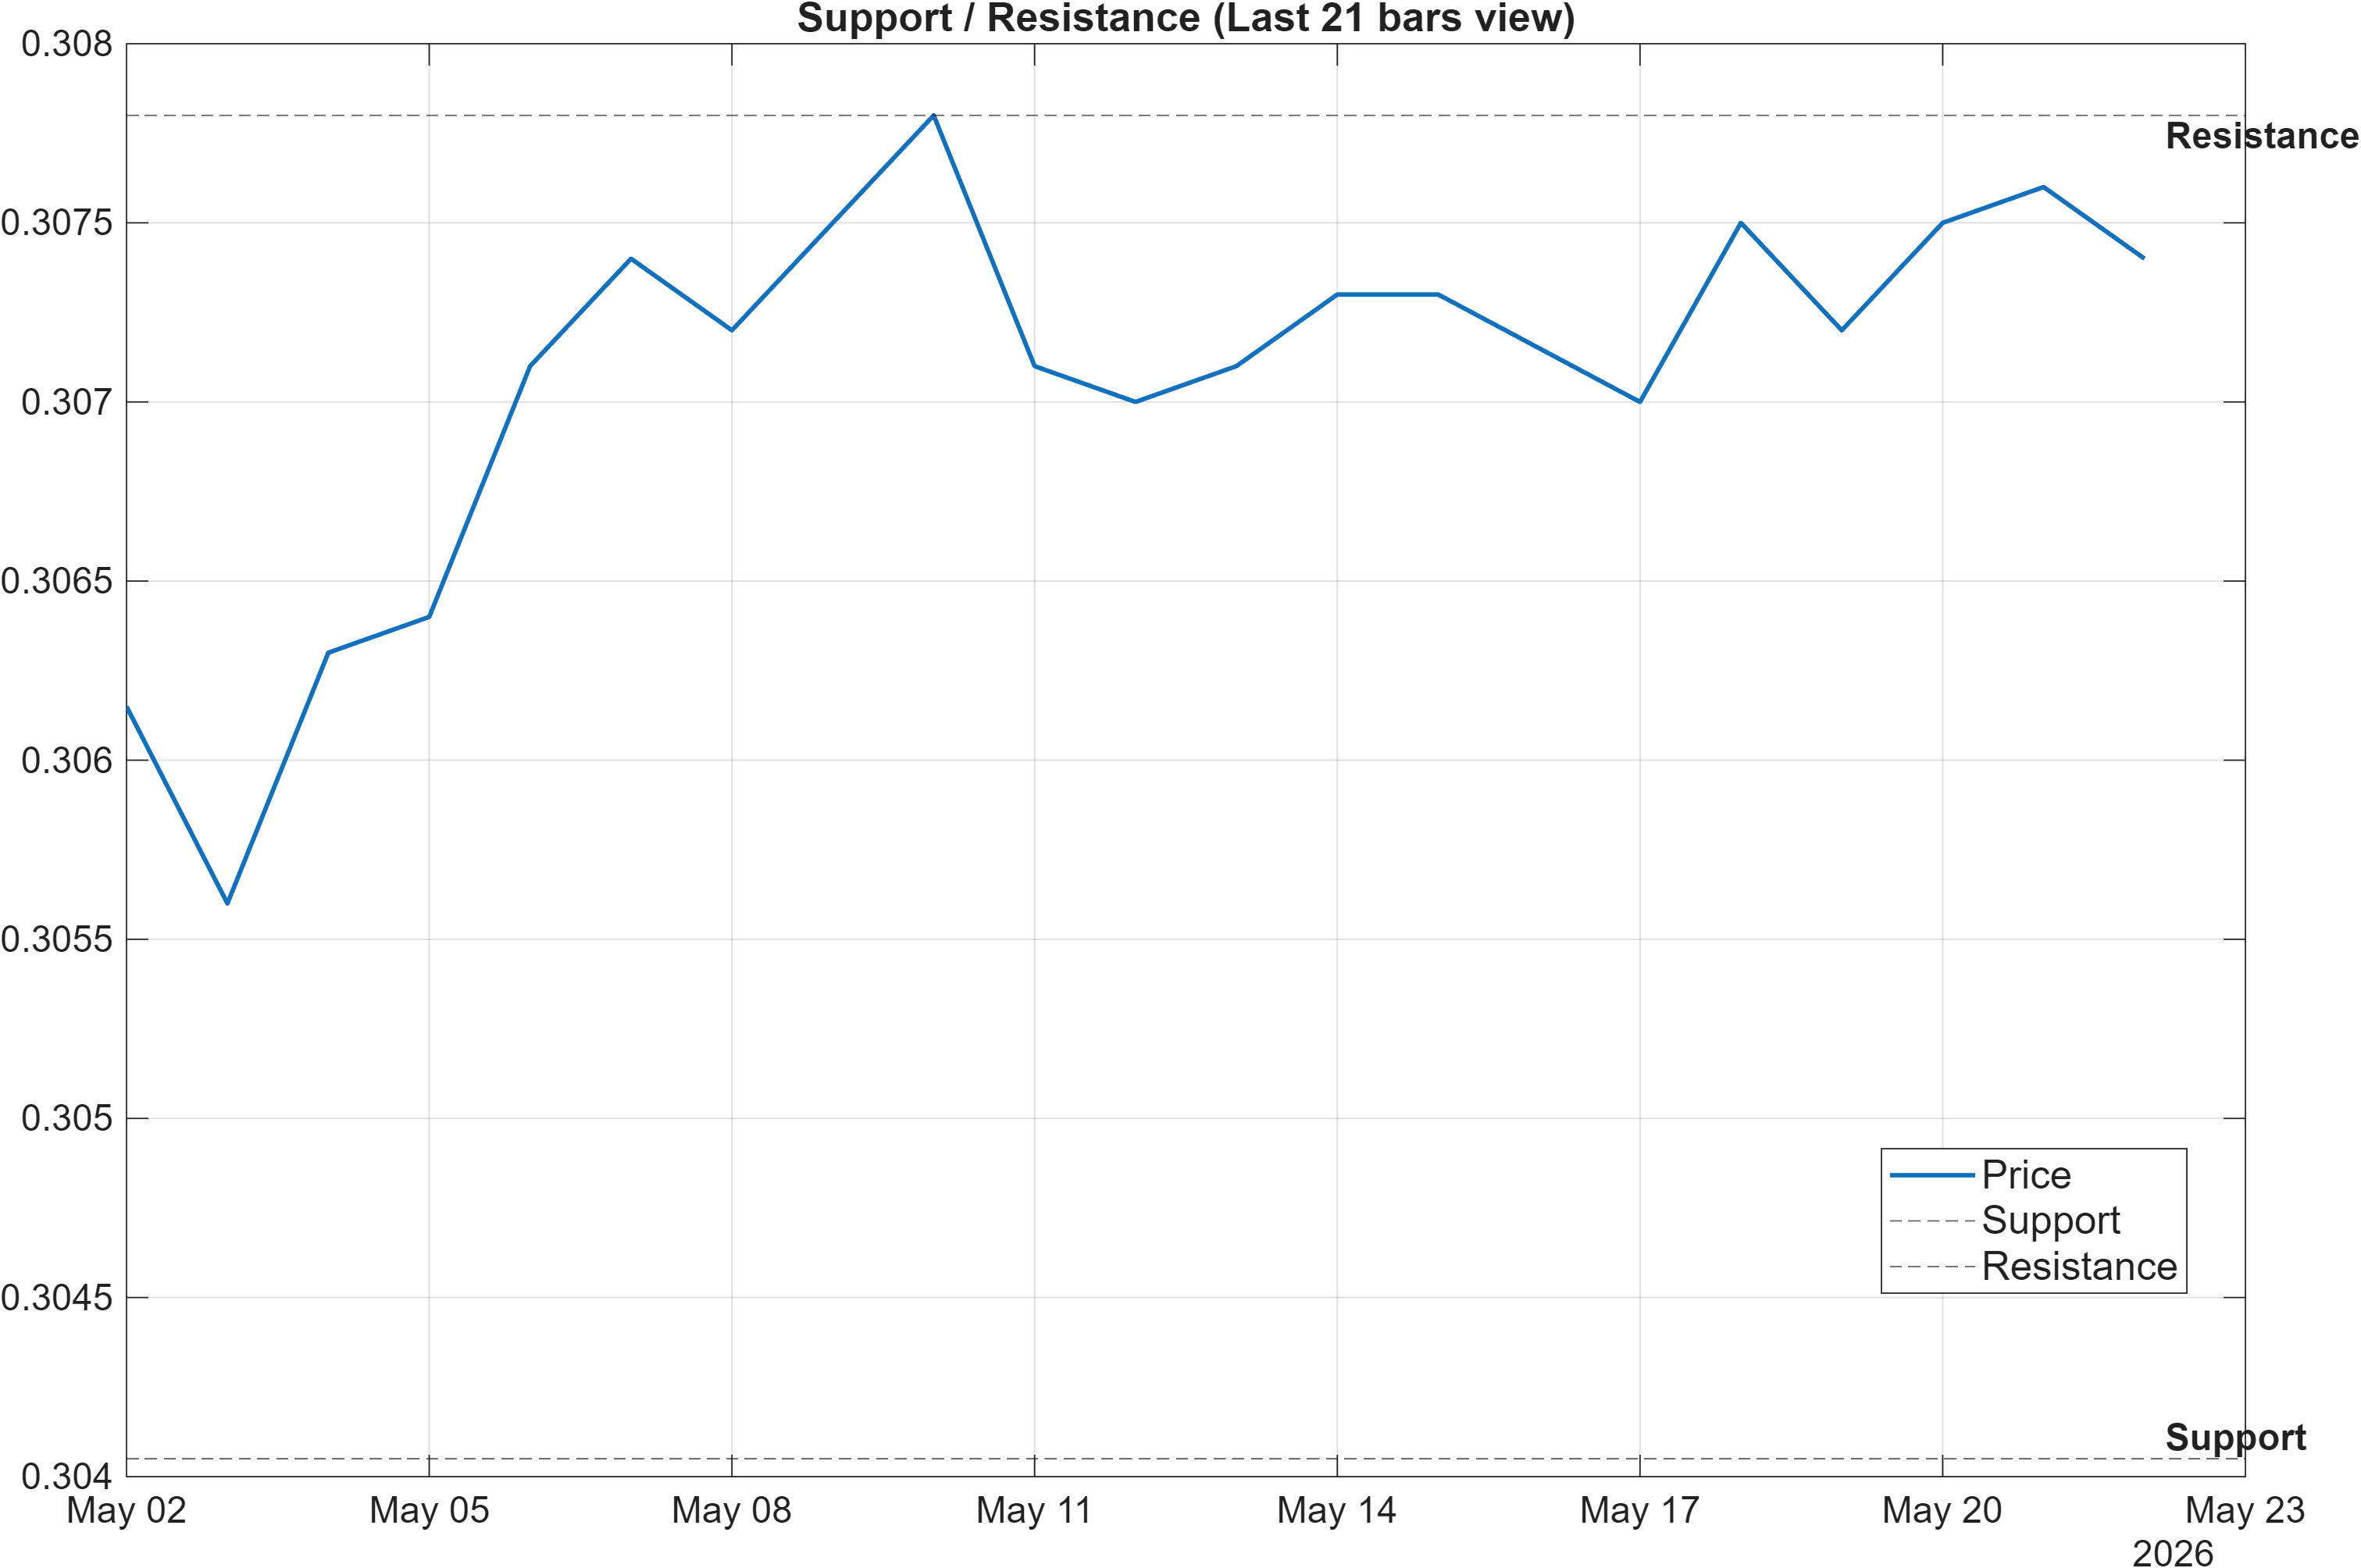
Scenario view: Break above resistance with volume → continuation. Close below support → signal deterioration risk.
The 0.3040 support and 0.3078 resistance define a compact operating range, which aligns with the neutral rank posture and the subdued momentum profile. In this configuration, levels tend to matter more than indicator micro-fluctuations: repeated acceptance above support implies trend stability, while rejection at resistance suggests the bullish moving-average structure is not yet converting into sustained upside.
With volatility tight (bandwidth 0.0066), level breaks can be prone to false starts unless accompanied by broader confirmation. That does not require forecasting volume (not provided here); it simply argues for observing whether price can hold above 0.3078 rather than briefly trade through it. Conversely, a close below 0.3040 would fit the deterioration condition already specified and would likely pressure the bullish technical narrative, particularly given that RSI is only slightly above 50 (52.94) and therefore lacks a large cushion.
The cleanest framework here is regime classification: as long as CZKDKK remains between 0.3040 and 0.3078, the market is effectively in a decision zone where mean reversion is plausible. The confluence case improves materially if resistance is converted into support; it weakens if support fails and the market re-enters a more defensive posture consistent with the mid-pack weekly rank (#544).
5) Quant Technical Dashboard (18 Signals)
KGNAI AI Technical Analysis Score (Deep Reinforcement Learning): Rank #163 out of 959 (Rank 1 represents the strongest technical positioning and a higher probability of favorable price behavior. As ranks increase toward the maximum, the probability of favorable outcomes weakens and bearish positioning becomes more dominant.) | Label: Bullish | Score: 0.660
18-Signal Technical Confluence Score: 0.389 (Bullish)
Overall Technical Score (18-signal confluence + DRL rank blend): 0.470 (Bullish)
Note: The blended score reflects signal strength weighted against broader AI technical ranking, which may temporarily diverge.
Blended technical score breakdown: 0.470 (Bullish | Bull 7 / Bear 0 / Neutral 11)
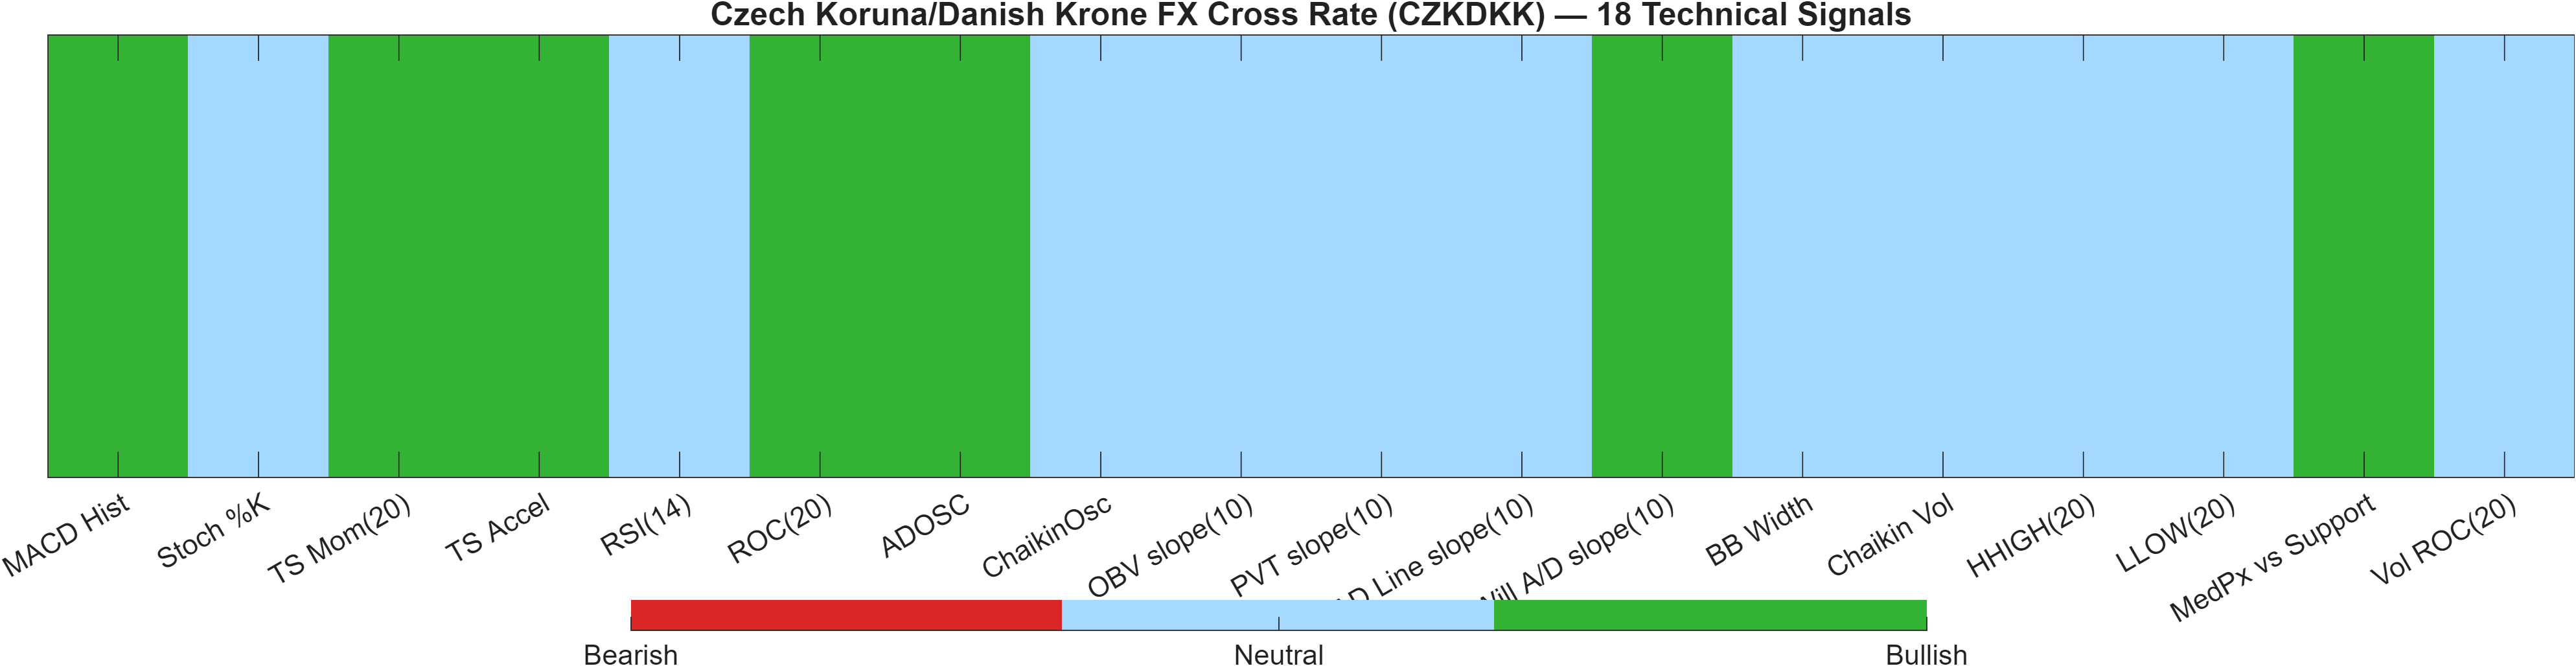
The technical dashboard is where CZKDKK looks most constructive. The DRL technical rank of #163 (out of 959) places the cross closer to the upper quintile than the middle, contrasting with the neutral universe ranks (e.g., daily #454). This is a classic “technical improvement vs relative neutrality” setup: the chart-based profile is firming, but the instrument is not yet a clear relative standout across horizons.
Confluence is bullish, but not aggressively so. The 18-signal confluence score (0.389) and the overall blended score (0.470) remain in bullish territory, with 7 bull signals, 0 bear signals, and 11 neutral. The absence of bear signals is supportive, yet the heavy neutral count indicates that many components are not strongly trending—consistent with RSI neutrality (52.94) and tight bandwidth (0.0066).
A useful way to read this blend is “constructive bias with limited breadth.” The bullish label is being carried by select momentum and rate-of-change components (e.g., the presence of bullish MACD histogram at the indicator level and positive time-series momentum inputs), while several participation/flow proxies remain neutral. That mix tends to perform best when price action can prove itself at nearby resistance (0.3078); without that, the dashboard can remain bullish while price oscillates inside a narrow band.
Signal table (Bull/Bear/Neutral)
| Indicator | Value | Signal |
|---|---|---|
| MACD Hist | 2.43e-05 | Bullish |
| Stoch %K | 80 | Neutral |
| TS Mom(20) | 0.002 | Bullish |
| TS Accel | 0.0034 | Bullish |
| RSI(14) | 52.94 | Neutral |
| ROC(20) | 0.589 | Bullish |
| ADOSC | 50 | Bullish |
| ChaikinOsc | 0 | Neutral |
| OBV slope(10) | 0 | Neutral |
| PVT slope(10) | 0 | Neutral |
| AD Line slope(10) | 0 | Neutral |
| Will A/D slope(10) | 0.00305 | Bullish |
| BB Width | 0.006609 | Neutral |
| Chaikin Vol | -15.6 | Neutral |
| HHIGH(20) | 0.3079 | Neutral |
| LLOW(20) | 0.3052 | Neutral |
| MedPx vs Support | 0.0036 | Bullish |
| Vol ROC(20) | — | Neutral |
Interpretation: Indicator-level signals form the base confluence, which is then adjusted using a separate AI-driven technical ranking model. The final technical score summarizes this combined view.
6) News sentiment + extractive gist
Note: Instrument-specific news matches were not found, so the digest includes broader market/sector headlines. Links are provided for verification.
Sentiment score (avg): 0.062 | Positive: 19% | Neutral: 75% | Negative: 6%
KGNAI AI News Sentiment Score (normalized -1 to +1): Not available (as of —) | Label: Not available | Overall news score: 0.06
Positive Developments
Recent coverage across major financial outlets indicates a mildly constructive macro-news backdrop dominated by policy tone and incremental data resilience rather than clear risk-on acceleration. Commentary pointing to a more accommodating stance toward foreign investment in parts of the technology sector reads as a reduced-friction signal, which can modestly support broader risk sentiment and cross-asset stability. Separately, select consumer and retail data updates have been interpreted as “better than feared,” reinforcing the idea that downside growth expectations may not be worsening at the margin. For FX markets, this mix can translate into lower immediate tail-risk pricing, which aligns with CZKDKK’s relatively tight volatility regime (bandwidth 0.0066) and neutral momentum profile (RSI 52.94). While these items are not instrument-specific, they help frame why sentiment remains slightly positive (avg 0.062) without becoming decisively directional.
Neutral / Mixed Developments
The dominant tone remains wait-and-see. A high neutral share in the sentiment mix (75%) is consistent with markets reacting to incremental updates (policy commentary, cross-market price forecasts, and positioning narratives) rather than to decisive new catalysts. That neutrality matters for a cross like CZKDKK, where the rank layer is already centered (daily #454, weekly #544) and price is operating near well-defined decision levels (0.3040 / 0.3078). In practice, neutral news flow tends to push decision-making back toward technical confirmation: whether the bullish moving-average structure can extend, or whether the pair remains range-bound as implied by subdued MACD (hist 0.0000) and contained volatility.
Negative / Risk Signals
Risk coverage remains present but not dominant, reflected in a relatively small negative share (6%). The primary risk framing across broader market headlines revolves around uncertainty-sensitive themes that can reprice quickly—geopolitical tension and shifting policy expectations. In FX, these conditions can increase correlation bursts and drive abrupt moves even when prior volatility has been contained, which is relevant given CZKDKK’s tight bandwidth regime (0.0066). From a positioning perspective, the market’s neutral momentum (RSI 52.94) provides limited buffer if a risk impulse pushes price below nearby structure. Accordingly, the most material downside “tell” remains price behavior around support ~0.3040; deterioration becomes more plausible if the level fails and ranks remain neutral rather than improving.
- Whether price can sustain acceptance above 0.3078 while momentum lifts from neutral (RSI 52.94).
- Any volatility expansion from the tight regime (bandwidth 0.0066) that confirms a transition out of range conditions.
- Whether the weekly rank (#544) improves toward the daily rank (#454) as a sign of broader alignment.
Sources referenced: Reuters, Bloomberg, Yahoo Finance, MarketWatch, Investing.com
Snapshot: AI Rank (Short–Mid–Long): Neutral (Neutral–Neutral–Neutral) · Technical Confluence: Bullish · Key Levels: Support ~0.30 | Resistance ~0.31 · News Sentiment: Neutral
7) Sources
- AUD/JPY Price Forecast: Weakens to near 113.50, but broader uptrend remains intact — https://www.fxstreet.com/news/aud-jpy-price-forecast-weakens-to-near-11350-but-broader-uptrend-remains-intact-202605220417
- Gold weakens as hawkish Fed outlook and Iran tensions support US Dollar — https://www.fxstreet.com/news/gold-weakens-as-hawkish-fed-outlook-and-iran-tensions-support-us-dollar-202605220416
- Silver Price Forecast: XAG/USD remains subdued near $76.00 due to US-Iran uncertainty — https://www.fxstreet.com/news/silver-price-forecast-xag-usd-remains-subdued-near-7600-due-to-us-iran-uncertainty-202605220346
- Swiss Franc flattens against US Dollar as investors await US-Iran deal announcement — https://www.fxstreet.com/news/swiss-franc-flattens-against-us-dollar-as-investors-await-us-iran-deal-announcement-202605220329
- EUR/JPY Price Forecast: Tests confluence resistance zone near 185.00 — https://www.fxstreet.com/news/eur-jpy-price-forecast-tests-confluence-resistance-zone-near-18500-202605220316
- Australian Dollar edges lower below 0.7150 as weak jobs data curb RBA hike bets — https://www.fxstreet.com/news/australian-dollar-edges-lower-below-07150-as-weak-jobs-data-curb-rba-hike-hopes-202605220225
- British Pound steadies above 1.3400 vs USD on mixed BoE cues, UK political and Iran risks — https://www.fxstreet.com/news/british-pound-steadies-above-13400-vs-usd-on-mixed-boe-cues-uk-political-and-iran-risks-202605220216
- Euro struggles as rising hawkish Fed tone lifts USD — https://www.fxstreet.com/news/euro-struggles-as-rising-hawkish-fed-tone-lifts-usd-202605220210
You may also like: How KGNAI AI ranks instruments across global markets
Disclaimer: KGNAI provides AI-generated analytics and educational market commentary only. This is not financial advice. Markets involve risk. Always do your own research.