
AUDGBP (Australian Dollar/UK Pound Sterling) — 06-Mar-2026 Neutral stance as trend support meets mixed momentum
AUDGBP sits in a broadly neutral cross-asset positioning window, where price structure shows supportive trend characteristics while momentum and volatility measures remain more balanced than directional. Within KGNAI’s 966-instrument FOREX universe, the cross is clustered near the middle of the distribution across major horizons (e.g., Daily rank #471, Weekly rank #683, Yearly rank #332), consistent with a market that is not offering strong asymmetric evidence in either direction. Technically, the state description is also neutral on blended measures (Overall Technical Score 0.217; 18-signal confluence 0.111), with a mild bearish MACD histogram reading (-0.0005407) offset by selective momentum/flow positives. The actionable framing is structural: the cross is bracketed by support ~0.4971 and resistance ~0.5281, and signal quality likely depends on whether price can resolve this range with confirmation rather than intraday noise.
- Short / Mid / Long rank stance: Neutral / Neutral / Neutral (Daily #471, Weekly #683, Yearly #332 out of 966)
- Technical confluence label: Neutral (Overall Technical Score 0.217; Bull 5 / Bear 3 / Neutral 10)
- Key levels: Support ~0.4971; Resistance ~0.5281
- News sentiment bias: Neutral-leaning (avg sentiment 0.043; 31% positive / 50% neutral / 19% negative)
- Confirmation / invalidation condition: A sustained move above 0.5281 supports continuation scenarios; a close below 0.4971 raises deterioration risk per the scenario framework.
What KGNAI Measures
KGNAI evaluates assets using large cross-sectional datasets built from millions of structured data points. Inputs incorporate fundamental metrics, technical structures, and systematically processed news sentiment. Statistical models, machine learning, and AI frameworks are used to assess relative positioning, signal alignment, and probabilistic behavior across broad universes.
How to Read This Report
- Ranks are comparative across the tracked universe, not absolute price targets.
- Confluence reflects alignment among independent signal groups.
- Support/resistance levels are probabilistic decision zones, not guarantees.
- Sentiment provides contextual bias within the broader analytical framework.
1) KGNAI AI Analysis
Region: FOREX
Total universe size: 966 ranked instruments
- Daily rank: #471 out of 966 — Neutral
- Weekly rank: #683 out of 966 — Neutral
- Monthly rank: #419 out of 966 — Neutral
- 3-Monthly rank: #607 out of 966 — Neutral
- 6-Monthly rank: #322 out of 966 — Neutral
- Yearly rank: #332 out of 966 — Neutral
Cross-horizon rank clustering is the defining feature: AUDGBP remains anchored near the mid-distribution rather than exhibiting a persistent top-decile or bottom-decile tilt. The Daily rank #471 is essentially median, while the Weekly rank #683 sits in the weaker half of the universe, suggesting that near-term relative behavior has been less favorable versus peers. At the same time, the 6-Monthly rank #322 and Yearly rank #332 are meaningfully stronger than the weekly reading, indicating the longer-window profile has not fully deteriorated.
This pattern often reflects timeframe disagreement: shorter-term tests may be reacting to recent consolidation or short-lived underperformance, while longer-term tests still recognize prior persistence. The result is a neutral label across all horizons because the evidence set does not reach the internal thresholds for a directional classification.
From a decision-quality standpoint, the neutral term view is consistent with the pair being more suitable for range or mean-reversion awareness until a clearer relative regime emerges. A practical lens is to monitor whether rank dispersion tightens (convergence toward similar ranks across Daily/Weekly/Monthly) or whether it widens further—particularly if the weekly weakness begins to pull down the Monthly rank #419 and 3-Monthly rank #607 into a more consistently weak cluster.
Term view: Short-term: Neutral. Mid-term: Neutral. Long-term: Neutral.
Want the full universe and complete rank tables? Unlock full access on KGNAI: https://www.kgnai.com/pricing
2) Price & trend overview
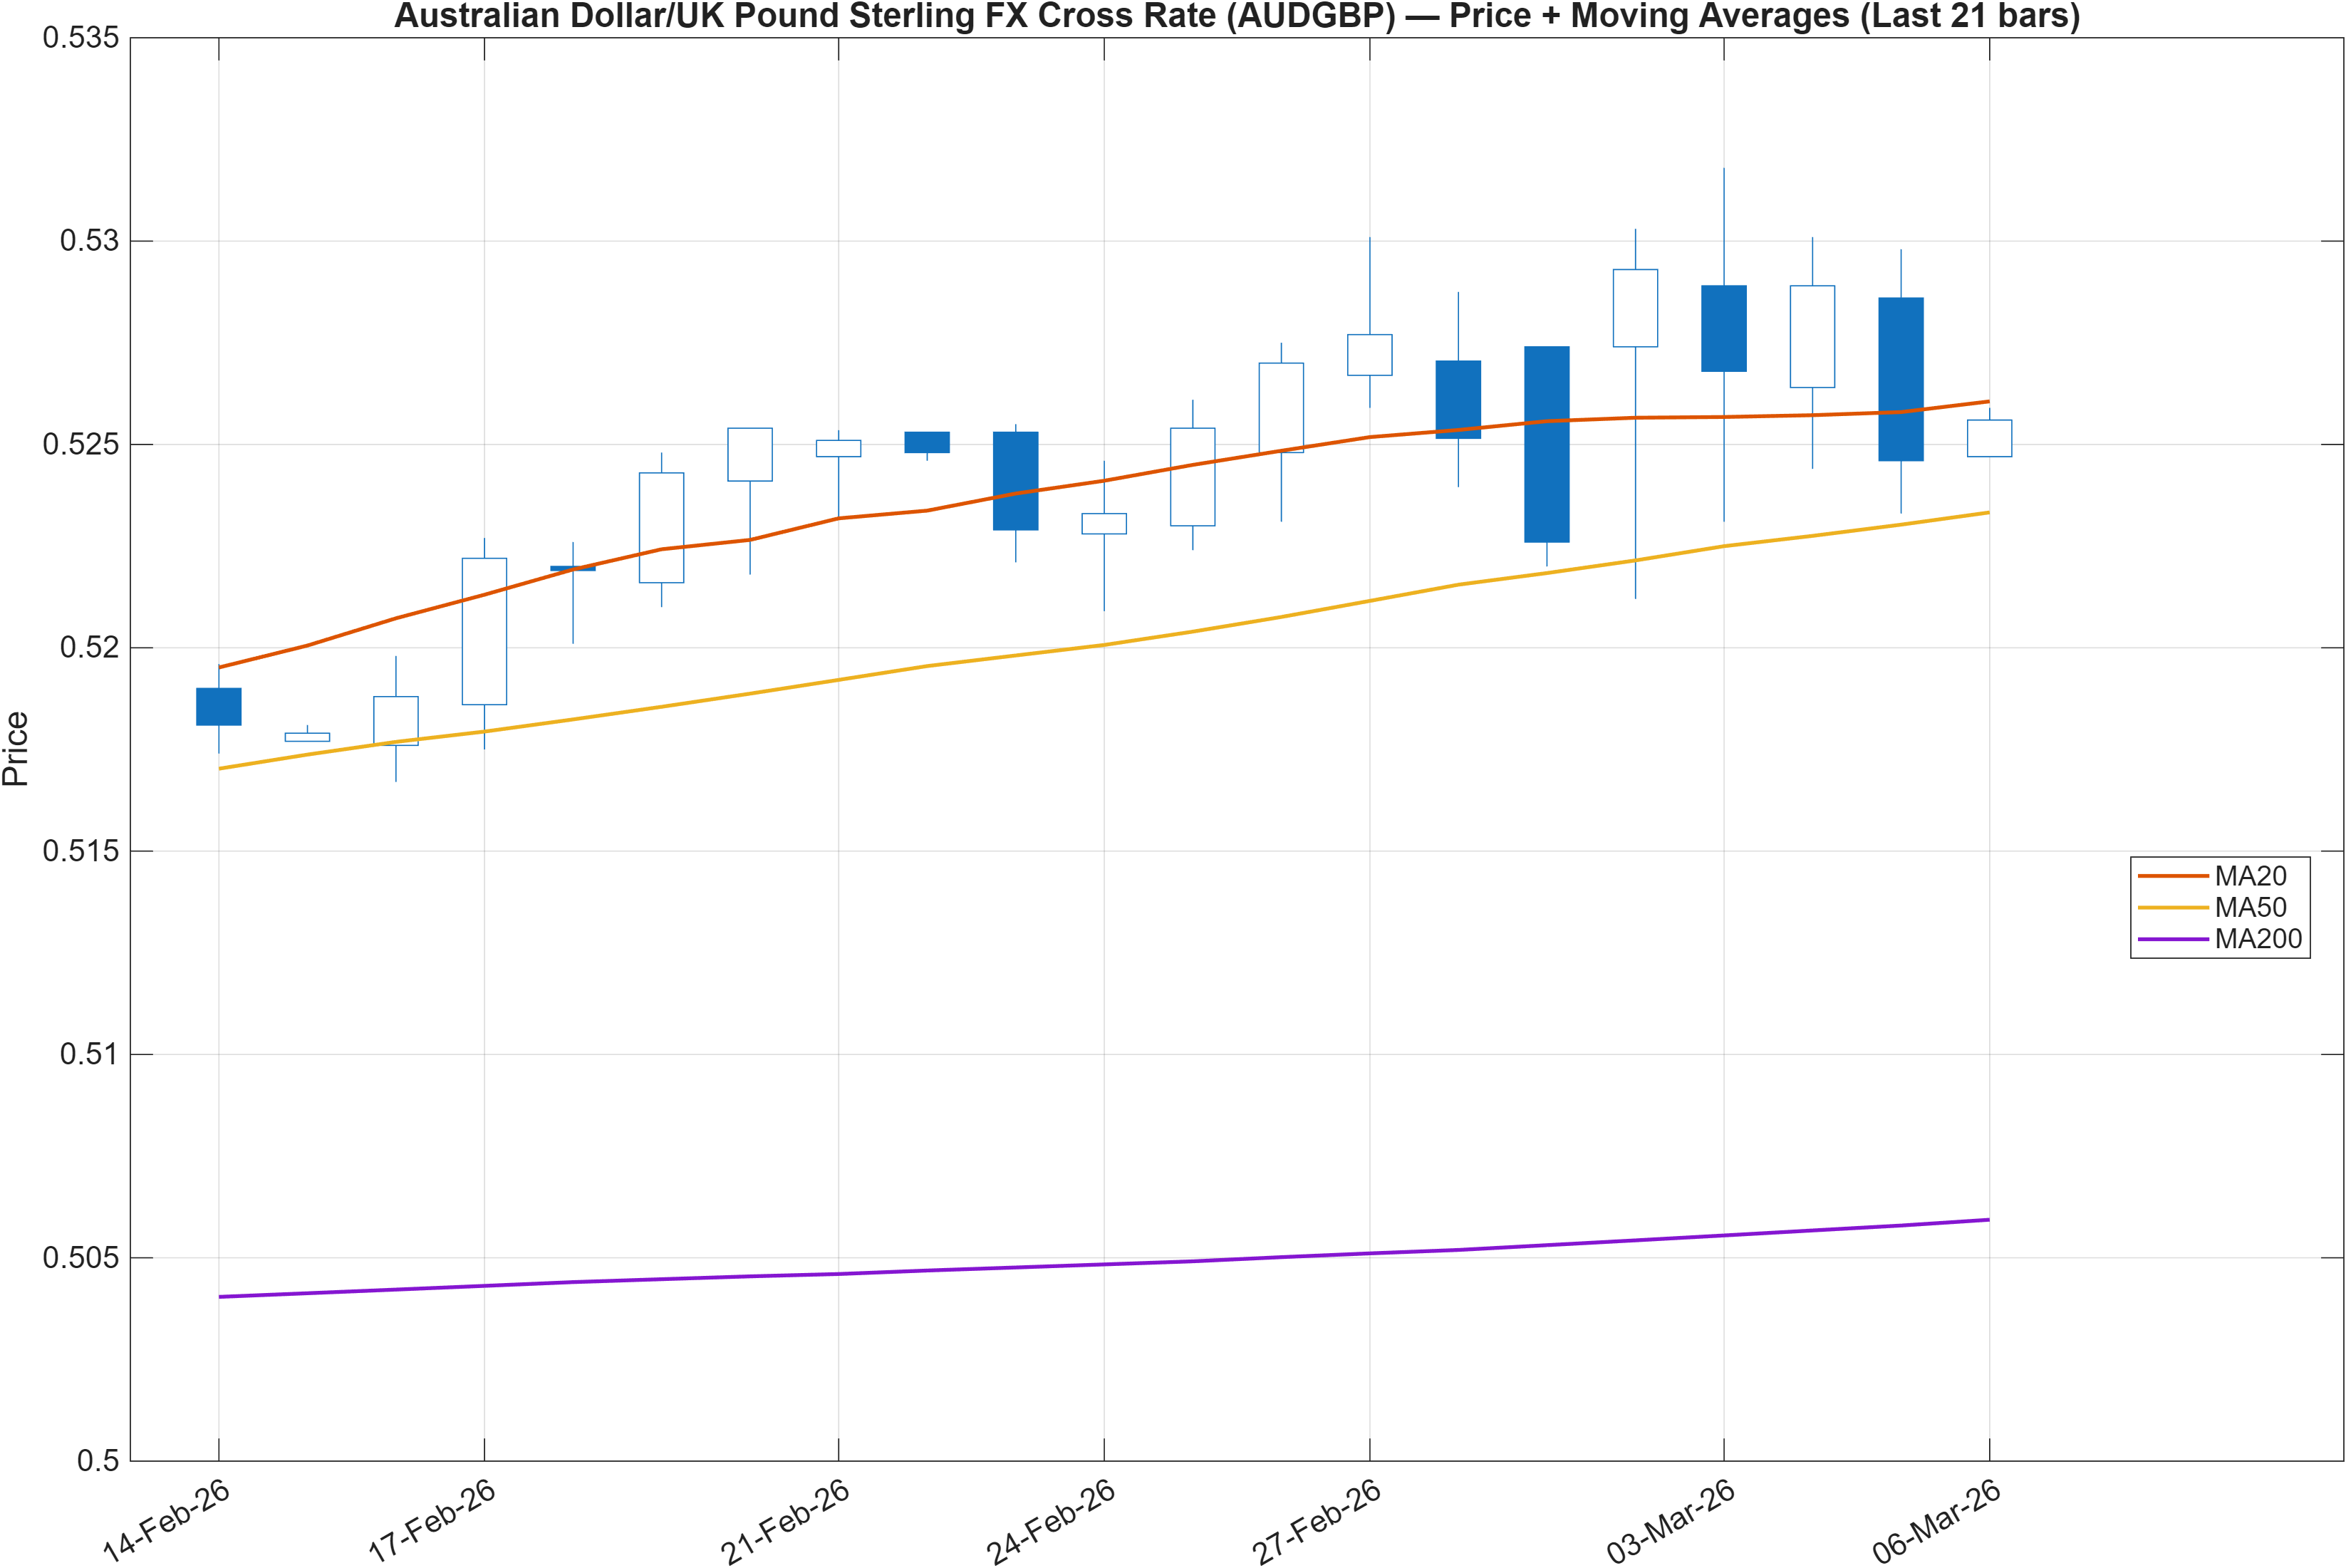
Bullish Moving-average structure is supportive: the close is above the MA50 and MA50 is above MA200 (both described as bullish). In isolation, that tends to characterize an uptrend or at least a market holding above intermediate trend support.
The analytical tension is that this constructive trend state is occurring alongside neutral cross-horizon ranks (e.g., Daily #471 and Monthly #419) rather than a clear upper-quartile cluster. That combination is consistent with a market where trend persistence exists, but relative strength versus the broader FX universe is not dominant. In practice, it often implies that upside extension may require fresh momentum confirmation rather than relying on lagging trend measures.
Structure also matters because the pair is bracketed by the higher-level decision zones highlighted later: support ~0.4971 and resistance ~0.5281. With moving averages aligned bullishly, a sideways phase near resistance can still be trend-consistent; however, the burden of proof shifts to whether price can convert the upper boundary into acceptance rather than repeated rejection. Conversely, a drift toward support would test whether the bullish MA stack can function as a stabilizer or whether the market transitions from trend-hold into range breakdown dynamics.
Interpretation provided: Close vs MA50 = Bullish, MA50 vs MA200 = Bullish.
3) Momentum & volatility dashboard
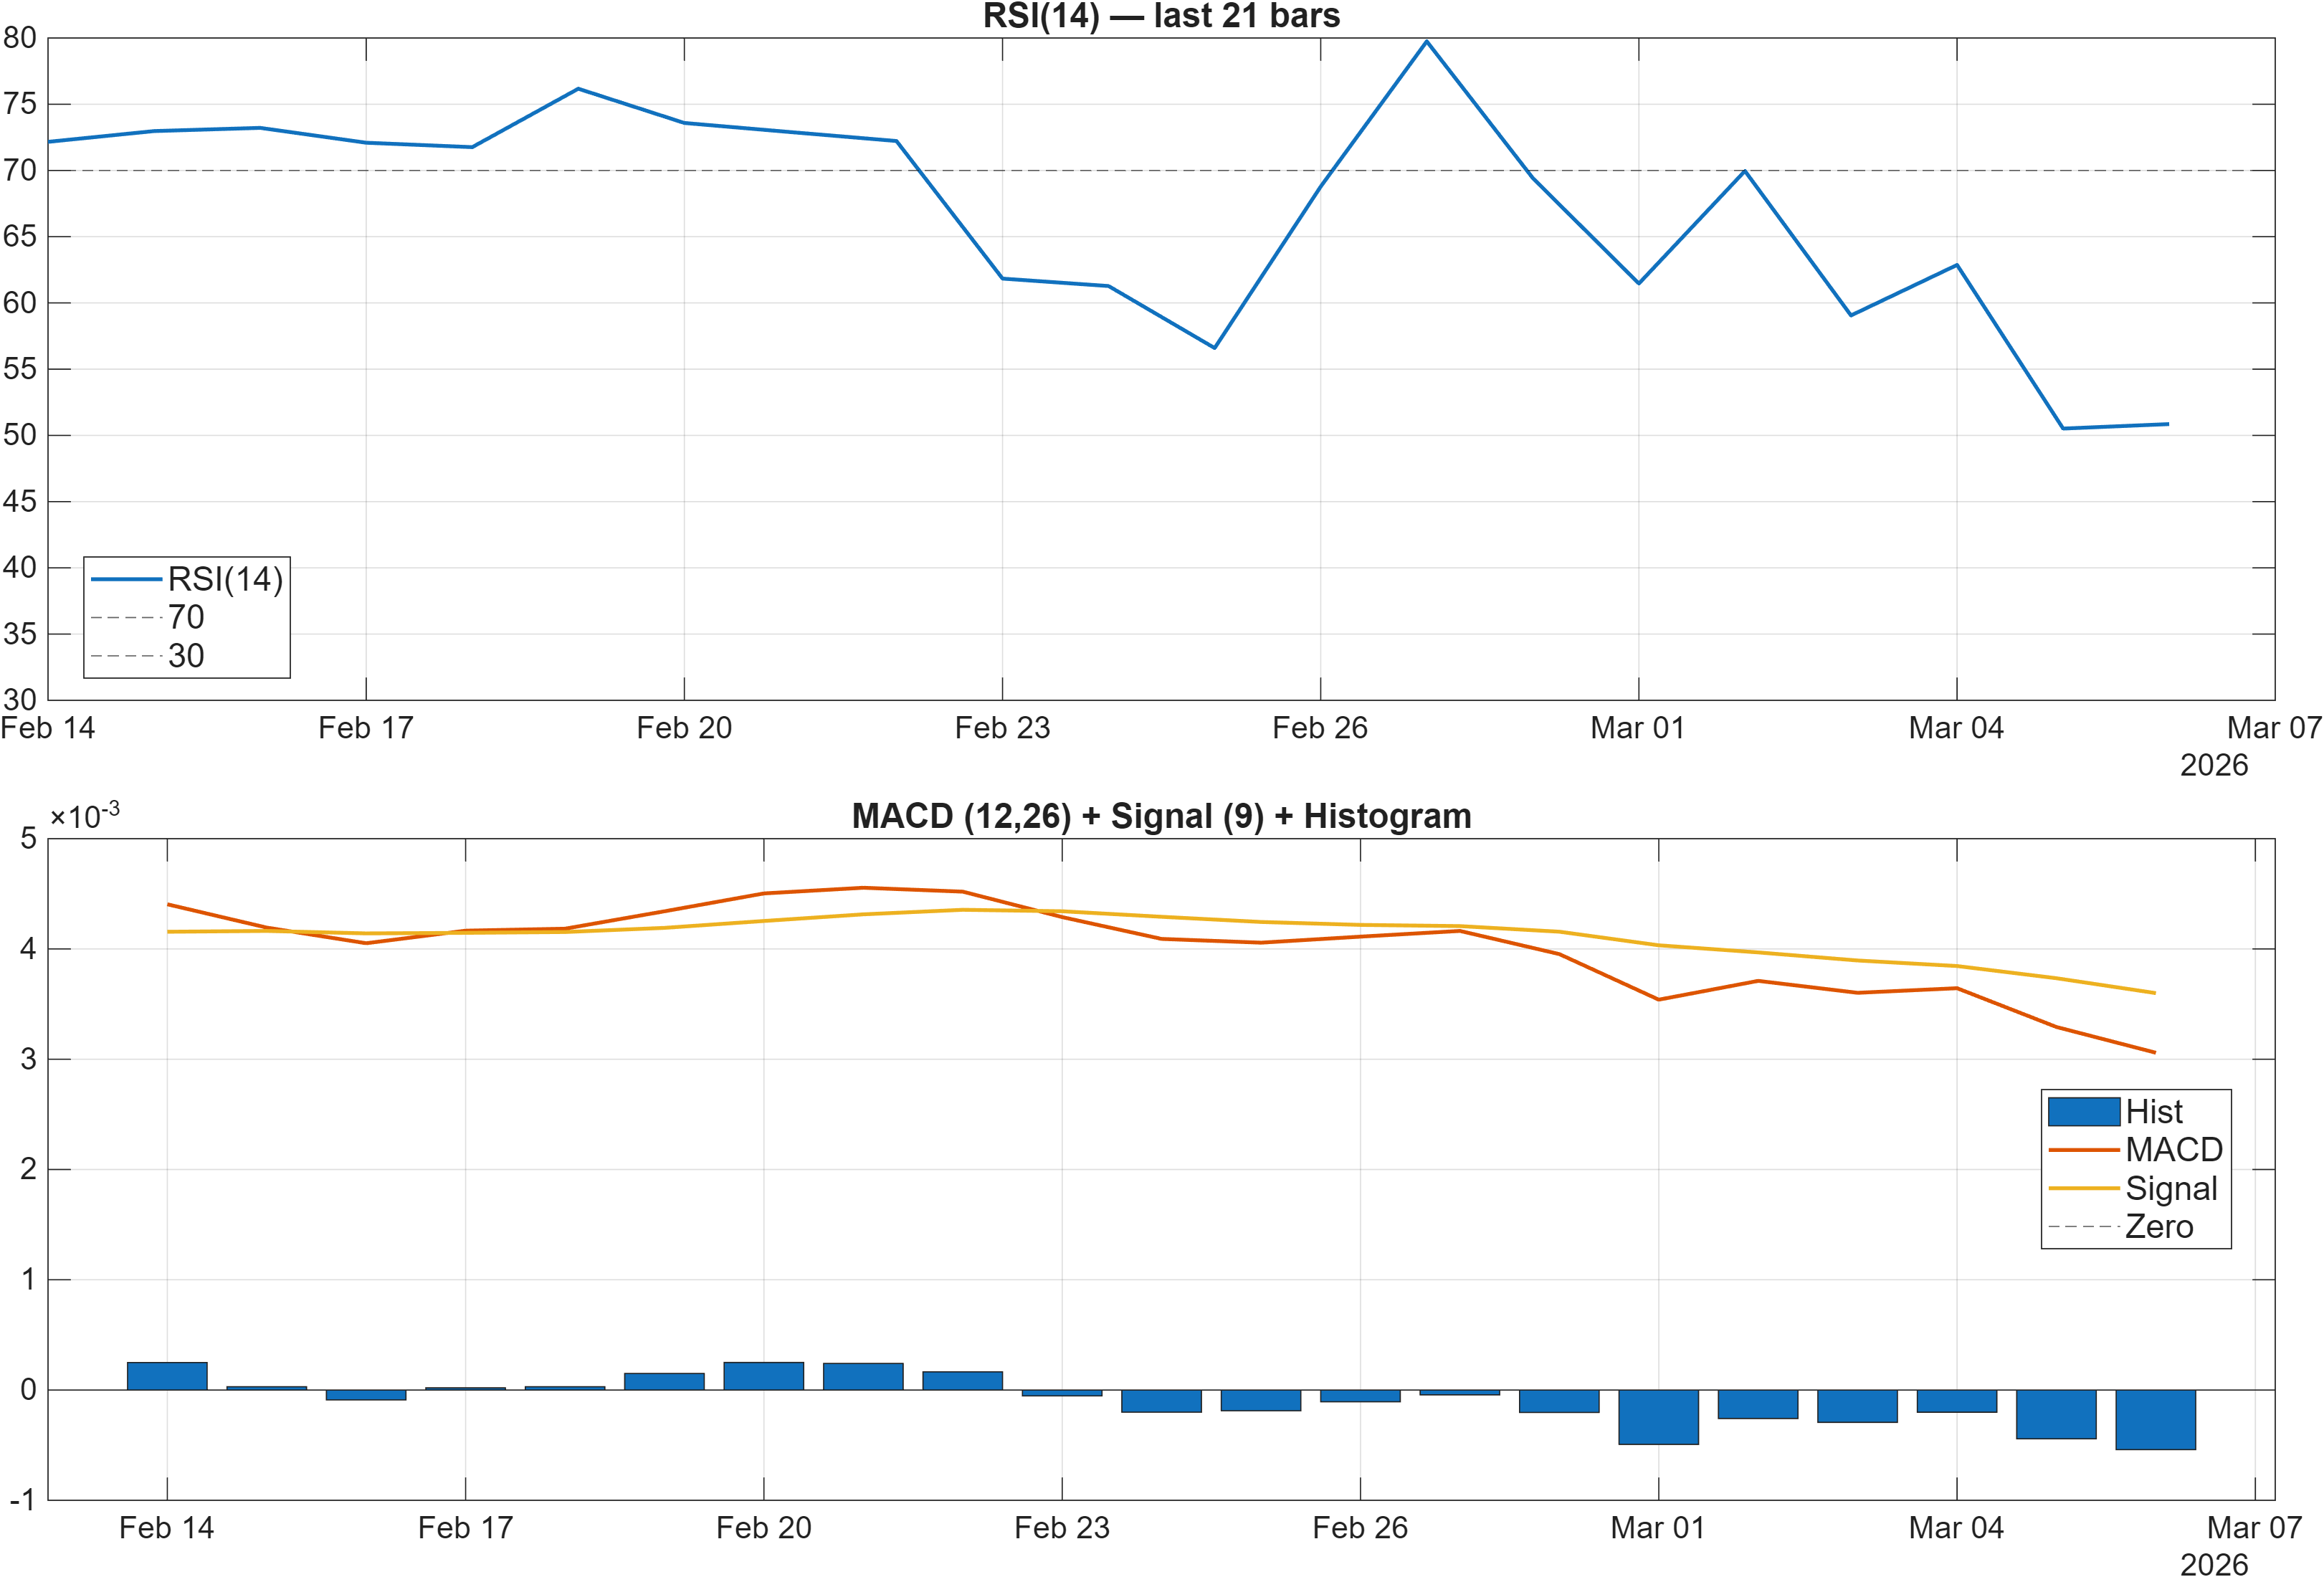
Neutral Momentum is best described as balanced with mild negative undertones. RSI bias is labeled neutral with RSI(14) at 50.85, placing the oscillator close to its midpoint rather than in a stretched regime. This is typical of consolidation or a market waiting for a catalyst rather than one trending with strong velocity.
MACD adds a subtle counterweight: the histogram is negative (-0.0005; table shows -0.0005407), which is consistent with weakening incremental momentum even if the broader trend backdrop remains constructive. When RSI is near 50 while MACD histogram is below zero, the common interpretation is compression: price may be holding up, but the impulse component is not accelerating.
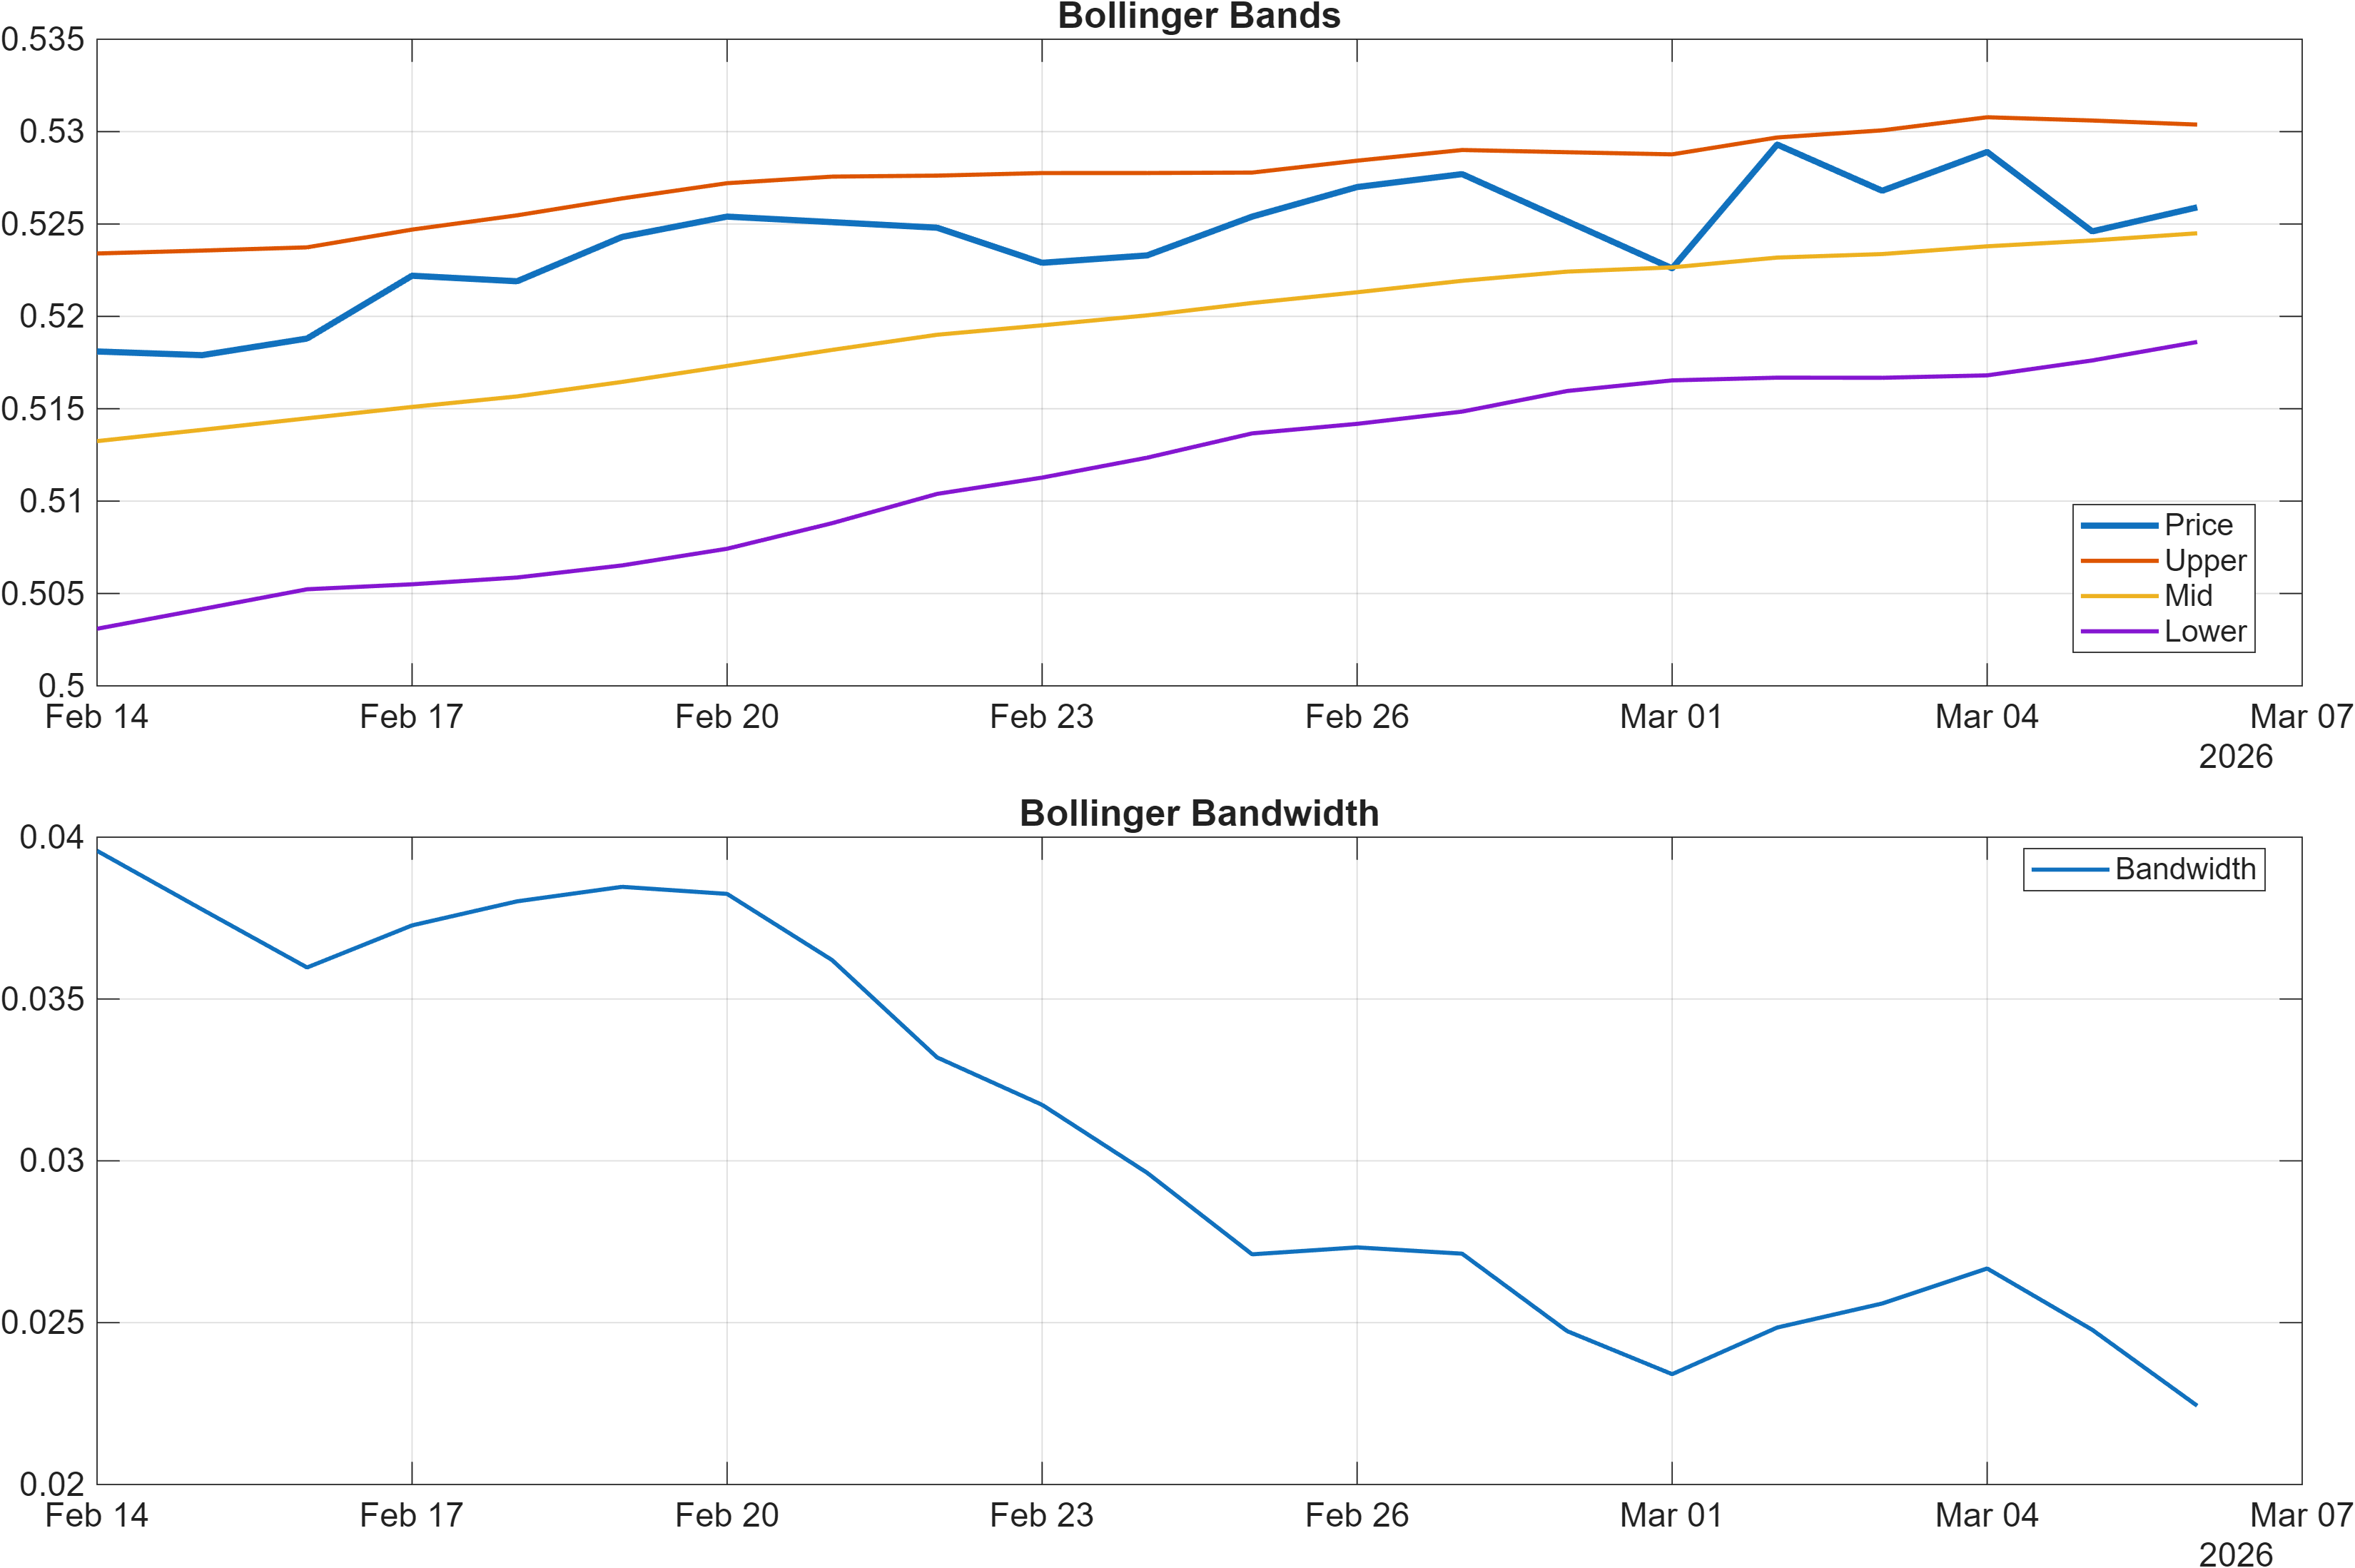
Volatility, as proxied by Bollinger Bandwidth, is not signaling an extreme condition. The latest bandwidth is 0.0224 (table: 0.02243), which indicates a measured regime rather than a high-volatility breakout phase. In neutral markets, that matters because range edges—here, the 0.4971 support and 0.5281 resistance—tend to be tested with incremental probes rather than one-directional bursts.
Interpretation provided: RSI bias = Neutral, MACD hist = -0.0005. Bandwidth (volatility regime) latest = 0.0224.
4) Support / Resistance zones
Support ~ 0.4971 | Resistance ~ 0.5281
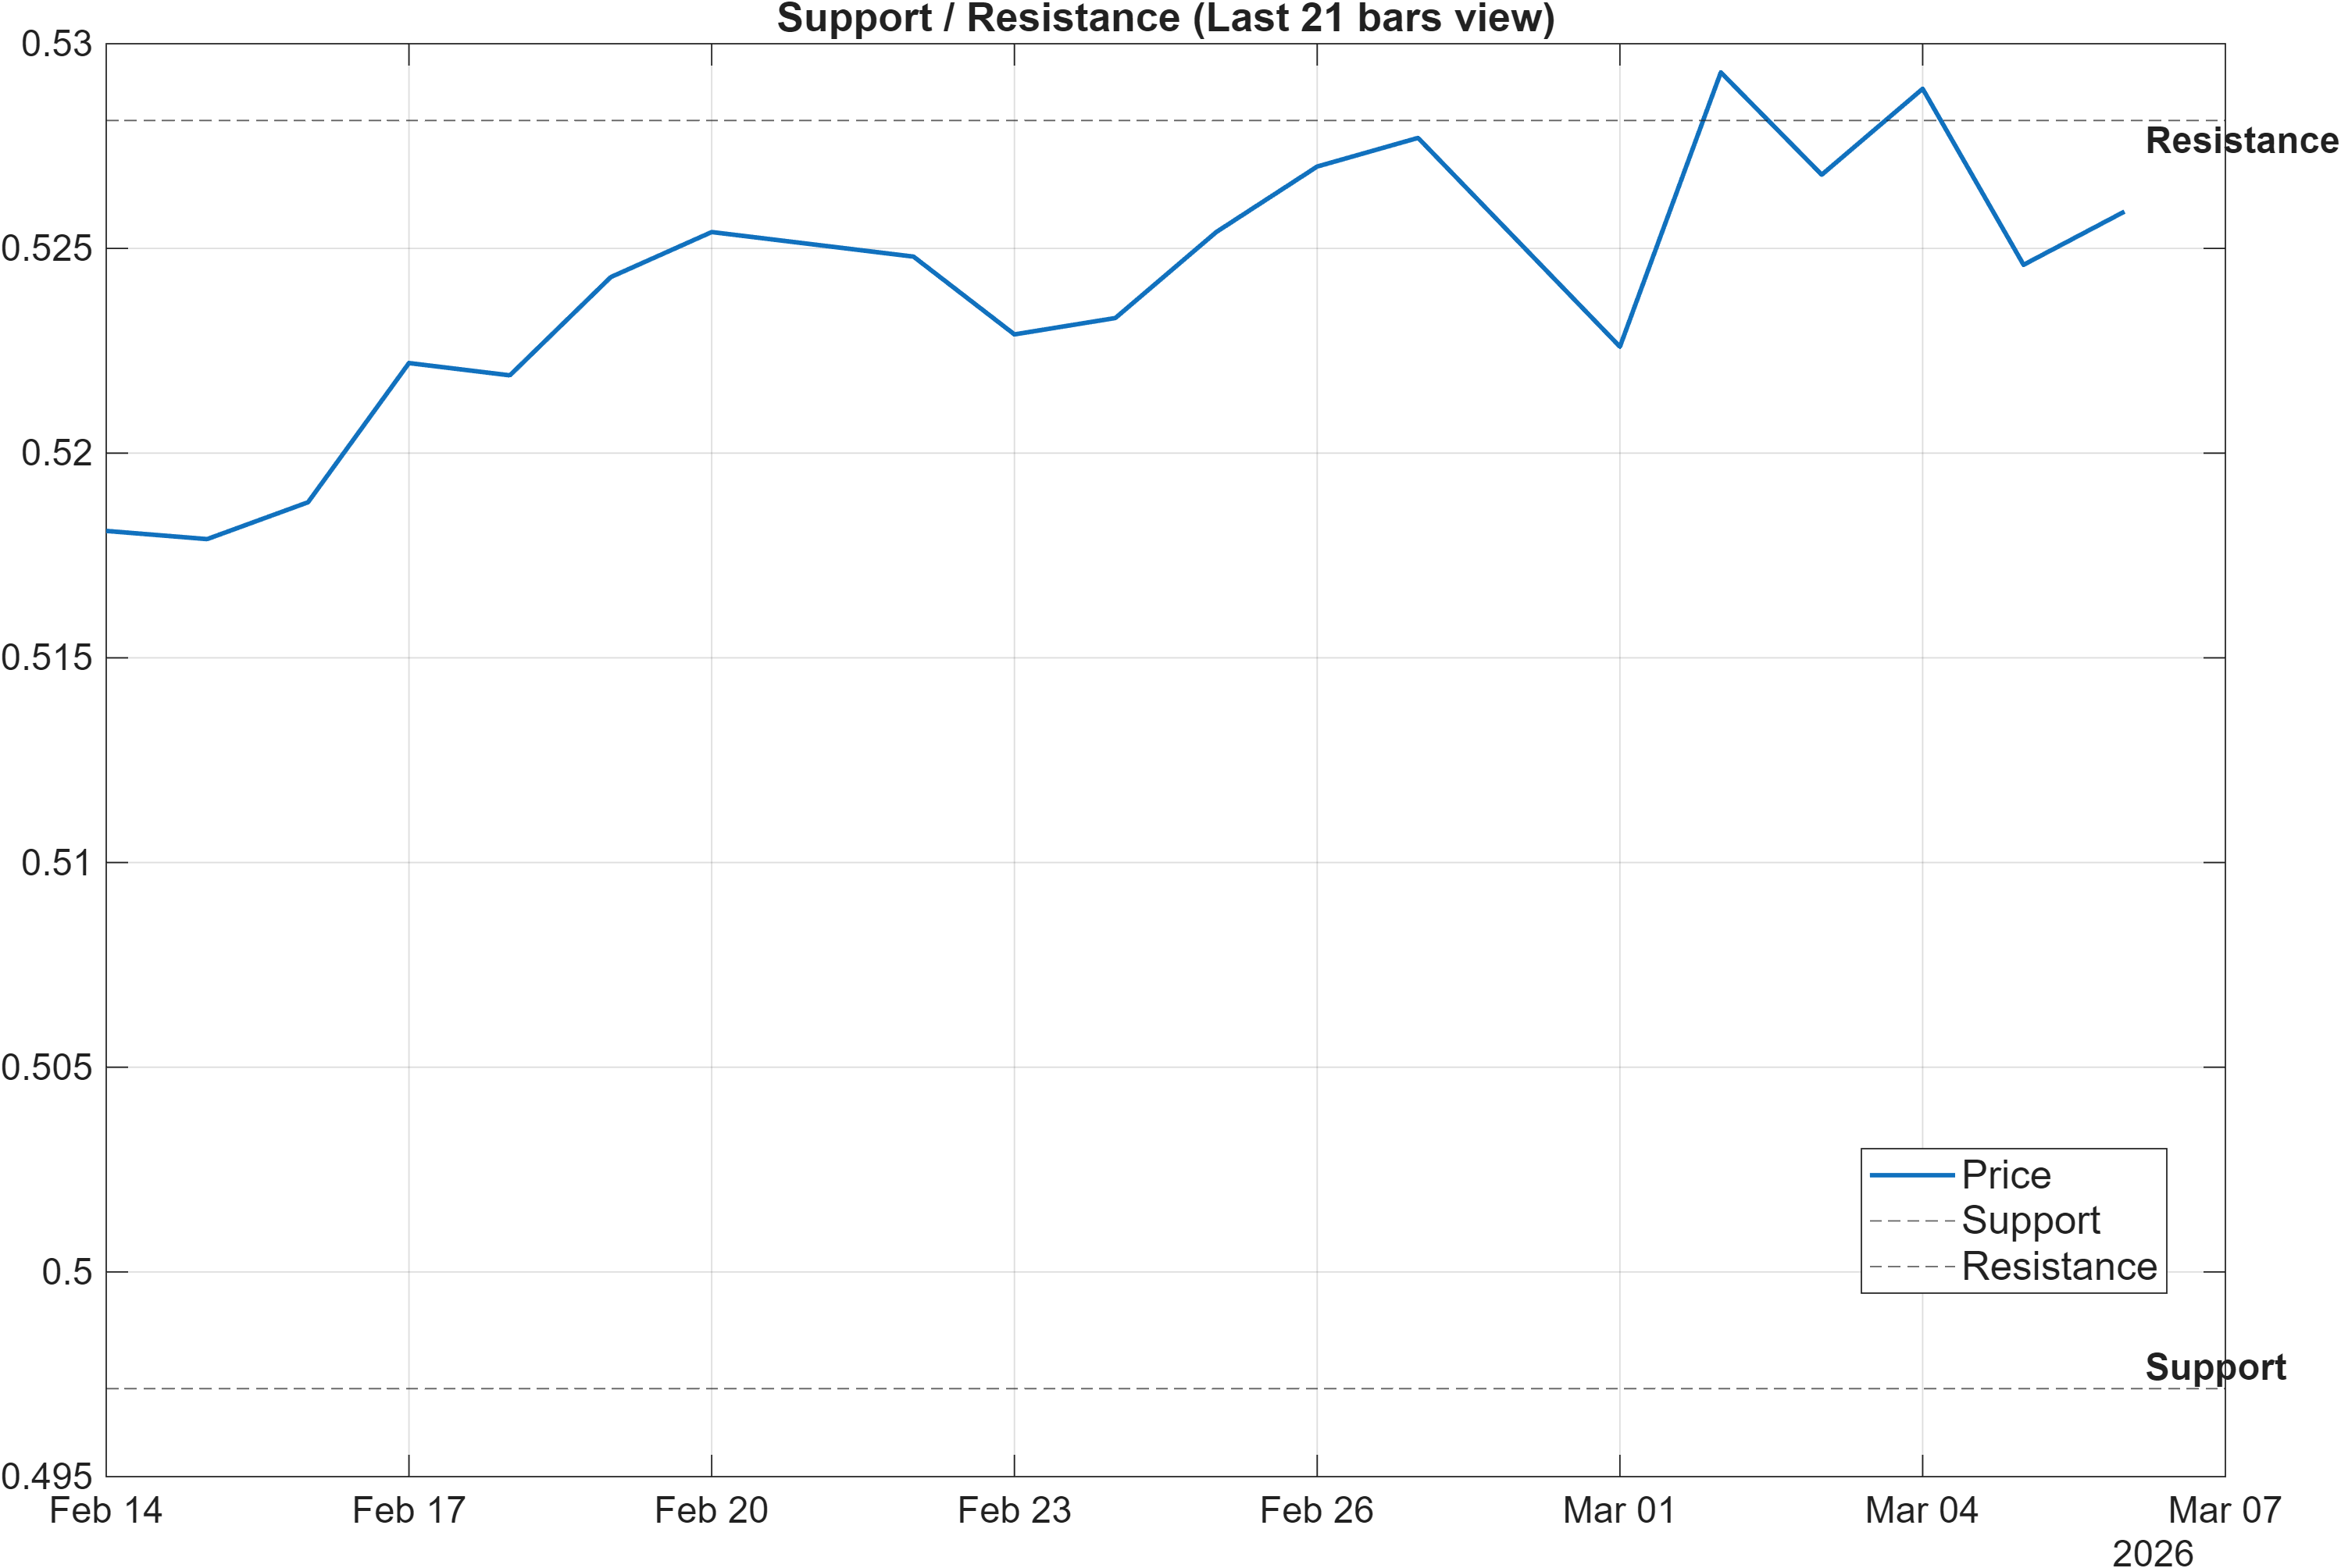
The current setup is best framed as a bracketed market with an underlying trend tailwind (bullish MA configuration) but muted momentum confirmation (RSI neutral at 50.85, MACD histogram negative at -0.0005407). In that blend, support/resistance levels become the primary structure for decision-making because they define where the market is more likely to reveal whether it is transitioning into continuation or reverting back into a range.
The upper boundary at 0.5281 is the key area for continuation validation. A break that holds above this zone would be more convincing if it occurs alongside improving momentum measures (e.g., MACD histogram moving toward/through zero) and a shift in the confluence mix away from neutrality (currently 10 neutral signals). Without that, upside breaks can revert quickly in low-to-moderate bandwidth regimes (latest 0.0224).
On the downside, 0.4971 is the deterioration line in the provided scenario framing. A close below support would be more consistent with the weaker nearer-term rank posture (notably Weekly #683) and could imply that the bullish moving-average state is losing influence. Until one of these zones is resolved, the evidence supports a neutral regime classification rather than a directional bias.
Scenario view provided: Break above resistance with volume → continuation. Close below support → signal deterioration risk.
5) Quant Technical Dashboard (18 Signals)
KGNAI AI Technical Analysis Score (Deep Reinforcement Learning): Rank #259 out of 966 (Rank 1 represents the strongest technical positioning and a higher probability of favorable price behavior. As ranks increase toward the maximum, the probability of favorable outcomes weakens and bearish positioning becomes more dominant.) | Label: Neutral | Score: 0.464
18-Signal Technical Confluence Score: 0.111 (Neutral)
Overall Technical Score (18-signal confluence + DRL rank blend): 0.217 (Neutral)
Note: The blended score reflects signal strength weighted against broader AI technical ranking, which may temporarily diverge.
Blended technical score breakdown: 0.217 (Neutral | Bull 5 / Bear 3 / Neutral 10)
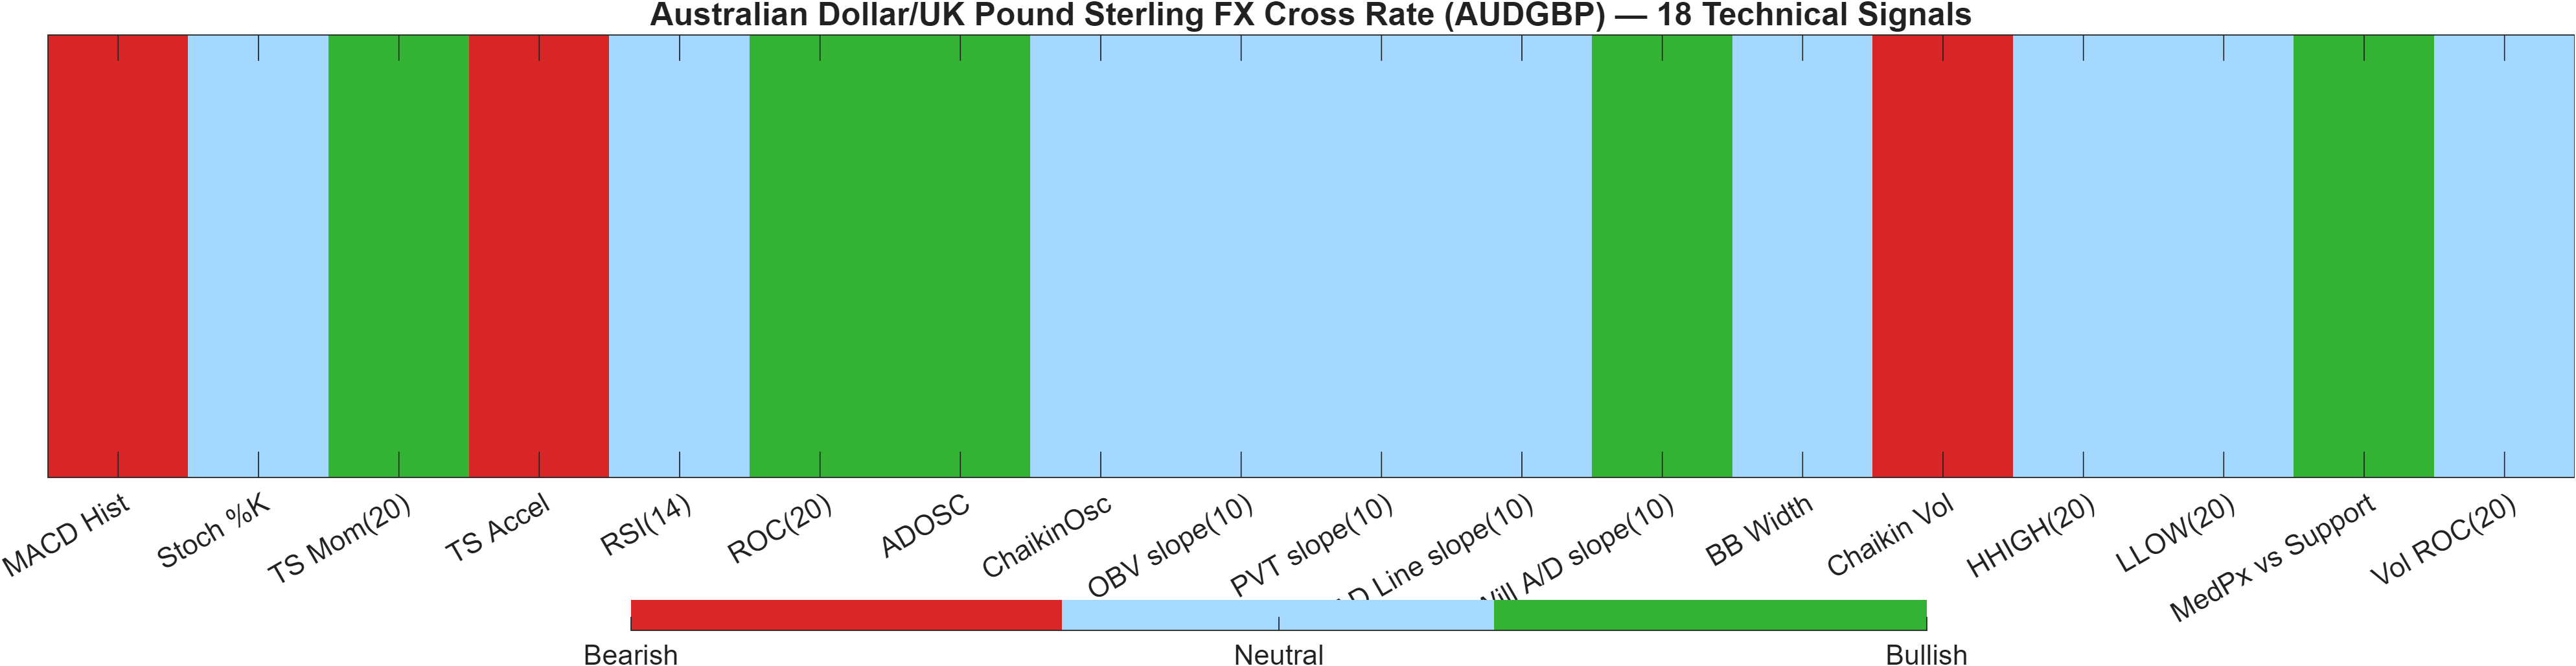
Signal table (Bull/Bear/Neutral)
| Indicator | Value | Signal |
|---|---|---|
| MACD Hist | -0.0005407 | Bearish |
| Stoch %K | 41.51 | Neutral |
| TS Mom(20) | 0.0077 | Bullish |
| TS Accel | -0.0039 | Bearish |
| RSI(14) | 50.85 | Neutral |
| ROC(20) | 1.545 | Bullish |
| ADOSC | 87.5 | Bullish |
| ChaikinOsc | 0 | Neutral |
| OBV slope(10) | 0 | Neutral |
| PVT slope(10) | 0 | Neutral |
| AD Line slope(10) | 0 | Neutral |
| Will A/D slope(10) | 0.0037 | Bullish |
| BB Width | 0.02243 | Neutral |
| Chaikin Vol | 58.41 | Bearish |
| HHIGH(20) | 0.5318 | Neutral |
| LLOW(20) | 0.5167 | Neutral |
| MedPx vs Support | 0.02815 | Bullish |
| Vol ROC(20) | — | Neutral |
The dashboard shows a neutral majority (10 of 18 signals), which aligns with the 18-signal confluence score of 0.111. Where the analysis becomes more nuanced is in the interaction between signal direction and model-based ranking. The DRL technical rank is #259 out of 966 with a score of 0.464, a comparatively stronger placement than the mid-pack daily rank (#471). This suggests the model sees more constructive structure than the raw cross-sectional performance ranks alone might imply.
The mixed momentum complexion is visible inside the signal set: MACD Hist is bearish at -0.0005407 and TS Accel is bearish at -0.0039, which argues against assuming immediate trend acceleration. Offsetting that, there are bullish elements tied to trend/momentum persistence and flow proxies (e.g., ROC(20) 1.545, TS Mom(20) 0.0077, ADOSC 87.5), which is consistent with the moving-average bullish interpretation in the trend panel.
The resulting Overall Technical Score of 0.217 sits in the neutral band because the positive signals are not broad-based and the bearish readings are not extreme. This is a typical signature of a market that can move, but where signal breadth is insufficient to treat the setup as a high-conviction directional state.
6) News sentiment + extractive gist
Note: Instrument-specific news matches were not found, so the digest includes broader market/sector headlines.
Sentiment score (avg): 0.043 | Positive: 31% | Neutral: 50% | Negative: 19%
KGNAI AI News Sentiment Score (normalized -1 to +1): Not available (as of —) | Label: Not available | Overall news score: 0.04
Positive Developments
Recent coverage across major financial outlets indicates a modestly constructive tone driven by periodic improvements in broader risk sentiment and episodes of US dollar softness. The aggregate sentiment mix—31% positive versus 19% negative with 0.043 average sentiment—suggests a slight tilt toward stabilization rather than acute stress. For AUDGBP specifically, this matters indirectly because the cross often reflects relative shifts between cyclical risk appetite (supportive for AUD during “risk-on” phases) and UK-specific rate and growth expectations. In parallel, ongoing attention to energy-market dynamics has been associated with intraday swings in broader FX pricing, which can create short-lived opportunities but also increase the value of confirmation from technical structure. With the technical regime neutral (Overall Technical Score 0.217), positive macro tone is most relevant when it coincides with a clean test of resistance ~0.5281.
Neutral / Mixed Developments
The neutral block of coverage is consistent with the report’s “state descriptor” posture: markets appear to be reacting to incremental data points rather than repricing a single dominant narrative. This aligns with a largely neutral technical heatmap (10 neutral signals) and an RSI reading near equilibrium (50.85). In a mixed-news environment, AUDGBP may remain more sensitive to relative-rate expectations and broad USD dynamics, even when the direct cross is not in the headlines. The absence of an instrument-specific news set means the sentiment overlay should be treated as contextual rather than explanatory: it can bias interpretation at the margin, but it does not replace the structural levels (0.4971 / 0.5281) that define the current decision zone.
Negative / Risk Signals
Risk-oriented coverage has emphasized uncertainty around global macro conditions and episodic flight-to-safety behavior—backdrops that can pressure higher-beta currencies and reinforce defensive positioning. Even with negatives at 19%, the presence of risk narratives can matter when technical momentum is already fragile, such as a bearish MACD histogram of -0.0005407. In that configuration, markets can respond asymmetrically: downside moves may travel faster than upside moves until momentum indicators stabilize. This is also where support integrity becomes central; a close below 0.4971 would align more naturally with risk-skewed macro tone and could coincide with further neutral-to-bearish drift in confluence (currently 0.111). Given volatility is not extreme (bandwidth ~0.0224), a negative shift may show up first as repeated failures at resistance rather than immediate breakdown.
What to monitor next
- Whether price can hold above 0.5281 long enough to shift momentum breadth beyond the current neutral majority.
- Whether RSI(14) 50.85 lifts decisively while MACD histogram moves back toward zero.
- Whether a loss of 0.4971 coincides with weakening ranks (e.g., Weekly #683 pulling other horizons lower).
Sources referenced: Reuters, Bloomberg, Yahoo Finance, MarketWatch, Investing.com
Snapshot: AI Rank (Short–Mid–Long): Neutral (Neutral–Neutral–Neutral) · Technical Confluence: Neutral · Key Levels: Support ~0.50 | Resistance ~0.53 · News Sentiment: Neutral
7) Sources
Not available in the provided data.
You may also like: How KGNAI AI ranks instruments across global markets
Disclaimer: KGNAI provides AI-generated analytics and educational market commentary only. This is not financial advice. Markets involve risk. Always do your own research.