
CADZAR (Canadian Dollar/South African Rand) — 08-Mar-2026 Technical & Rank Review: Sideways-to-Constructive Bias
CADZAR is currently characterized by sideways conditions with selective bullish evidence across medium-to-long horizons, while shorter-term readings remain more balanced. Within KGNAI’s 968-instrument FOREX universe, the cross sits Neutral on the Daily rank (#505) and Neutral on the Monthly rank (#420), but strengthens meaningfully on longer windows—most notably 6-Monthly rank #15 and Yearly rank #35, which places the instrument in a stronger comparative cohort. Technically, the picture is mixed but not symmetrical: the 18-signal confluence is Neutral (0.278) while the overall blended technical score is Bullish (0.367), consistent with an underlying constructive tilt despite consolidation. Momentum indicators contribute to the positive skew (including MACD histogram 0.0612 and RSI(14) 72.3), while volatility remains contained with Bollinger Bandwidth 0.0658—a configuration that often makes level confirmation more influential than indicator drift.
- Short / Mid / Long rank stance: Mixed (Neutral short-term; Neutral mid-term; Bullish long-term with 6-Monthly #15 and Yearly #35).
- Technical confluence label: Neutral (18-signal score 0.278), with a Bullish blended technical score (0.367).
- Key levels: Support ~ 11.6322 | Resistance ~ 12.0475.
- News sentiment bias: Slightly positive-to-neutral (avg sentiment 0.016; 31% positive vs 19% negative; overall news score 0.02).
- Confirmation / invalidation condition: A break above 12.0475 supports continuation; a close below 11.6322 increases deterioration risk.
What KGNAI Measures
KGNAI evaluates assets using large cross-sectional datasets built from millions of structured data points. Inputs incorporate fundamental metrics, technical structures, and systematically processed news sentiment. Statistical models, machine learning, and AI frameworks are used to assess relative positioning, signal alignment, and probabilistic behavior across broad universes.
How to Read This Report
- Ranks are comparative across the tracked universe, not absolute price targets.
- Confluence reflects alignment among independent signal groups.
- Support/resistance levels are probabilistic decision zones, not guarantees.
- Sentiment provides contextual bias within the broader analytical framework.
1) KGNAI AI Analysis
CADZAR is categorized under FOREX with a total universe size of 968 ranked instruments. The rank stack shows a notable time-horizon divergence: near-term positioning is more balanced, while longer windows are comparatively stronger.
- Daily rank: #505 out of 968 — Neutral
- Weekly rank: #34 out of 968 — Bullish
- Monthly rank: #420 out of 968 — Neutral
- 3-Monthly rank: #121 out of 968 — Bullish
- 6-Monthly rank: #15 out of 968 — Bullish
- Yearly rank: #35 out of 968 — Bullish
From a cross-sectional standpoint, Weekly rank #34 and Yearly rank #35 place CADZAR in a comparatively stronger cohort than the median instrument in the universe, while Daily rank #505 suggests the current tape is not offering a clear short-term edge. The 6-Monthly rank #15 stands out as an upper-tier long-horizon reading, implying that, across KGNAI’s comparative tests, the instrument’s longer-run behavior has been more consistent with favorable regimes than the typical cross.
The most actionable interpretation is regime consistency vs. short-term noise. When longer ranks are strong but short ranks are neutral, CADZAR tends to be more sensitive to confirmation at key levels than to incremental indicator changes—particularly in compressed-volatility backdrops. This aligns with the stated term view: Short-term Neutral, Mid-term Neutral, Long-term Bullish. In practice, that mix argues for tighter discipline on invalidation (defined later by support) while allowing for the possibility that consolidation resolves in the direction suggested by the longer-rank tail.
KGNAI ranks each instrument across large universes using multiple proprietary AI tests and statistical models (millions of data points). Lower ranks generally indicate stronger probability of favorable performance behavior, while higher ranks indicate weaker probability and more bearish positioning.
Term view: Short-term: Neutral. Mid-term: Neutral. Long-term: Bullish.
Want the full universe and complete rank tables? Unlock full access on KGNAI: https://www.kgnai.com/pricing
2) Price & trend overview
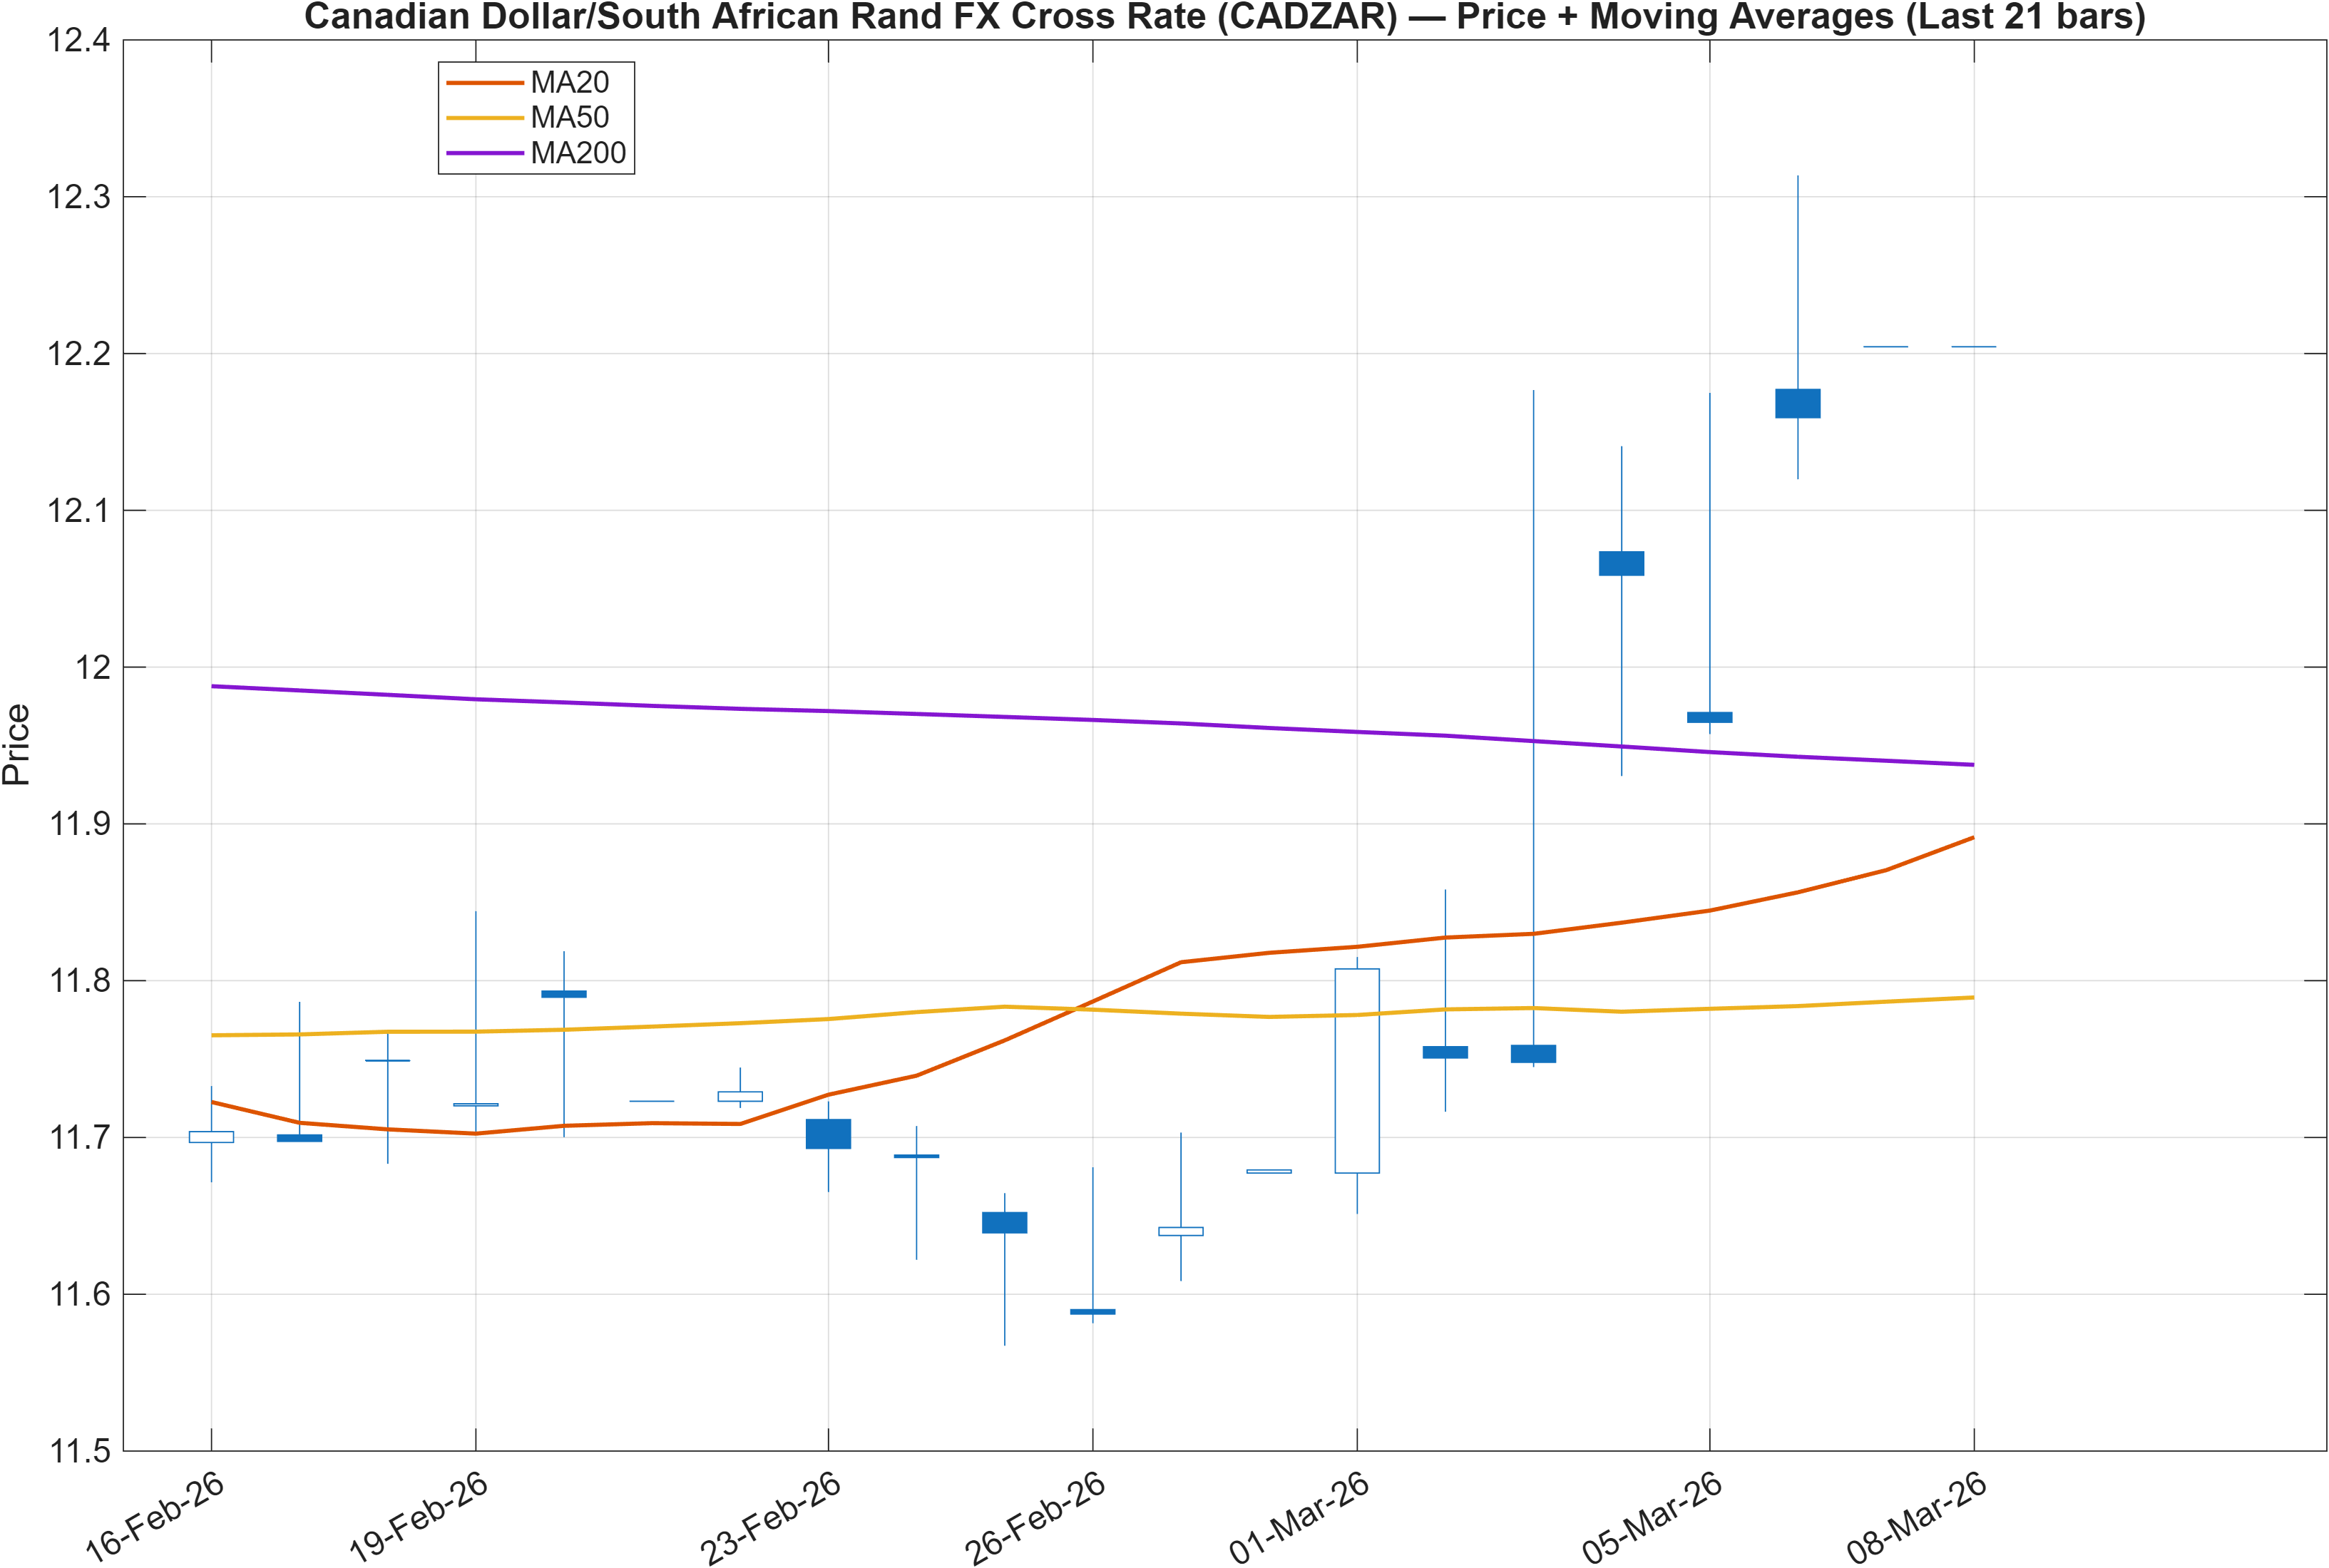
The moving-average structure is explicitly split: Close vs MA50 = Bullish, while MA50 vs MA200 = Bearish. That combination is typical of a market in transition or consolidation—price is behaving constructively versus the intermediate trend proxy, but the longer-duration trend relationship remains a headwind. In these configurations, continuation requires the market to prove persistence rather than merely bounce.
This MA mismatch helps explain why the rank profile can look stronger on longer windows (for example, 6-Monthly #15 and Yearly #35) while shorter windows remain neutral (such as Daily #505 and Monthly #420). In other words: the instrument may be scoring well on broader behavior tests, yet still operating inside a price structure that has not fully repaired its long-trend alignment.
With volatility measured elsewhere as contained (Bollinger Bandwidth 0.0658), the MA state becomes less about chasing micro-swings and more about defining where trend acceptance is occurring. A market can remain “sideways” while gradually improving in a way that only becomes obvious after a level is cleared. As a result, this trend view benefits from being paired with the level map in Section 4: when MA relationships are mixed, support/resistance confirmation generally carries more weight than small changes in slope.
Interpretation: Close vs MA50 = Bullish, MA50 vs MA200 = Bearish.
3) Momentum & volatility dashboard
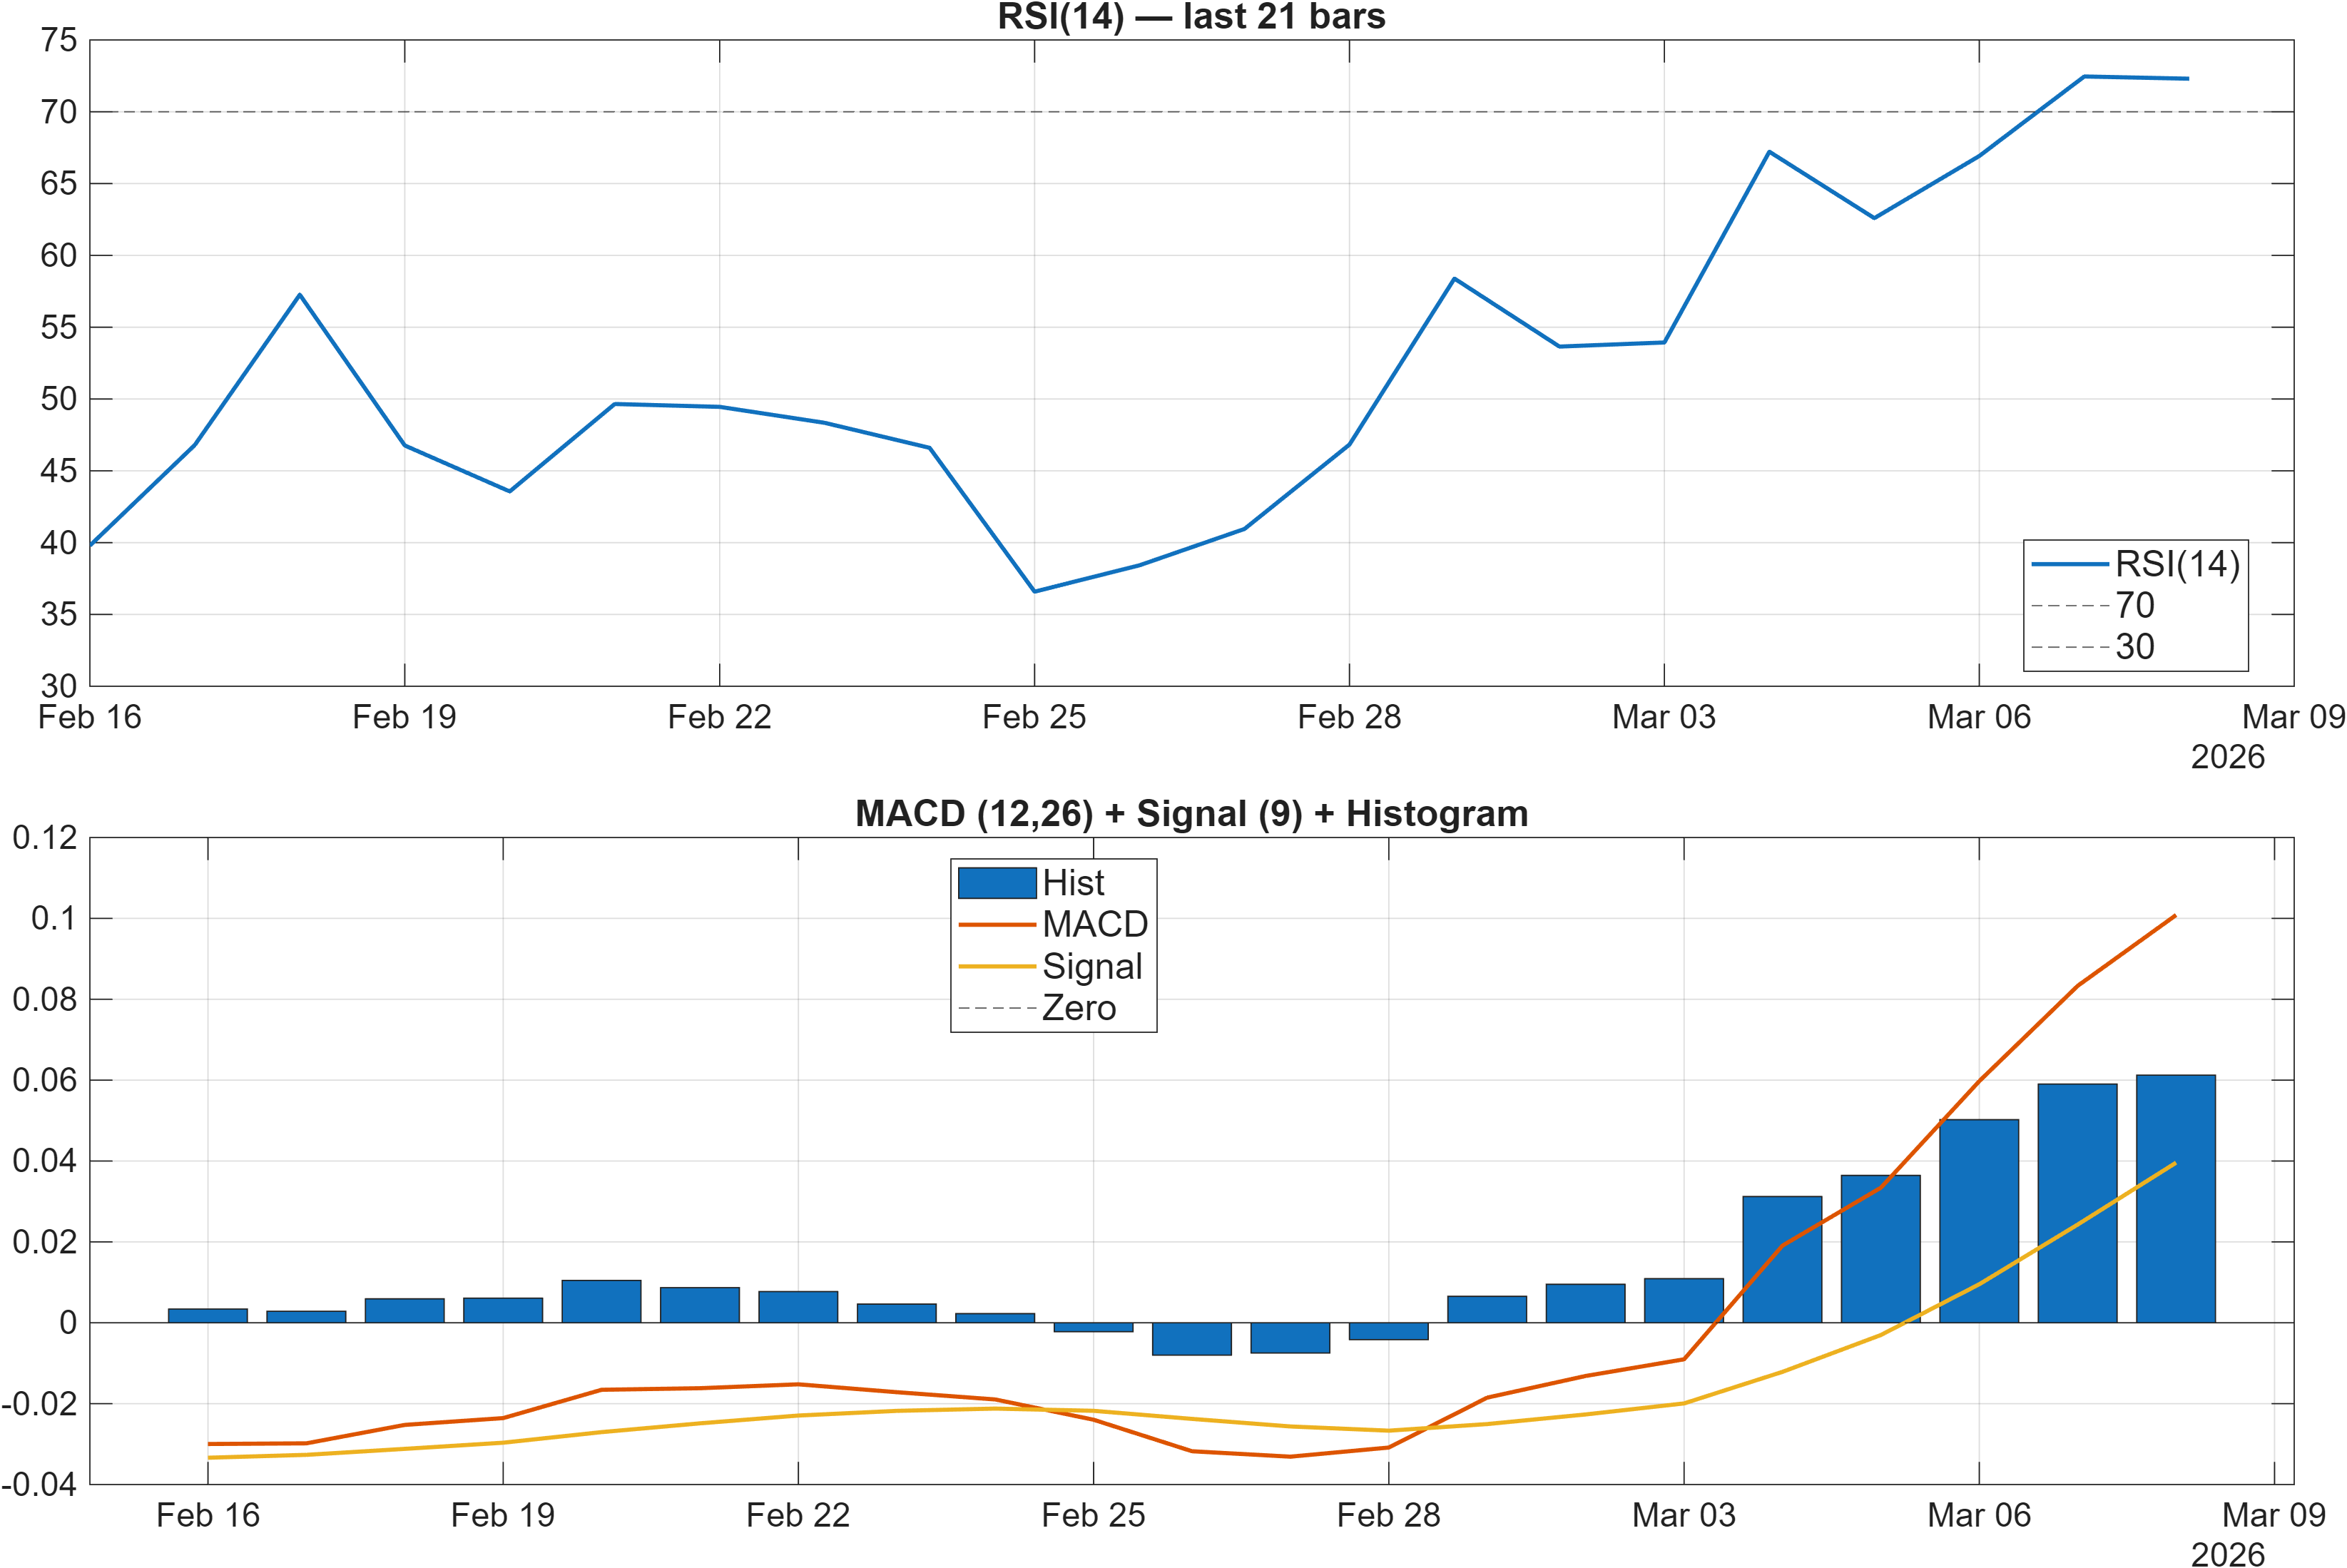
Momentum readings lean constructive, but they also carry late-cycle risk typical of range-to-trend transitions. The MACD histogram at 0.0612 points to positive momentum pressure, and the dashboard interpretation flags RSI bias = Bullish. In the signal table, RSI(14) is 72.3, a level that can reflect strong upside pressure but can also coincide with overextension risk if price fails to confirm through resistance.
Volatility remains comparatively tight: Bollinger Bandwidth is 0.0658. When bandwidth is compressed, markets often become more sensitive to discrete catalysts and level breaks than to incremental oscillator changes. This is one reason why a bullish momentum cluster (for example, ROC(20) 4.333 and TS Mom(20) 0.5068) can coexist with a “sideways conditions” headline—momentum can improve inside a range without immediately forcing a breakout.
The internal tension is visible in the mix of “fast” indicators: Stoch %K at 84.5 is flagged Bearish, which often signals that upside speed is elevated and susceptible to mean reversion. That does not negate the constructive MACD/RSI posture, but it raises the importance of confirmation sequencing: in compressed-volatility regimes, upside attempts that cannot hold above resistance tend to rotate back quickly, while a successful acceptance can turn high-RSI conditions into a sustained trend phase.
Interpretation: RSI bias = Bullish, MACD hist = 0.0612.
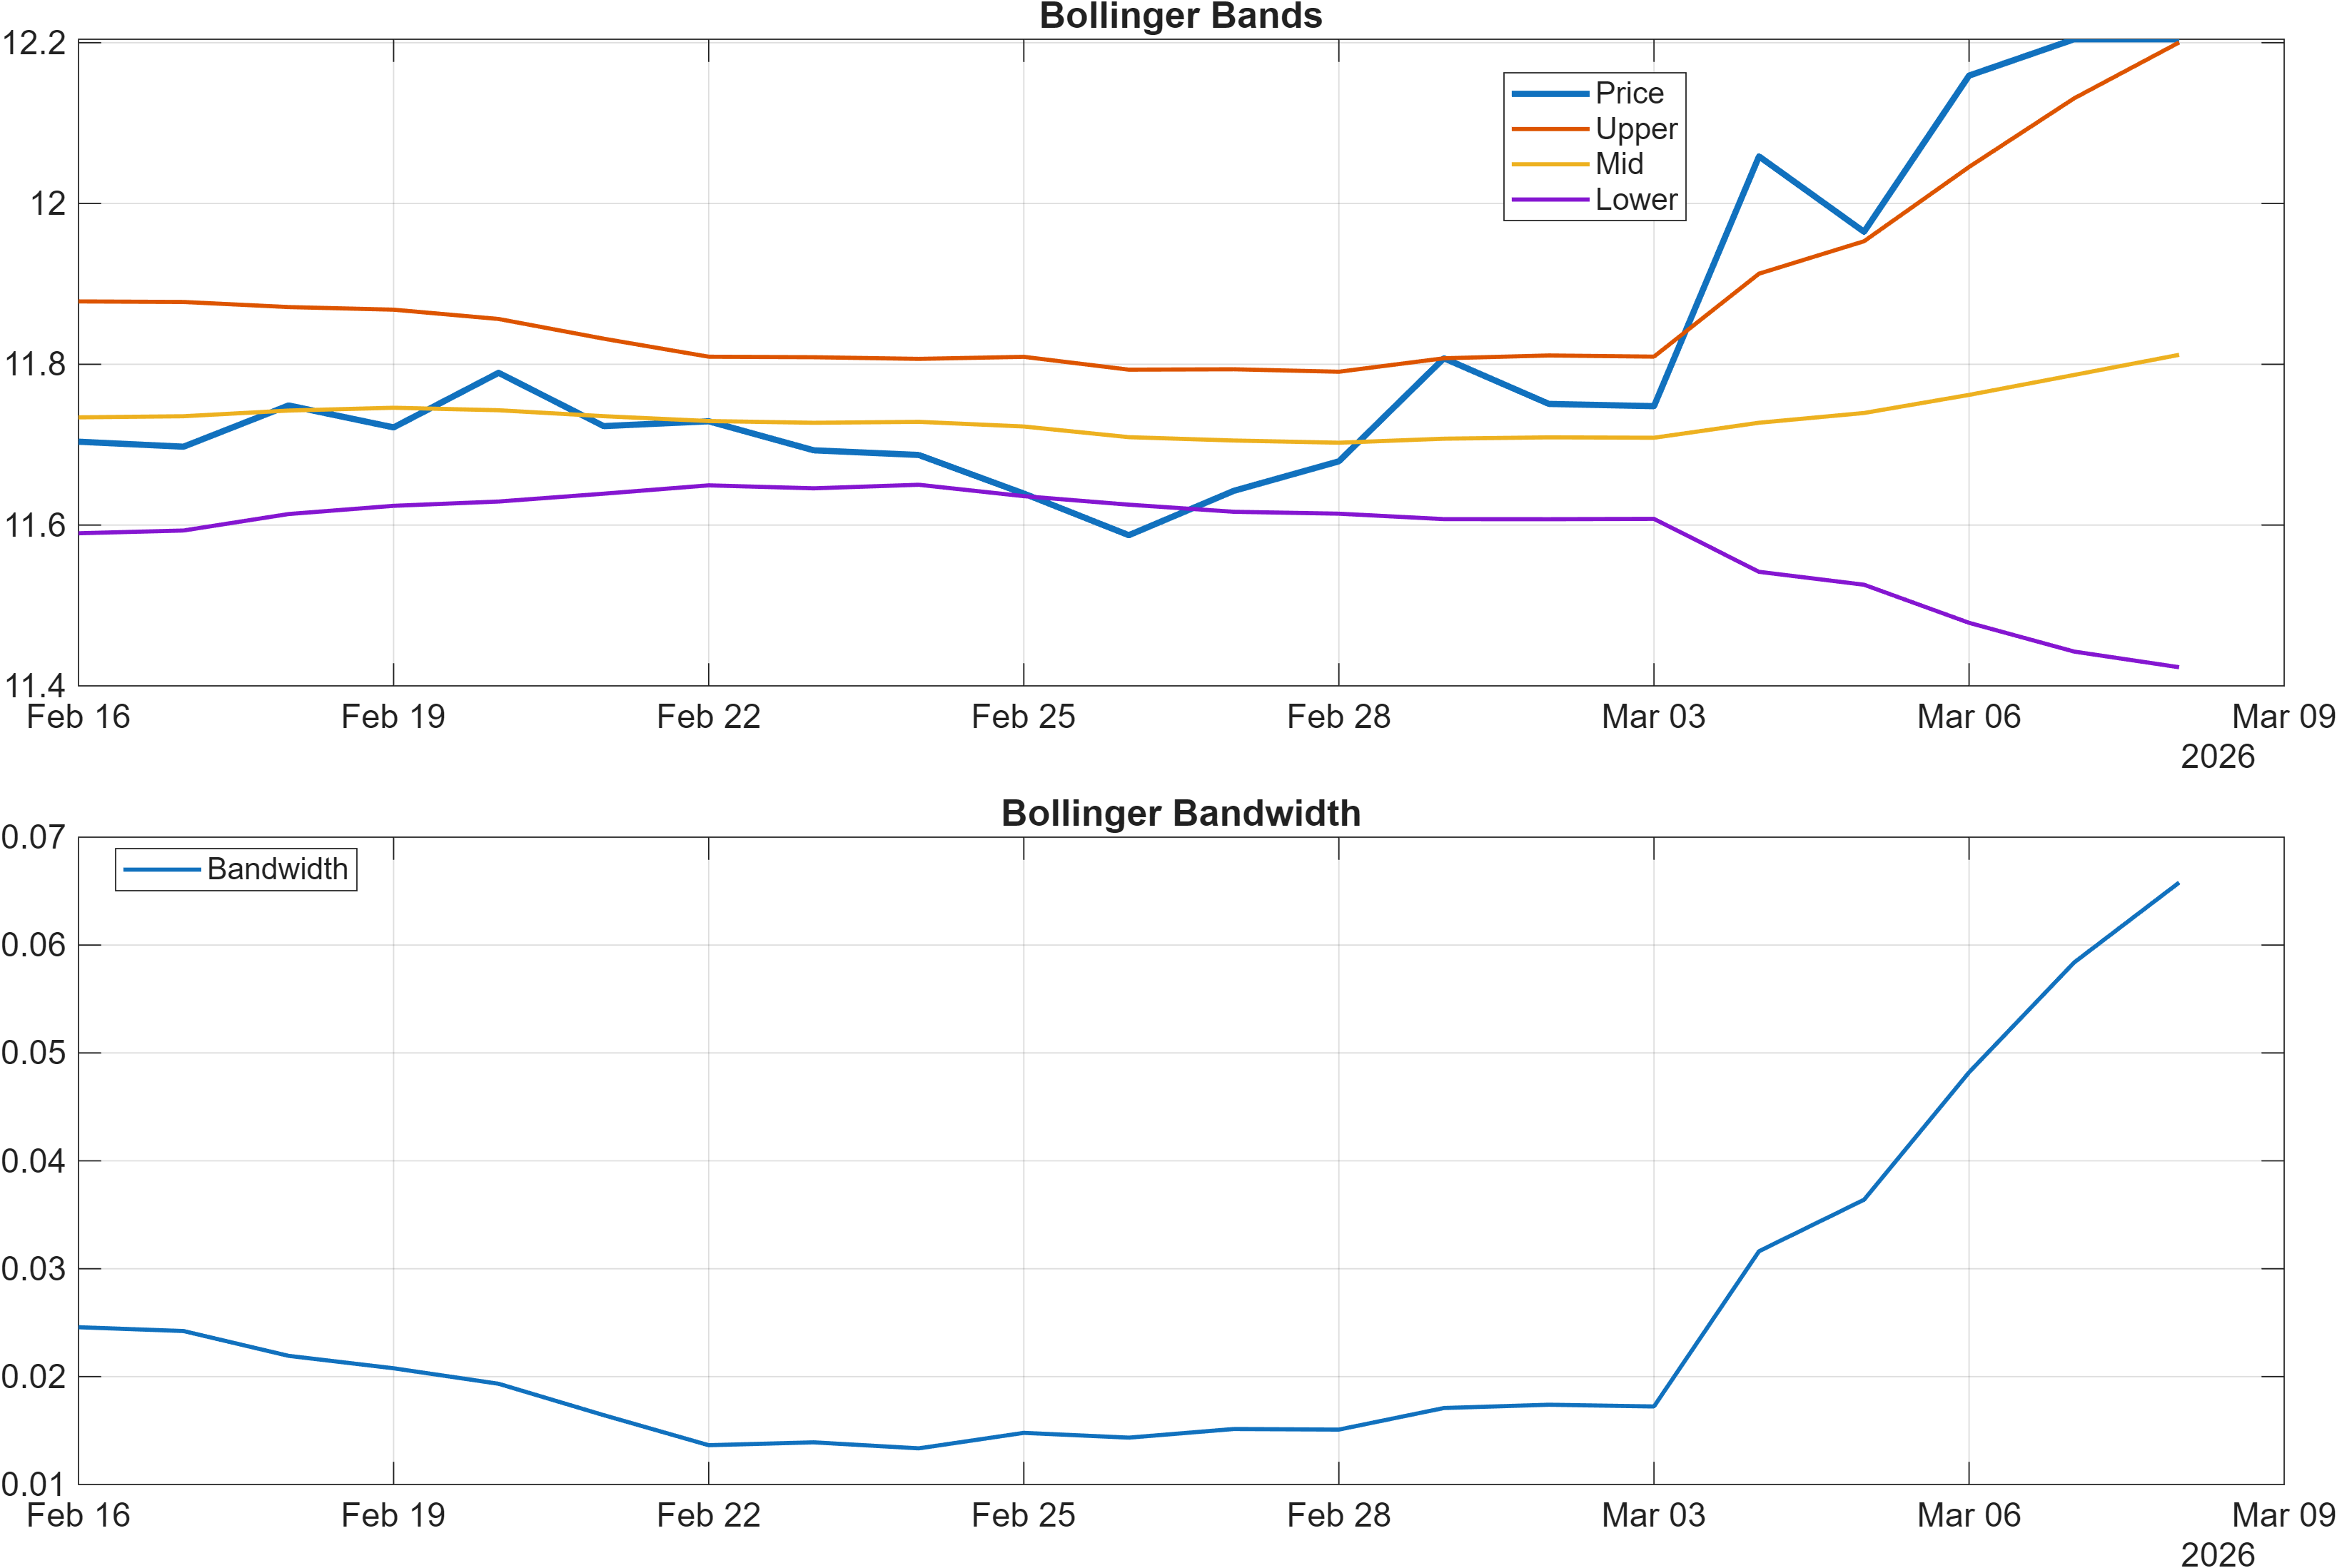
Interpretation: Bandwidth (volatility regime) latest = 0.0658.
4) Support / Resistance zones
The current decision map is relatively tight: Support ~ 11.6322 and Resistance ~ 12.0475. With momentum constructive (e.g., MACD histogram 0.0612) but trend alignment mixed (Close vs MA50 Bullish; MA50 vs MA200 Bearish), these levels act as the primary validation framework for whether the cross remains range-bound or transitions into continuation.
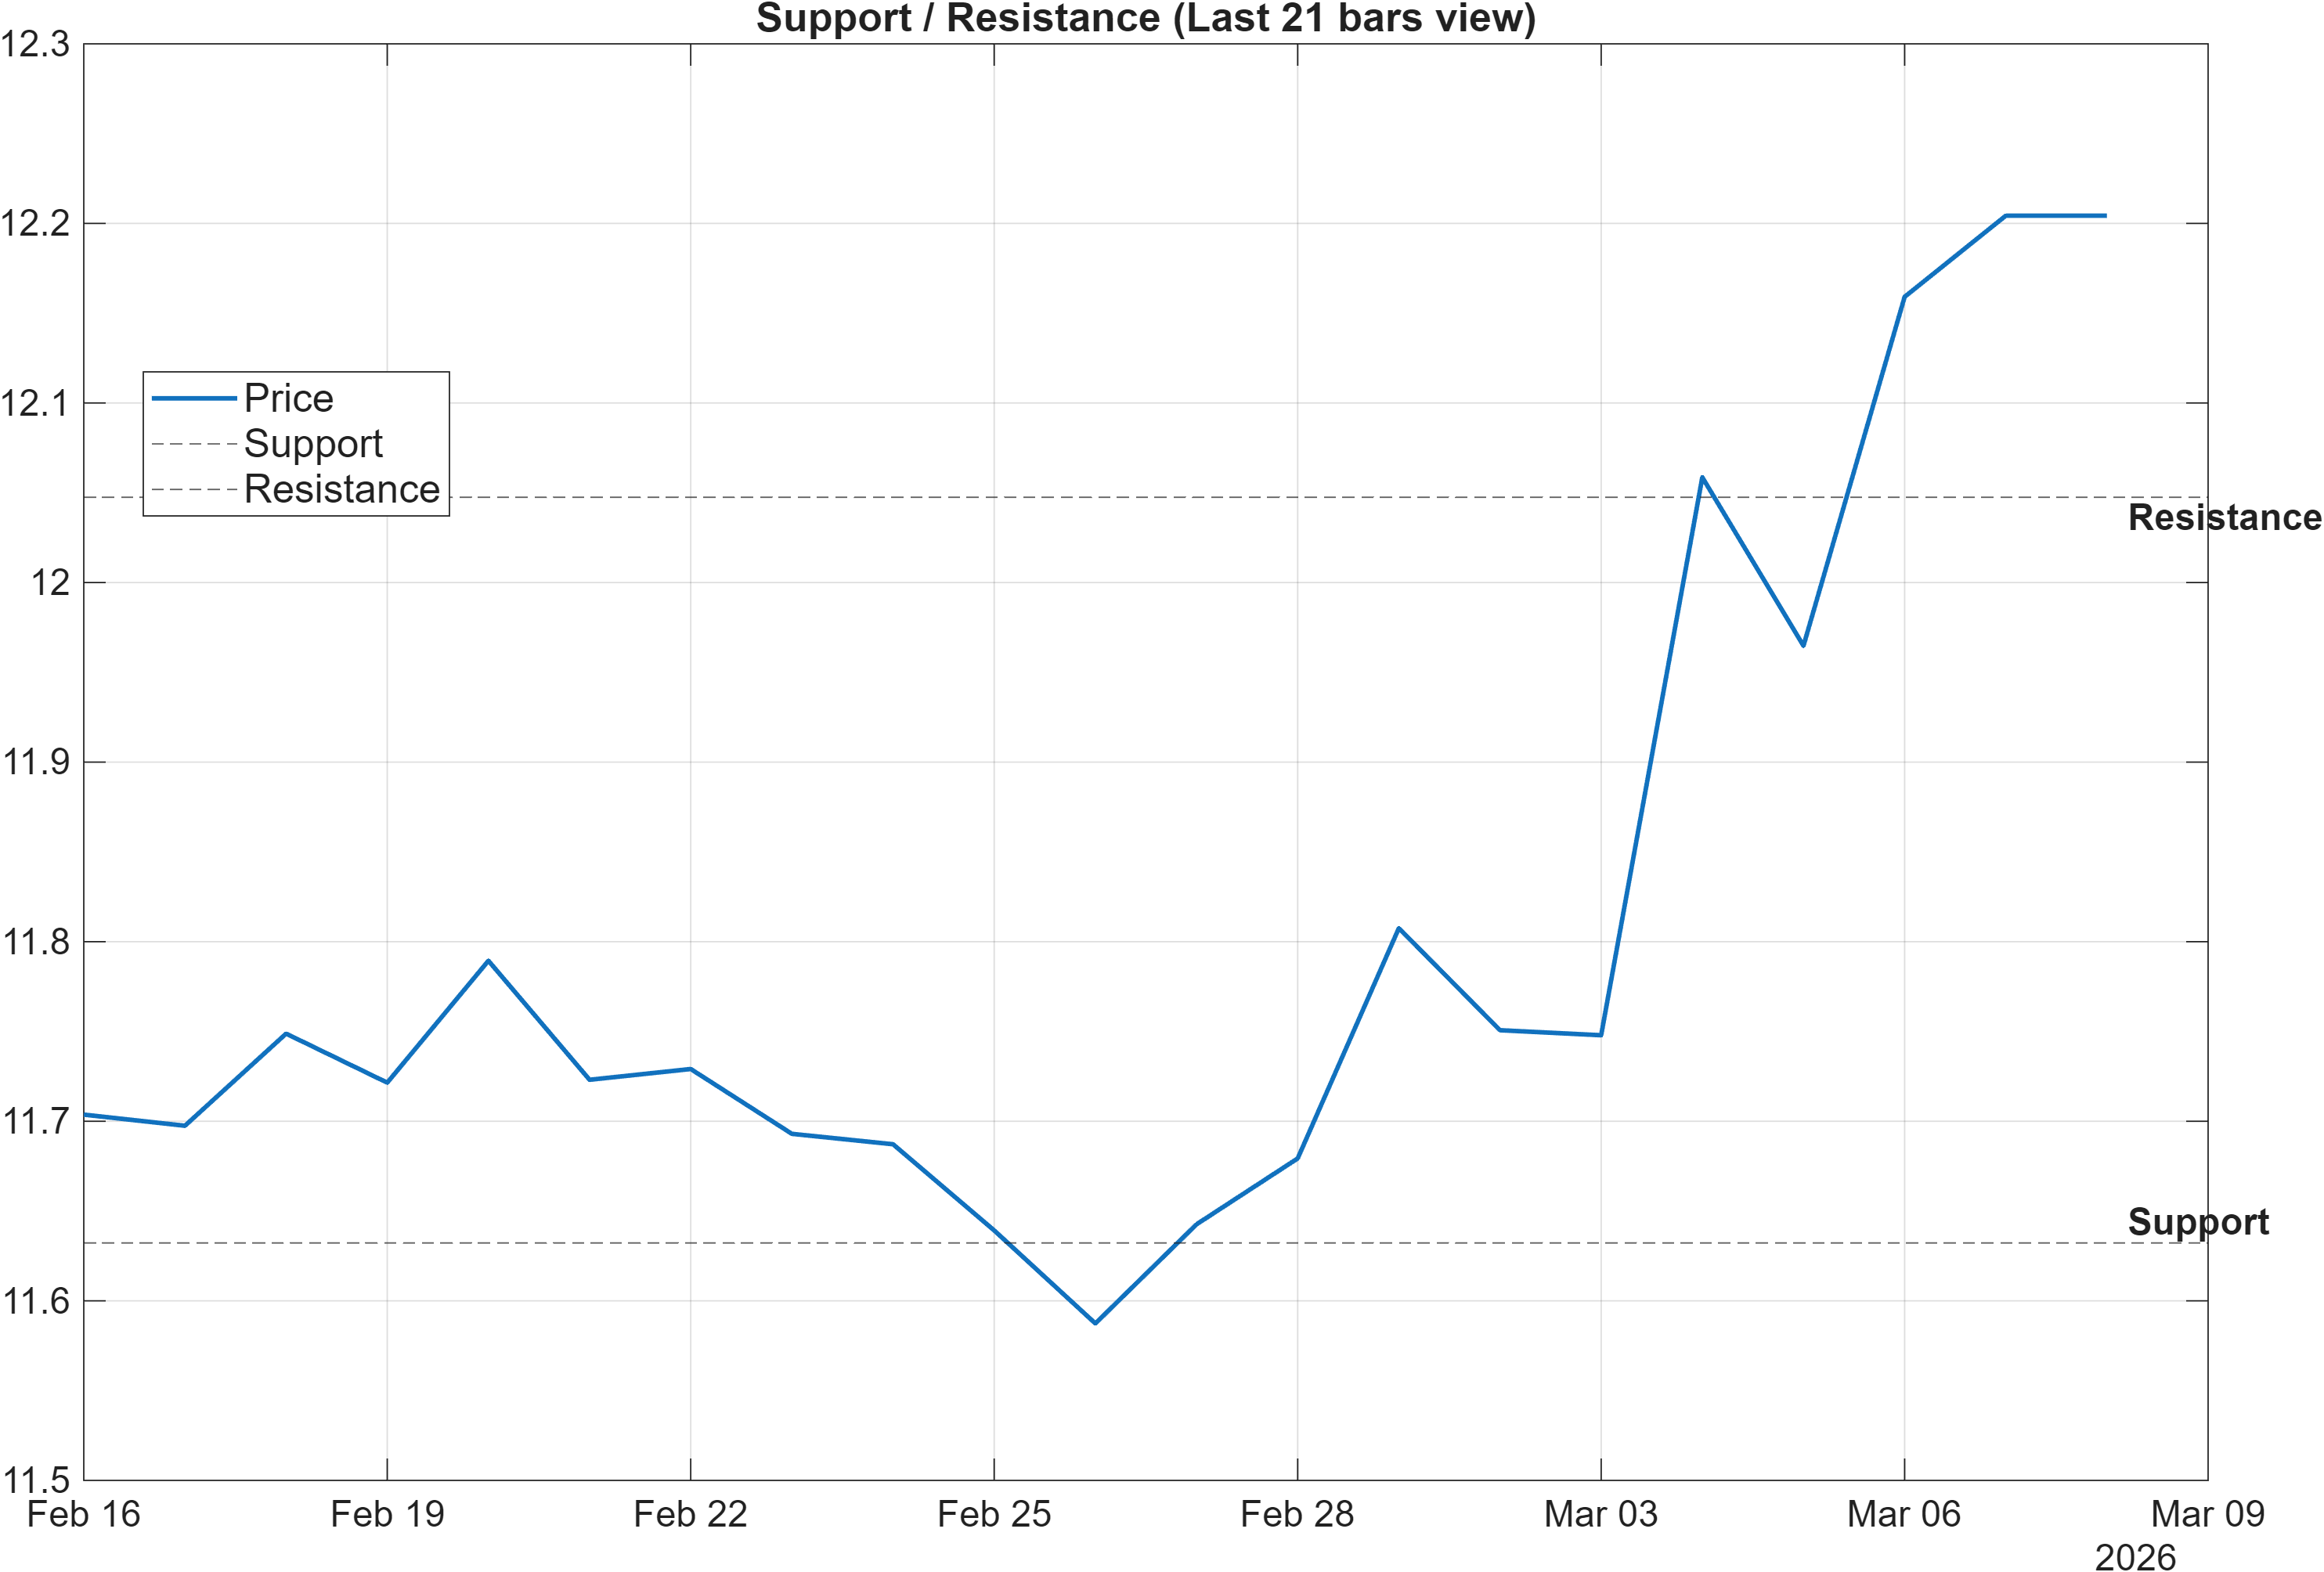
Range integrity vs. breakout validity
Because Bollinger volatility is contained (Bandwidth 0.0658), price can move from “quiet” to “directional” quickly, but the signal quality is usually dictated by whether price can accept beyond the boundary rather than briefly trade through it. The scenario guidance is explicit: break above resistance with volume → continuation, while a close below support → signal deterioration risk. Even without instrument-specific volume analytics in the provided data, the structure indicates that closing behavior is the main arbiter.
From an indicator-combination standpoint, elevated RSI (72.3) can either reflect trend strength or exhaustion; the difference is often resolved at resistance. If 12.0475 fails repeatedly, high-RSI conditions tend to degrade into sideways churn. Conversely, sustained acceptance above resistance can convert the current mixed-trend setup into a clearer continuation profile, which would also be more consistent with the stronger longer-horizon ranks (notably 6-Monthly #15).
Scenario view: Break above resistance with volume → continuation. Close below support → signal deterioration risk.
5) Quant Technical Dashboard (18 Signals)
KGNAI AI Technical Analysis Score (Deep Reinforcement Learning): Rank #206 out of 968 (Rank 1 represents the strongest technical positioning and a higher probability of favorable price behavior. As ranks increase toward the maximum, the probability of favorable outcomes weakens and bearish positioning becomes more dominant.) | Label: Neutral | Score: 0.574
18-Signal Technical Confluence Score: 0.278 (Neutral)
Overall Technical Score (18-signal confluence + DRL rank blend): 0.367 (Bullish)
Note: The blended score reflects signal strength weighted against broader AI technical ranking, which may temporarily diverge.
Blended technical score breakdown: 0.367 (Bullish | Bull 7 / Bear 2 / Neutral 9)
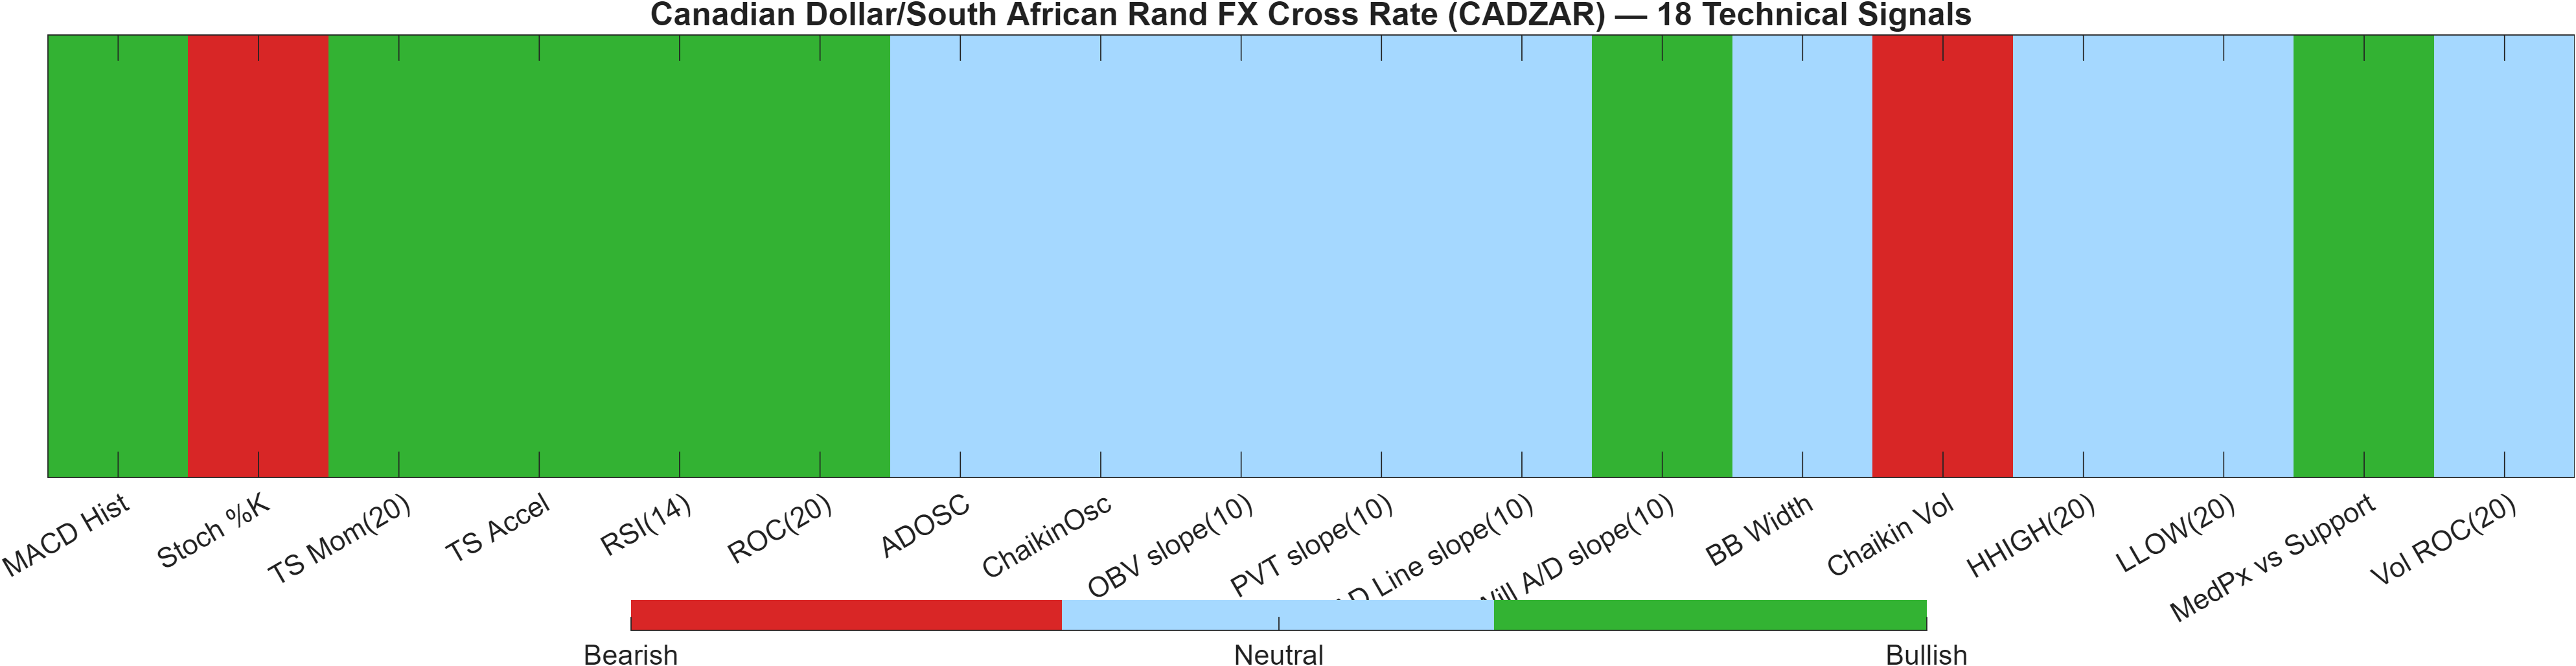
The dashboard is best read as a blend of breadth and model-weighted context. On breadth alone, the 18-signal confluence score is Neutral (0.278), indicating that signals are not uniformly aligned. Yet the blended output shifts to Bullish (0.367), implying that the AI-weighted combination views the current mix as modestly constructive relative to the broader universe—even though the DRL technical rank is #206 (Neutral) and not in the top tier.
Internally, the breakdown (Bull 7 / Bear 2 / Neutral 9) suggests signal compression rather than a trend-momentum “all clear.” The bullish subset includes momentum components (e.g., MACD Hist 0.06124 and TS Accel 0.4165), which helps explain why the blended score can turn bullish even when many components remain neutral. The bearish subset is small but non-trivial: Stoch %K 84.5 and Chaikin Vol 47.48 act as caution flags that upside pressure may be prone to short resets, especially if price fails at resistance.
The practical analytical message is asymmetry without full confirmation. A bullish blended score alongside a neutral confluence score often means the “quality” of bullish signals (in the model) is outweighing the quantity of neutral ones. In sideways markets, that can be constructive—provided the level structure in Section 4 is respected. If support near 11.6322 fails, the technical picture would likely shift quickly because the current bullish edge is not broad-based; it is concentrated in momentum and selected structure signals (e.g., MedPx vs Support 0.5721).
Signal table (Bull/Bear/Neutral)
| Indicator | Value | Signal |
|---|---|---|
| MACD Hist | 0.06124 | Bullish |
| Stoch %K | 84.5 | Bearish |
| TS Mom(20) | 0.5068 | Bullish |
| TS Accel | 0.4165 | Bullish |
| RSI(14) | 72.3 | Bullish |
| ROC(20) | 4.333 | Bullish |
| ADOSC | — | Neutral |
| ChaikinOsc | — | Neutral |
| OBV slope(10) | 0 | Neutral |
| PVT slope(10) | 0 | Neutral |
| AD Line slope(10) | — | Neutral |
| Will A/D slope(10) | 0.052 | Bullish |
| BB Width | 0.0658 | Neutral |
| Chaikin Vol | 47.48 | Bearish |
| HHIGH(20) | 12.31 | Neutral |
| LLOW(20) | 11.57 | Neutral |
| MedPx vs Support | 0.5721 | Bullish |
| Vol ROC(20) | — | Neutral |
Interpretation: Indicator-level signals form the base confluence, which is then adjusted using a separate AI-driven technical ranking model. The final technical score summarizes this combined view.
6) News sentiment + extractive gist
Note: Instrument-specific news matches were not found, so the digest includes broader market/sector headlines. Links are provided for verification.
Sentiment score (avg): 0.016 | Positive: 31% | Neutral: 50% | Negative: 19%
KGNAI AI News Sentiment Score (normalized -1 to +1): Not available (as of —) | Label: Not available | Overall news score: 0.02
Positive Developments
Recent coverage across major financial outlets indicates a modestly constructive backdrop for risk assessment despite ongoing macro uncertainty. The sentiment mix—31% positive versus 19% negative, with an average score of 0.016—leans slightly supportive rather than decisively directional. Market discussion has emphasized ongoing monitoring of growth and activity nowcasts, alongside FX dynamics in Asia where policy settings and fixing behavior have been framed as stabilizing influences. For CADZAR, this matters less as a direct fundamental driver (given the instrument-specific gap) and more as a contextual input into whether global risk appetite remains orderly. In a compressed-volatility technical regime (e.g., Bollinger Bandwidth 0.0658), a slightly constructive news tone can be enough to keep price leaning toward resistance testing rather than breaking down through support—provided price action confirms.
Neutral / Mixed Developments
The largest portion of items remains Neutral (50%), consistent with a market that is still processing cross-currents rather than converging on a single narrative. Updates around geopolitical signaling have been framed as conditional and fluid, while macro commentary has highlighted mixed reads on inflation and activity data. For a cross like CADZAR, this type of information flow tends to translate into range reinforcement: enough uncertainty to prevent clean trend follow-through, but not necessarily enough to force a persistent risk-off impulse. That neutral dominance aligns with the report’s broader theme—shorter-horizon ranks are Neutral even as longer windows remain Bullish—suggesting that catalysts may need to be clearer to force decisive price acceptance beyond 12.0475 or below 11.6322.
Negative / Risk Signals
Risk-oriented coverage has centered on the interaction between geopolitics, energy prices, and policy sensitivity—an environment that can quickly lift FX volatility even when technical measures currently appear contained. That risk framing is consistent with the presence of some cautionary technical flags inside the 18-signal dashboard, including Chaikin Vol 47.48 (Bearish) and a potentially stretched oscillator state (Stoch %K 84.5, Bearish). While the aggregate sentiment is not decisively negative (19% negative), the asymmetry is that adverse shocks can produce sharper moves when positioning is calm. For CADZAR, that suggests treating support near 11.6322 as a key deterioration threshold rather than assuming momentum readings (e.g., RSI(14) 72.3) will remain stable through a volatility transition.
- Whether risk headlines translate into sustained FX volatility beyond the current compression (Bandwidth 0.0658).
- Any shift in the balance between growth concerns and inflation risk that changes broad USD sensitivity.
- Whether price confirms a level break at 12.0475 or fails back toward 11.6322.
Sources referenced: Reuters, Bloomberg, Yahoo Finance, MarketWatch, Investing.com
Snapshot: AI Rank (Short–Mid–Long): Mixed (Neutral–Neutral–Bullish) · Technical Confluence: Neutral · Key Levels: Support ~11.63 | Resistance ~12.05 · News Sentiment: Neutral
7) Sources
Not available in the provided data.
You may also like: How KGNAI AI ranks instruments across global markets
Disclaimer: KGNAI provides AI-generated analytics and educational market commentary only. This is not financial advice. Markets involve risk. Always do your own research.