
World Currency Unit (XCUUSD) — 04-Mar-2026 Technical & Rank Review as Weakness Develops Methodically
XCUUSD is currently characterized by persistently weak cross-horizon ranking alongside a technical picture that is neutral at the surface but bearish when blended with AI rank context. In the ranked FOREX universe (958 instruments), the weekly and longer-window placements sit deep in the lower tier (for example, weekly #939 and yearly #893), while the daily rank #725 suggests near-term pressure without a clean capitulation signal. Technically, price relative to key moving averages flags a bearish close vs MA50 despite a bullish MA50 vs MA200 slope relationship, a configuration that often coincides with late-cycle trend stress. Momentum gauges reinforce caution: RSI(14) at 28.96 and a MACD histogram of -0.0013 indicate downside bias, while Bollinger bandwidth near 0.0100 implies a comparatively compressed volatility regime where breakouts require confirmation. Key decision zones remain support ~1.3366 and resistance ~1.3543.
- Rank stance (Short / Mid / Long): Bearish / Bearish / Bearish (daily rank #725; weekly #939; yearly #893 out of 958).
- Technical confluence label: Neutral (18-signal score -0.278), but overall blend is Bearish (-0.464).
- Key levels: Support ~1.3366 | Resistance ~1.3543.
- News sentiment bias: Mildly positive by score (0.61) despite predominantly neutral classification (75% neutral; avg 0.051).
- Confirmation / invalidation condition: A sustained break above 1.3543 with participation would be needed to reduce downside bias; a close below 1.3366 increases deterioration risk.
KGNAI evaluates assets using large cross-sectional datasets built from millions of structured data points. Inputs incorporate fundamental metrics, technical structures, and systematically processed news sentiment. Statistical models, machine learning, and AI frameworks are used to assess relative positioning, signal alignment, and probabilistic behavior across broad universes.
- Ranks are comparative across the tracked universe, not absolute price targets.
- Confluence reflects alignment among independent signal groups.
- Support/resistance levels are probabilistic decision zones, not guarantees.
- Sentiment provides contextual bias within the broader analytical framework.
1) KGNAI AI Analysis
Region: FOREX
Total universe size: 958 ranked instruments
- Daily rank: #725 out of 958 — Neutral
- Weekly rank: #939 out of 958 — Bearish
- Monthly rank: #489 out of 958 — Neutral
- 3-Monthly rank: #922 out of 958 — Bearish
- 6-Monthly rank: #899 out of 958 — Bearish
- Yearly rank: #893 out of 958 — Bearish
Cross-horizon ranks are not uniformly weak in the very near term, but the weight of evidence tilts bearish once the weekly through yearly windows are prioritized. The weekly rank (#939), 3-month rank (#922), and 6-month rank (#899) place XCUUSD near the bottom of the 958-instrument universe, indicating that relative performance behavior has been persistently unfavored versus peers. This is consistent with the report’s term view, where short-, mid-, and long-term are all flagged as bearish.
The main nuance sits in the shorter-term contrast: the daily rank (#725) and monthly rank (#489) are less extreme than the weekly/quarterly windows. That divergence can reflect either (a) a short-lived stabilization attempt within a broader weak regime, or (b) a lag where longer-window models are still capturing earlier deterioration. Because the weekly and multi-month ranks are clustered near the maximum (worse) end, the balance of probabilities favors treating the monthly neutrality as insufficient on its own to reclassify the regime.
From a market-structure perspective, this rank configuration often corresponds to a tape where incremental rebounds fail to translate into durable relative strength. Practically, the most informative use of these ranks is conditional: improvement would need to appear first as a consistent lift from the bottom tier on the weekly and 3-month horizons, not only on daily noise. Until then, XCUUSD remains positioned as a lower-tier candidate within its tracked FX universe.
2) Price & trend overview
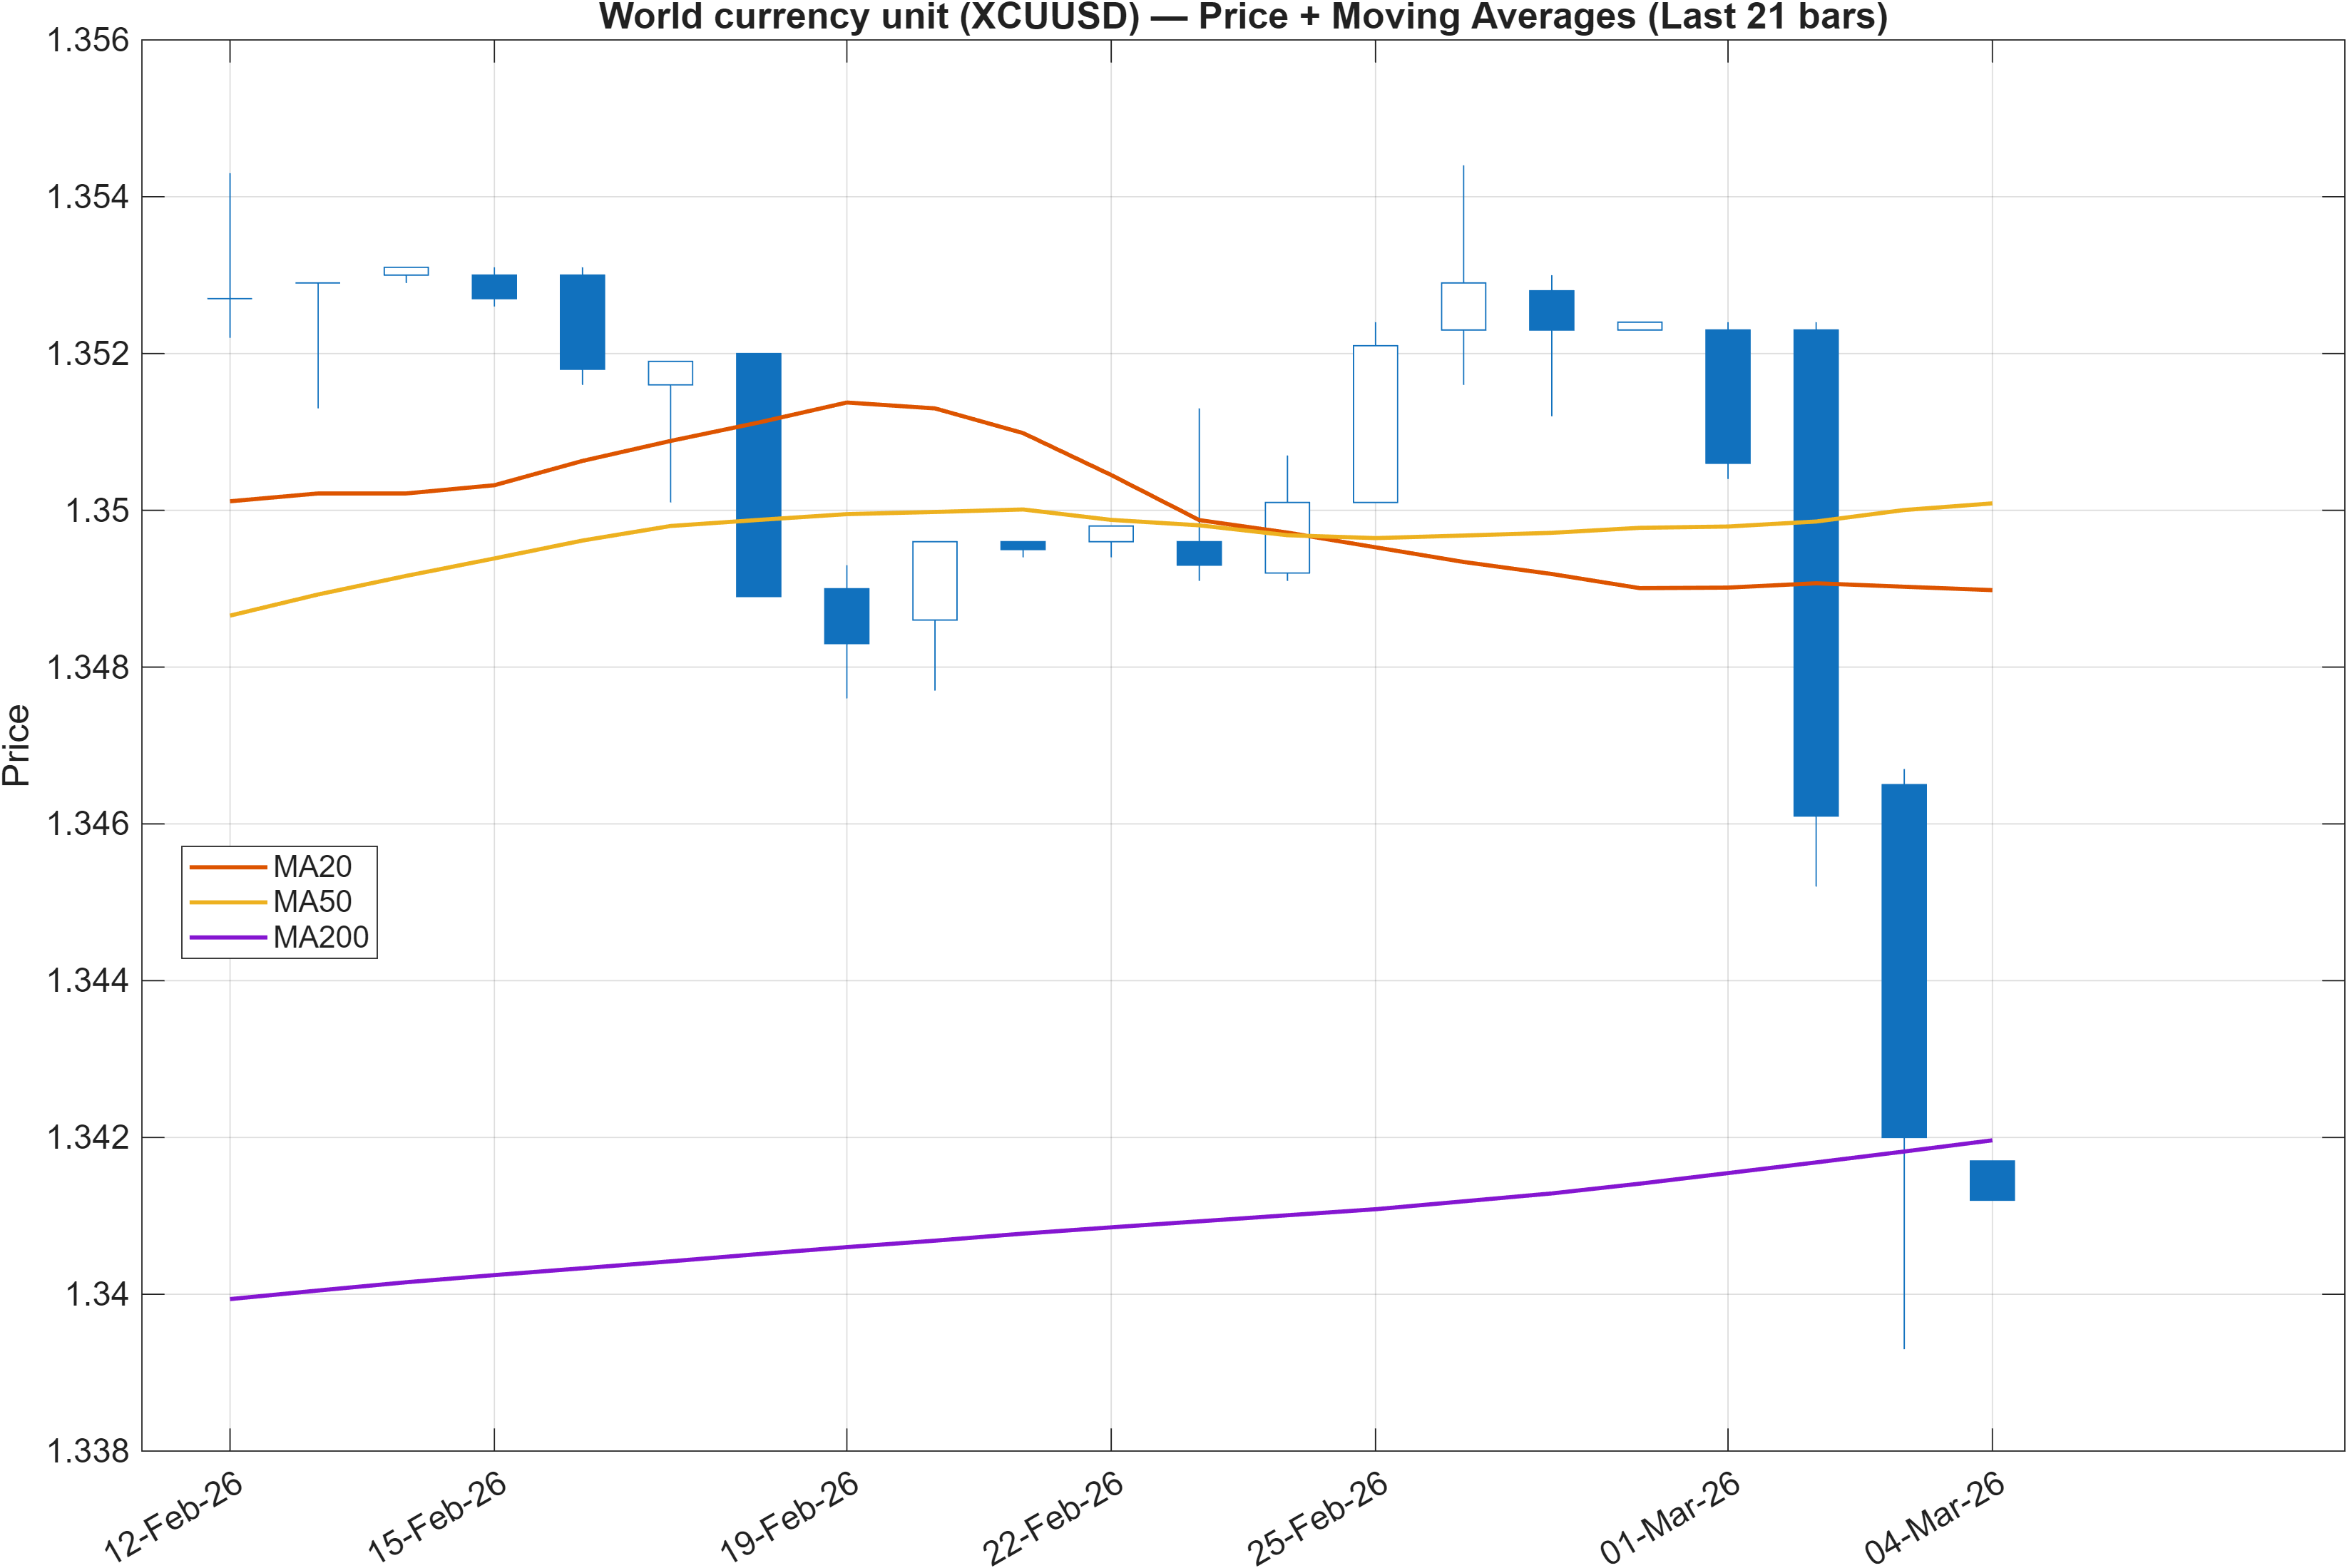
Interpretation: Close vs MA50 = Bearish, MA50 vs MA200 = Bullish.
XCUUSD’s trend read is defined by a mixed moving-average structure: price is below the MA50 (bearish), yet the MA50 remains above the MA200 (bullish). This combination can describe a market transitioning from an older uptrend into a corrective phase, where the longer-term slope has not fully rolled over but shorter-term pricing is already impaired. In that setting, the next informative step is whether price can recover and hold above the MA50; absent that, the MA50/MA200 bullish relationship can become a lagging artifact rather than an active tailwind.
The rank context reinforces the cautionary interpretation. With the weekly rank at #939 and yearly rank at #893 (out of 958), the broader relative regime is weak, which raises the bar for treating any MA-based stabilization as durable. Said differently: even if price begins to mean-revert toward its intermediate average, the cross-sectional model is currently classifying XCUUSD among the weaker instruments in its universe.
The nearby structural levels also frame the trend state. With support ~1.3366 and resistance ~1.3543, the instrument is operating within a relatively tight decision band. In transitional regimes like this, markets often oscillate between these zones while participants await confirmation from momentum and volatility (covered next). A clean resolution tends to be more informative when it aligns with the broader rank regime; for now, the ranks suggest that upside follow-through would need to be unusually convincing to shift the prevailing bias.
3) Momentum & volatility dashboard
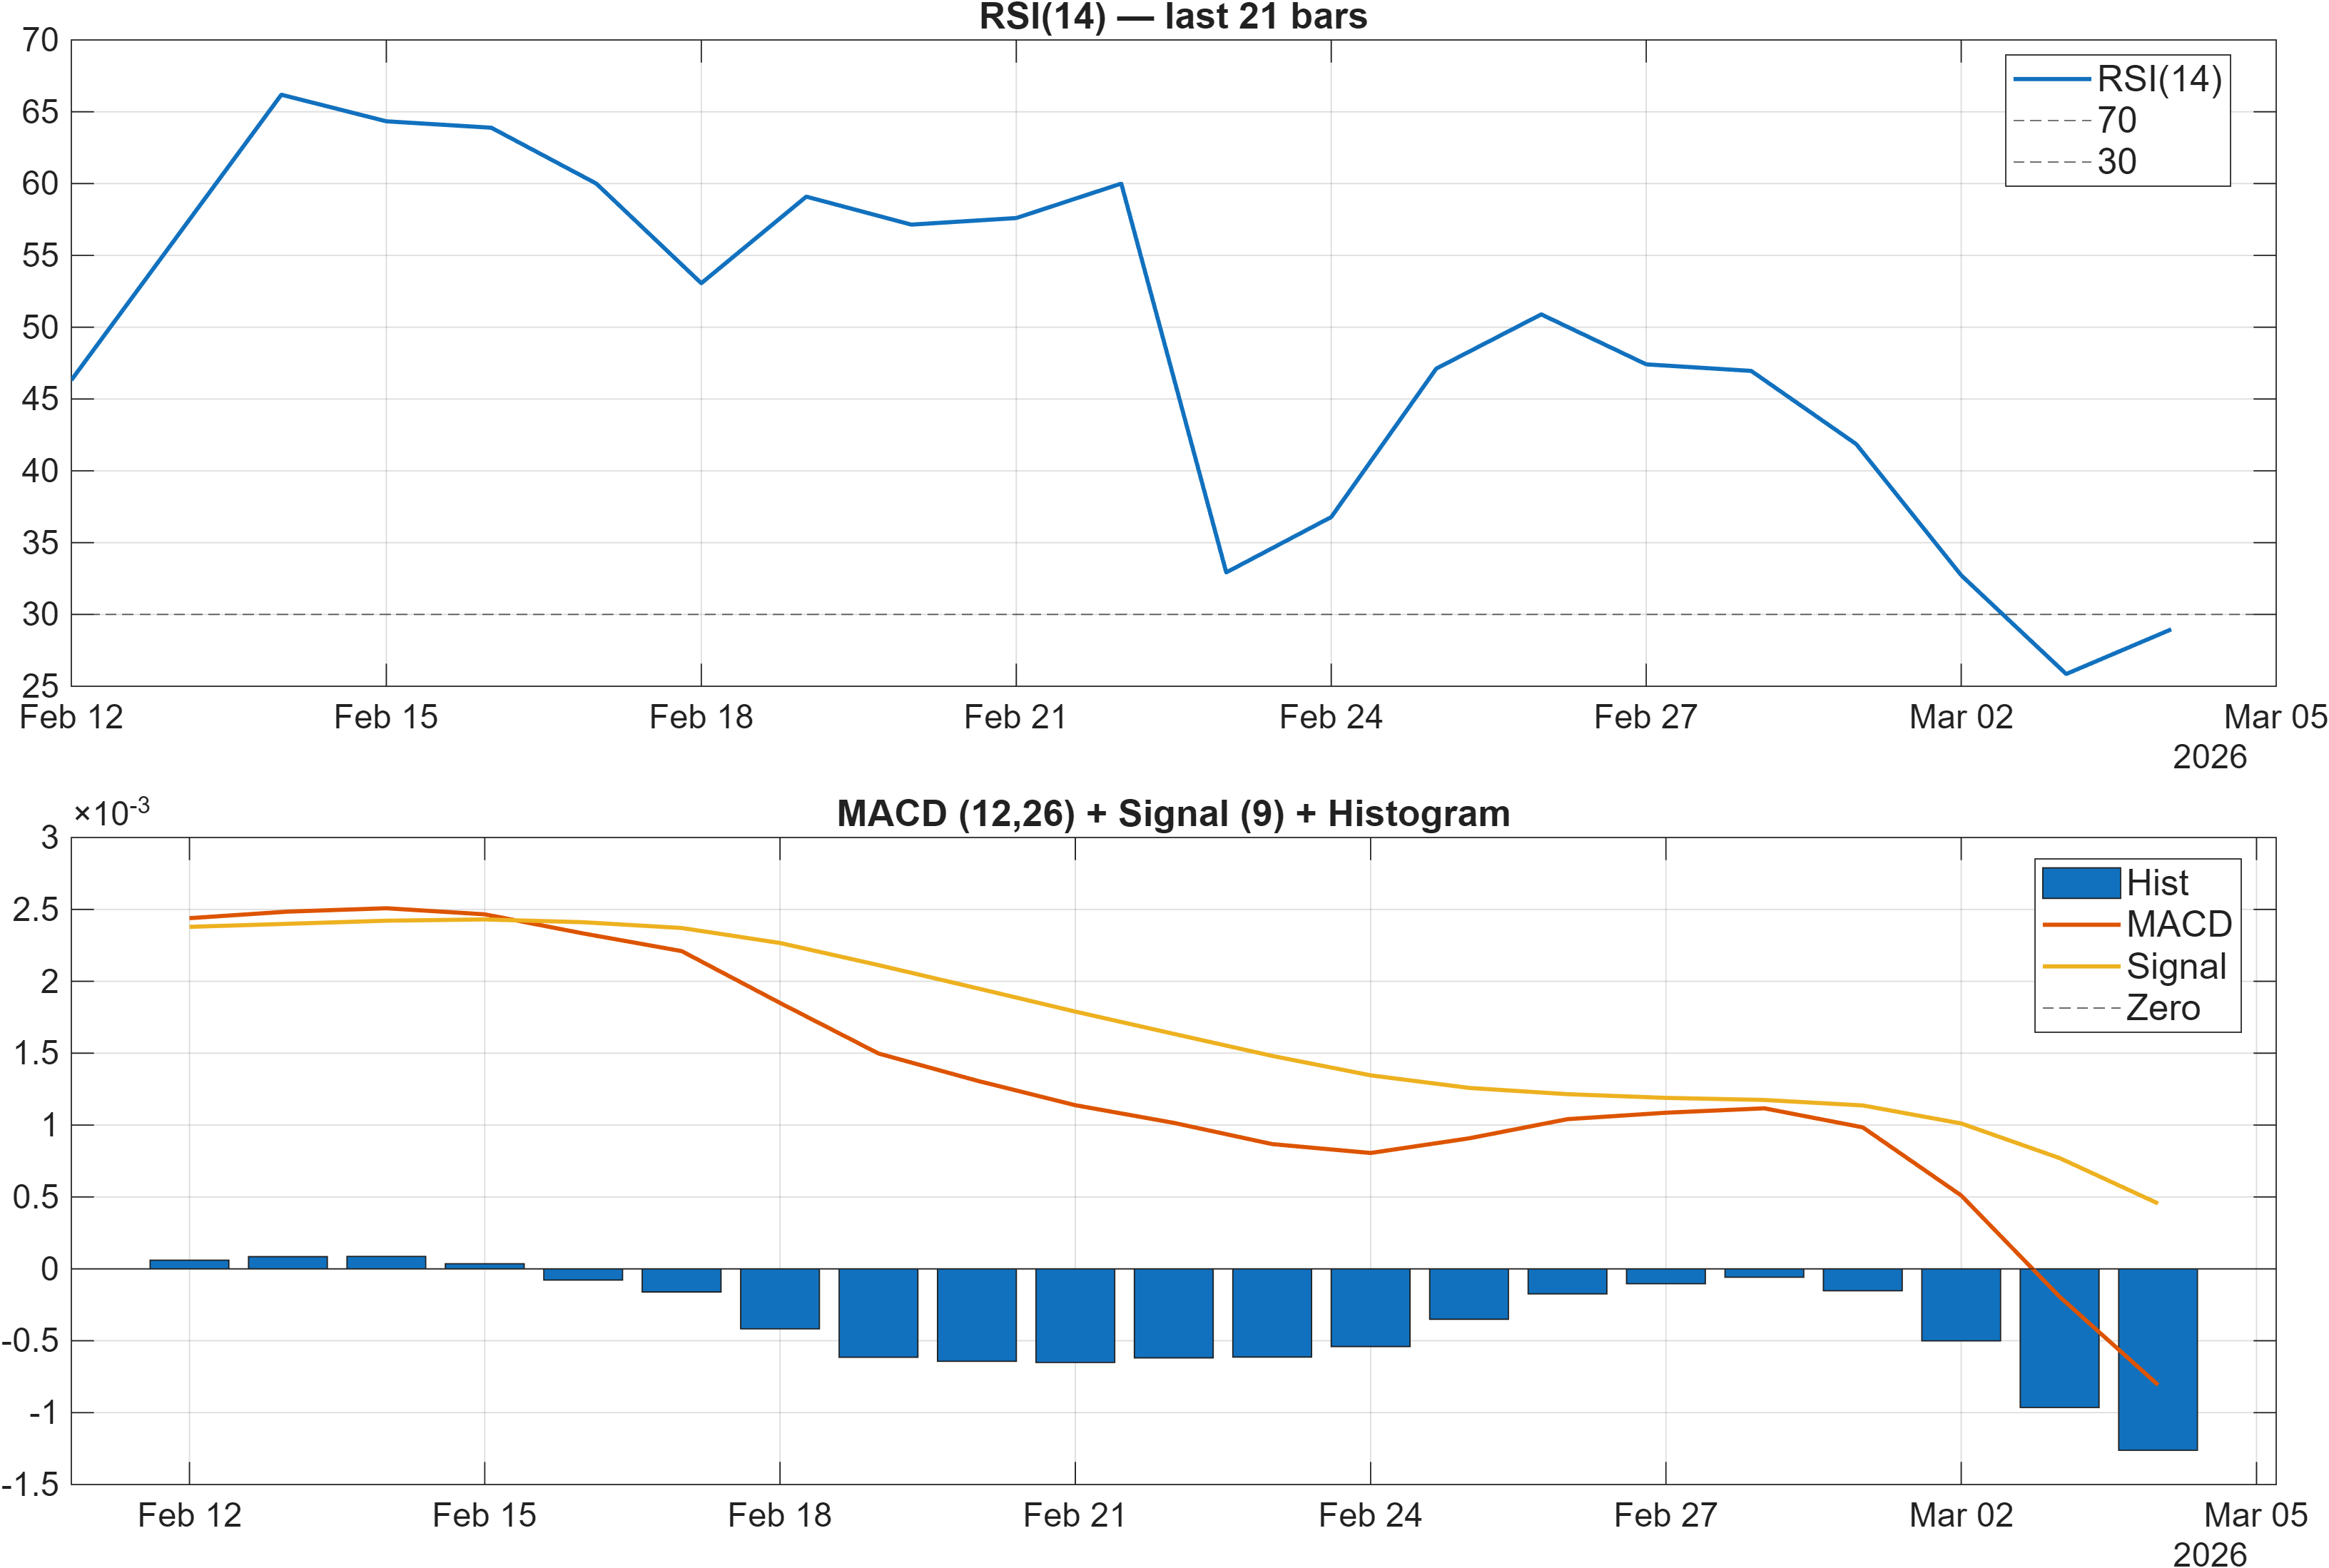
Interpretation: RSI bias = Bearish, MACD hist = -0.0013.
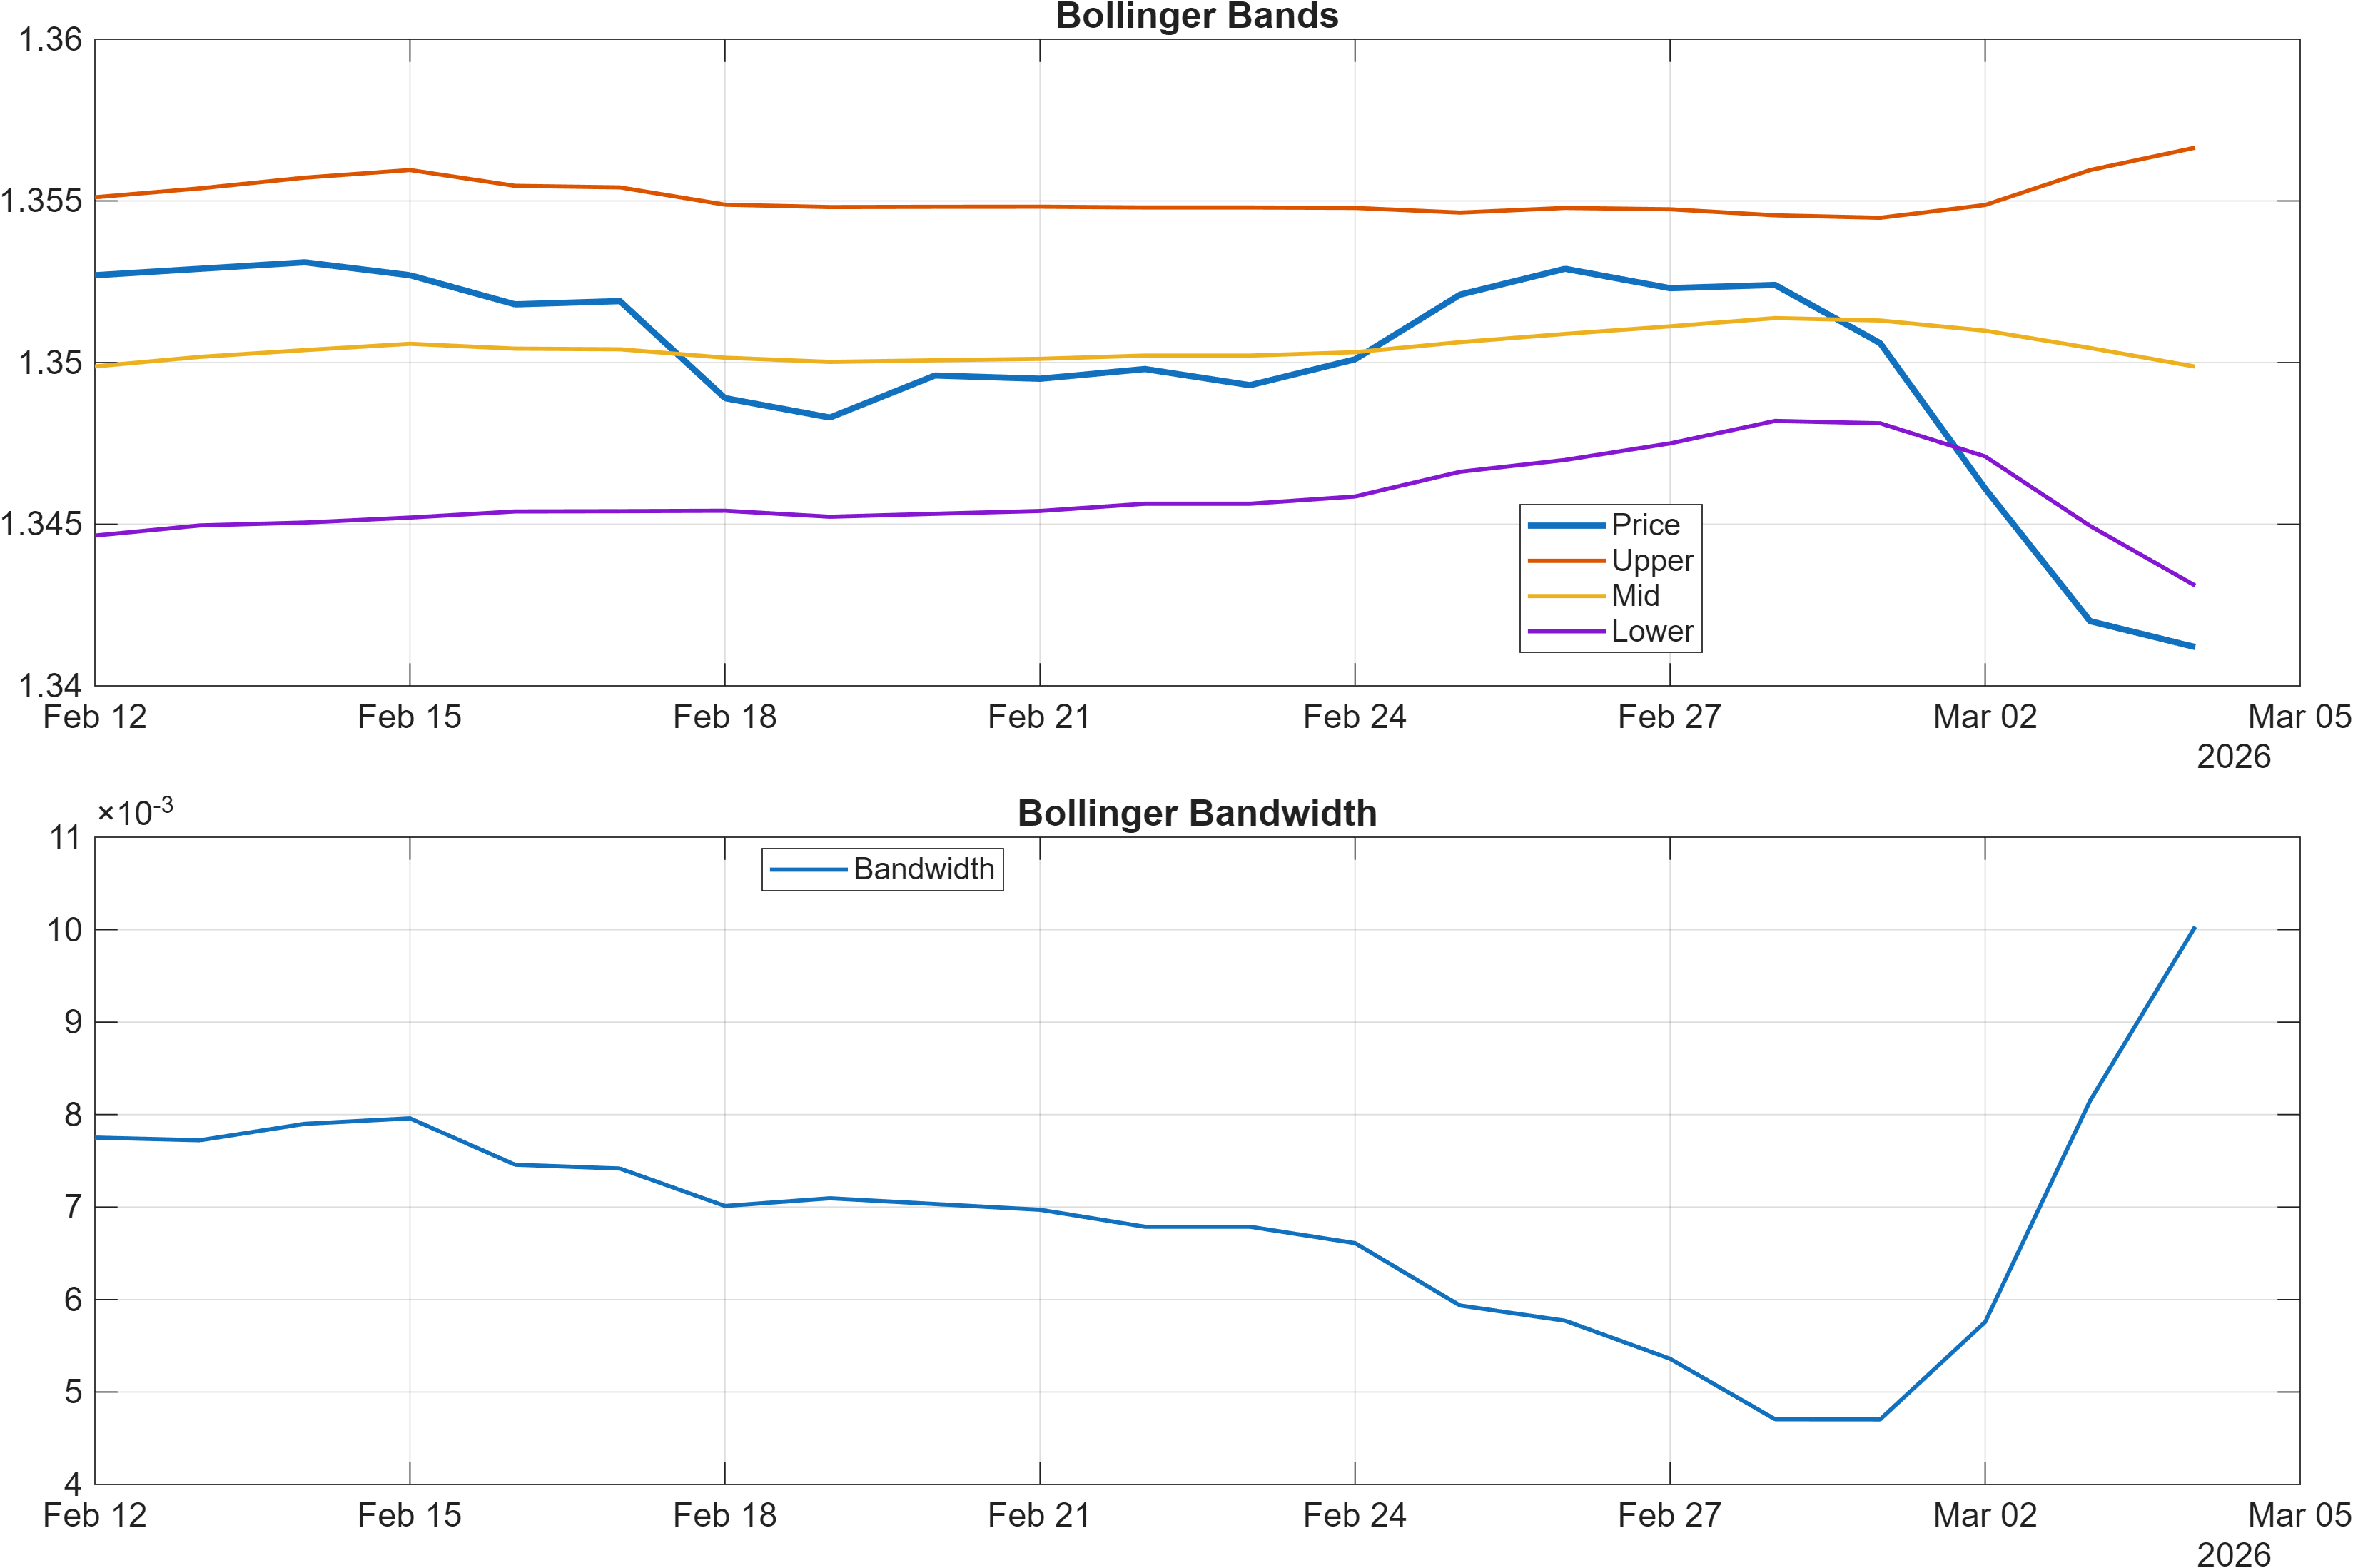
Interpretation: Bandwidth (volatility regime) latest = 0.0100.
Momentum currently leans toward trend persistence rather than mean reversion. The RSI(14) at 28.96 is consistent with bearish pressure and depressed impulse conditions, while the MACD histogram at -0.0013 indicates that downside momentum remains present rather than fully exhausted. In combination, these readings suggest that any bounce attempts may face headwinds unless momentum begins to stabilize (for example, RSI lifting out of the lower band while MACD histogram contracts toward zero).
Volatility adds an important constraint. With Bollinger bandwidth near 0.0100, the regime reads as comparatively compressed. Compression does not, by itself, specify direction, but it often marks a point where the market is pricing less dispersion even as momentum is negative. In bearish regimes, that mixture can lead to a “drift then break” pattern, where price continues to lean lower until a catalyst produces a sharper move.
The signal table later in the report echoes this momentum profile: TS Mom(20) at -0.0117 and ROC(20) at -0.8648 align with the negative MACD impulse, even as certain oscillators can flash tactical relief (e.g., Stoch %K is bullish). The key analytical point is asymmetry: when multiple momentum measures are negative and volatility is tight, downside continuation can occur quickly if support is tested and fails. Conversely, a durable upside reversal typically requires both momentum repair and a volatility expansion that holds above resistance.
4) Support / Resistance zones
Support ~ 1.3366 | Resistance ~ 1.3543
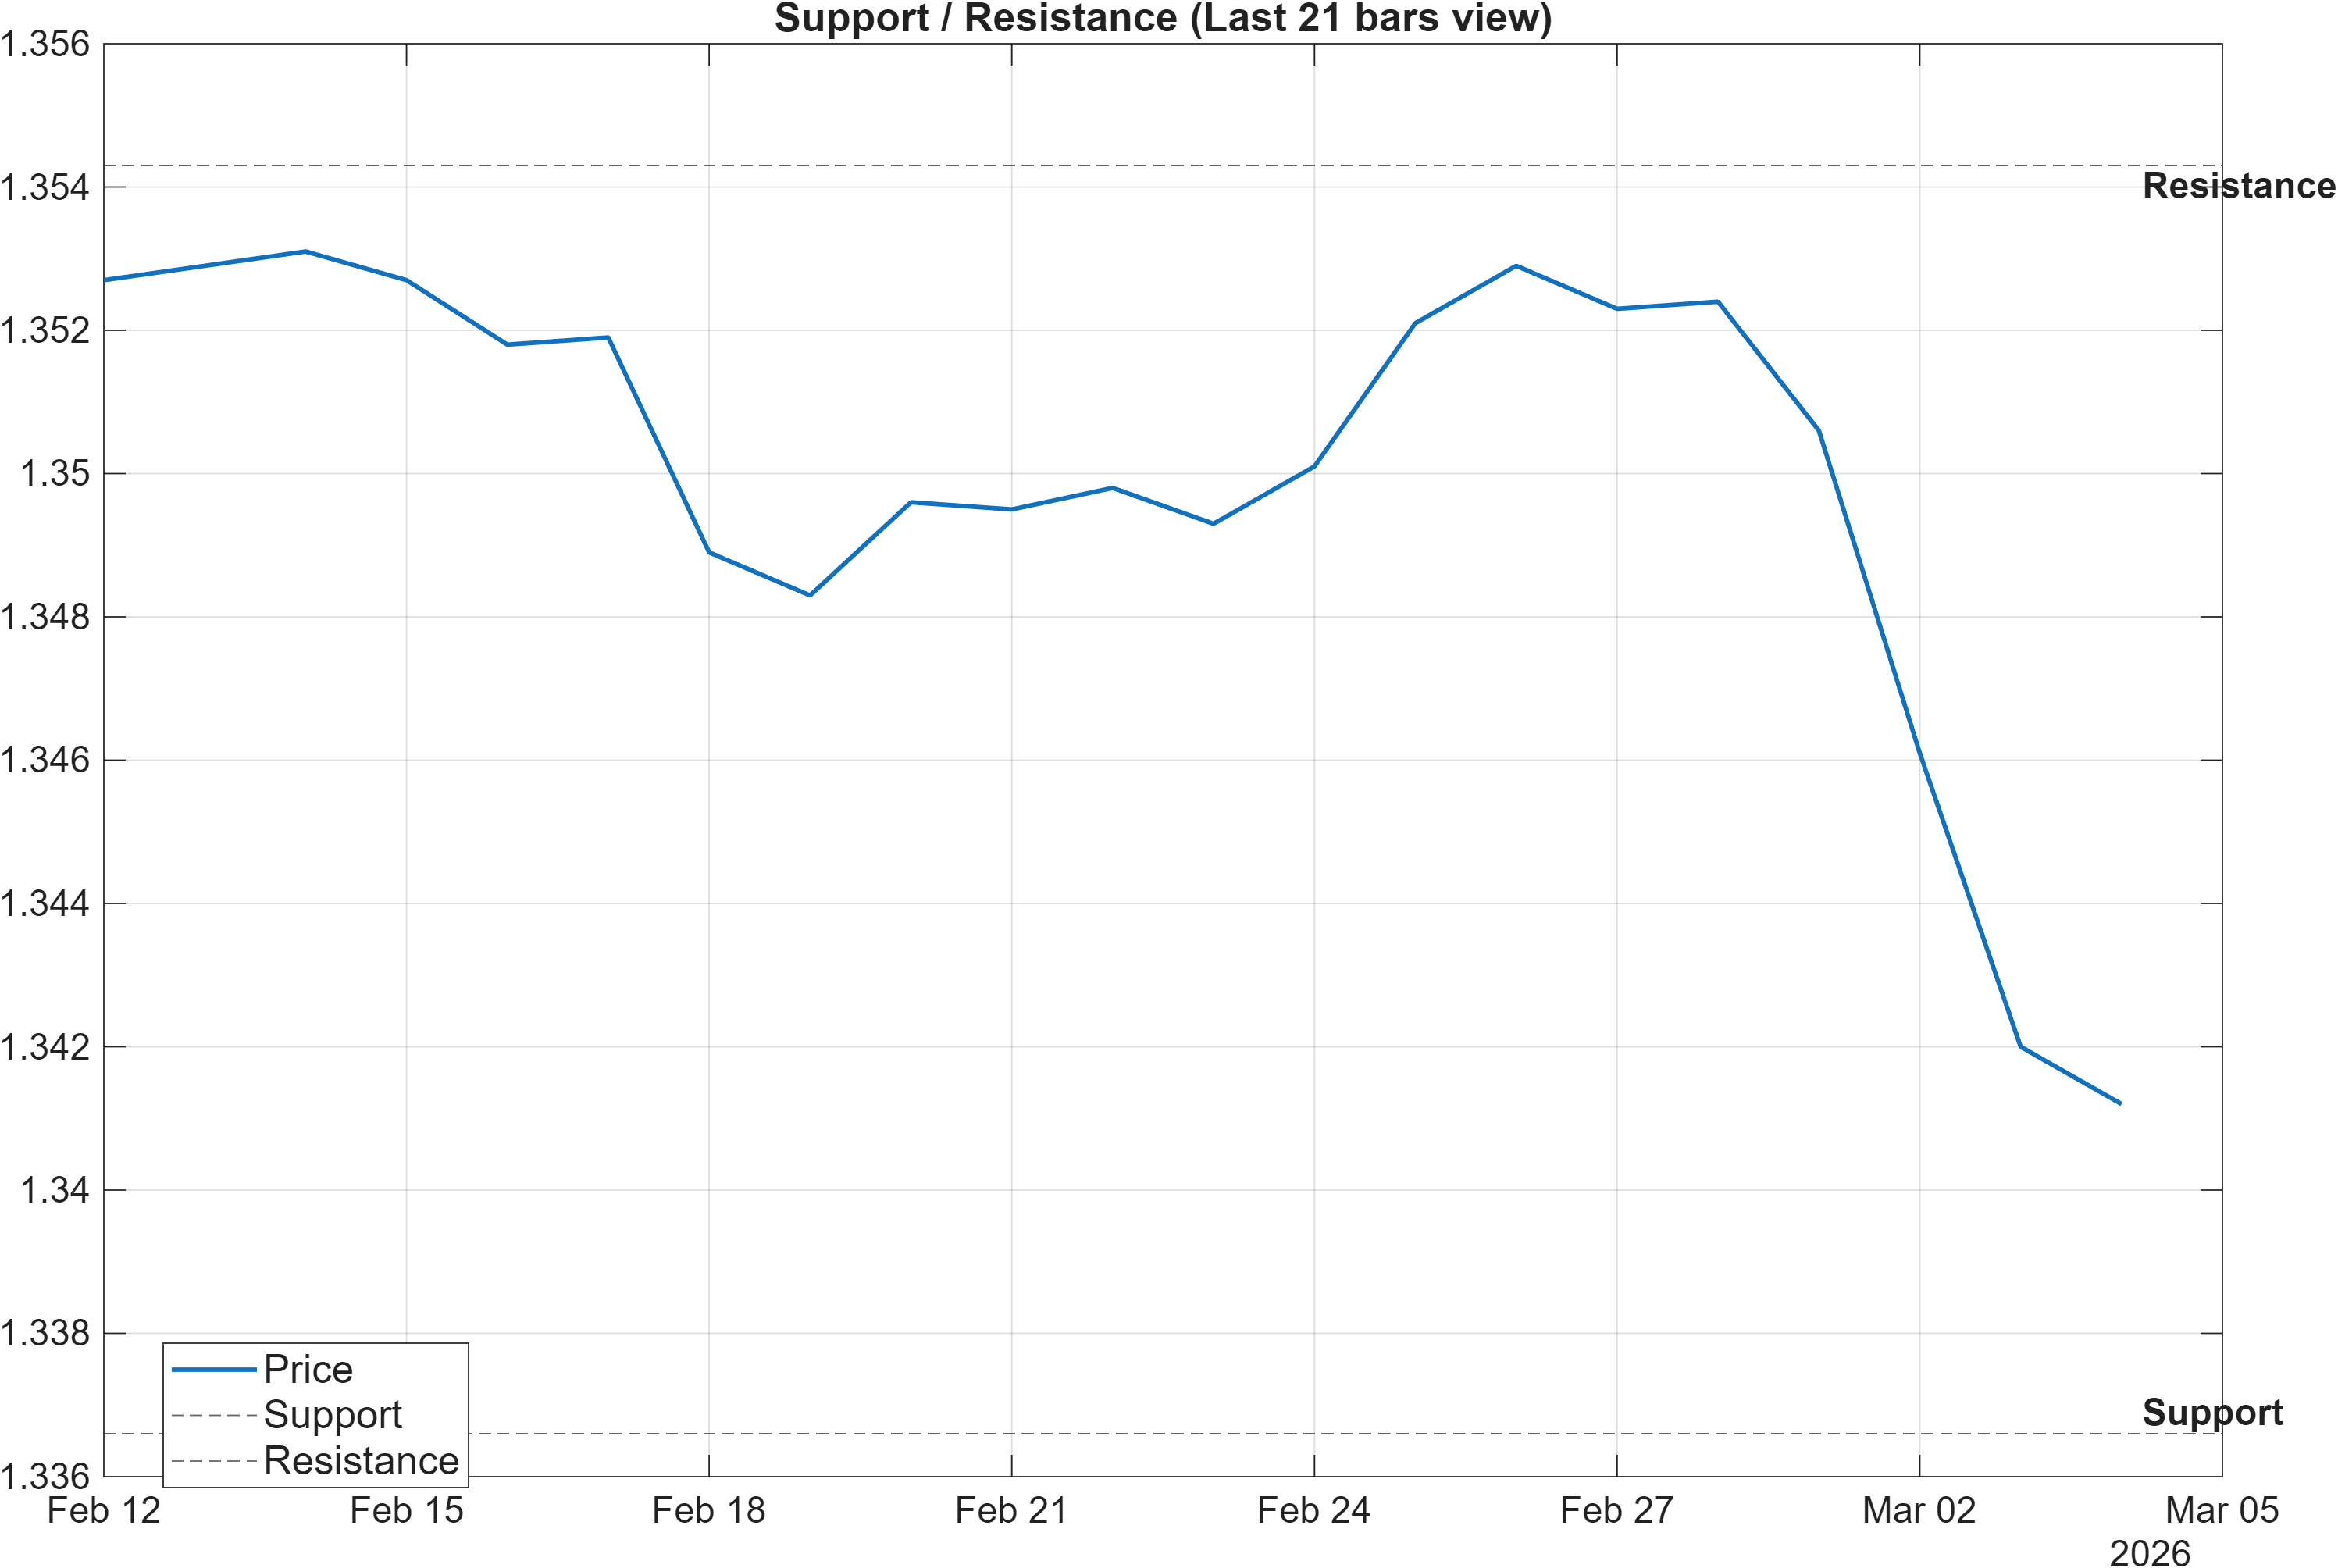
Scenario view: Break above resistance with volume → continuation. Close below support → signal deterioration risk.
The current map is straightforward: 1.3366 is the primary support reference and 1.3543 is the nearby resistance ceiling. What matters here is not the levels in isolation, but the way they interact with the broader signal set: momentum is already bearish (RSI 28.96, MACD histogram -0.0013), and cross-horizon ranks are weak (weekly #939, 3-month #922). That alignment increases the importance of support integrity; in weak-ranked regimes, supports often function as testing points rather than durable floors.
A break above 1.3543 would need to be evaluated as a quality move rather than a single print. The report’s scenario note emphasizes participation (“with volume”), which is consistent with the observation that multiple volume/flow measures are currently neutral in the signal set. If a breakout occurs without evidence of improved participation, it can resemble a range probe that later fades back into the band.
Conversely, a close below 1.3366 would be a clearer regime statement because it would align directionally with the existing momentum and the bearish overall technical blend (detailed in Section 5). Given the compressed bandwidth (0.0100), a breakdown can also coincide with volatility expansion—often the phase that converts “methodical weakness” into more decisive downside behavior. The decision framework here is probabilistic: these zones are best treated as action/response levels where confirmation requires follow-through, not as deterministic barriers.
5) Quant Technical Dashboard (18 Signals)
KGNAI AI Technical Analysis Score (Deep Reinforcement Learning): Rank #909 out of 958 (Rank 1 represents the strongest technical positioning and a higher probability of favorable price behavior. As ranks increase toward the maximum, the probability of favorable outcomes weakens and bearish positioning becomes more dominant.) | Label: Bearish | Score: -0.898
18-Signal Technical Confluence Score: -0.278 (Neutral)
Overall Technical Score (18-signal confluence + DRL rank blend): -0.464 (Bearish)
Note: The blended score reflects signal strength weighted against broader AI technical ranking, which may temporarily diverge.
Blended technical score breakdown: -0.464 (Bearish | Bull 2 / Bear 7 / Neutral 9)
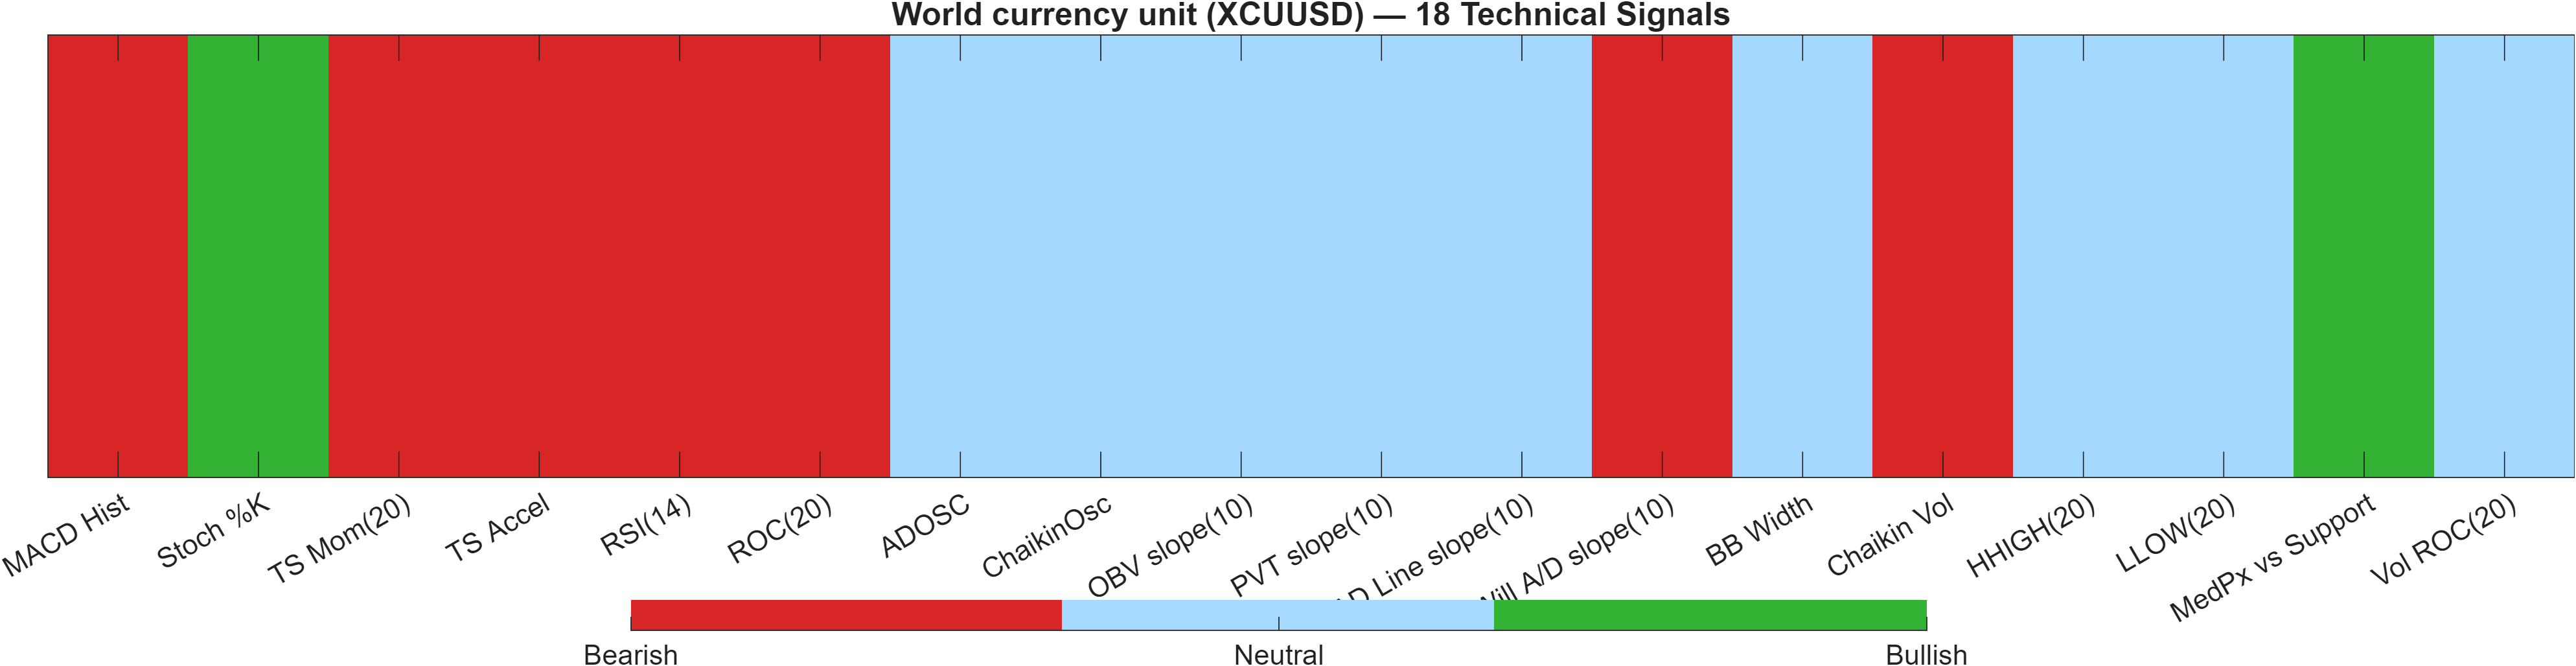
Signal table (Bull/Bear/Neutral)
| Indicator | Value | Signal |
|---|---|---|
| MACD Hist | -0.001262 | Bearish |
| Stoch %K | 12.58 | Bullish |
| TS Mom(20) | -0.0117 | Bearish |
| TS Accel | -0.0157 | Bearish |
| RSI(14) | 28.96 | Bearish |
| ROC(20) | -0.8648 | Bearish |
| ADOSC | 0 | Neutral |
| ChaikinOsc | 0 | Neutral |
| OBV slope(10) | 0 | Neutral |
| PVT slope(10) | 0 | Neutral |
| AD Line slope(10) | 0 | Neutral |
| Will A/D slope(10) | -0.0119 | Bearish |
| BB Width | 0.01003 | Neutral |
| Chaikin Vol | 98.79 | Bearish |
| HHIGH(20) | 1.354 | Neutral |
| LLOW(20) | 1.339 | Neutral |
| MedPx vs Support | 0.00485 | Bullish |
| Vol ROC(20) | — | Neutral |
Interpretation: Indicator-level signals form the base confluence, which is then adjusted using a separate AI-driven technical ranking model. The final technical score summarizes this combined view.
The technical dashboard shows a meaningful difference between surface confluence and ranked technical pressure. The 18-signal confluence score is -0.278 and labeled Neutral, largely because 9 of 18 signals are neutral and only 7 are bearish. However, the Deep Reinforcement Learning technical rank is #909 out of 958 with a score of -0.898, pulling the blended view to an overall technical score of -0.464 (Bearish).
This kind of compression—many neutral indicators while the AI technical rank remains deeply weak—often occurs when price action is in a quiet downtrend or deteriorating range. Several momentum components align on the bearish side (e.g., RSI(14) 28.96, TS Mom(20) -0.0117, TS Accel -0.0157), which is consistent with the negative MACD histogram. At the same time, the dashboard contains tactical counterpoints (notably Stoch %K 12.58 bullish), indicating that oversold conditions can exist even while the broader structure remains fragile.
The volume/flow cluster is predominantly neutral (multiple “0” readings), limiting confirmation of sustained accumulation. That matters because the scenario framework (Section 4) requires “break above resistance with volume” to validate continuation. As a result, the blended bearish score is less about one indicator and more about how the model weights weak ranked positioning when the indicator set fails to provide strong offsetting bullish evidence.
6) News sentiment + extractive gist
Note: Instrument-specific news matches were not found, so the digest includes broader market/sector headlines. Links are provided for verification.
Sentiment score (avg): 0.051 | Positive: 19% | Neutral: 75% | Negative: 6%
KGNAI AI News Sentiment Score (normalized -1 to +1): 0.61 (as of 2025-07-09) | Label: Bullish | Overall news score: 0.61
Positive Developments
Recent coverage across major financial outlets indicates a modestly constructive macro backdrop within parts of the broader FX complex, which can influence cross-currency demand even when an instrument lacks direct, instrument-specific headlines. A key supportive theme is the presence of upside surprises in select growth data (e.g., stronger-than-expected quarterly activity prints) alongside policy-sensitive inflation components that may reduce the immediacy of easing expectations. In parallel, commentary on high-level diplomacy and trade dialogue suggests episodic improvements in risk tone when communication channels appear active, even if concrete outcomes remain uncertain. For XCUUSD, the most relevant takeaway is that this information flow can help limit extreme risk-off repricing and occasionally supports short-lived rebounds, particularly when technicals are already stretched (consistent with RSI(14) at 28.96). The positive tilt is also reflected in the normalized sentiment score at 0.61, even though the distribution remains mostly neutral.
Neutral / Mixed Developments
The dominant news classification is still neutral (75%), aligning with a market that is reacting more to incremental shifts in risk appetite and broad USD dynamics than to a single decisive narrative. Coverage has highlighted the role of safe-haven demand and geopolitical uncertainty in shaping near-term positioning, while also noting that USD strength can cap upside in competing exposures. This mix is consistent with the report’s technical state: compressed volatility (bandwidth near 0.0100) can coexist with frequent but contained swings that do not develop into trends until a catalyst forces repricing. For XCUUSD, the implication is that sentiment may provide a contextual bias but does not override the weaker rank and momentum configuration currently present.
Negative / Risk Signals
Risk signals in recent coverage primarily revolve around the potential for renewed volatility driven by geopolitical tensions, uneven growth signals, and pockets of USD resilience. Mixed manufacturing and services activity indicators have been discussed in a way that underscores inconsistency in demand conditions, which can pressure risk-sensitive FX and increase dispersion across currency blocs. In addition, narratives emphasizing persistent USD strength can reinforce downside bias when technical momentum is already negative (e.g., MACD histogram -0.0013) and the broader ranked regime is weak (weekly #939). Importantly, the negative bucket is small in share (6%), but it is directionally aligned with the technical downside risks around a close below support at 1.3366, which would likely shift market attention from “contained weakness” to “regime deterioration.”
- Whether XCUUSD can hold above 1.3366 as momentum remains depressed (RSI(14) 28.96).
- Whether a move through 1.3543 is accompanied by improved participation (volume/flow indicators are largely neutral).
- Whether volatility expands from the current compressed regime (bandwidth ~0.0100) alongside improving MACD dynamics.
Sources referenced: Reuters, Bloomberg, Yahoo Finance, MarketWatch, Investing.com
7) Sources
- Gold rises on safe-haven demand amid geopolitical tensions, USD strength limits upside — https://www.fxstreet.com/news/gold-price-forecast-xau-usd-faces-pressure-near-upper-rising-channel-boundary-around-5-400-202603031120
- US Dollar Index rises above 99.00 as Middle East tensions drive inflation fears — https://www.fxstreet.com/news/us-dollar-index-rises-above-9900-as-middle-east-tensions-drive-inflation-fears-202603040323
- Japanese Yen strengthens to near 157.50 on Middle East geopolitical risks — https://www.fxstreet.com/news/japanese-yen-strengthens-to-near-15750-on-middle-east-geopolitical-risks-202603040255
- Silver Price Forecast: XAG/USD rises to near $85.00 as Middle East war intensifies — https://www.fxstreet.com/news/silver-price-forecast-xag-usd-rises-to-near-8500-as-middle-east-war-intensifies-202603040226
- New Zealand Dollar declines below 0.5900 amid mixed Chinese PMI data, Middle East tensions in focus — https://www.fxstreet.com/news/new-zealand-dollar-declines-below-05900-amid-mixed-chinese-pmi-data-middle-east-tensions-in-focus-202603040206
- Canadian Dollar bulls seem hesitant as firmer USD counters elevated Oil prices — https://www.fxstreet.com/news/canadian-dollar-bulls-seem-hesitant-as-firmer-usd-counters-elevated-oil-prices-202603040202
- China’s RatingDog Manufacturing PMI climbs to 62.1 in February, Services PMI rises to 56.7 — https://www.fxstreet.com/news/chinas-ratingdog-manufacturing-pmi-climbs-to-621-in-february-services-pmi-rises-to-567-202603040146
- China's NBS Manufacturing PMI declines to 49.0 in February, Non-Manufacturing PMI rises to 49.5 — https://www.fxstreet.com/news/chinas-nbs-manufacturing-pmi-declines-to-490-in-february-non-manufacturing-pmi-rises-to-495-202603040132
You may also like: How KGNAI AI ranks instruments across global markets
Disclaimer: KGNAI provides AI-generated analytics and educational market commentary only. This is not financial advice. Markets involve risk. Always do your own research.