
THBPKR (Thai Baht/Pakistani Rupee) — 22-Feb-2026 Institutional Technical & Sentiment Read: Bullish Bias With Measured Momentum
THBPKR (Thai Baht/Pakistani Rupee) screens with a broadly constructive profile across KGNAI’s cross-sectional ranking framework as of 22-Feb-2026, with strength visible across multiple horizons rather than isolated to a single timeframe. The shortest window sits near the top decile of the 964-instrument universe (daily rank #20), while intermediate horizons remain in the upper quartile (weekly #68; monthly #66). Technically, the trend structure is supported by moving-average alignment (Close vs MA50 bullish; MA50 vs MA200 bullish), while momentum signals are positive but not stretched: RSI bias is neutral and MACD histogram remains modestly positive (0.0023). Volatility conditions appear contained (Bollinger bandwidth 0.0259), which often shifts the burden of confirmation to level-based follow-through. With support identified near 8.8331 and resistance near 9.0445, the setup favors continuation only if price can sustain above the upper boundary; failure below support would raise deterioration risk even within a bullish-ranked regime.
Key Takeaways
- Rank stance (Short / Mid / Long): Bullish / Bullish / Bullish (daily rank #20; weekly #68; yearly #60).
- Technical confluence: Bullish (overall technical score 0.532; 18-signal confluence 0.444).
- Key decision levels: Support ~ 8.8331 | Resistance ~ 9.0445.
- News sentiment bias: Neutral (avg 0.021; 25% positive / 56% neutral / 19% negative).
- Confirmation / invalidation condition: A sustained move above 9.0445 supports continuation; a close below 8.8331 increases deterioration risk.
What KGNAI Measures
KGNAI evaluates assets using large cross-sectional datasets built from millions of structured data points. Inputs incorporate fundamental metrics, technical structures, and systematically processed news sentiment. Statistical models, machine learning, and AI frameworks are used to assess relative positioning, signal alignment, and probabilistic behavior across broad universes.
How to Read This Report
- Ranks are comparative across the tracked universe, not absolute price targets.
- Confluence reflects alignment among independent signal groups.
- Support/resistance levels are probabilistic decision zones, not guarantees.
- Sentiment provides contextual bias within the broader analytical framework.
1) KGNAI AI Analysis
Region: FOREX
Total universe size: 964 ranked instruments
- Daily rank: #20 out of 964 — Bullish
- Weekly rank: #68 out of 964 — Bullish
- Monthly rank: #66 out of 964 — Bullish
- 3-Monthly rank: #19 out of 964 — Bullish
- 6-Monthly rank: #30 out of 964 — Bullish
- Yearly rank: #60 out of 964 — Bullish
Across KGNAI’s 964-instrument FX universe, THBPKR is positioned in the upper tier on every tracked horizon, indicating a persistent positive regime rather than a single-window anomaly. The daily rank of #20 places it near the top decile, while the 3‑month rank of #19 reinforces that near-term strength is not purely noise-driven. Mid-horizon ranks remain supportive: weekly #68 and monthly #66 sit in the upper quartile, suggesting the cross-rate’s favorable behavior is not confined to the latest few sessions.
Longer windows also avoid the typical “short-term hot, long-term cold” profile that often precedes reversals. The 6‑month rank of #30 remains strong, and the yearly rank of #60 stays comfortably constructive relative to the broader universe. With the stated term view reading Bullish across short-, mid-, and long-term horizons, the more relevant question becomes how the trend is likely to express—through orderly continuation or through higher-variance swings.
From a regime perspective, this kind of multi-horizon alignment is generally consistent with sustained trend-following behavior, but it does not eliminate path risk. When ranks are strong across windows, the market often becomes more sensitive to level-based validation (breaks/holds of well-defined support and resistance) and to momentum confirmation (e.g., whether MACD and RSI can expand rather than stall). The remainder of this report focuses on whether the technical layer and sentiment context reinforce that ranked advantage or introduce near-term friction.
Term view: Short-term: Bullish. Mid-term: Bullish. Long-term: Bullish.
Want the full universe and complete rank tables? Unlock full access on KGNAI: https://www.kgnai.com/pricing
2) Price & trend overview
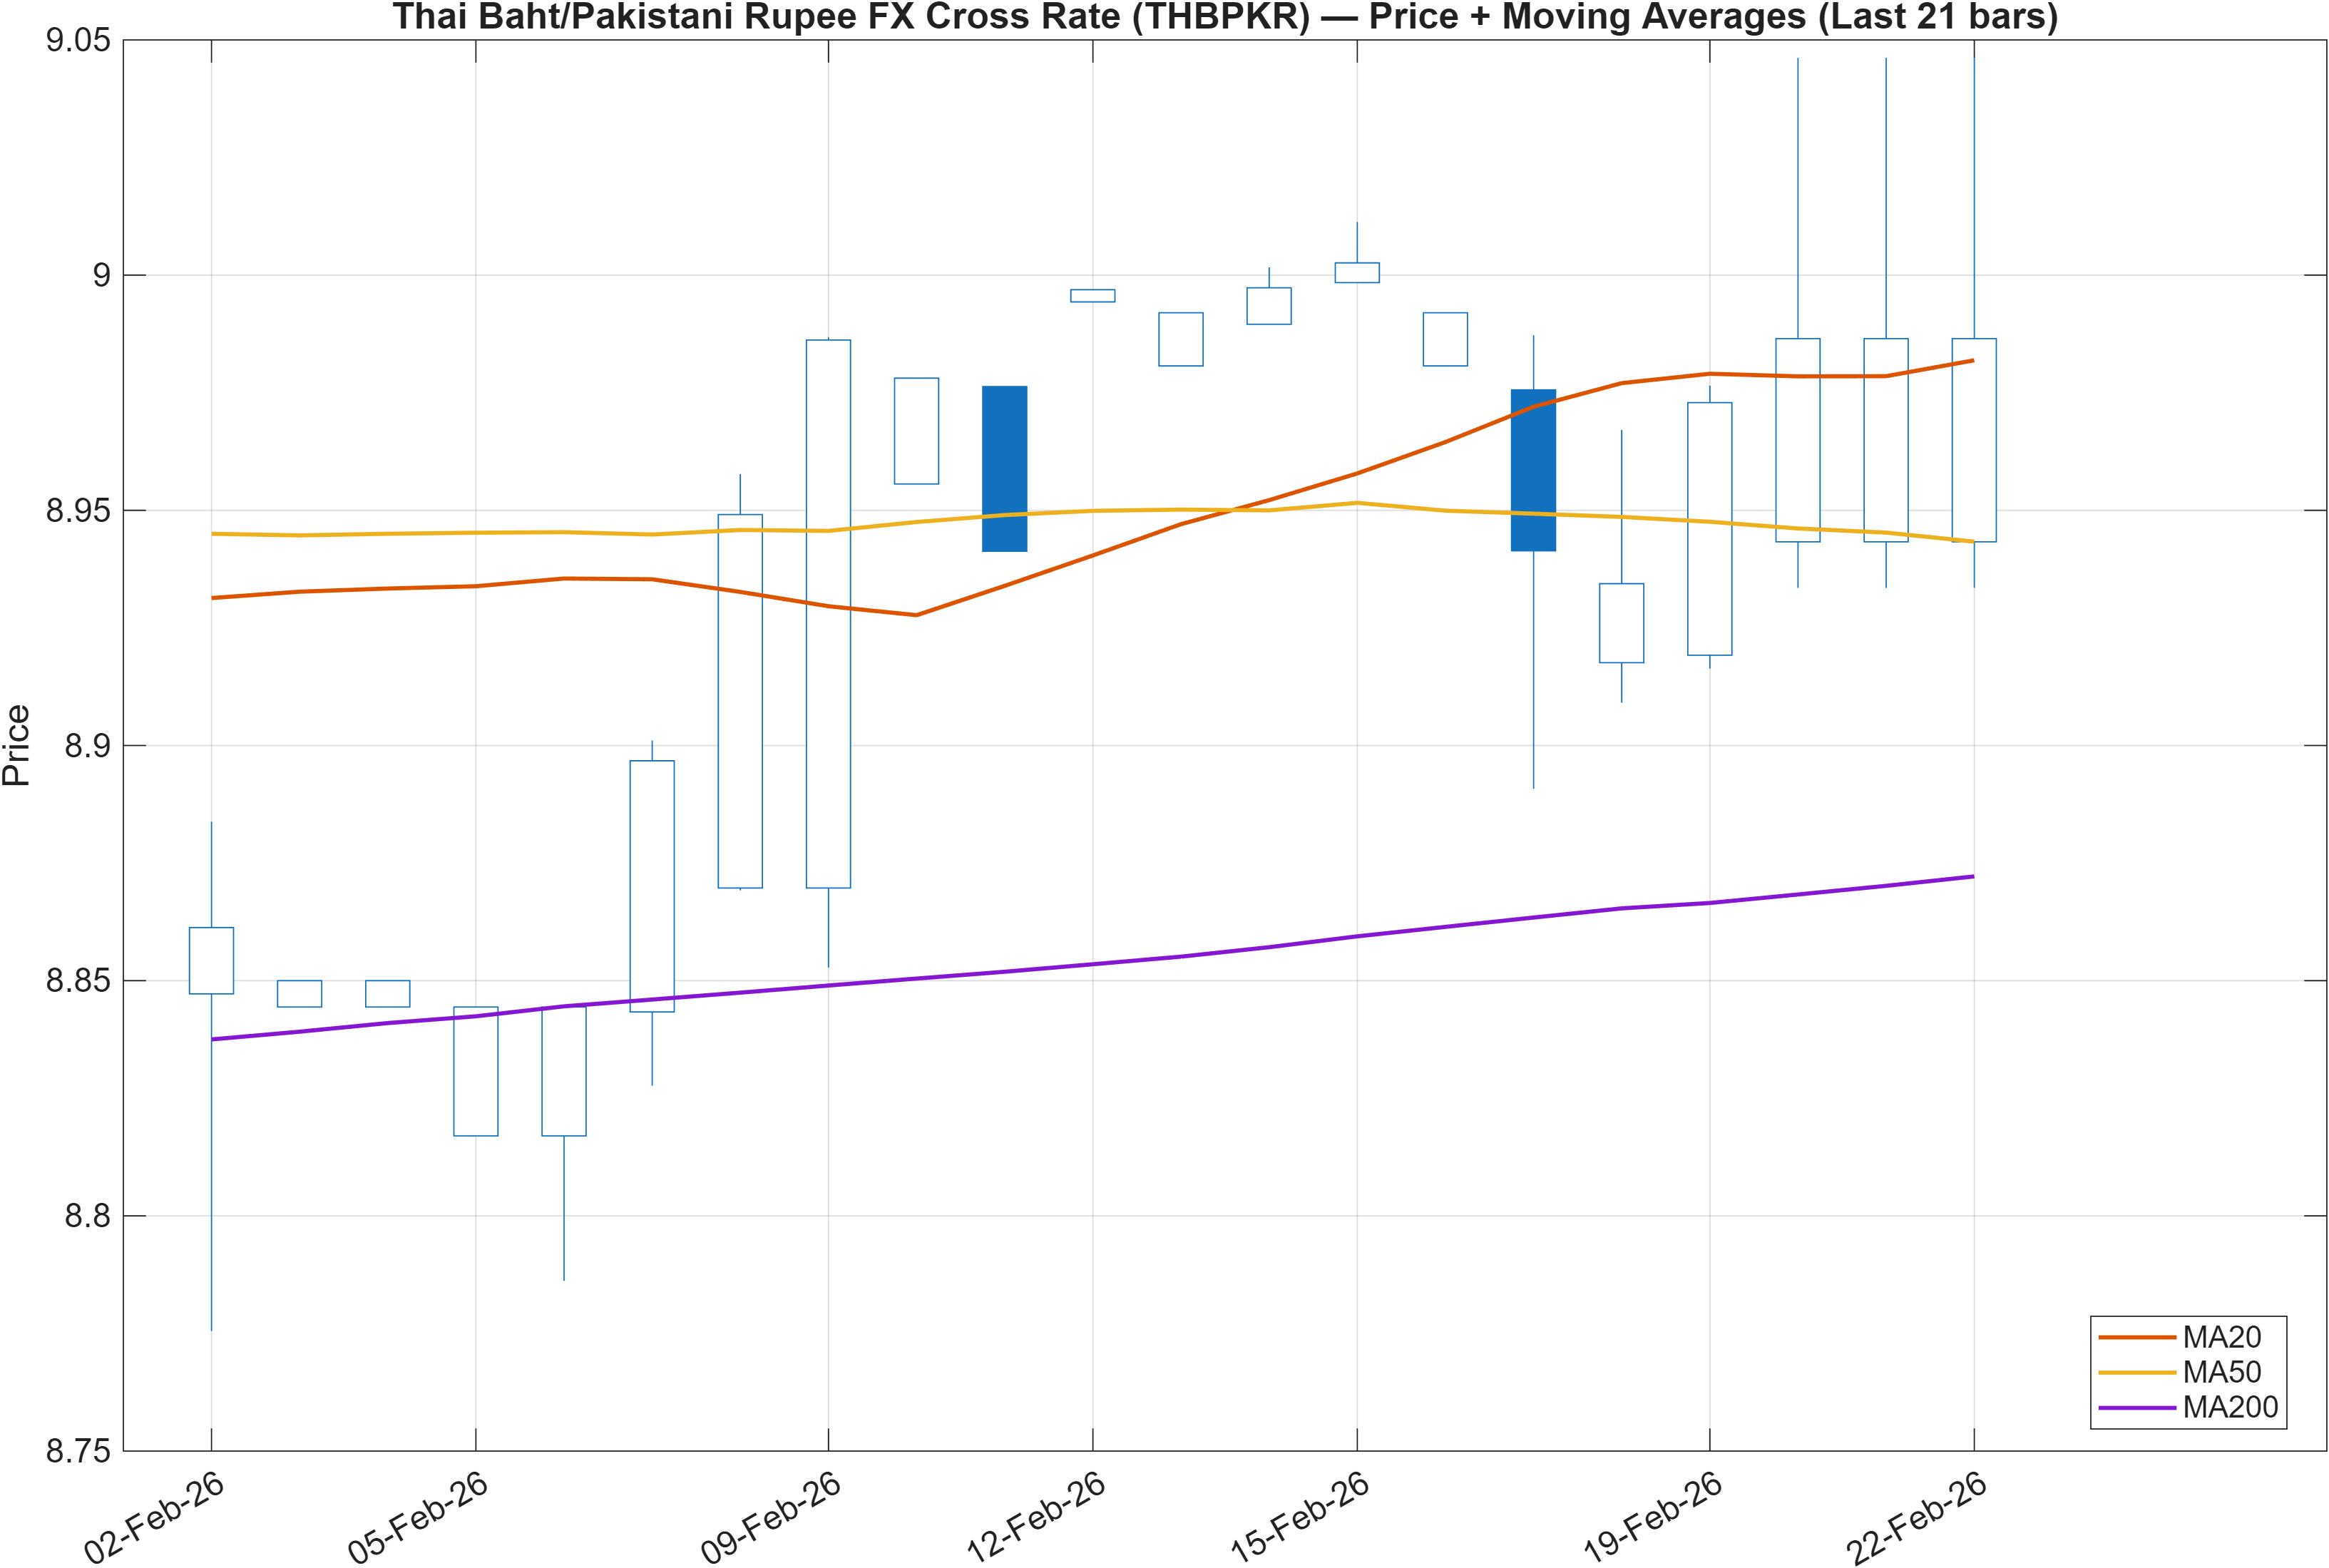
The trend layer presents a clear directional tilt: Close vs MA50 is bullish, and MA50 vs MA200 is bullish. This is the classic two-step confirmation used by systematic trend models—first, price holding above an intermediate average; second, the intermediate average holding above the long-term baseline. When both conditions are satisfied, drawdowns tend to be more often corrections within an uptrend rather than full regime flips, particularly when multi-horizon ranks (daily #20; 6‑month #30) are also supportive.
That said, moving-average alignment can remain positive even as momentum cools, which is why the momentum dashboard and the support/resistance map matter here. The ranking profile suggests buyers have dominated across multiple sampling windows, but the market still needs to convert that advantage into progressive closes rather than sideways digestion. If price action compresses while averages stay bullish, the setup can transition into a “trend intact, impulse absent” state—often resolved by a volatility expansion event.
In practical market-structure terms, a bullish MA stack typically changes the risk distribution around pullbacks: mean-reversion dips toward the MA50 can attract flows, while breaks that carry through both support and the moving-average area tend to be more meaningful. The report’s defined support at 8.8331 becomes the key reference for whether the trend remains orderly. Conversely, the nearby resistance at 9.0445 functions as the immediate test of continuation capacity—particularly relevant when volatility (bandwidth 0.0259) is not yet signaling a strong expansion.
Interpretation: Close vs MA50 = Bullish, MA50 vs MA200 = Bullish.
3) Momentum & volatility dashboard
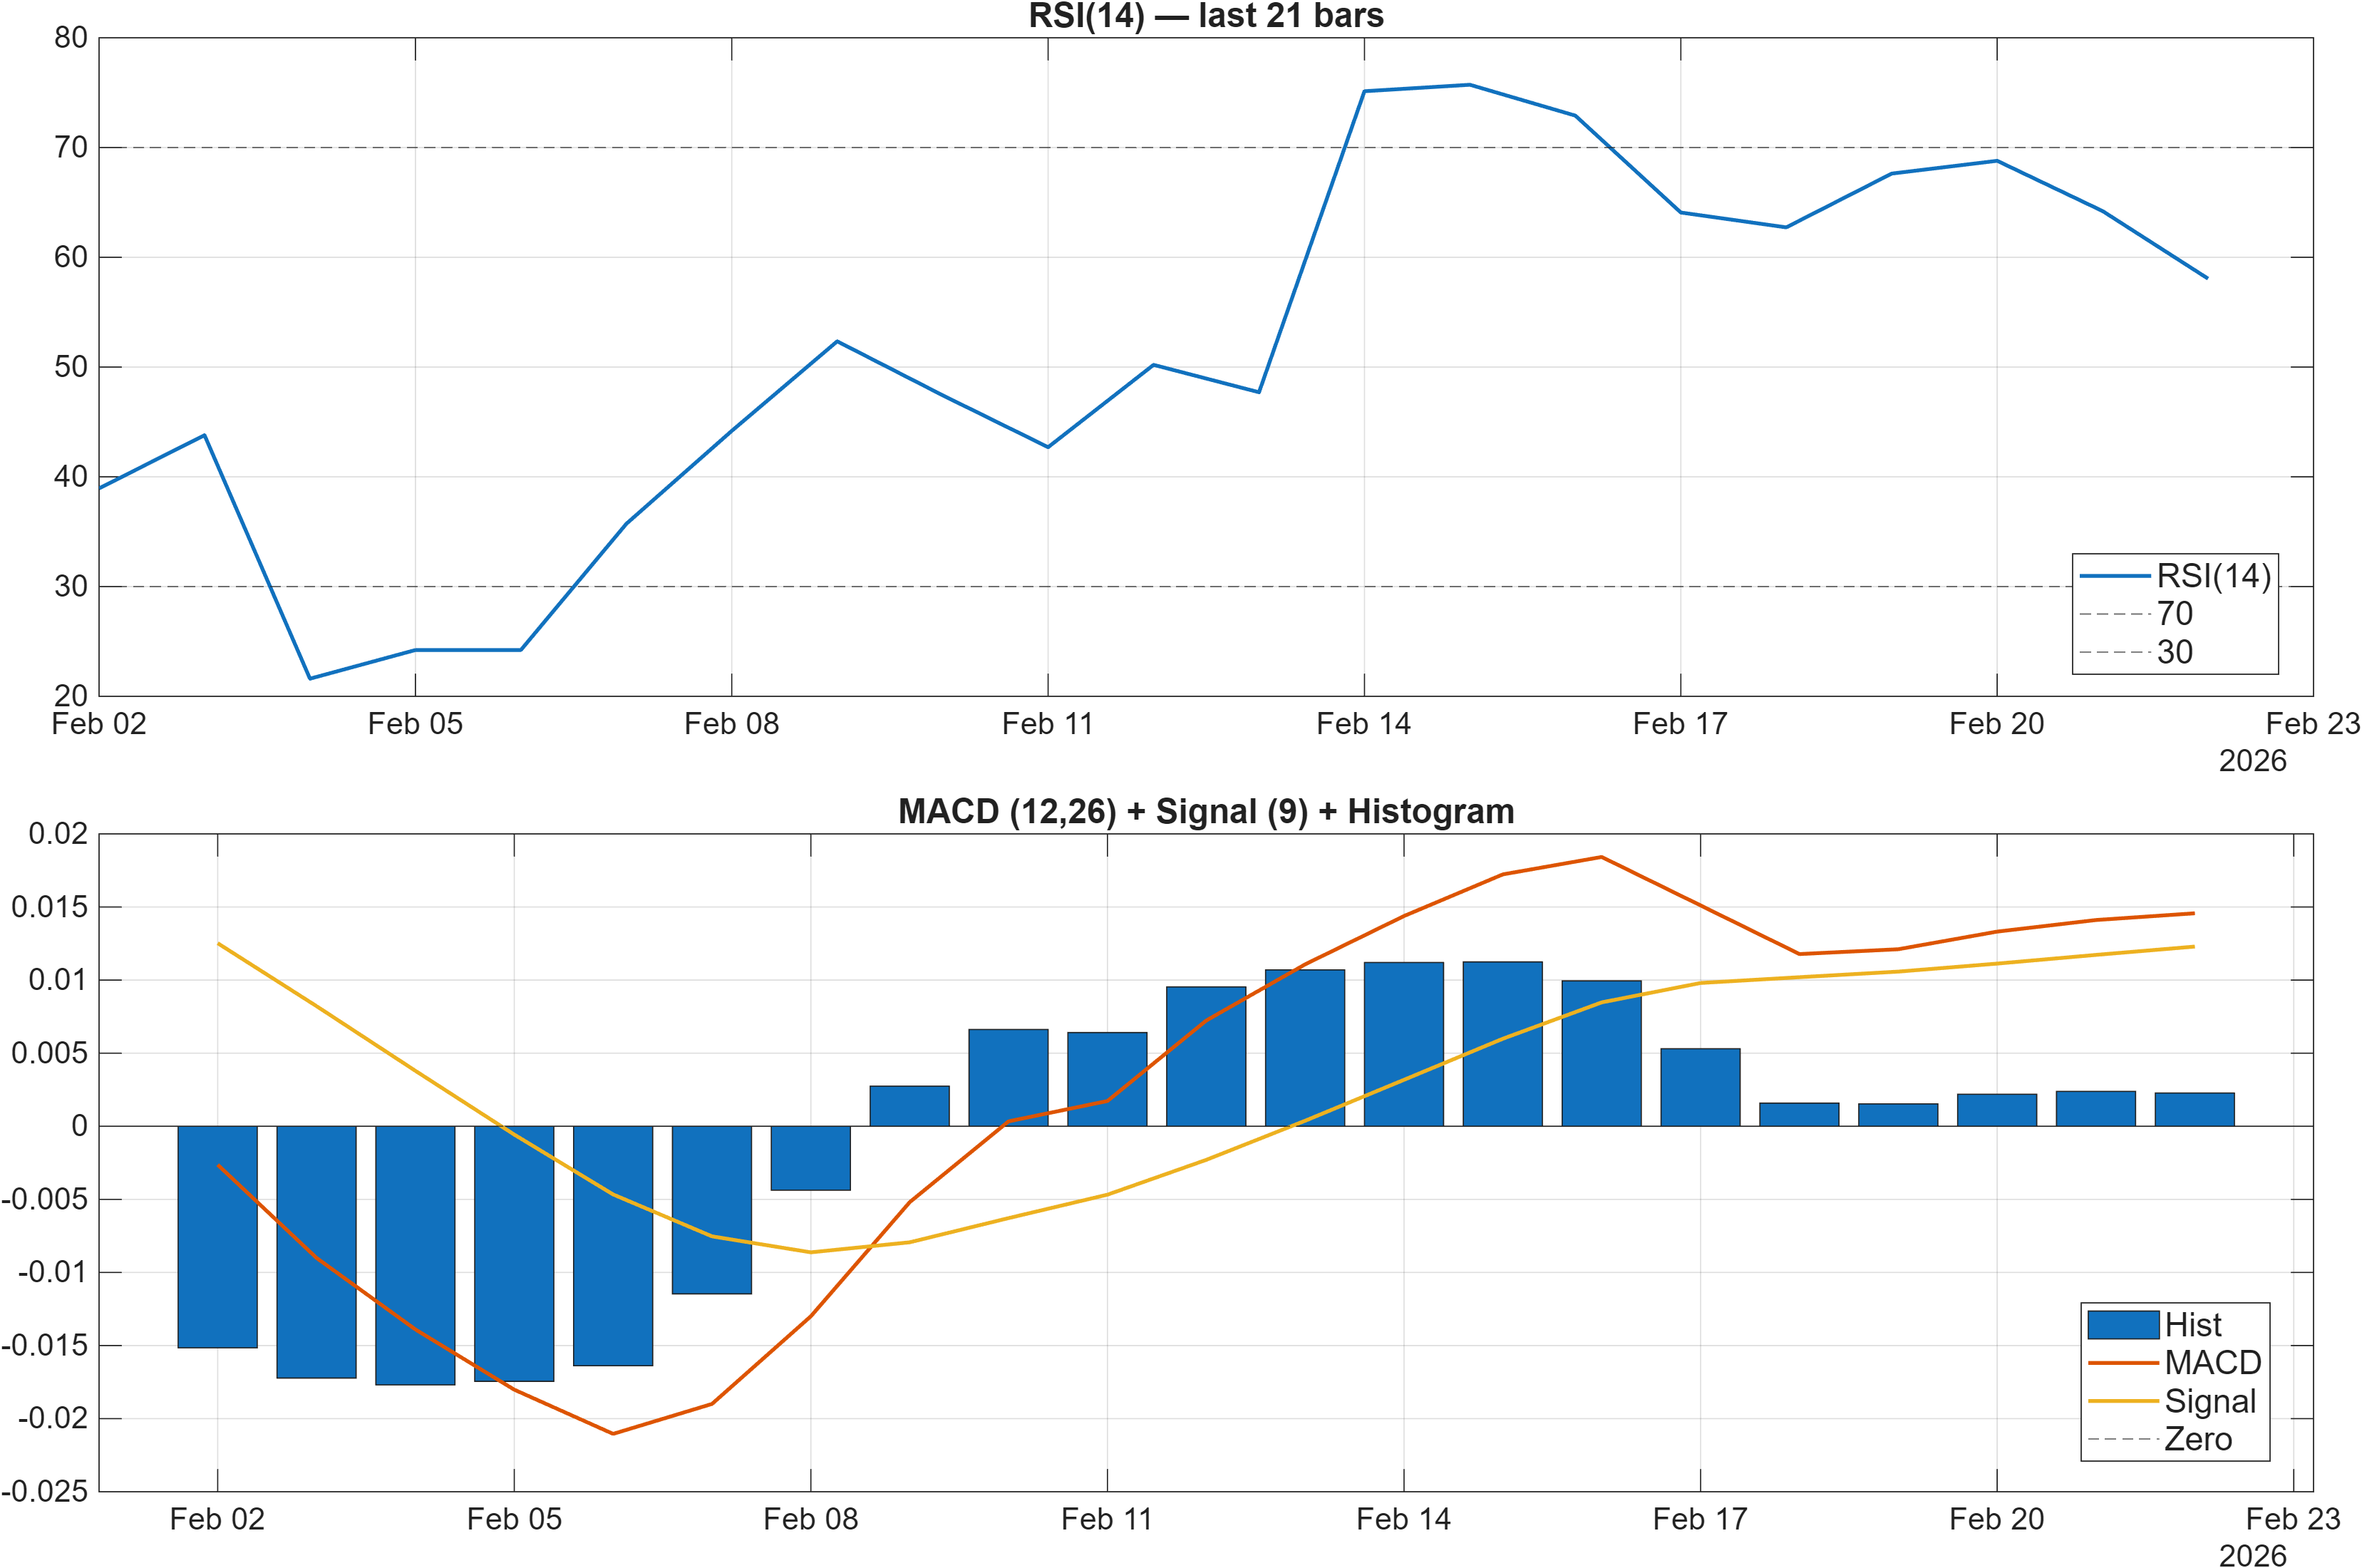
Momentum is constructive but controlled. RSI is described as neutral, while the MACD histogram is positive at 0.0023. This combination often indicates that upside drift is present, but the move has not reached a “stretched” condition that typically accompanies late-stage acceleration. Notably, the signal table also classifies RSI(14) at 58.05 as Bullish, which is consistent with a market holding above midline momentum without necessarily entering overheated territory.
The more nuanced read is the balance between impulse and confirmation. A positive MACD histogram (signal table MACD Hist 0.002277) suggests the faster trend component remains above the slower one, supporting the moving-average bullish structure. Meanwhile, Stoch %K at 61.58 is labeled neutral, aligning with the idea of a market that is advancing but not in an extreme band. This reduces the probability of immediate “snapback” solely from oscillator exhaustion, but it can also imply a slower grind unless volatility expands.
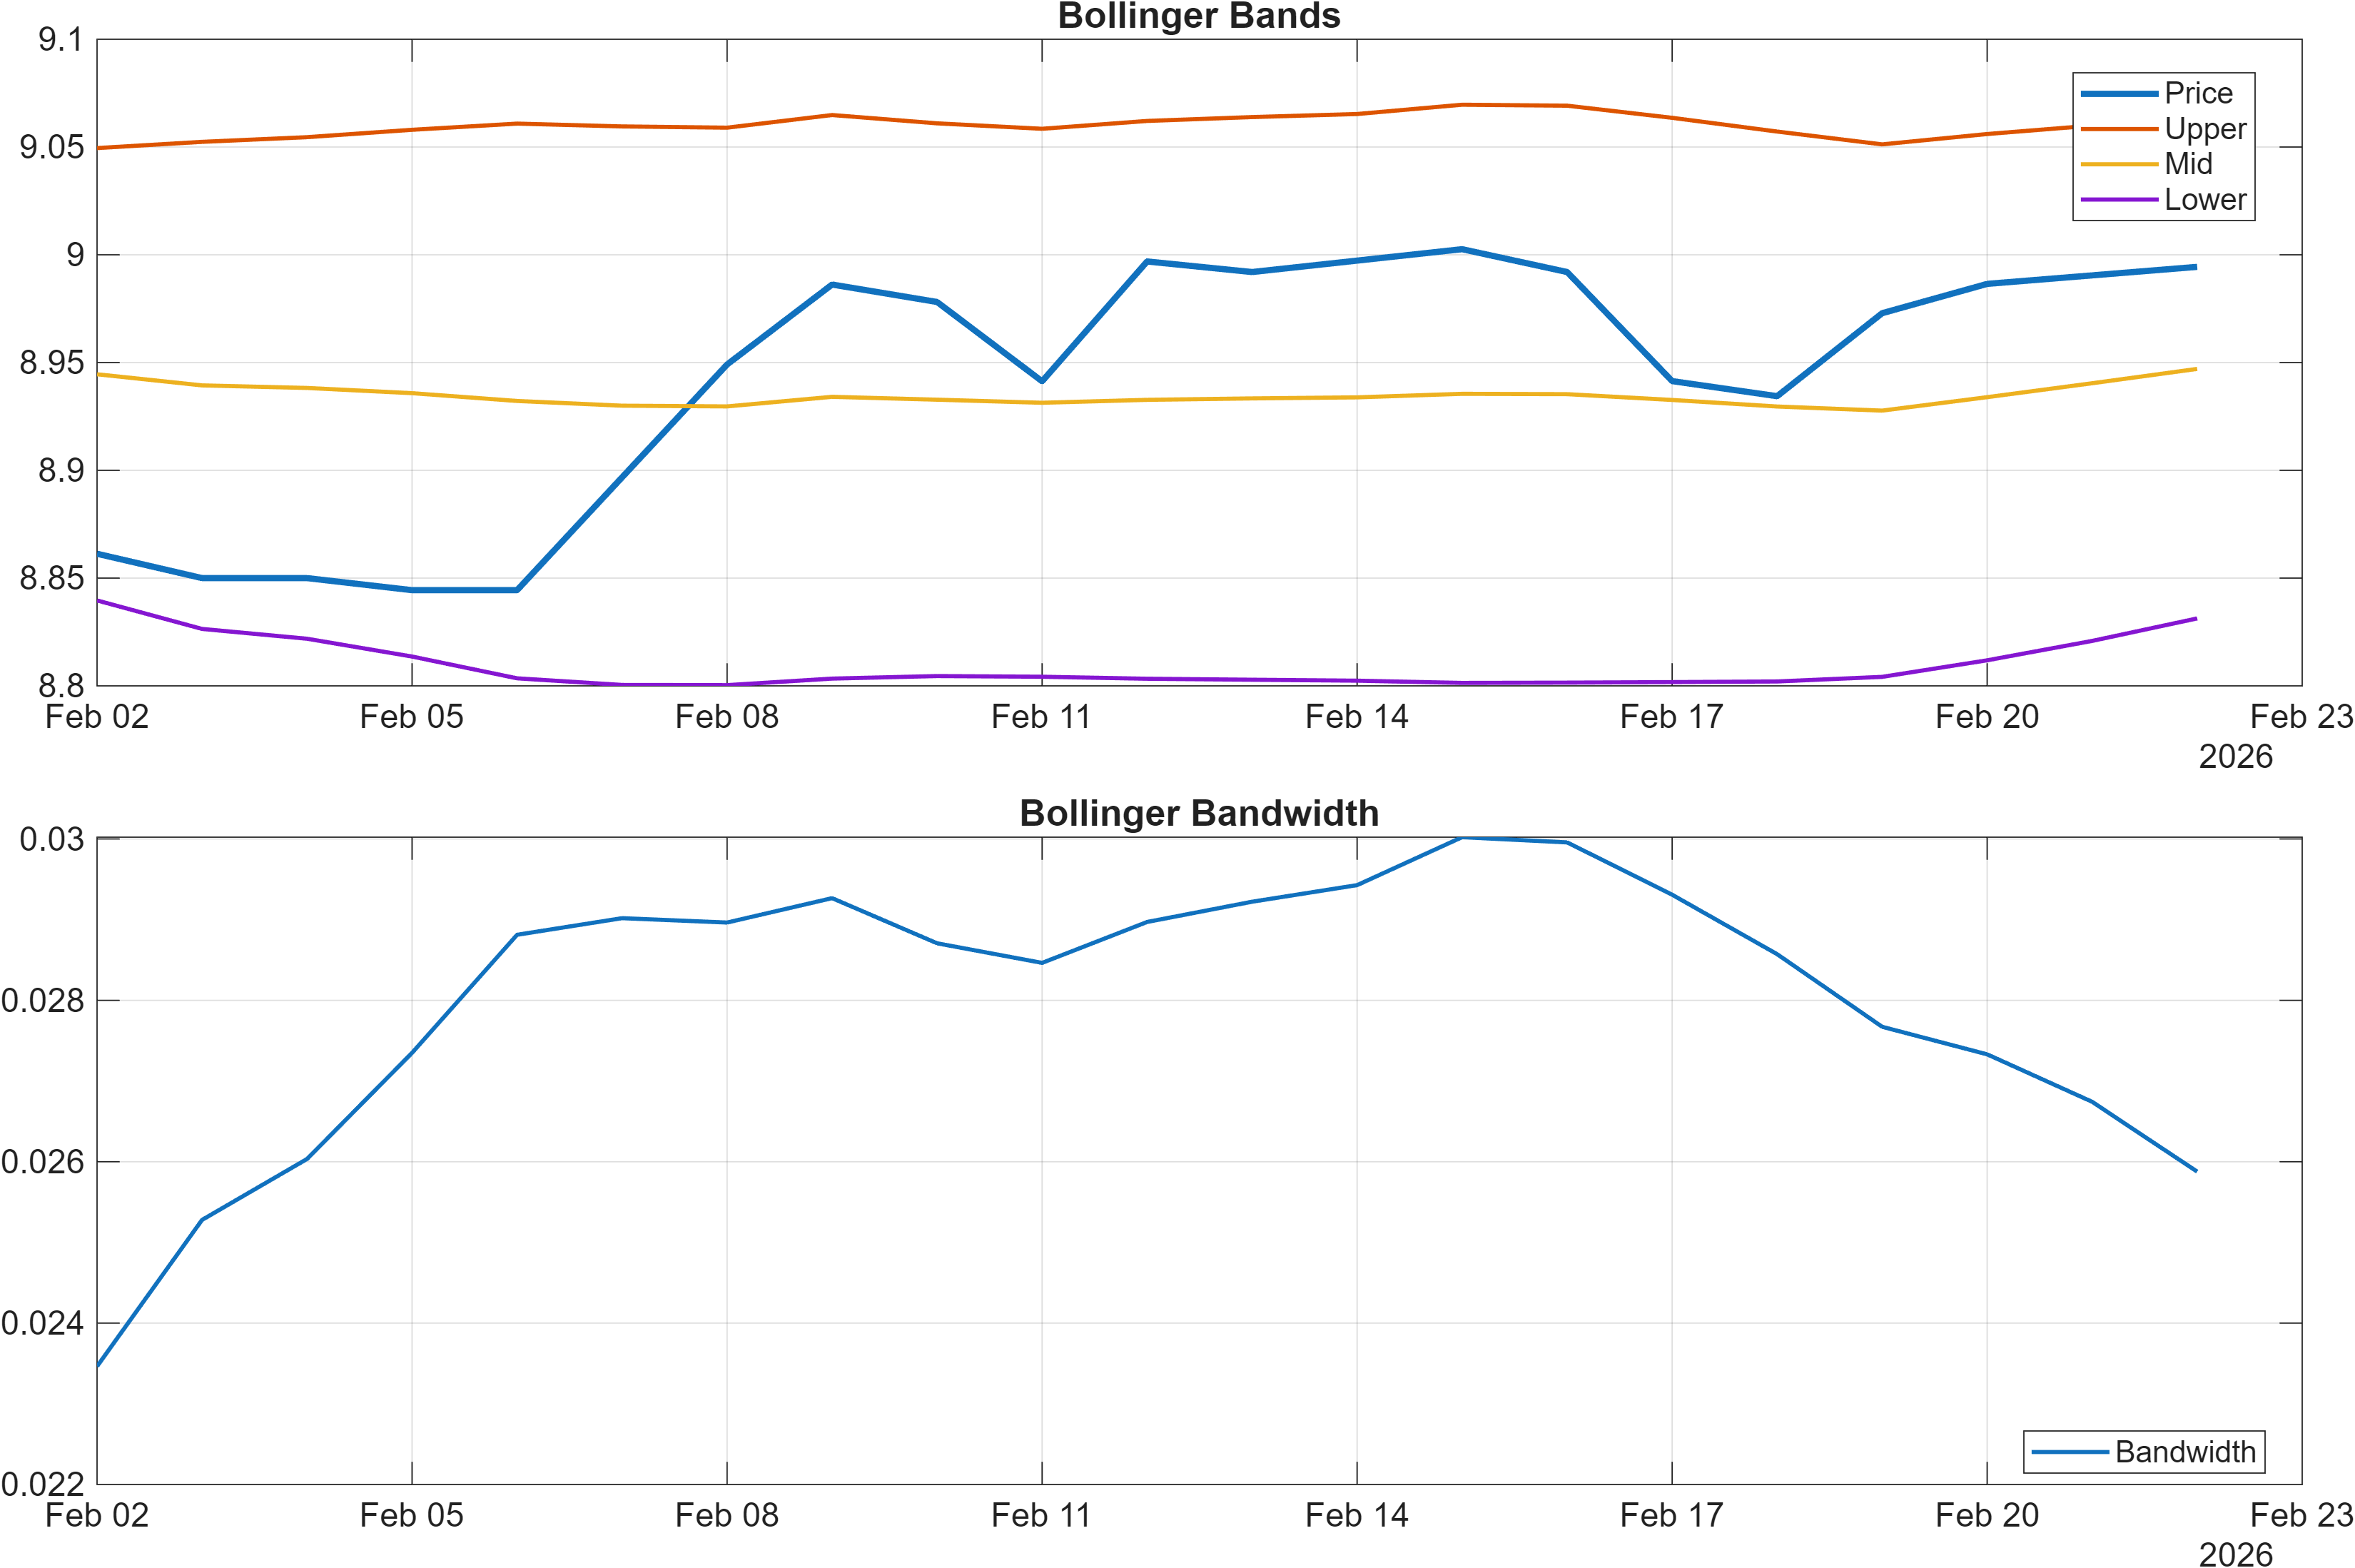
Volatility is currently restrained: Bollinger bandwidth is 0.0259 (table BB Width 0.02588 marked neutral). In a low-to-moderate bandwidth regime, breakouts can fail more easily unless they are accompanied by sustained follow-through. This places additional emphasis on the nearby structural boundary at 9.0445. If price cannot clear and hold above resistance while bandwidth remains muted, the cross-rate may rotate into range behavior even while the broader trend indicators remain bullish.
Interpretation: RSI bias = Neutral, MACD hist = 0.0023.
Interpretation: Bandwidth (volatility regime) latest = 0.0259.
4) Support / Resistance zones
Support ~ 8.8331 | Resistance ~ 9.0445
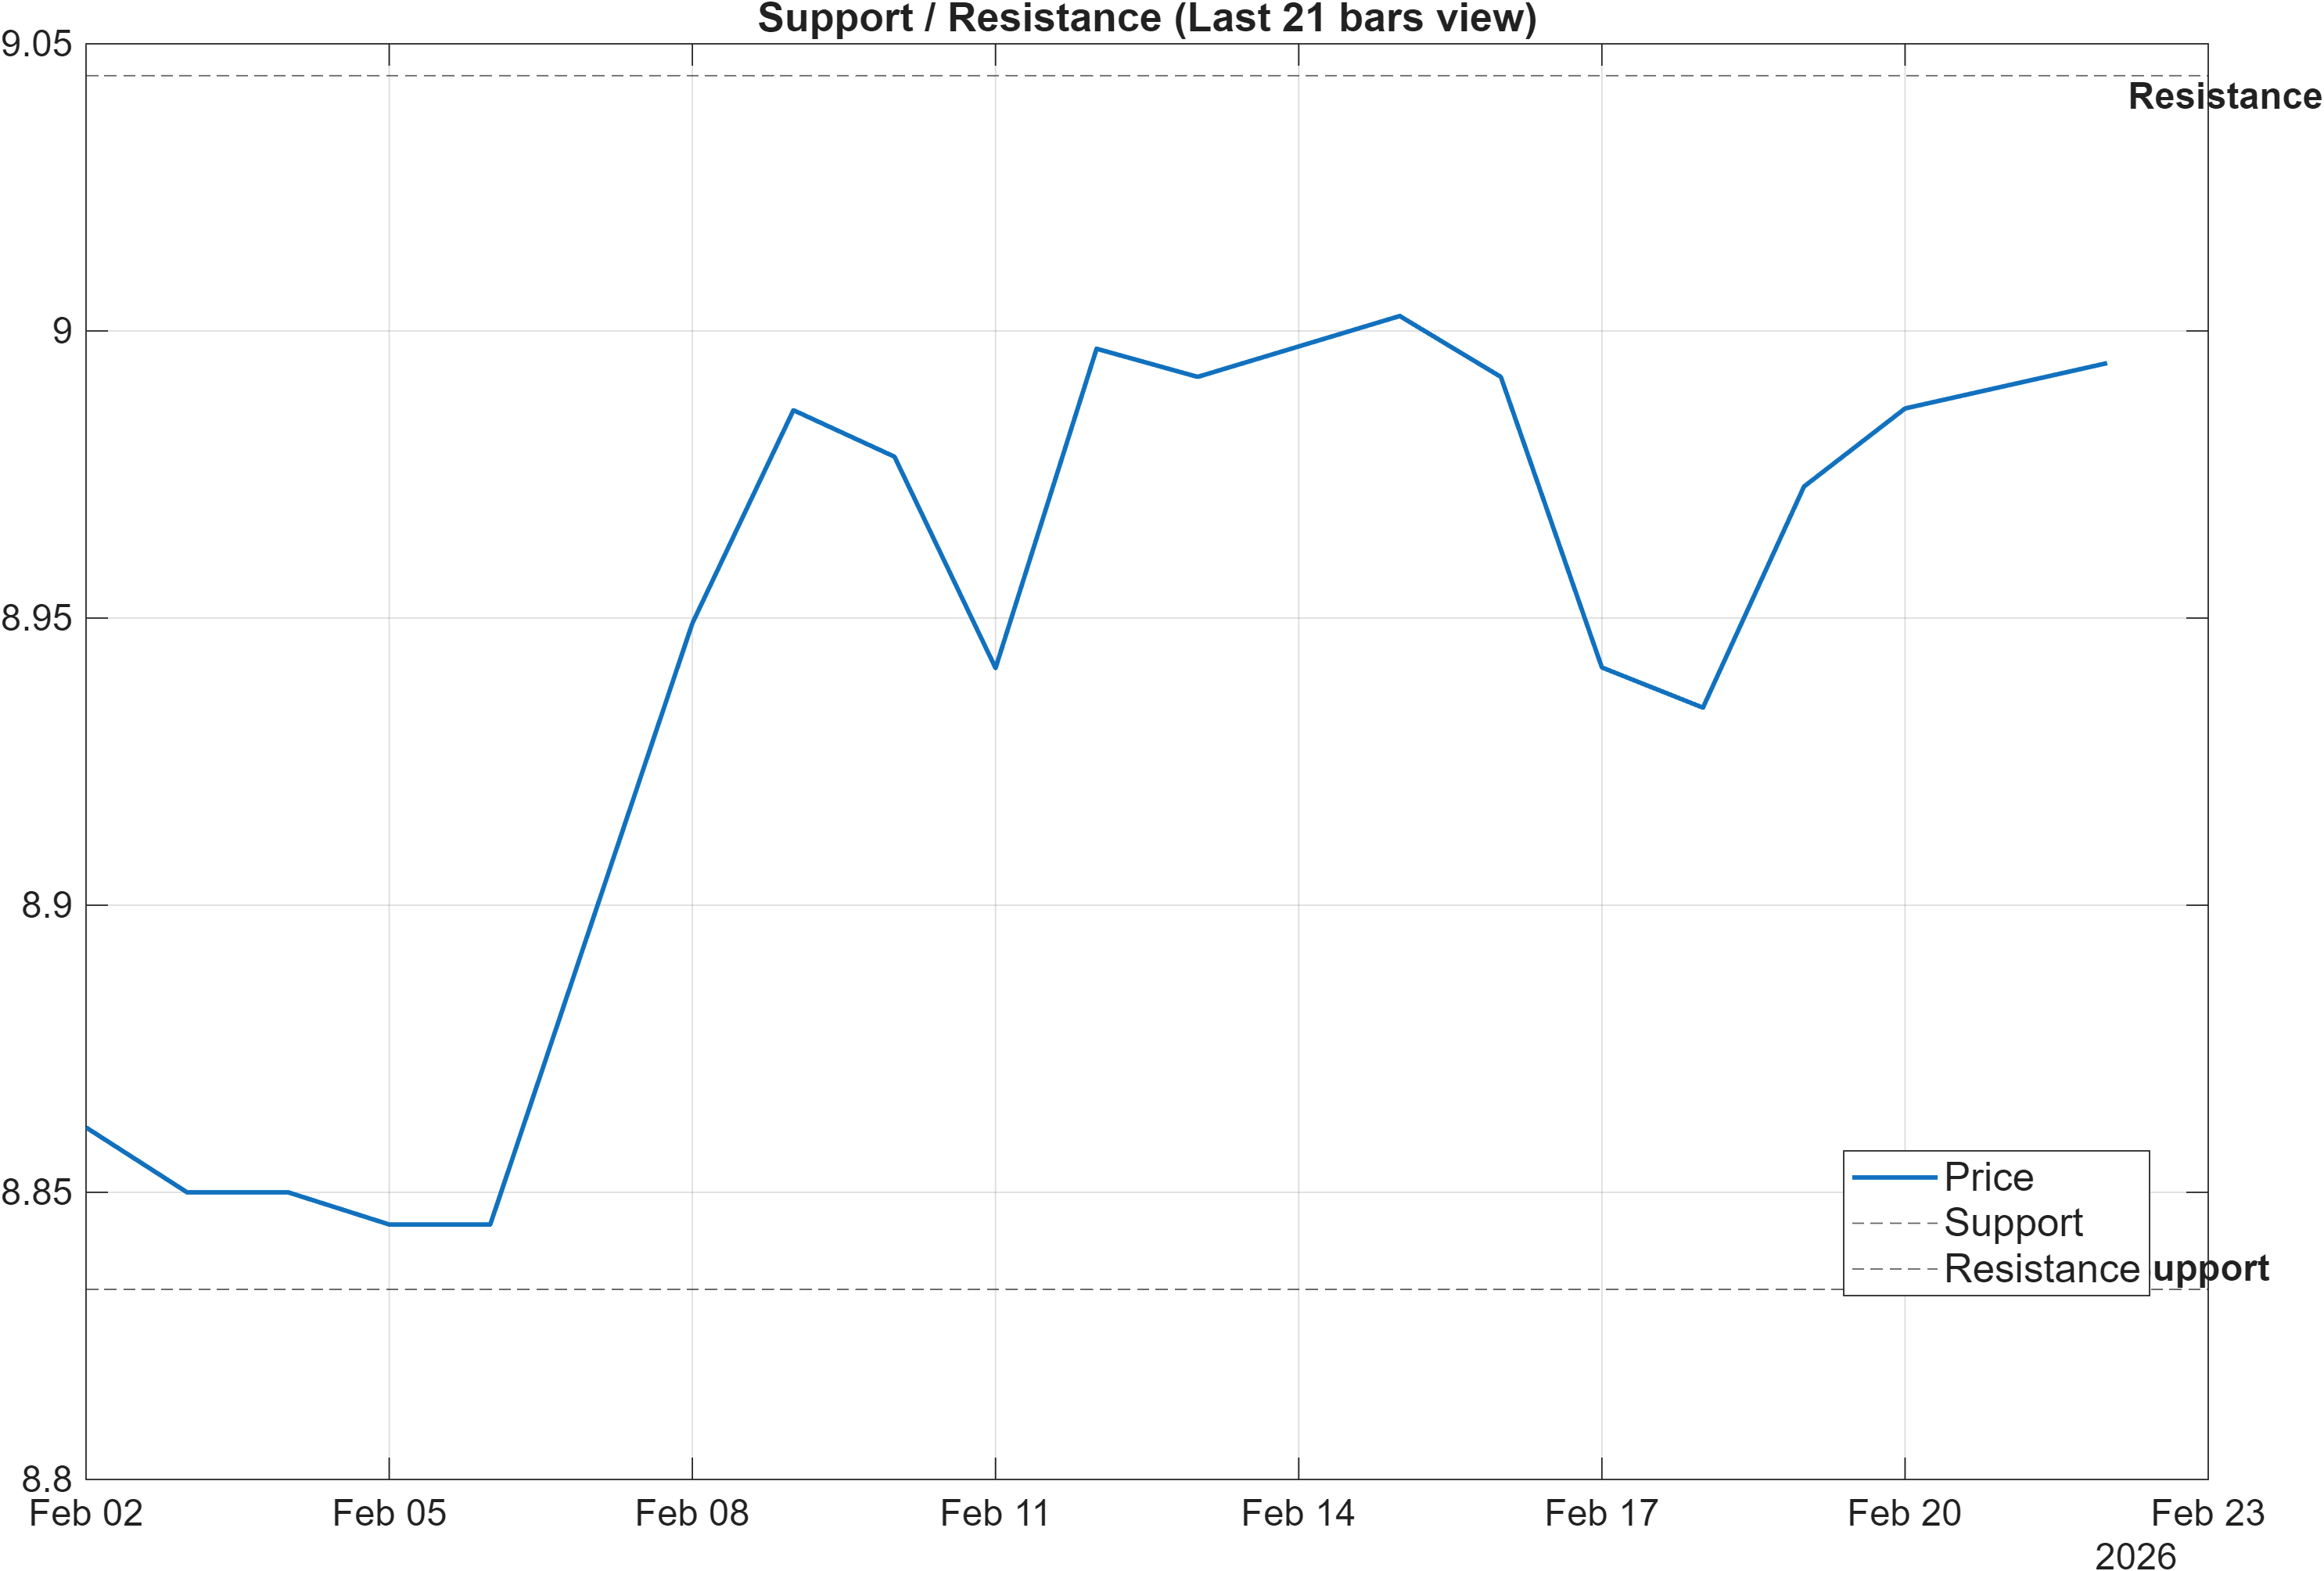
The level map is tight enough that it can act as a near-term “decision corridor.” With support near 8.8331 and resistance near 9.0445, the range between them is narrow relative to typical FX swing behavior, which increases the diagnostic value of closes around these zones. In a bullish-ranked context (daily #20; 3‑month #19), repeated defenses of support tend to reinforce the continuation thesis, whereas decisive closes below support typically force re-rating of the immediate path even if longer-term ranks remain constructive.
Resistance at 9.0445 is also consistent with the signal dashboard’s 20‑period high marker: HHIGH(20) at 9.046 is flagged bullish, suggesting the market has been pressing into an upper boundary. When the market is testing prior highs while volatility remains compressed (bandwidth 0.0259), the key question becomes whether a breakout is accepted (sustained above the level) rather than simply traded through intraday.
On the downside, the 20‑period low input LLOW(20) at 8.786 is neutral, which implies the recent lower bound is not being highlighted as an active bearish trend driver. That said, if price were to lose 8.8331, the market would be moving away from the “controlled pullback” profile and toward a scenario where trend confirmation (MA structure) can lag the reality of price deterioration. In short: the trend model remains favorable, but the price acceptance around these two levels will determine whether the bullish regime expresses as continuation or consolidation.
Scenario view: Break above resistance with volume → continuation. Close below support → signal deterioration risk.
5) Quant Technical Dashboard (18 Signals)
KGNAI AI Technical Analysis Score (Deep Reinforcement Learning): Rank #127 out of 964 (Rank 1 represents the strongest technical positioning and a higher probability of favorable price behavior. As ranks increase toward the maximum, the probability of favorable outcomes weakens and bearish positioning becomes more dominant.) | Label: Bullish | Score: 0.737
18-Signal Technical Confluence Score: 0.444 (Bullish)
Overall Technical Score (18-signal confluence + DRL rank blend): 0.532 (Bullish)
Note: The blended score reflects signal strength weighted against broader AI technical ranking, which may temporarily diverge.
Blended technical score breakdown: 0.532 (Bullish | Bull 9 / Bear 1 / Neutral 8)
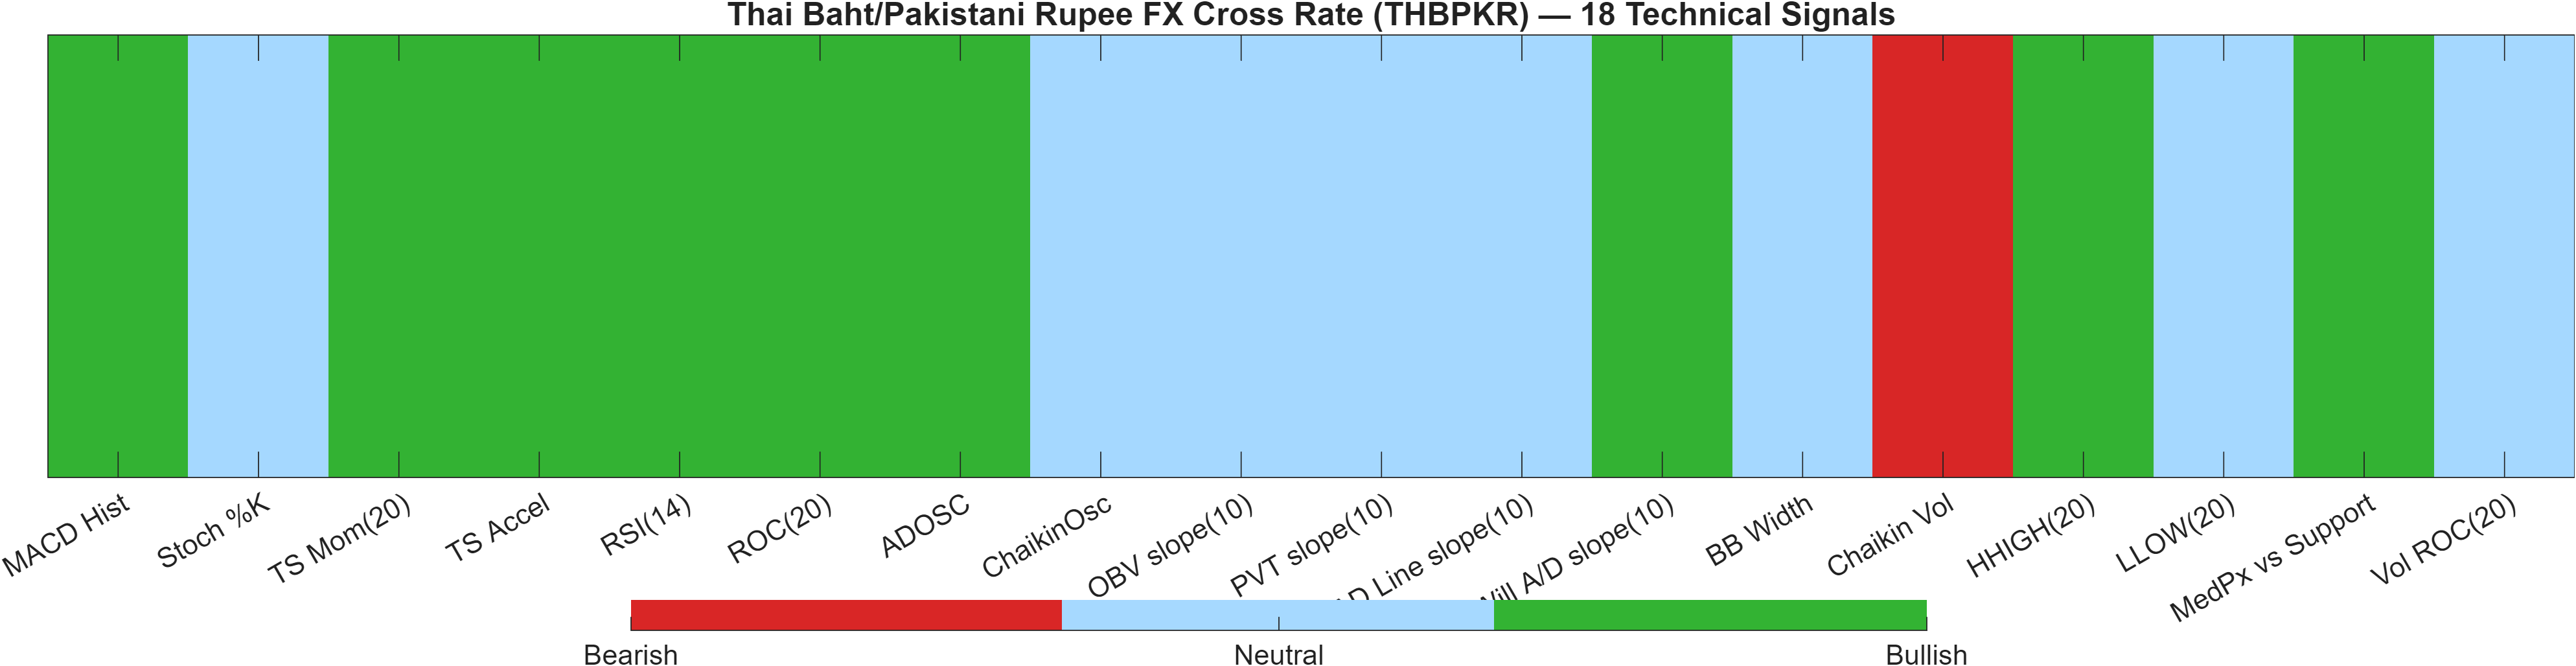
The technical dashboard shows a constructive aggregate, but with a meaningful internal composition: the overall technical score is 0.532 (Bullish), built from an 18-signal confluence score of 0.444 (Bullish) and a DRL technical rank of #127 (Bullish, score 0.737). Interpreted together, this indicates a setup that is broadly favorable yet not “maximally strong” across every indicator family—consistent with a trend that may require confirmation at resistance rather than a high-conviction momentum burst.
The distribution—Bull 9 / Bear 1 / Neutral 8—is characteristic of a market where trend and price-action components lean positive, while several volume/flow proxies are not providing strong confirmation. For example, time-series momentum and acceleration are bullish (TS Mom(20) 0.1365; TS Accel 0.1603), and rate-of-change also supports upside drift (ROC(20) 1.632). These align well with the moving-average regime described earlier.
Where the dashboard becomes more conditional is in the “participation/volatility” layer. Multiple slope-style flow measures register neutral (e.g., OBV slope(10) and PVT slope(10) at 0), while Chaikin Vol at 89.87 is the lone bearish signal. With Bollinger width neutral (BB Width 0.02588), this mix suggests that the bullish thesis is currently being carried more by trend persistence than by a broad-based expansion in volatility and participation proxies. In such a configuration, the most robust validation often comes from price accepting above nearby resistance (9.0445) rather than relying solely on oscillator readings.
Signal table (Bull/Bear/Neutral)
| Indicator | Value | Signal |
|---|---|---|
| MACD Hist | 0.002277 | Bullish |
| Stoch %K | 61.58 | Neutral |
| TS Mom(20) | 0.1365 | Bullish |
| TS Accel | 0.1603 | Bullish |
| RSI(14) | 58.05 | Bullish |
| ROC(20) | 1.632 | Bullish |
| ADOSC | 69.17 | Bullish |
| ChaikinOsc | 0 | Neutral |
| OBV slope(10) | 0 | Neutral |
| PVT slope(10) | 0 | Neutral |
| AD Line slope(10) | 0 | Neutral |
| Will A/D slope(10) | 0.02375 | Bullish |
| BB Width | 0.02588 | Neutral |
| Chaikin Vol | 89.87 | Bearish |
| HHIGH(20) | 9.046 | Bullish |
| LLOW(20) | 8.786 | Neutral |
| MedPx vs Support | 0.1568 | Bullish |
| Vol ROC(20) | — | Neutral |
Interpretation: Indicator-level signals form the base confluence, which is then adjusted using a separate AI-driven technical ranking model. The final technical score summarizes this combined view.
6) News sentiment + extractive gist
Note: Instrument-specific news matches were not found, so the digest includes broader market/sector headlines. Links are provided for verification.
Sentiment score (avg): 0.021 | Positive: 25% | Neutral: 56% | Negative: 19%
KGNAI AI News Sentiment Score (normalized -1 to +1): Not available (as of —) | Label: Not available | Overall news score: 0.02
Positive Developments
Recent coverage across major financial outlets indicates a mildly constructive tone for broad risk assets and selected Asia FX narratives, with pockets of USD softness themes appearing alongside commodity strength. Market commentary has also highlighted episodes where gold strength coincided with shifting growth/inflation expectations, a mix that can influence USD behavior and, by extension, relative FX cross movements. Within the Asia region, recurring discussion of central bank growth and inflation outlooks suggests that policy signaling remains a primary driver of currency differentiation rather than a single macro headline. For THBPKR, this backdrop matters mostly through its impact on volatility and on relative carry and risk appetite dynamics, not through instrument-specific catalysts. With the aggregate sentiment mix showing 25% positive against a majority 56% neutral, the news layer reads as a modest tailwind at best—supportive of continuation only if price confirms technically near 9.0445.
Neutral / Mixed Developments
The dominant tone is informational rather than directional, consistent with the sentiment distribution being mostly neutral (56%) and the average sentiment score close to flat (0.021). The recurring theme is policy divergence—central banks balancing structural tools, growth stabilization, and inflation management—without a single unifying shock. For an FX cross like THBPKR, that typically translates into a “range-to-trend” environment where technical structure (MA alignment, RSI/MACD posture) has outsized influence until a clearer macro impulse emerges. With volatility measures already subdued (bandwidth 0.0259), a neutral news tape can reinforce consolidation behavior even while the rank regime stays bullish. In effect, the news context does not contradict the trend, but it does not supply clear incremental confirmation either.
Negative / Risk Signals
Risk signals in the broader tape cluster around policy uncertainty and headline-driven swings, which can raise short-term FX dispersion even when longer-term trends remain intact. Commentary has included elevated sensitivity to tariff/legal developments and the inflation-growth tradeoff, both of which can create choppy USD reactions and cross-asset spillovers. For THBPKR, the relevance is indirect: abrupt shifts in global risk pricing can compress or widen spreads rapidly and may challenge breakout attempts near 9.0445 if follow-through liquidity is thin. The sentiment breakdown still shows 19% negative—not dominant, but enough to keep “risk-off bursts” on the monitoring list, especially when technicals show mixed participation proxies (e.g., a bearish Chaikin Vol signal in the technical table). This is less a trend-breaker than a potential catalyst for failed breakouts or sharp mean reversion toward 8.8331.
- What to monitor next: whether price acceptance develops above 9.0445 while volatility remains contained (bandwidth 0.0259).
- What to monitor next: if momentum confirmation improves (MACD histogram holding positive at 0.0023 and RSI staying constructive).
- What to monitor next: any shift in the sentiment mix away from neutral (56%) toward a more polarized tape that could reprice FX volatility.
Snapshot: AI Rank (Short–Mid–Long): Bullish (Bullish–Bullish–Bullish) · Technical Confluence: Bullish · Key Levels: Support ~8.83 | Resistance ~9.04 · News Sentiment: Neutral
Sources referenced: Reuters, Bloomberg, Yahoo Finance, MarketWatch, Investing.com
7) Sources
- PBOC: Cautious stance with structural easing tools – DBS — https://www.fxstreet.com/news/pboc-cautious-stance-with-structural-easing-tools-dbs-202602202352
- Asia FX: Policy divergence shapes regional currencies – MUFG — https://www.fxstreet.com/news/asia-fx-policy-divergence-shapes-regional-currencies-mufg-202602202311
- Malaysia: BNM expected to keep OPR steady through 2026 – UOB — https://www.fxstreet.com/news/malaysia-bnm-expected-to-keep-opr-steady-through-2026-uob-202602202236
- Philippines: BSP easing path stays open – DBS — https://www.fxstreet.com/news/philippines-bsp-easing-path-stays-open-dbs-202602202143
- AUD/USD Price Forecast: Climbs toward 0.7100, eyes on YTD high — https://www.fxstreet.com/news/aud-usd-price-forecast-climbs-toward-07100-eyes-on-ytd-high-202602202137
- Gold surges above $5,060 as soft GDP, hot PCE hit US Dollar — https://www.fxstreet.com/news/gold-surges-above-5-060-as-soft-gdp-hot-pce-hit-us-dollar-202602202122
- Indonesia: Growth and inflation outlook shapes BI path – MUFG — https://www.fxstreet.com/news/indonesia-growth-and-inflation-outlook-shapes-bi-path-mufg-202602202107
- Forecasting the upcoming week: US Dollar steady amid rising PCE inflation, soft GDP — https://www.fxstreet.com/news/forecasting-the-upcoming-week-us-dollar-steady-amid-rising-pce-inflation-soft-gdp-202602202057
You may also like: How KGNAI AI ranks instruments across global markets
Disclaimer: KGNAI provides AI-generated analytics and educational market commentary only. This is not financial advice. Markets involve risk. Always do your own research.