
ZARDKK — South African Rand/Danish Krone (11-Mar-2026) | Short-term resilience vs weakening higher-timeframe structure
ZARDKK (South African Rand/Danish Krone) presents a mixed, horizon-dependent profile as of 11-Mar-2026. The cross screens as near-term supported by a relatively strong Daily rank (#129/960) while the higher-timeframe context remains structurally weak, with Monthly (#769/960) and Yearly (#856/960) ranks positioned in the lower portion of the universe. Technically, the snapshot leans Neutral overall: the 18-signal confluence score (0.056) and blended technical score (0.073) suggest limited signal consensus, consistent with an environment where small price changes can flip short-term indicators without resolving the broader regime. Momentum is not confirming a sustained reversal: RSI(14) at 47.56 stays mid-range, while MACD histogram (-0.0002001) remains slightly negative. Key decision zones are tightly defined at support ~0.3865 and resistance ~0.3977, framing a near-term range with asymmetric risk if support fails.
- Rank stance: Short-term Neutral (Daily #129/960 Bullish; Weekly #447/960 Neutral) | Mid-term Bearish (Monthly #769/960 Bearish) | Long-term Bearish (Yearly #856/960 Bearish)
- Technical confluence: Neutral (18-signal 0.056; blended 0.073; DRL rank #425/960)
- Key levels: Support 0.3865 | Resistance 0.3977
- News sentiment bias: Slightly constructive but mostly Neutral (avg 0.071; 31% positive / 56% neutral / 12% negative)
- Confirmation / invalidation: A close below 0.3865 would align price with weaker higher-timeframe ranks; sustained acceptance above 0.3977 would be needed to reduce near-term downside pressure.
What KGNAI Measures
KGNAI evaluates assets using large cross-sectional datasets built from millions of structured data points. Inputs incorporate fundamental metrics, technical structures, and systematically processed news sentiment. Statistical models, machine learning, and AI frameworks are used to assess relative positioning, signal alignment, and probabilistic behavior across broad universes.
How to Read This Report
- Ranks are comparative across the tracked universe, not absolute price targets.
- Confluence reflects alignment among independent signal groups.
- Support/resistance levels are probabilistic decision zones, not guarantees.
- Sentiment provides contextual bias within the broader analytical framework.
1) KGNAI AI Analysis
Region: FOREX
Total universe size: 960 ranked instruments
- Daily rank: #129 out of 960 — Bullish
- Weekly rank: #447 out of 960 — Neutral
- Monthly rank: #769 out of 960 — Bearish
- 3-Monthly rank: #765 out of 960 — Neutral
- 6-Monthly rank: #877 out of 960 — Bearish
- Yearly rank: #856 out of 960 — Bearish
Cross-horizon dispersion is the defining feature of the current ZARDKK profile. The Daily rank (#129/960) sits in the upper portion of the universe and prints as Bullish, while the Monthly rank (#769/960) and Yearly rank (#856/960) remain in the weaker tail and carry Bearish labels. This type of configuration often appears when a short-term rebound is occurring inside a longer-term down-regime, or when local strength is not yet broad enough to shift longer-horizon statistics.
The intermediate windows add nuance rather than clarity: Weekly (#447/960) is Neutral and 3-Monthly (#765/960) is also Neutral, implying that the recent improvement is either early-stage or not persistent enough to dominate the rolling distributions on higher timeframes. Meanwhile, 6-Monthly (#877/960) stays Bearish, reinforcing that the broader context is still a headwind.
The stated term view—Short-term Neutral, Mid-term Bearish, Long-term Bearish—is consistent with a market where tactical bounces can occur, but where the burden of proof remains on any sustained trend transition. For positioning and risk framing, the analytical priority is whether the short-term strength can persist long enough to pull the weekly and monthly ranks away from the lower tail.
2) Price & trend overview
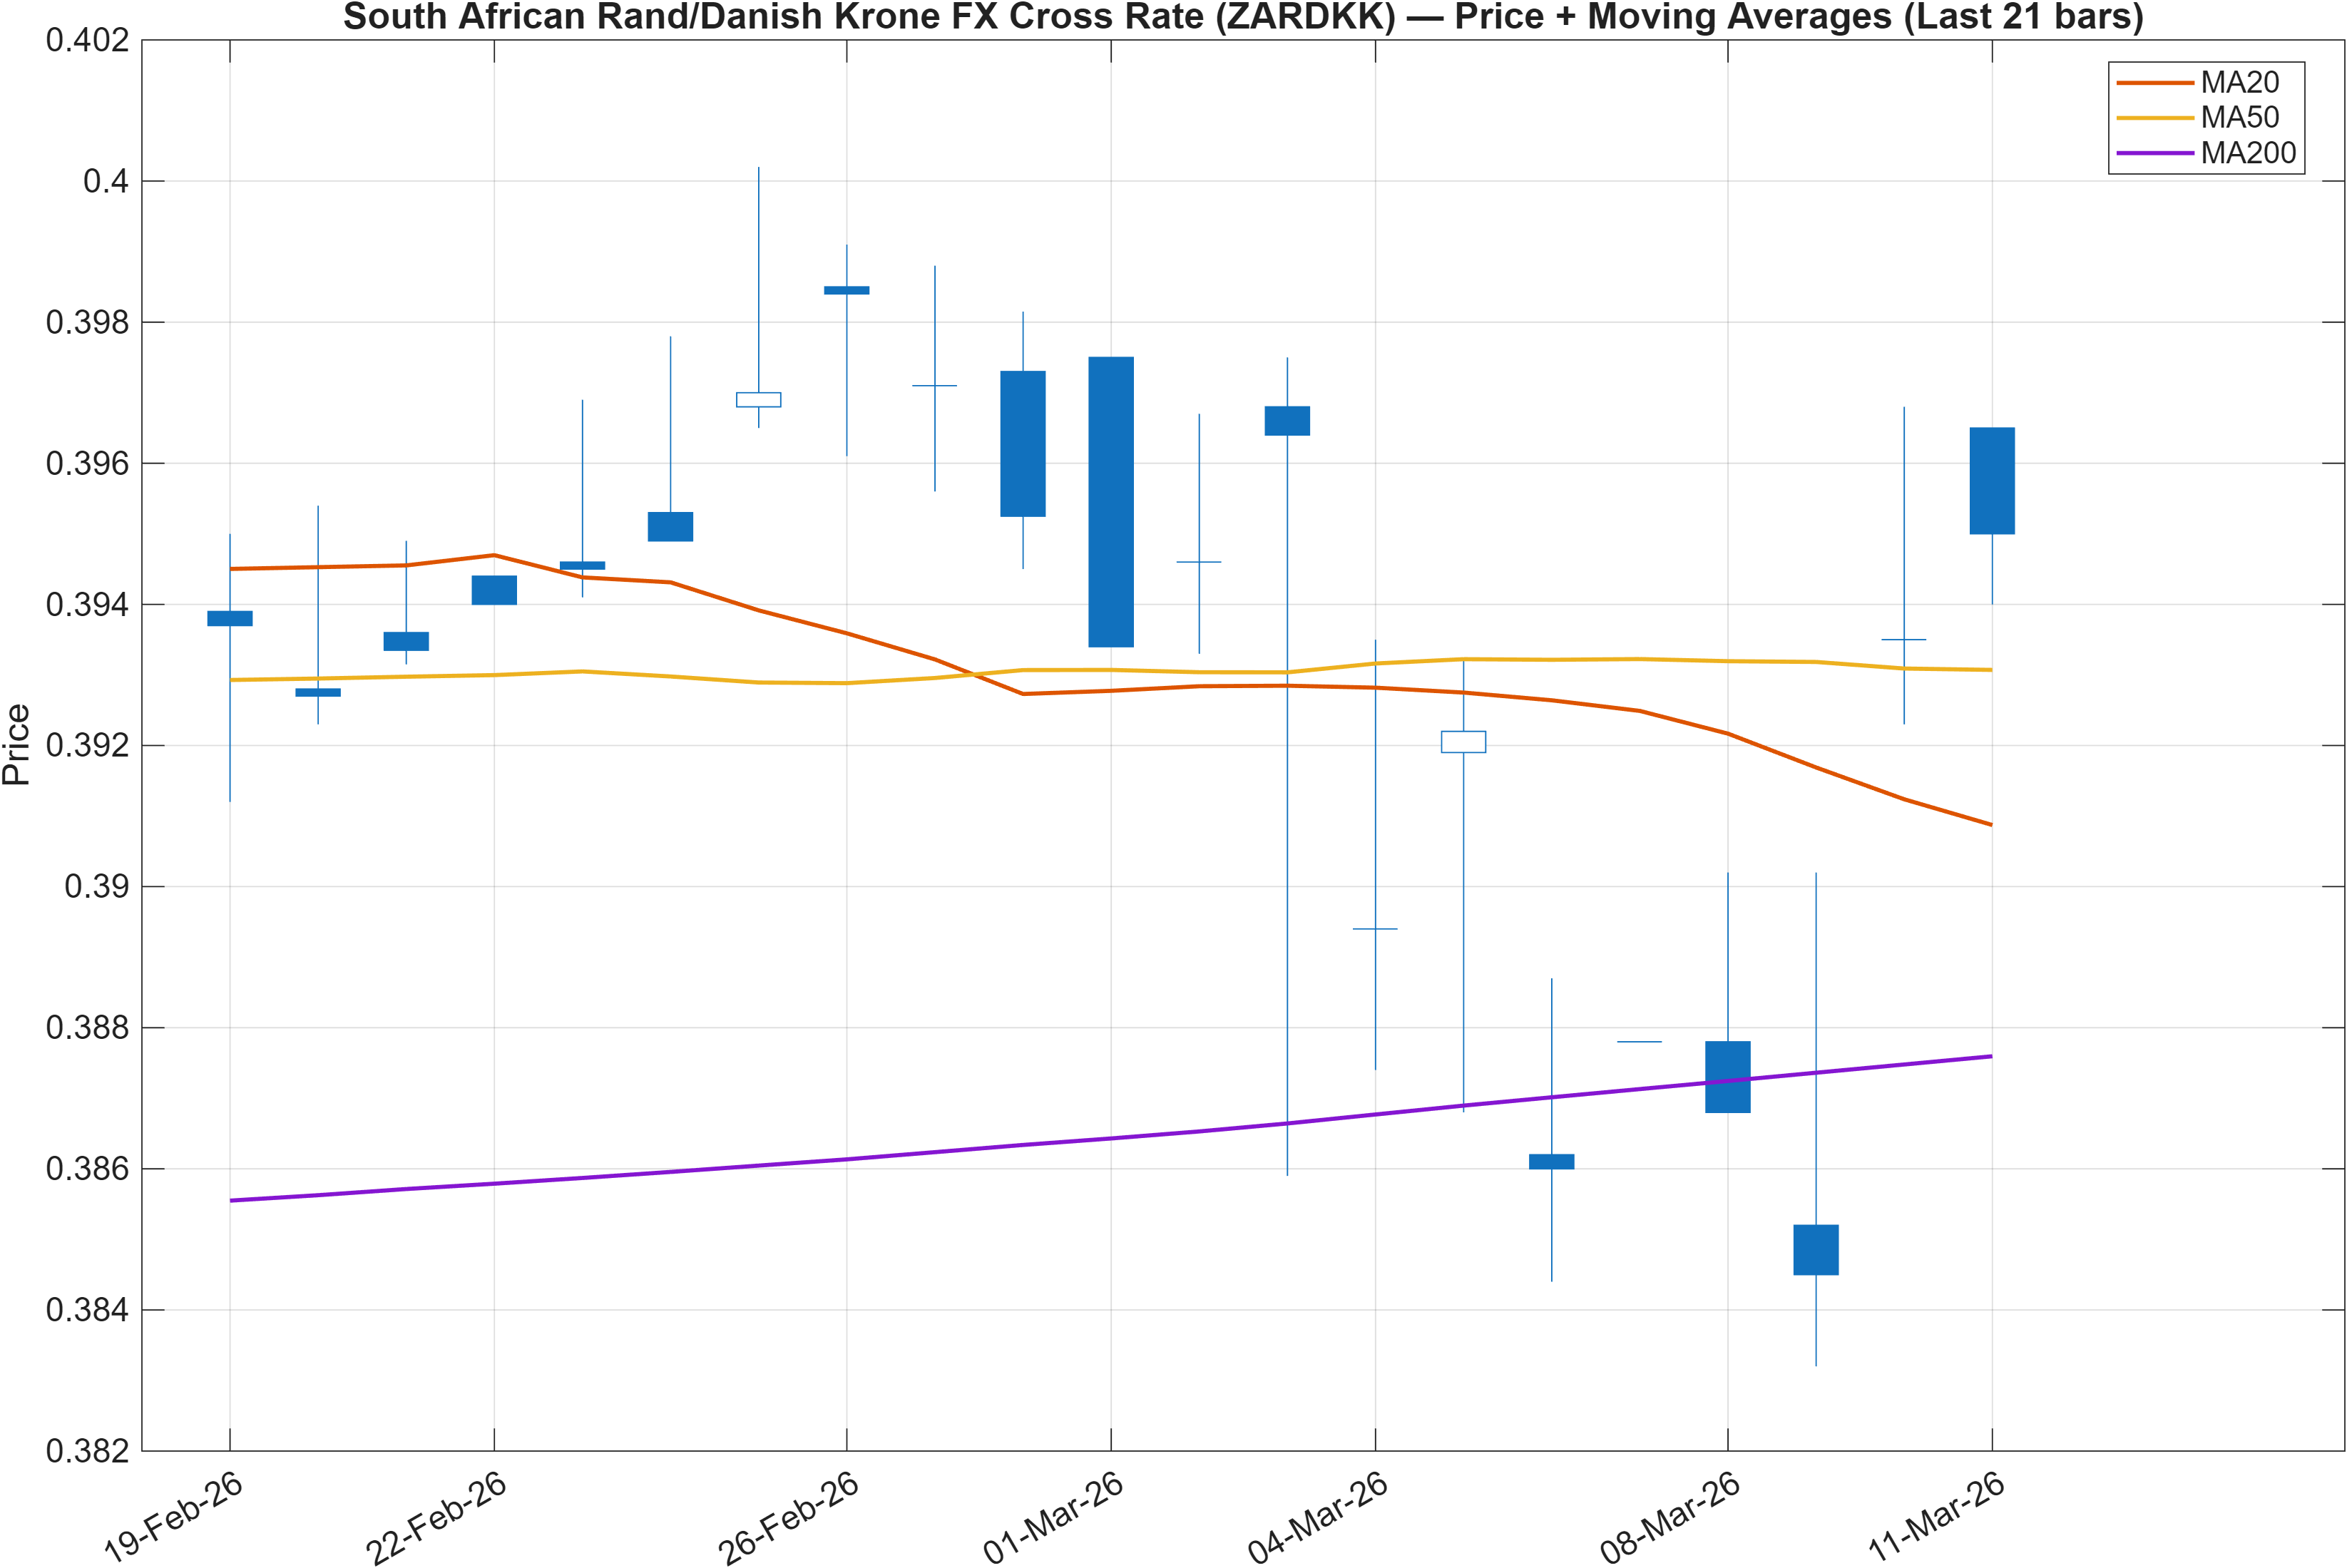
The moving-average structure is locally constructive: Close vs MA50 = Bullish and MA50 vs MA200 = Bullish. In isolation, that configuration suggests the shorter trend component is holding above the intermediate average, and the medium trend is still above the longer baseline—conditions typically associated with trend persistence rather than immediate breakdown. However, the broader ranking profile (notably Monthly #769/960 and Yearly #856/960) argues that this moving-average alignment has not translated into higher-timeframe dominance.
The practical tension here is trend structure vs regime context. When the MA stack is positive but longer-horizon ranks remain weak, it often indicates one of two states: (1) a rebound that is insufficient in magnitude to shift longer-window distributions, or (2) a market that is range-bound enough for averages to look orderly while the probabilistic payoff remains unfavorable relative to peers.
The nearby level map reinforces the “needs confirmation” character of the trend view. With support defined at 0.3865 and resistance at 0.3977, the cross is operating in a relatively tight decision corridor. In that setup, moving-average signals can remain technically bullish while price is still one adverse swing away from shifting the narrative. A clean improvement in rank behavior would typically be expected to coincide with price showing acceptance toward (and beyond) 0.3977 rather than repeated rejection below it.
For a disciplined read, treat the current MA interpretation as evidence of local stabilization, not as a full regime reset. The higher-timeframe ranks imply that any bullish trend classification must be stress-tested against the lower-tail positioning that persists at 6-Monthly #877 and Yearly #856.
3) Momentum & volatility dashboard
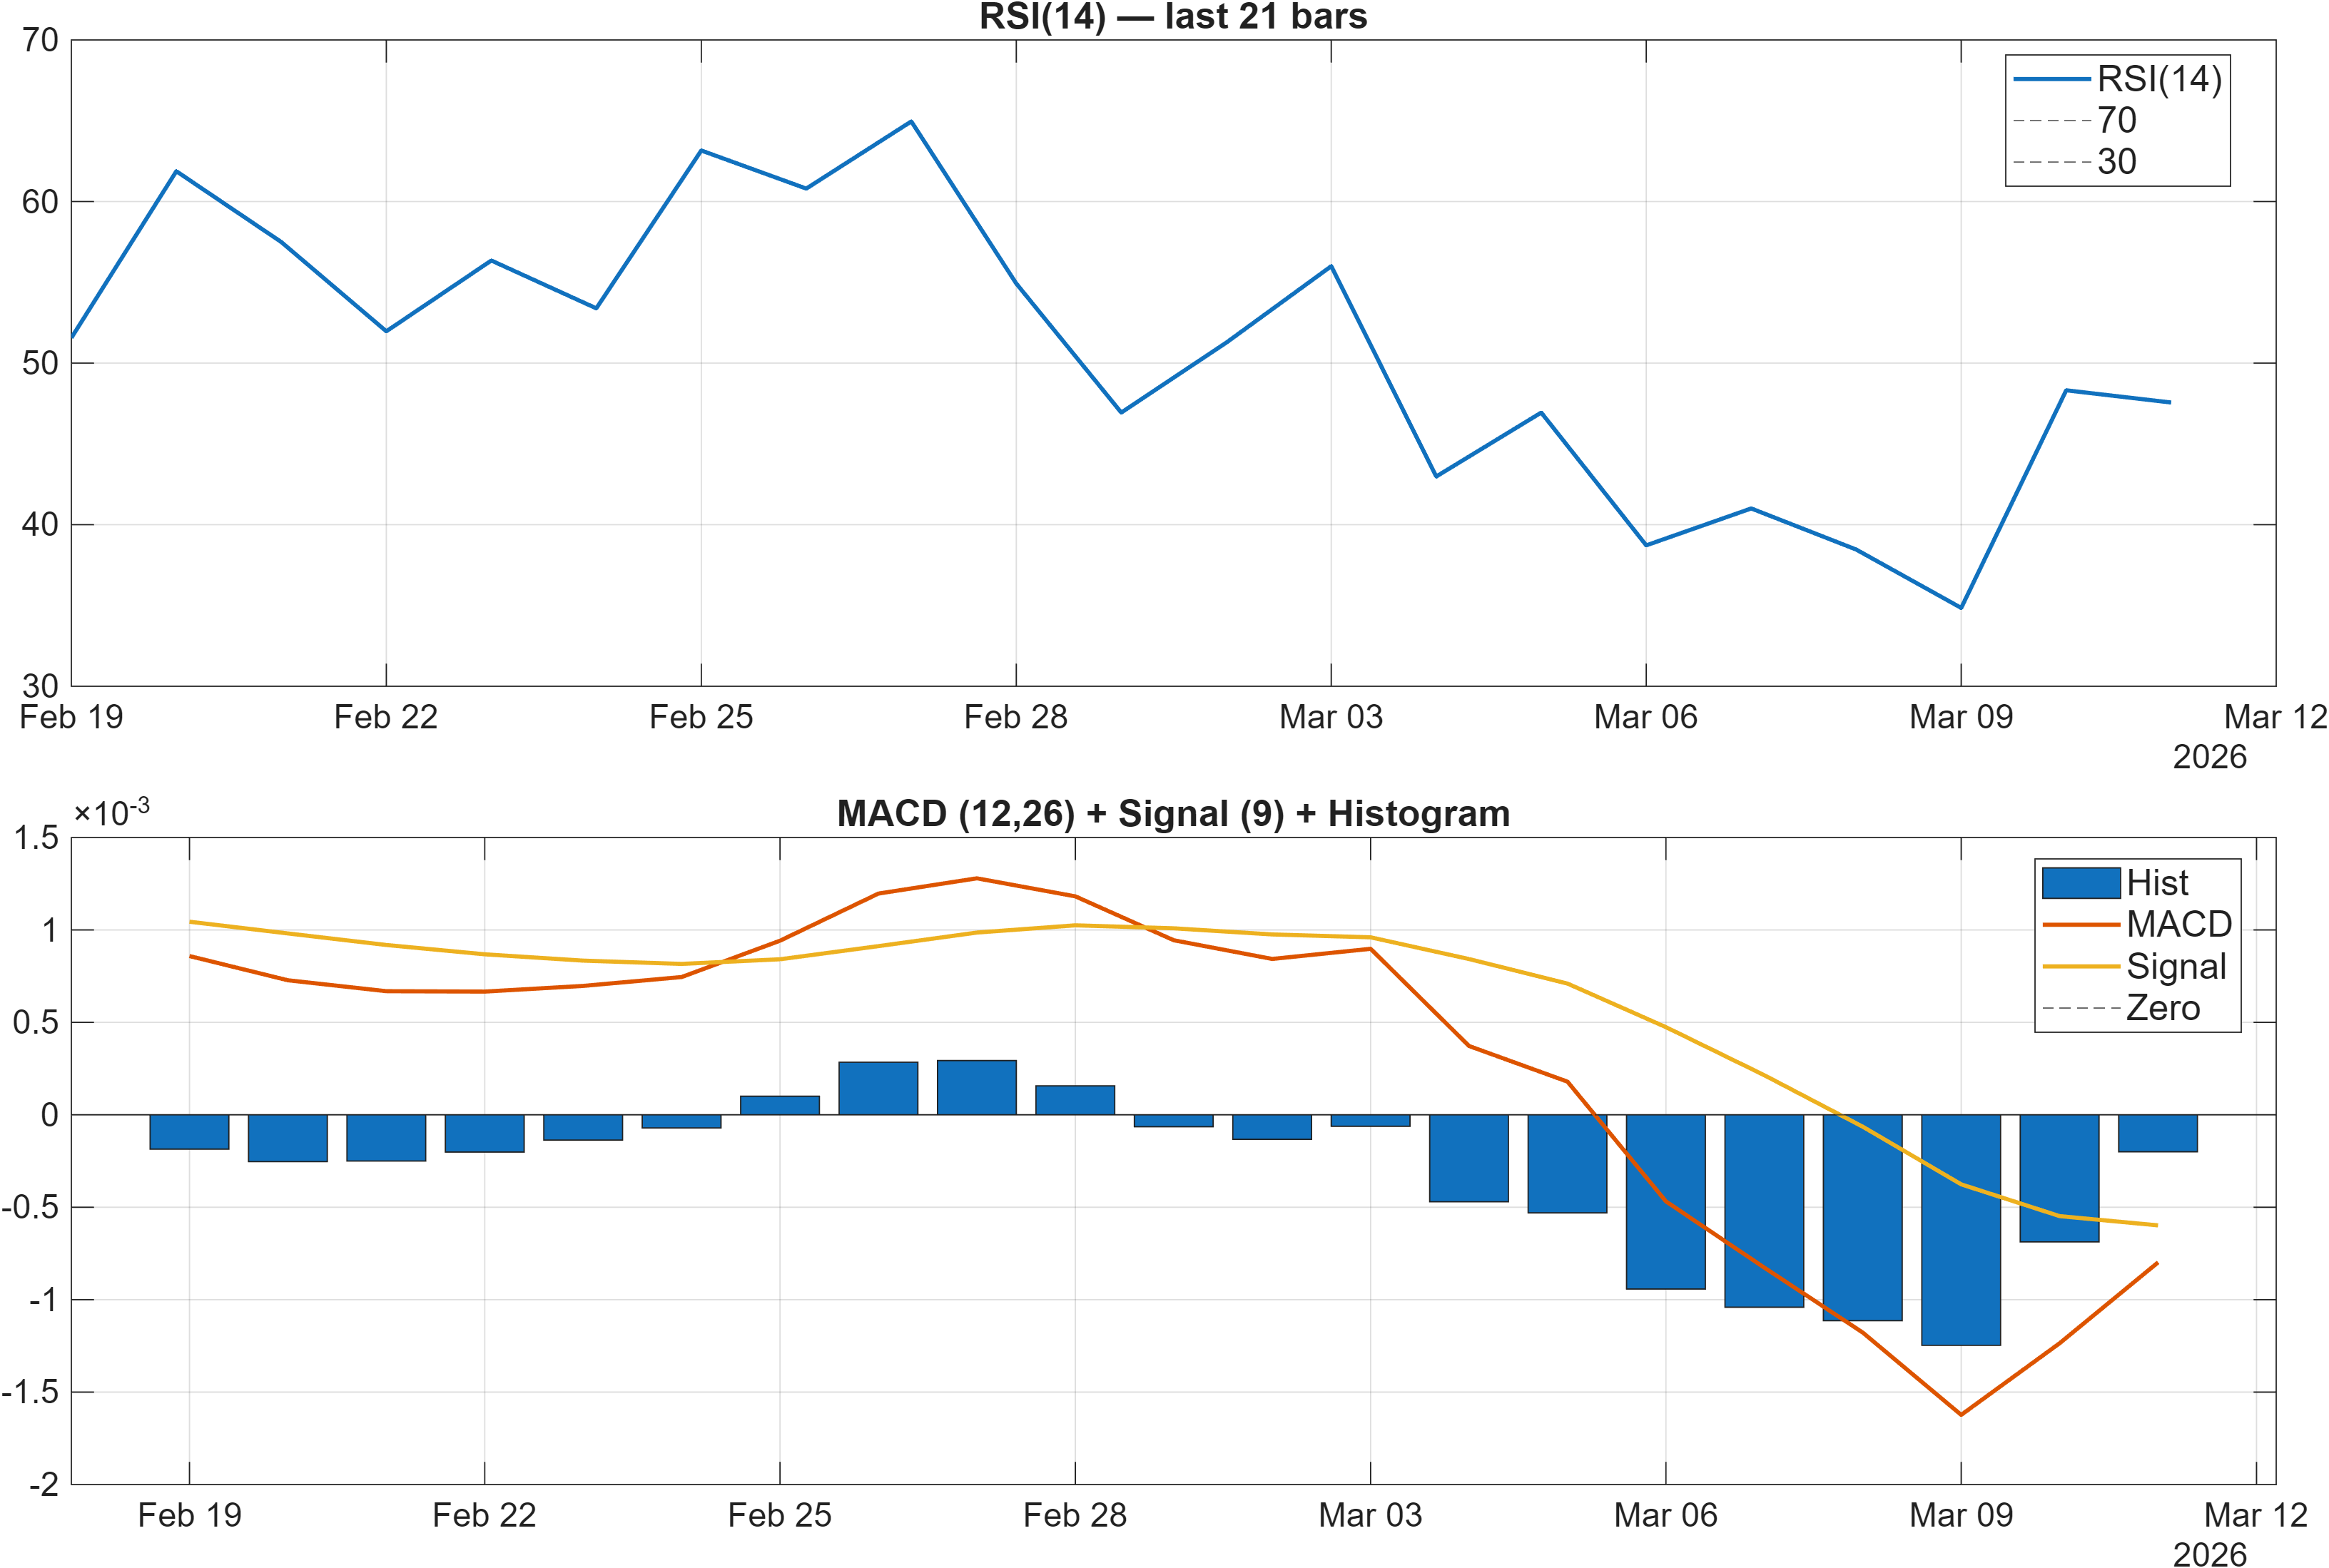
Momentum conditions are best described as contained rather than directional. The RSI(14) at 47.56 is consistent with a mid-range equilibrium, aligning with the stated RSI bias = Neutral. This matters because a durable upside phase typically brings RSI behavior into a higher band, while persistent downtrends often keep RSI suppressed. Here, neither condition is present.
MACD adds a mild counterweight. The MACD histogram at -0.0002 (and the table’s -0.0002001) keeps the momentum impulse fractionally negative, implying that any recent stabilization has not yet produced a clear positive acceleration profile. This is consistent with a market that can hold up on short-term trend structure (moving averages) while still lacking enough underlying thrust to migrate the rank profile away from longer-term weakness.
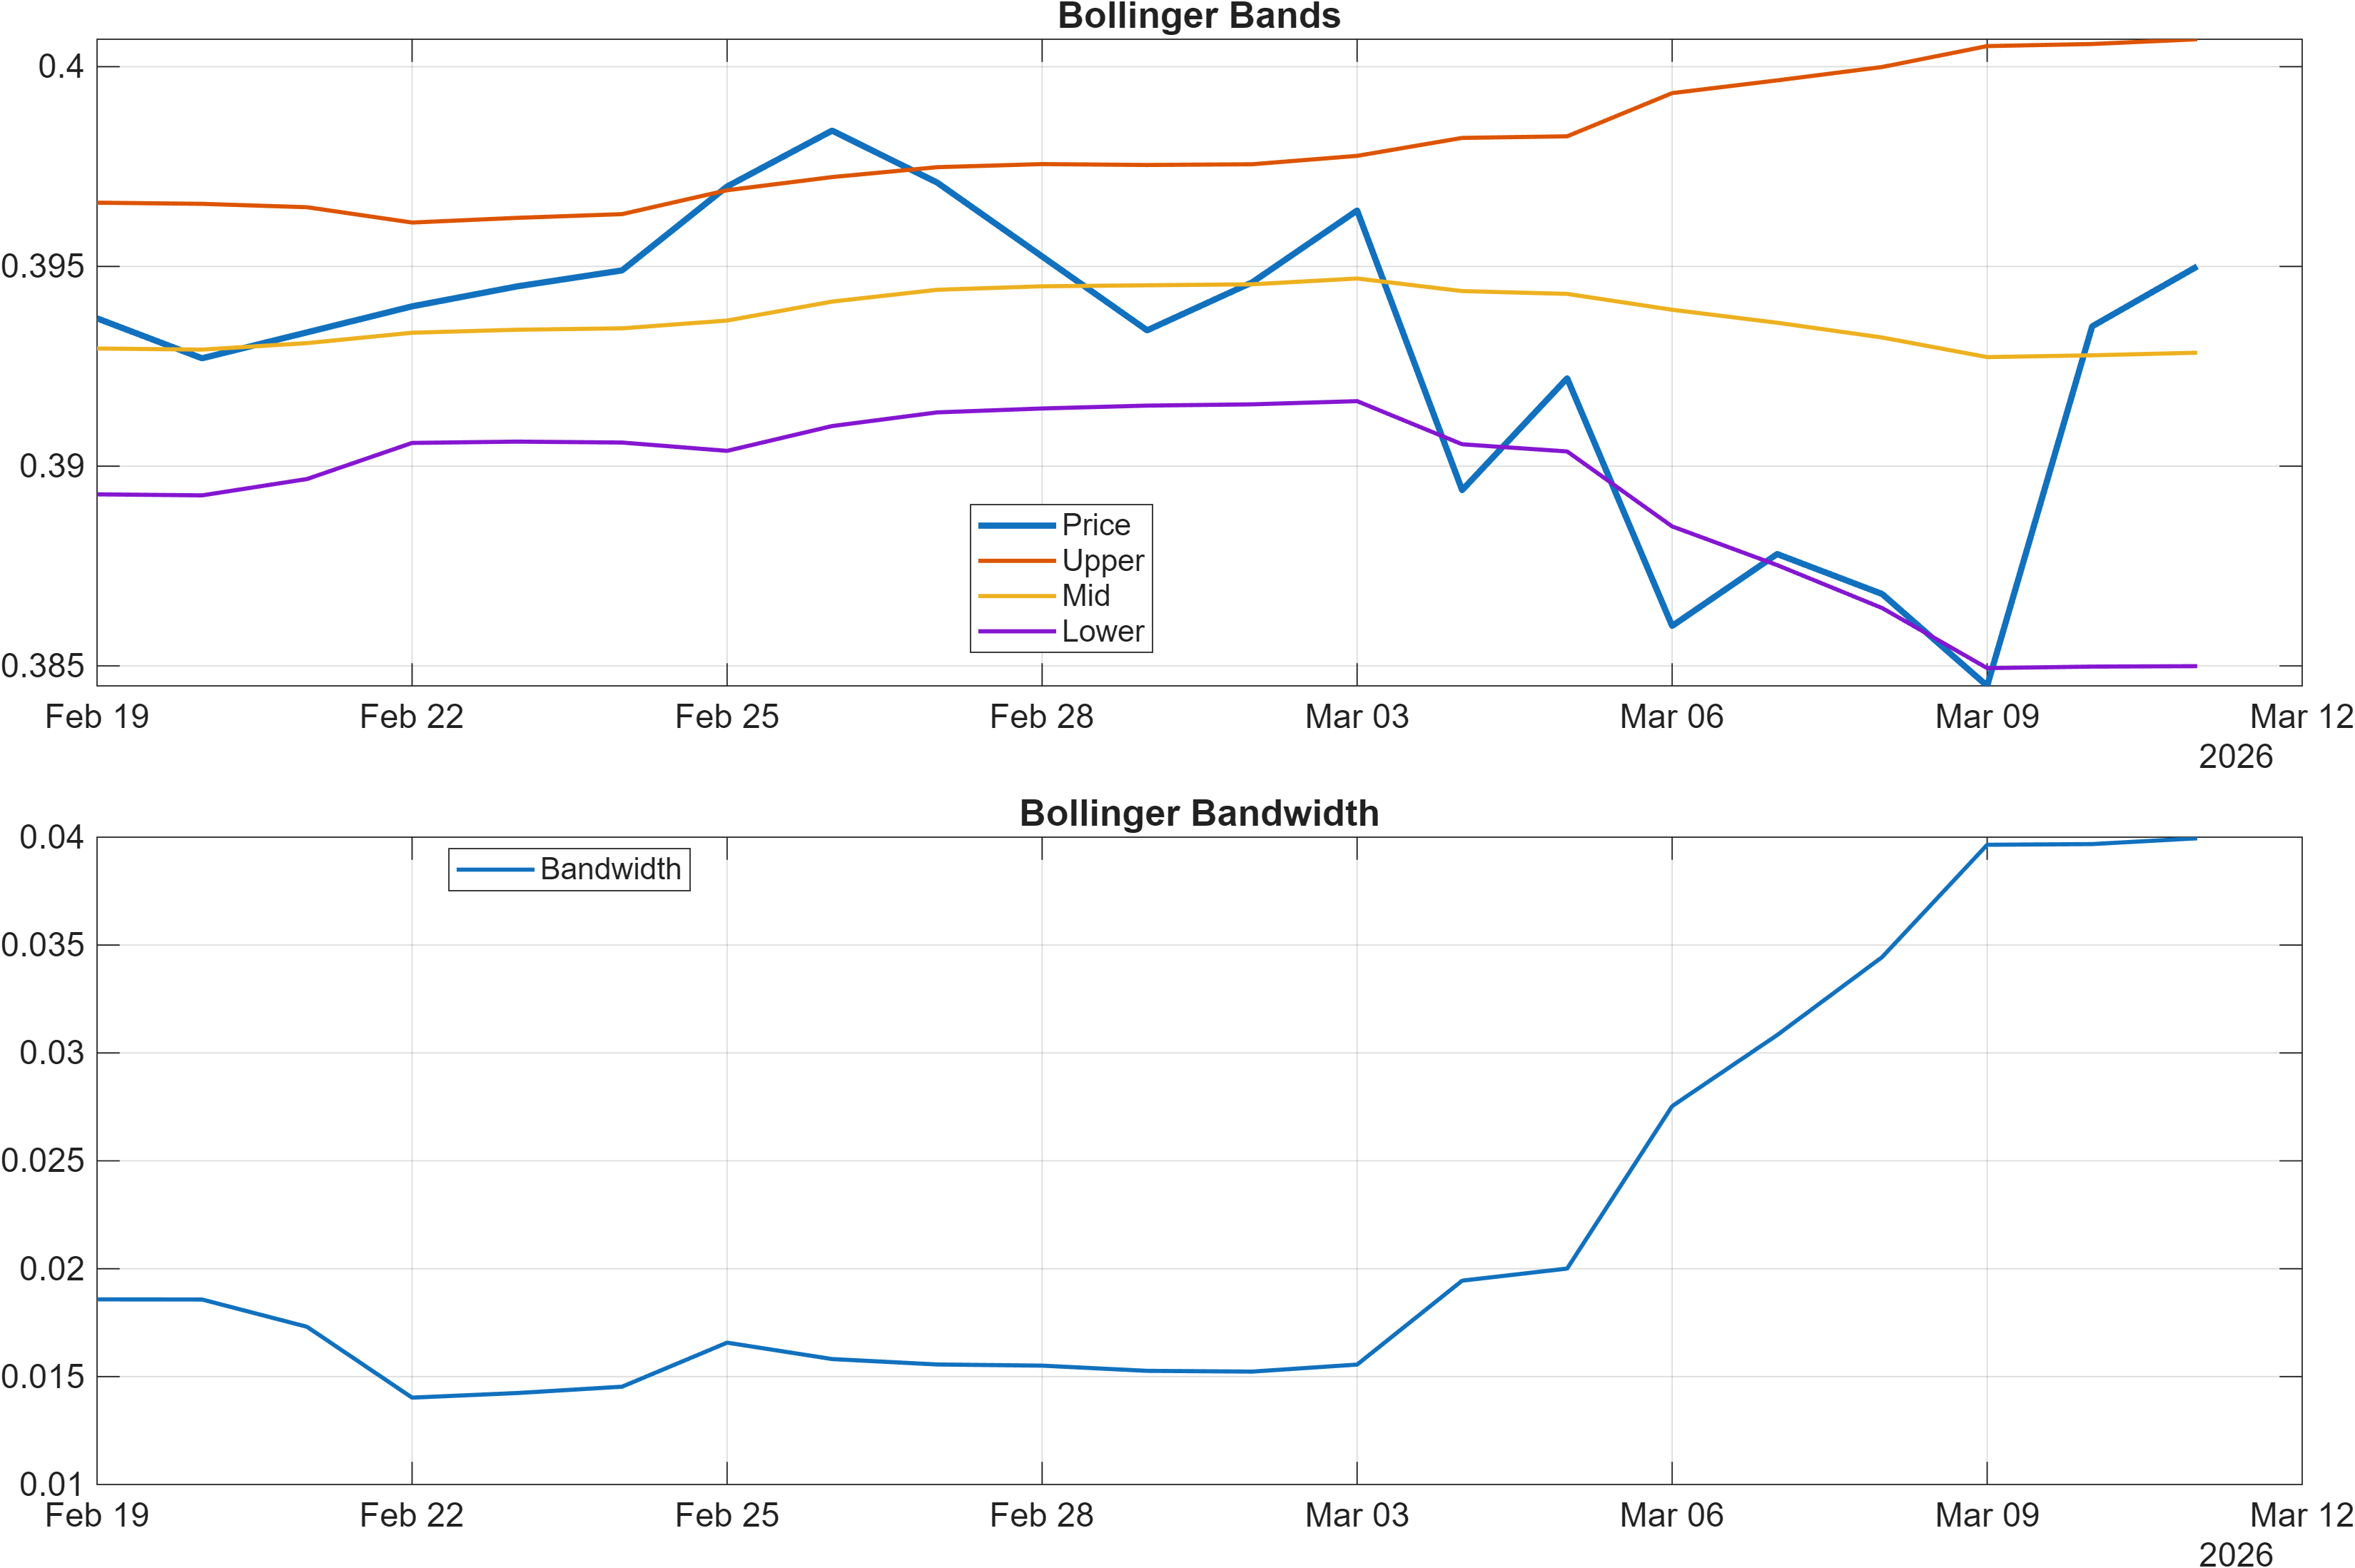
Volatility is not signaling a breakout regime. Bollinger Bandwidth at 0.0399 (table shows 0.03995) indicates a relatively measured volatility state rather than an expansion phase. In a compression-like environment, signals often become more sensitive to modest swings, and price can alternate between momentum “teases” without committing. That backdrop fits the broader Neutral technical blend (0.073) and helps explain why the daily rank can look better without forcing the monthly and yearly ranks to reprice.
The combination—RSI mid-range, slightly negative MACD histogram, and non-expanding bandwidth—suggests that the next informative move is likely to come from level acceptance (support/resistance) rather than oscillator extremes. Until volatility expands, momentum readings may remain more confirmatory than leading.
4) Support / Resistance zones
Support ~ 0.3865 | Resistance ~ 0.3977
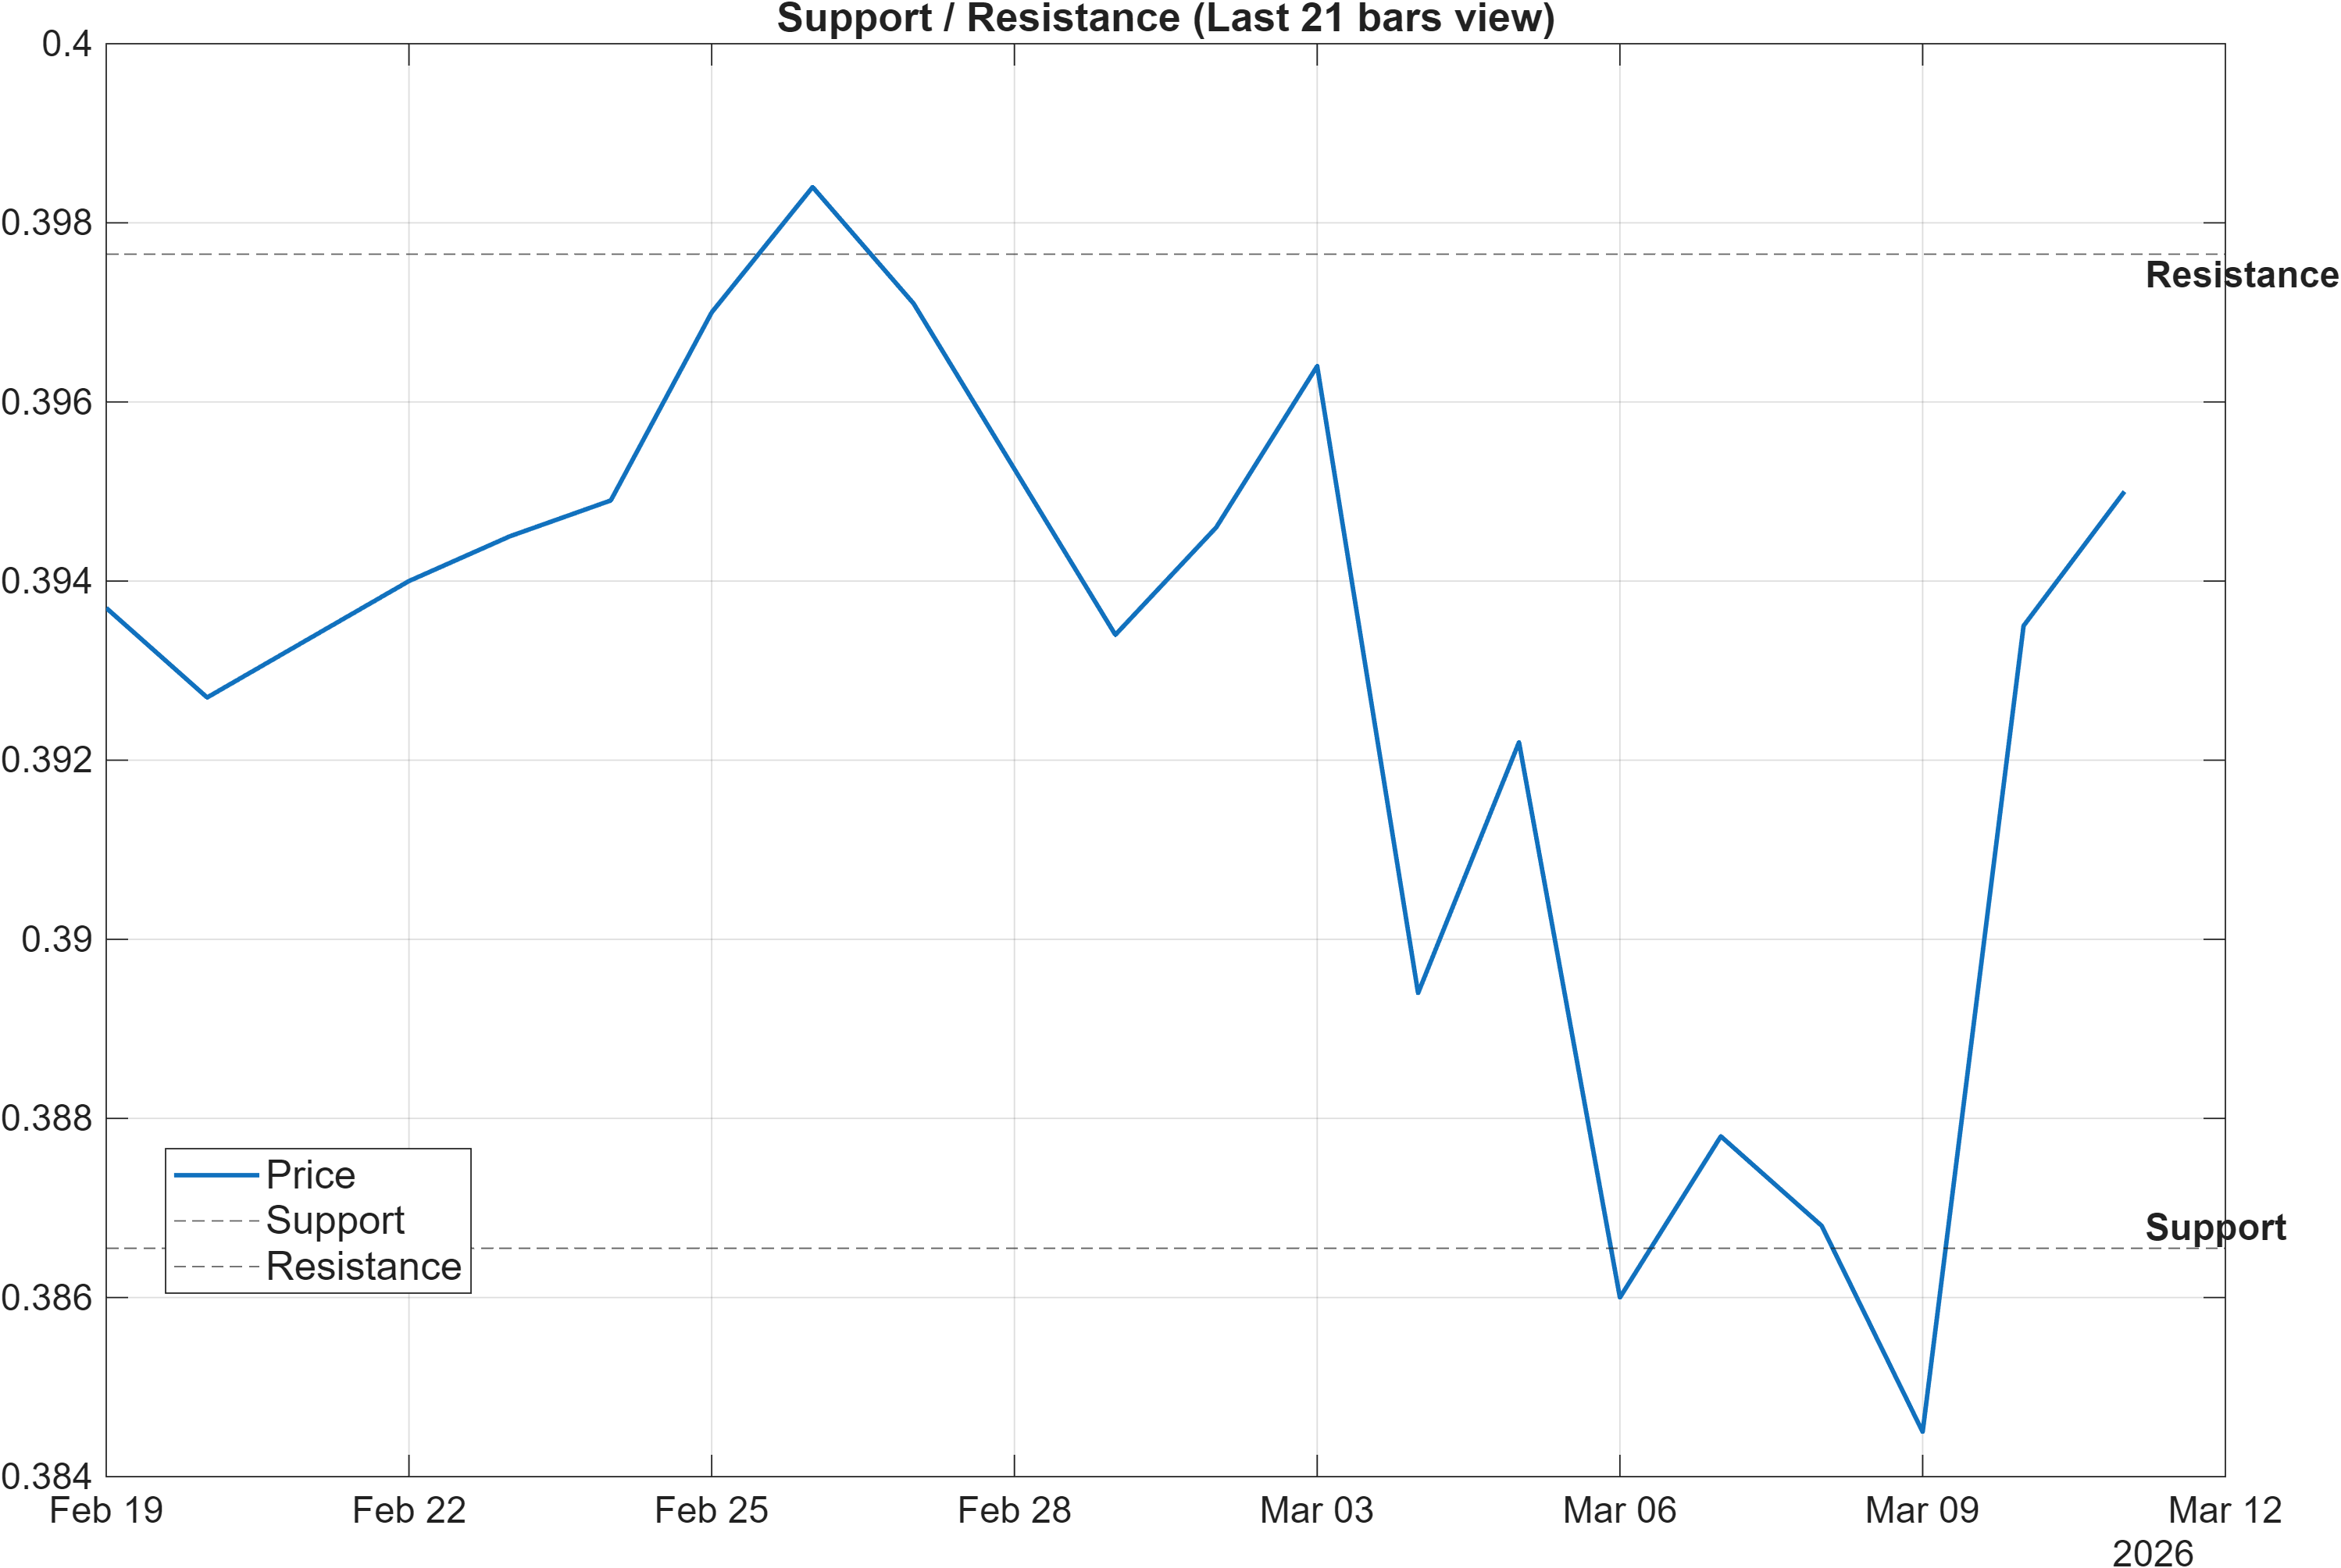
ZARDKK is framed by a relatively tight band between 0.3865 and 0.3977, which makes location more important than broad narrative. In this type of structure, the most useful question is whether price is being accepted above resistance or rejected back toward support, because small changes can disproportionately impact short-term ranks and oscillator-based signals.
The scenario language provided—break above resistance with volume → continuation, close below support → signal deterioration risk—is directionally consistent with the cross-horizon rank dispersion. A failure through 0.3865 would likely bring the short-term profile back into alignment with the already weak longer-horizon ranks (e.g., 6-Monthly #877/960 and Yearly #856/960). Conversely, sustained behavior above 0.3977 is the type of condition that would be expected to stabilize weekly distributions and potentially reduce the gap between the Daily #129 and the Monthly #769.
There is also a technical “mapping” consistency inside the signal set: the 20-day high is listed at 0.4002 and the 20-day low at 0.3832, placing the published resistance and support inside a broader recent range. That positioning implies the immediate zones are not arbitrary—they sit near actionable decision points within the recent price envelope, which is helpful when oscillators are not offering strong directional conviction (e.g., RSI(14) 47.56).
Overall, the level structure suggests a market where break/hold behavior should be treated as higher signal value than incremental indicator drift, especially while volatility (bandwidth 0.0399) remains contained.
5) Quant Technical Dashboard (18 Signals)
KGNAI AI Technical Analysis Score (Deep Reinforcement Learning): Rank #425 out of 960 (Rank 1 represents the strongest technical positioning and a higher probability of favorable price behavior. As ranks increase toward the maximum, the probability of favorable outcomes weakens and bearish positioning becomes more dominant.) | Label: Neutral | Score: 0.115
18-Signal Technical Confluence Score: 0.056 (Neutral)
Overall Technical Score (18-signal confluence + DRL rank blend): 0.073 (Neutral)
Note: The blended score reflects signal strength weighted against broader AI technical ranking, which may temporarily diverge.
Blended technical score breakdown: 0.073 (Neutral | Bull 5 / Bear 4 / Neutral 9)
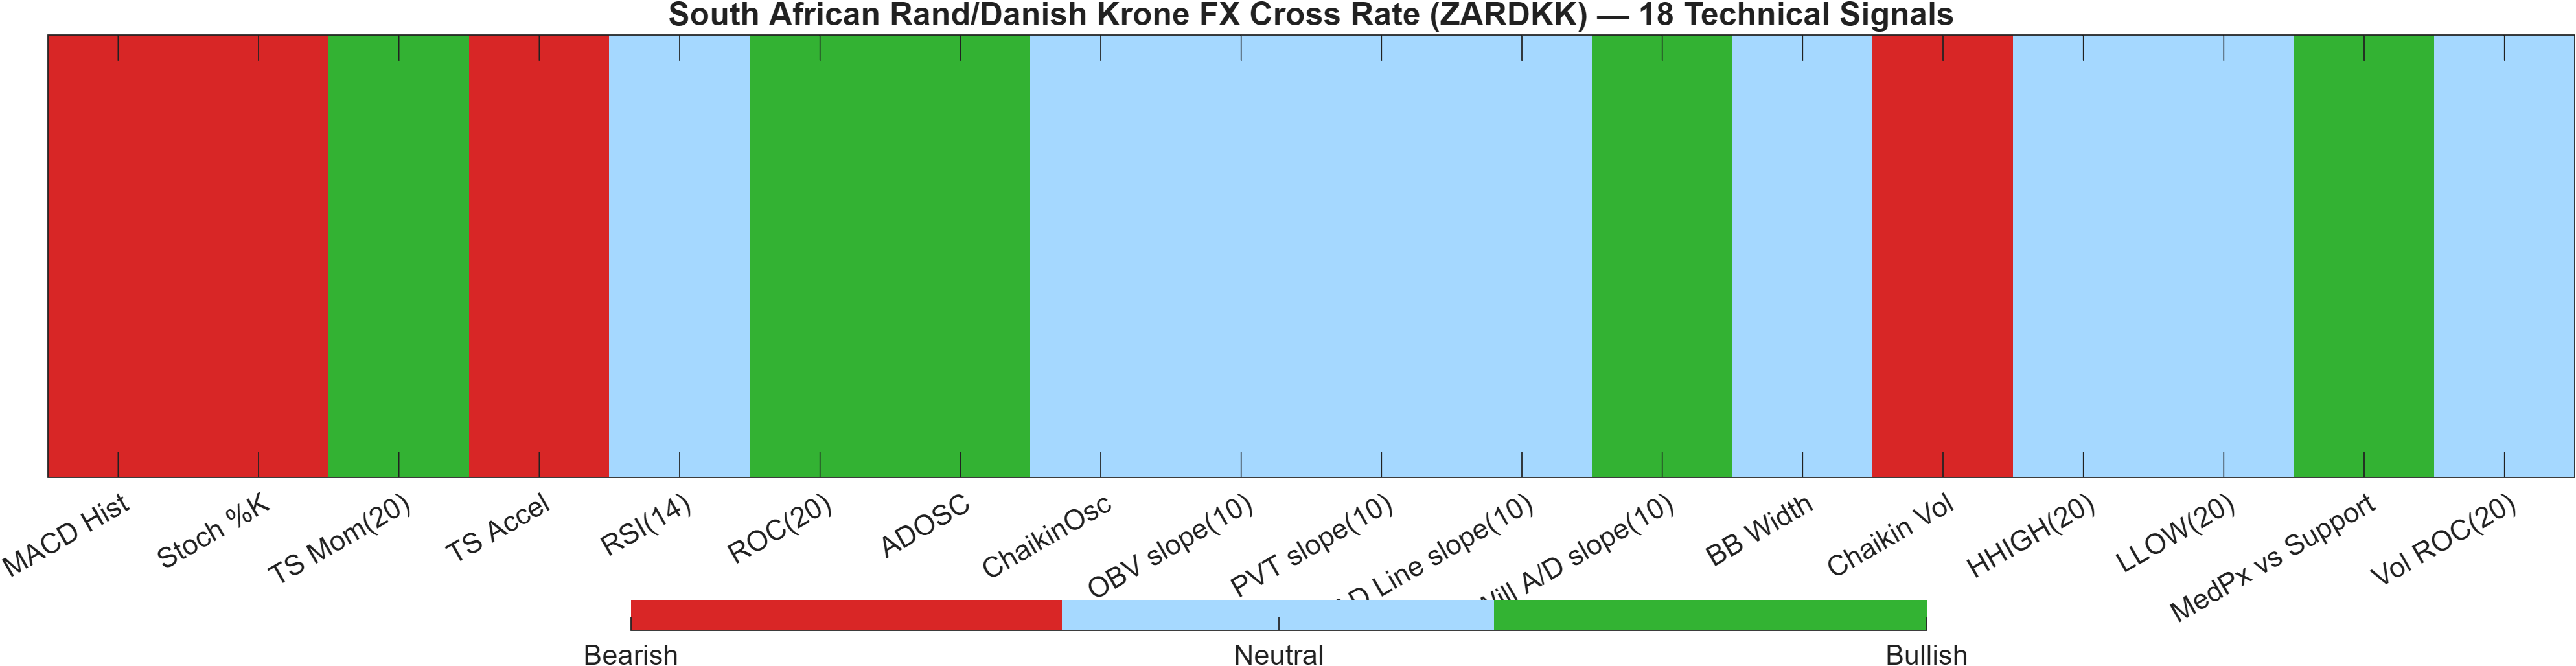
The technical dashboard reads as balanced but not decisive. The DRL technical rank (#425/960) sits near the middle of the universe with a Neutral label and a score of 0.115. In parallel, the cross-signal consensus is also muted: 18-signal confluence = 0.056 and the blended score = 0.073, both Neutral. This combination typically characterizes a market in which indicators are not “stacking” in one direction strongly enough to dominate noise.
Signal composition: alignment vs divergence
The mix—Bull 5 / Bear 4 / Neutral 9—suggests signal dispersion. Momentum is split: ROC(20) at 0.5857 and TS Mom(20) at 0.0023 tilt constructive, while MACD Hist at -0.0002001 and TS Accel at -0.0003 argue that upside momentum is not accelerating cleanly. This is a common “grind” profile, where trend-following measures can improve before oscillators fully confirm.
Volatility/participation is similarly mixed. BB Width at 0.03995 is neutral, while Chaikin Vol at 29.82 reads bearish—an important reminder that volatility dynamics can deteriorate even when price is holding up. Meanwhile, several flow/volume slopes are neutral (multiple “0” readings), which reduces the evidentiary weight for a sustained directional push.
A notable tactical positive is MedPx vs Support at 0.0087 (bullish), consistent with price currently sitting at a constructive distance from the 0.3865 support zone. However, given the higher-timeframe weakness (e.g., Monthly #769, Yearly #856), this should be treated as a conditional support advantage rather than a broader reversal signature.
Signal table (Bull/Bear/Neutral)
| Indicator | Value | Signal |
|---|---|---|
| MACD Hist | -0.0002001 | Bearish |
| Stoch %K | 82.52 | Bearish |
| TS Mom(20) | 0.0023 | Bullish |
| TS Accel | -0.0003 | Bearish |
| RSI(14) | 47.56 | Neutral |
| ROC(20) | 0.5857 | Bullish |
| ADOSC | 20 | Bullish |
| ChaikinOsc | 0 | Neutral |
| OBV slope(10) | 0 | Neutral |
| PVT slope(10) | 0 | Neutral |
| AD Line slope(10) | 0 | Neutral |
| Will A/D slope(10) | 0.0072 | Bullish |
| BB Width | 0.03995 | Neutral |
| Chaikin Vol | 29.82 | Bearish |
| HHIGH(20) | 0.4002 | Neutral |
| LLOW(20) | 0.3832 | Neutral |
| MedPx vs Support | 0.0087 | Bullish |
| Vol ROC(20) | — | Neutral |
Interpretation: Indicator-level signals form the base confluence, which is then adjusted using a separate AI-driven technical ranking model. The final technical score summarizes this combined view.
6) News sentiment + extractive gist
Note: Instrument-specific news matches were not found, so the digest includes broader market/sector headlines. Links are provided for verification.
Sentiment score (avg): 0.071 | Positive: 31% | Neutral: 56% | Negative: 12%
KGNAI AI News Sentiment Score (normalized -1 to +1): Not available (as of —) | Label: Not available | Overall news score: 0.07
Positive Developments
Recent coverage across major financial outlets indicates a modestly constructive tone around select risk assets and pockets of commodity-linked strength, which can influence broader FX risk appetite. The aggregate positive share (31%) and the slightly positive average sentiment (0.071) suggest the news backdrop is not uniformly defensive. Themes reflected in coverage include stabilization in certain commodities and market narratives that lean toward resilience rather than crisis framing. For a cross like ZARDKK, this type of backdrop can matter indirectly: when risk conditions are steady, short-horizon technical stabilization (consistent with the stronger Daily rank #129/960) can persist longer without being overwhelmed by volatility shocks. That said, the overall digest remains dominated by non-specific macro and cross-market developments rather than direct ZARDKK drivers, so the positive impulse is better treated as a context cue than a catalyst.
Neutral / Mixed Developments
The neutral majority (56%) points to a news environment that is information-heavy and data-dependent rather than directional. Coverage clusters around scheduled macro releases and central-bank expectation framing—inputs that tend to create short-term repricing without guaranteeing follow-through. In FX, these mixed conditions commonly translate into range behavior, which aligns with the current technical picture: RSI(14) at 47.56 remains mid-band and Bollinger bandwidth at 0.0399 does not indicate a volatility expansion regime. For readers, the key implication is that “headline beta” may be lower than usual, making price location around 0.3865 support and 0.3977 resistance a more reliable organizing framework than attempting to map each data point to a directional forecast.
Negative / Risk Signals
The negative slice (12%) is smaller, but the risk content is meaningful: elevated geopolitical sensitivity and inflation/central-bank uncertainty can raise tail-risk for FX crosses even when day-to-day trading looks calm. This matters because the longer-horizon KGNAI ranks remain weak (Monthly #769/960, Yearly #856/960), implying that the cross may be less robust if risk conditions worsen. In such environments, trend structure can degrade quickly as volatility shifts from compressed to expanding, and slightly negative momentum readings—such as MACD histogram -0.0002—can become more informative. The actionable takeaway is not that risk is dominant today, but that the market still appears vulnerable to adverse regime change given the higher-timeframe positioning.
- Whether price holds above 0.3865 on closes, versus sliding into repeated tests.
- Any sustained acceptance beyond 0.3977, rather than brief spikes that revert.
- Volatility regime shifts: watch whether bandwidth remains near 0.0399 or begins expanding.
Sources referenced: Reuters, Bloomberg, Yahoo Finance, MarketWatch, Investing.com
Snapshot: AI Rank (Short–Mid–Long): Mixed (Bearish tilt) (Neutral–Bearish–Bearish) · Technical Confluence: Neutral · Key Levels: Support ~0.39 | Resistance ~0.40 · News Sentiment: Neutral
7) Sources
- US CPI data seen steady in February as markets assess Fed policy outlook — https://www.fxstreet.com/news/us-cpi-data-seen-steady-in-february-as-markets-assess-fed-policy-outlook-202603110400
- NZD/USD remains below 0.5950 due to increased risk aversion — https://www.fxstreet.com/news/nzd-usd-remains-below-05950-due-to-increased-risk-aversion-202603110244
- Canadian Dollar bulls seem hesitant as sliding Oil prices counter softer USD ahead of US CPI — https://www.fxstreet.com/news/canadian-dollar-bulls-seem-hesitant-as-sliding-oil-prices-counter-softer-usd-ahead-of-us-cpi-202603110229
- Japanese Yen weakens below 158.50 on BoJ policy uncertainty, US CPI in focus — https://www.fxstreet.com/news/japanese-yen-weakens-below-15850-on-boj-policy-uncertainty-us-cpi-in-focus-202603110227
- IEA proposes record oil release from strategic reserves — WSJ — https://www.fxstreet.com/news/iea-proposes-record-oil-release-from-strategic-reserves-wsj-202603110222
- Iran’s Revolutionary Guard announces targeting of enemy tech infrastructure in region — https://www.fxstreet.com/news/irans-revolutionary-guard-announces-targeting-of-enemy-tech-infrastructure-in-region-202603110157
- Silver Price Forecast: XAG/USD consolidates below $89.00; bullish bias remains — https://www.fxstreet.com/news/silver-price-forecast-xag-usd-consolidates-below-8900-bullish-bias-remains-202603110154
- Australian Dollar advances on growing RBA rate hike bets — https://www.fxstreet.com/news/australian-dollar-advances-on-growing-rba-rate-hike-bets-202603110150
You may also like: How KGNAI AI ranks instruments across global markets
Disclaimer: KGNAI provides AI-generated analytics and educational market commentary only. This is not financial advice. Markets involve risk. Always do your own research.