
CHFARS (Swiss Franc/Argentine Peso) — Multi-horizon bullish ranks with mixed trend structure (03-May-2026)
CHFARS sits in the upper tier of KGNAI’s cross-sectional FX universe, with consistently Bullish positioning across the daily through yearly horizons (963 instruments ranked). That rank strength is paired with a Bullish 18-signal confluence (0.333) and a Bullish blended technical score (0.376), while the separate DRL technical rank is more reserved at #253 (Neutral), highlighting a measurable internal divergence between signal clustering and broader pattern-based ranking. Momentum readings lean constructive (RSI(14) 63.37; MACD histogram 2.4004), but the trend overlay is not one-way: price vs MA50 is bullish while MA50 vs MA200 remains bearish, consistent with a market that is positive in the near-term yet still working through longer-cycle structure. Volatility is moderate (Bollinger bandwidth 0.0480), keeping the focus on key decision levels at 1721.3909 support and 1804.2695 resistance. News sentiment is mildly positive overall (avg 0.095) with a largely neutral distribution.
- Rank stance: Short / Mid / Long all Bullish (notably #16 daily; #5 weekly and monthly; #18 yearly).
- Technical confluence: Bullish overall (18-signal confluence 0.333; blended technical score 0.376), despite DRL technical rank #253 (Neutral).
- Key levels: Support ~ 1721.3909; Resistance ~ 1804.2695.
- News sentiment bias: Slightly positive/neutral (avg 0.095; 44% positive, 44% neutral, 12% negative; normalized score Not available).
- Confirmation / invalidation: Sustained acceptance above 1804.2695 supports continuation conditions; a close below 1721.3909 increases deterioration risk.
What KGNAI Measures
KGNAI evaluates assets using large cross-sectional datasets built from millions of structured data points. Inputs incorporate fundamental metrics, technical structures, and systematically processed news sentiment. Statistical models, machine learning, and AI frameworks are used to assess relative positioning, signal alignment, and probabilistic behavior across broad universes.
How to Read This Report
- Ranks are comparative across the tracked universe, not absolute price targets.
- Confluence reflects alignment among independent signal groups.
- Support/resistance levels are probabilistic decision zones, not guarantees.
- Sentiment provides contextual bias within the broader analytical framework.
1) KGNAI AI Analysis
Region: FOREX
Total universe size: 963 ranked instruments
- Daily rank: #16 out of 963 — Bullish
- Weekly rank: #5 out of 963 — Bullish
- Monthly rank: #5 out of 963 — Bullish
- 3-Monthly rank: #6 out of 963 — Bullish
- 6-Monthly rank: #9 out of 963 — Bullish
- Yearly rank: #18 out of 963 — Bullish
CHFARS is positioned in the top decile across most ranked horizons, including #5 on both the weekly and monthly windows and #6 on the 3-month view. That consistency matters: multi-horizon agreement typically indicates that strength is not confined to a single sampling window. Even the yearly horizon remains favorable at #18, which is still within the upper cohort of the 963-instrument universe.
The practical implication is not “certainty,” but relative positioning: the ranking system is built to identify instruments exhibiting stronger probability-weighted behavior versus peers. Here, the short-to-long alignment (daily #16 through yearly #18) reduces the risk of a one-off, short-term anomaly driving the read, and instead suggests a persistent regime where CHFARS has been behaving better than the broad universe on multiple time compressions.
The most useful way to operationalize this section is through cross-checking: when ranks are uniformly bullish, attention shifts to whether technical structure and key levels confirm that regime (Sections 2–5), and whether sentiment context (Section 6) introduces a meaningful conflict. For CHFARS, later sections show a constructive momentum profile (RSI(14) 63.37; MACD histogram 2.4004), but also a longer-trend caveat (MA50 vs MA200 bearish), which is the primary internal tension to monitor alongside the rank strength.
KGNAI ranks each instrument across large universes using multiple proprietary AI tests and statistical models (millions of data points). Lower ranks generally indicate stronger probability of favorable performance behavior, while higher ranks indicate weaker probability and more bearish positioning.
Term view: Short-term: Bullish. Mid-term: Bullish. Long-term: Bullish.
Want the full universe and complete rank tables? Unlock full access on KGNAI: https://www.kgnai.com/pricing
2) Price & trend overview
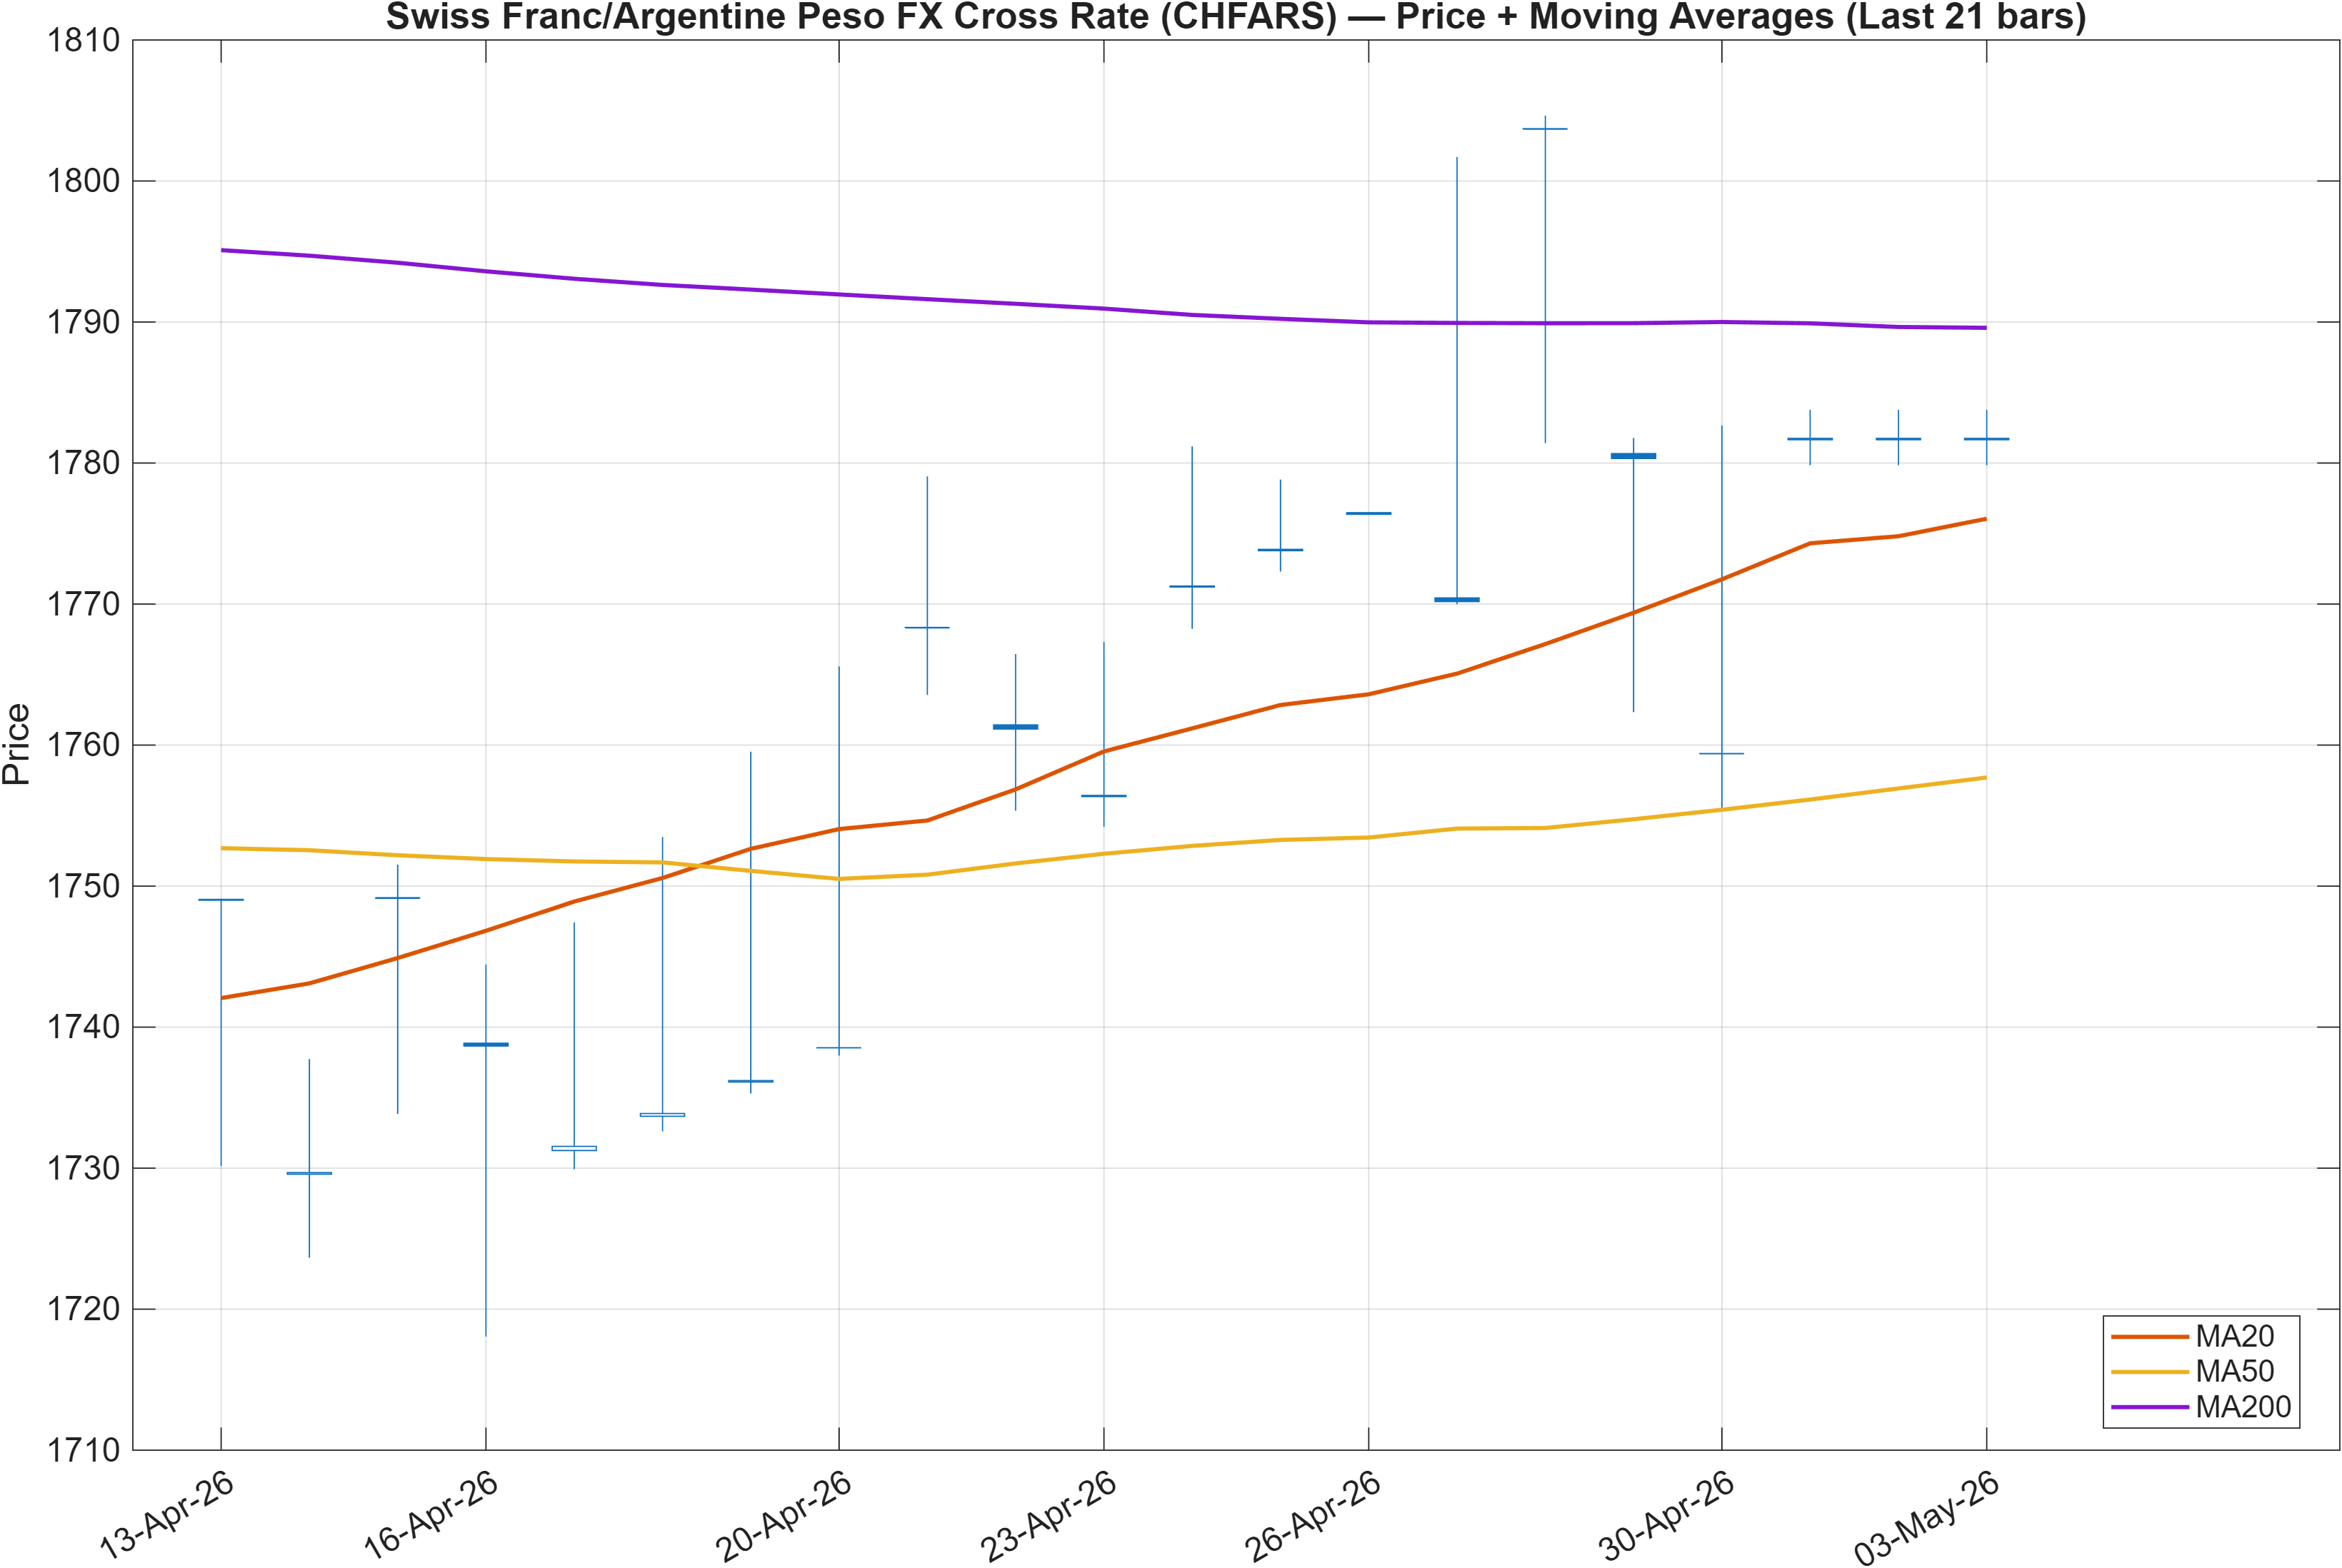
Interpretation: Close vs MA50 = Bullish, MA50 vs MA200 = Bearish.
CHFARS is showing a two-speed trend structure. The close holding above the MA50 is a near-term confirmation that the active swing is constructive. However, MA50 remaining below the MA200 keeps the longer-cycle filter in a bearish configuration, which typically signals that the broader regime has not fully rotated into a mature uptrend.
This mixture often produces a specific market texture: rallies can persist, but they may also encounter sharper mean-reversion responses near overhead supply, especially as price approaches defined resistance. In this report, the most actionable framing is to treat the bullish short-term trend as “valid while supported,” with the 1721.3909 support level acting as the key trend integrity line. A market can be bullish above the MA50 and still be structurally vulnerable if it cannot maintain distance from primary support.
The rank stack reinforces the idea that, despite the MA200 relationship, CHFARS is outperforming peers across horizons (weekly and monthly both #5). That alignment tends to matter most during consolidation phases: instruments with strong cross-sectional ranks often hold trend structure better when the broader FX complex is choppy. Still, the moving-average cross-state argues for discipline around invalidation rather than extrapolation.
With volatility also registering moderate conditions (Bollinger bandwidth 0.0480 in Section 3), trend continuation is more likely to be expressed through incremental progress and level-by-level acceptance than through abrupt expansion. As a result, the quality of reactions around 1804.2695 becomes central: rejection there would be consistent with the longer-cycle headwind (MA50 vs MA200 bearish), while sustained acceptance would be a meaningful regime-improvement signal within this framework.
3) Momentum & volatility dashboard
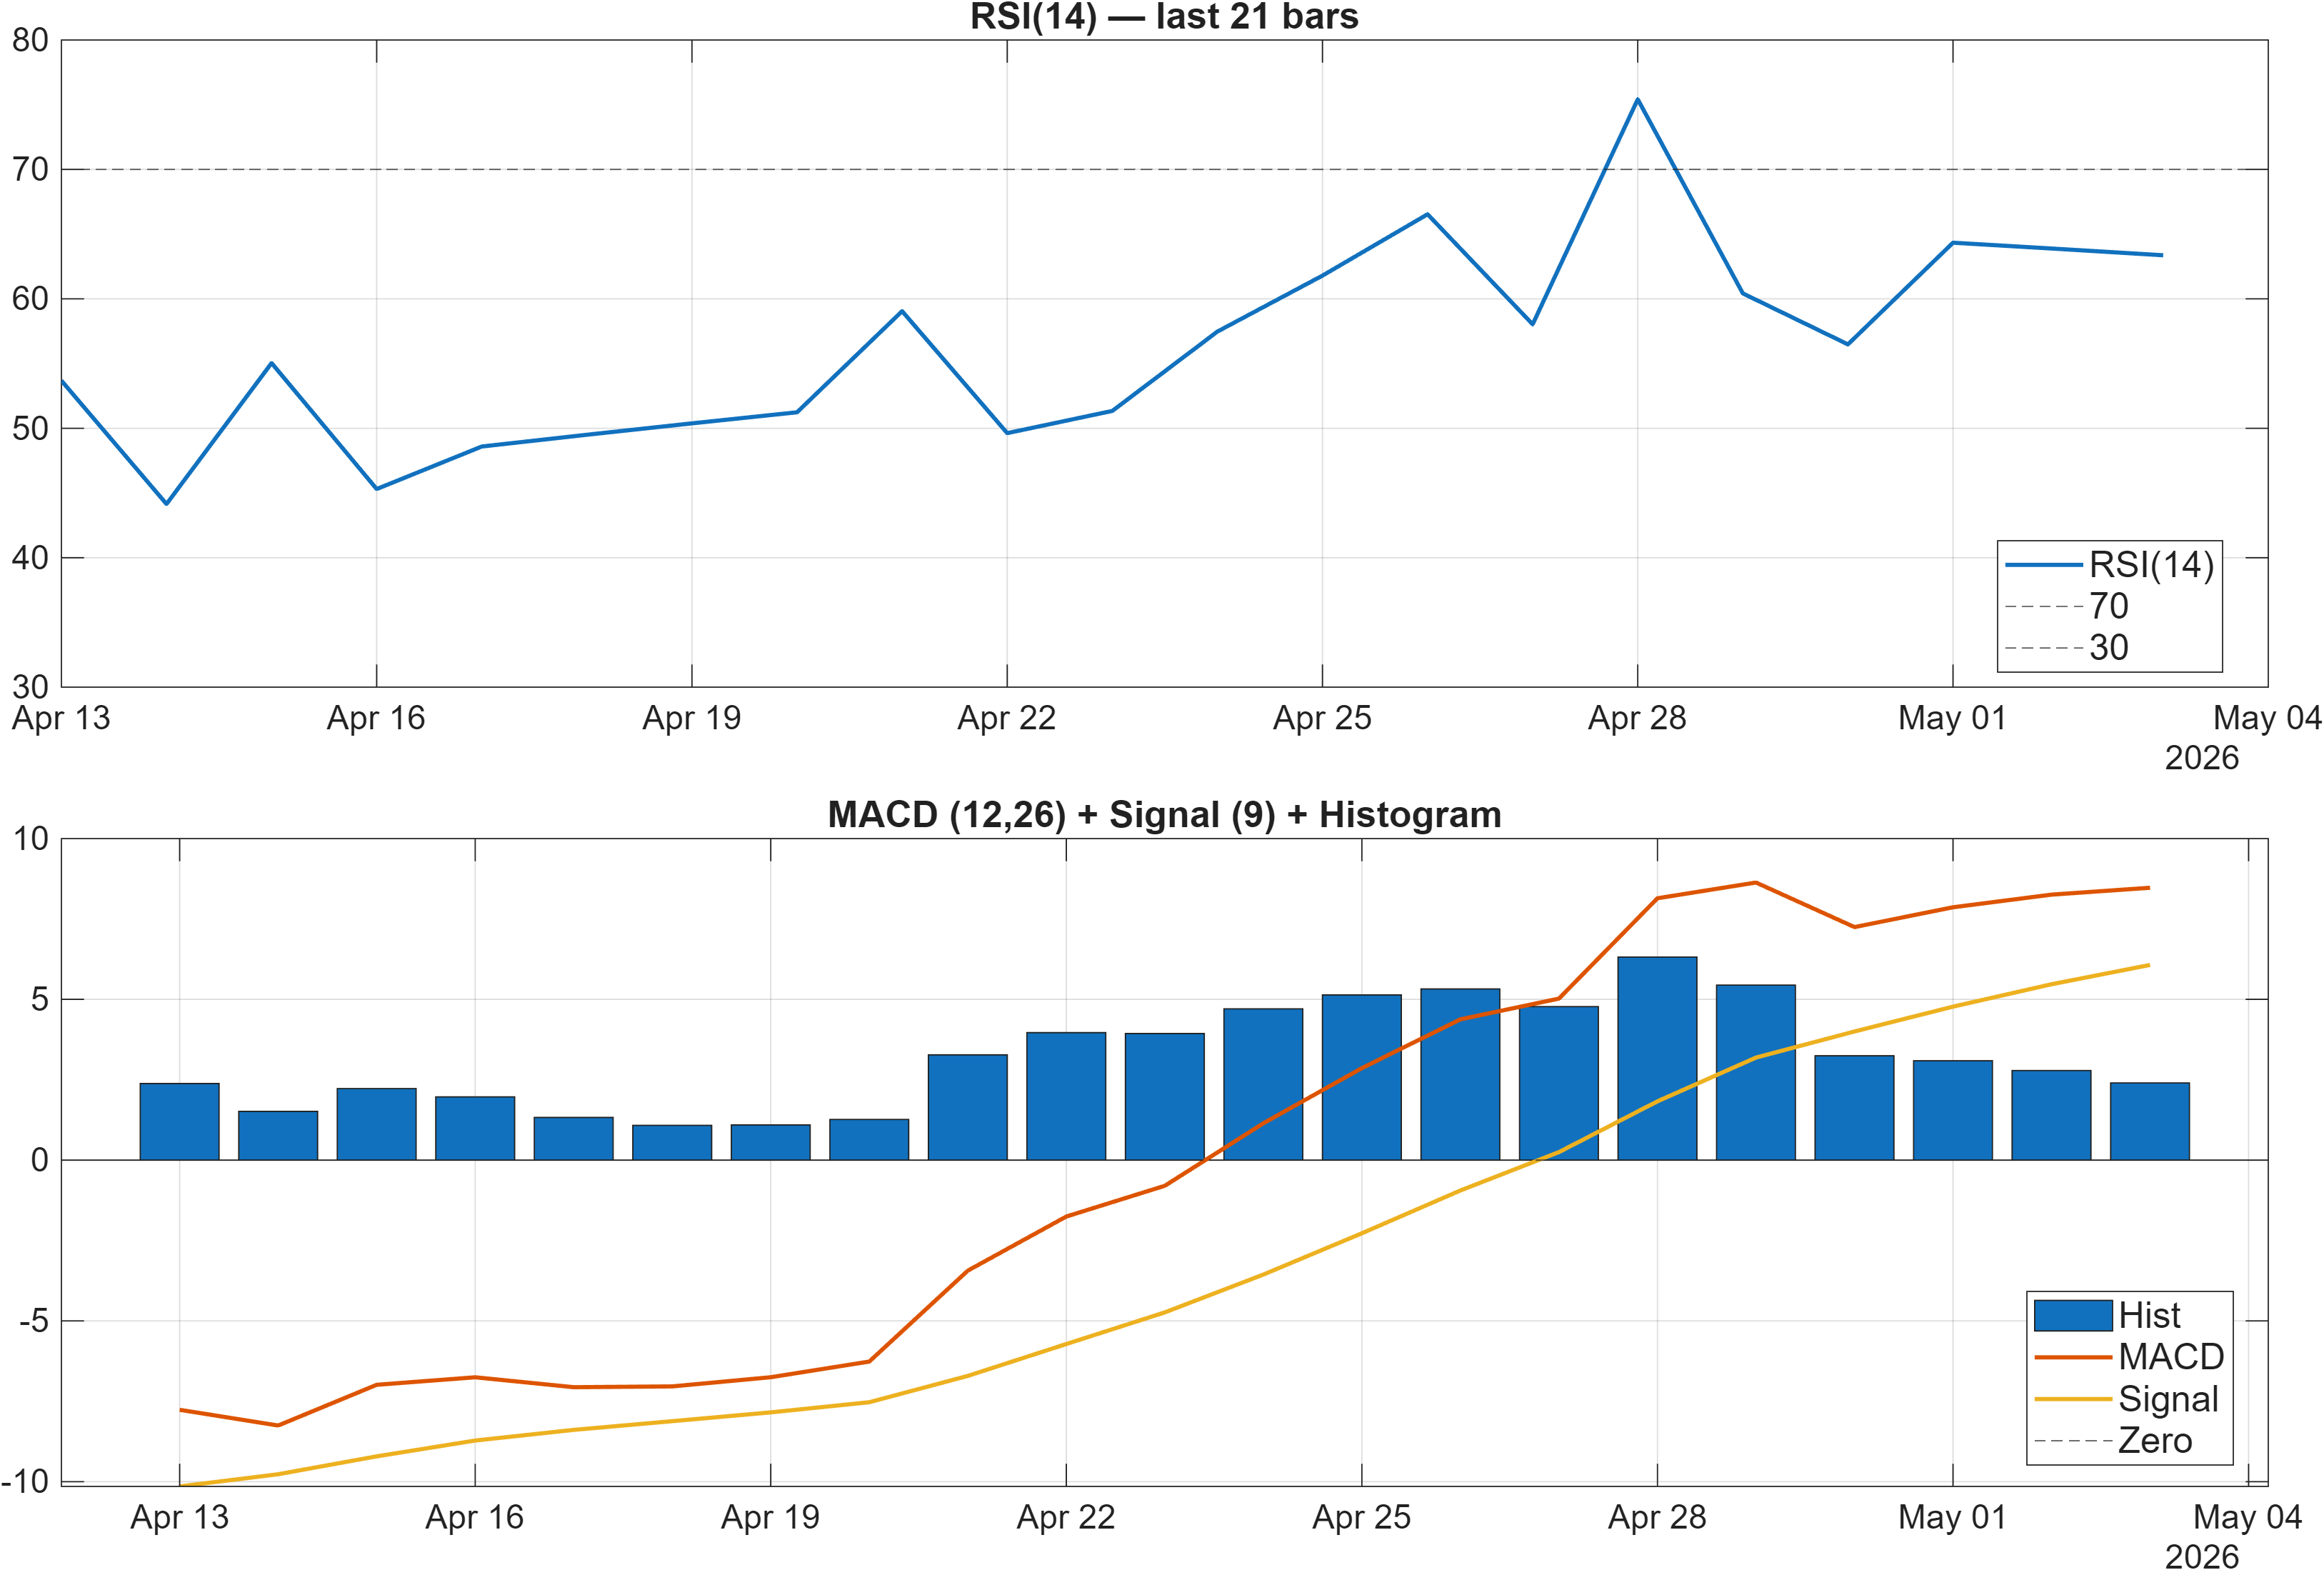
Interpretation: RSI bias = Bullish, MACD hist = 2.4004.
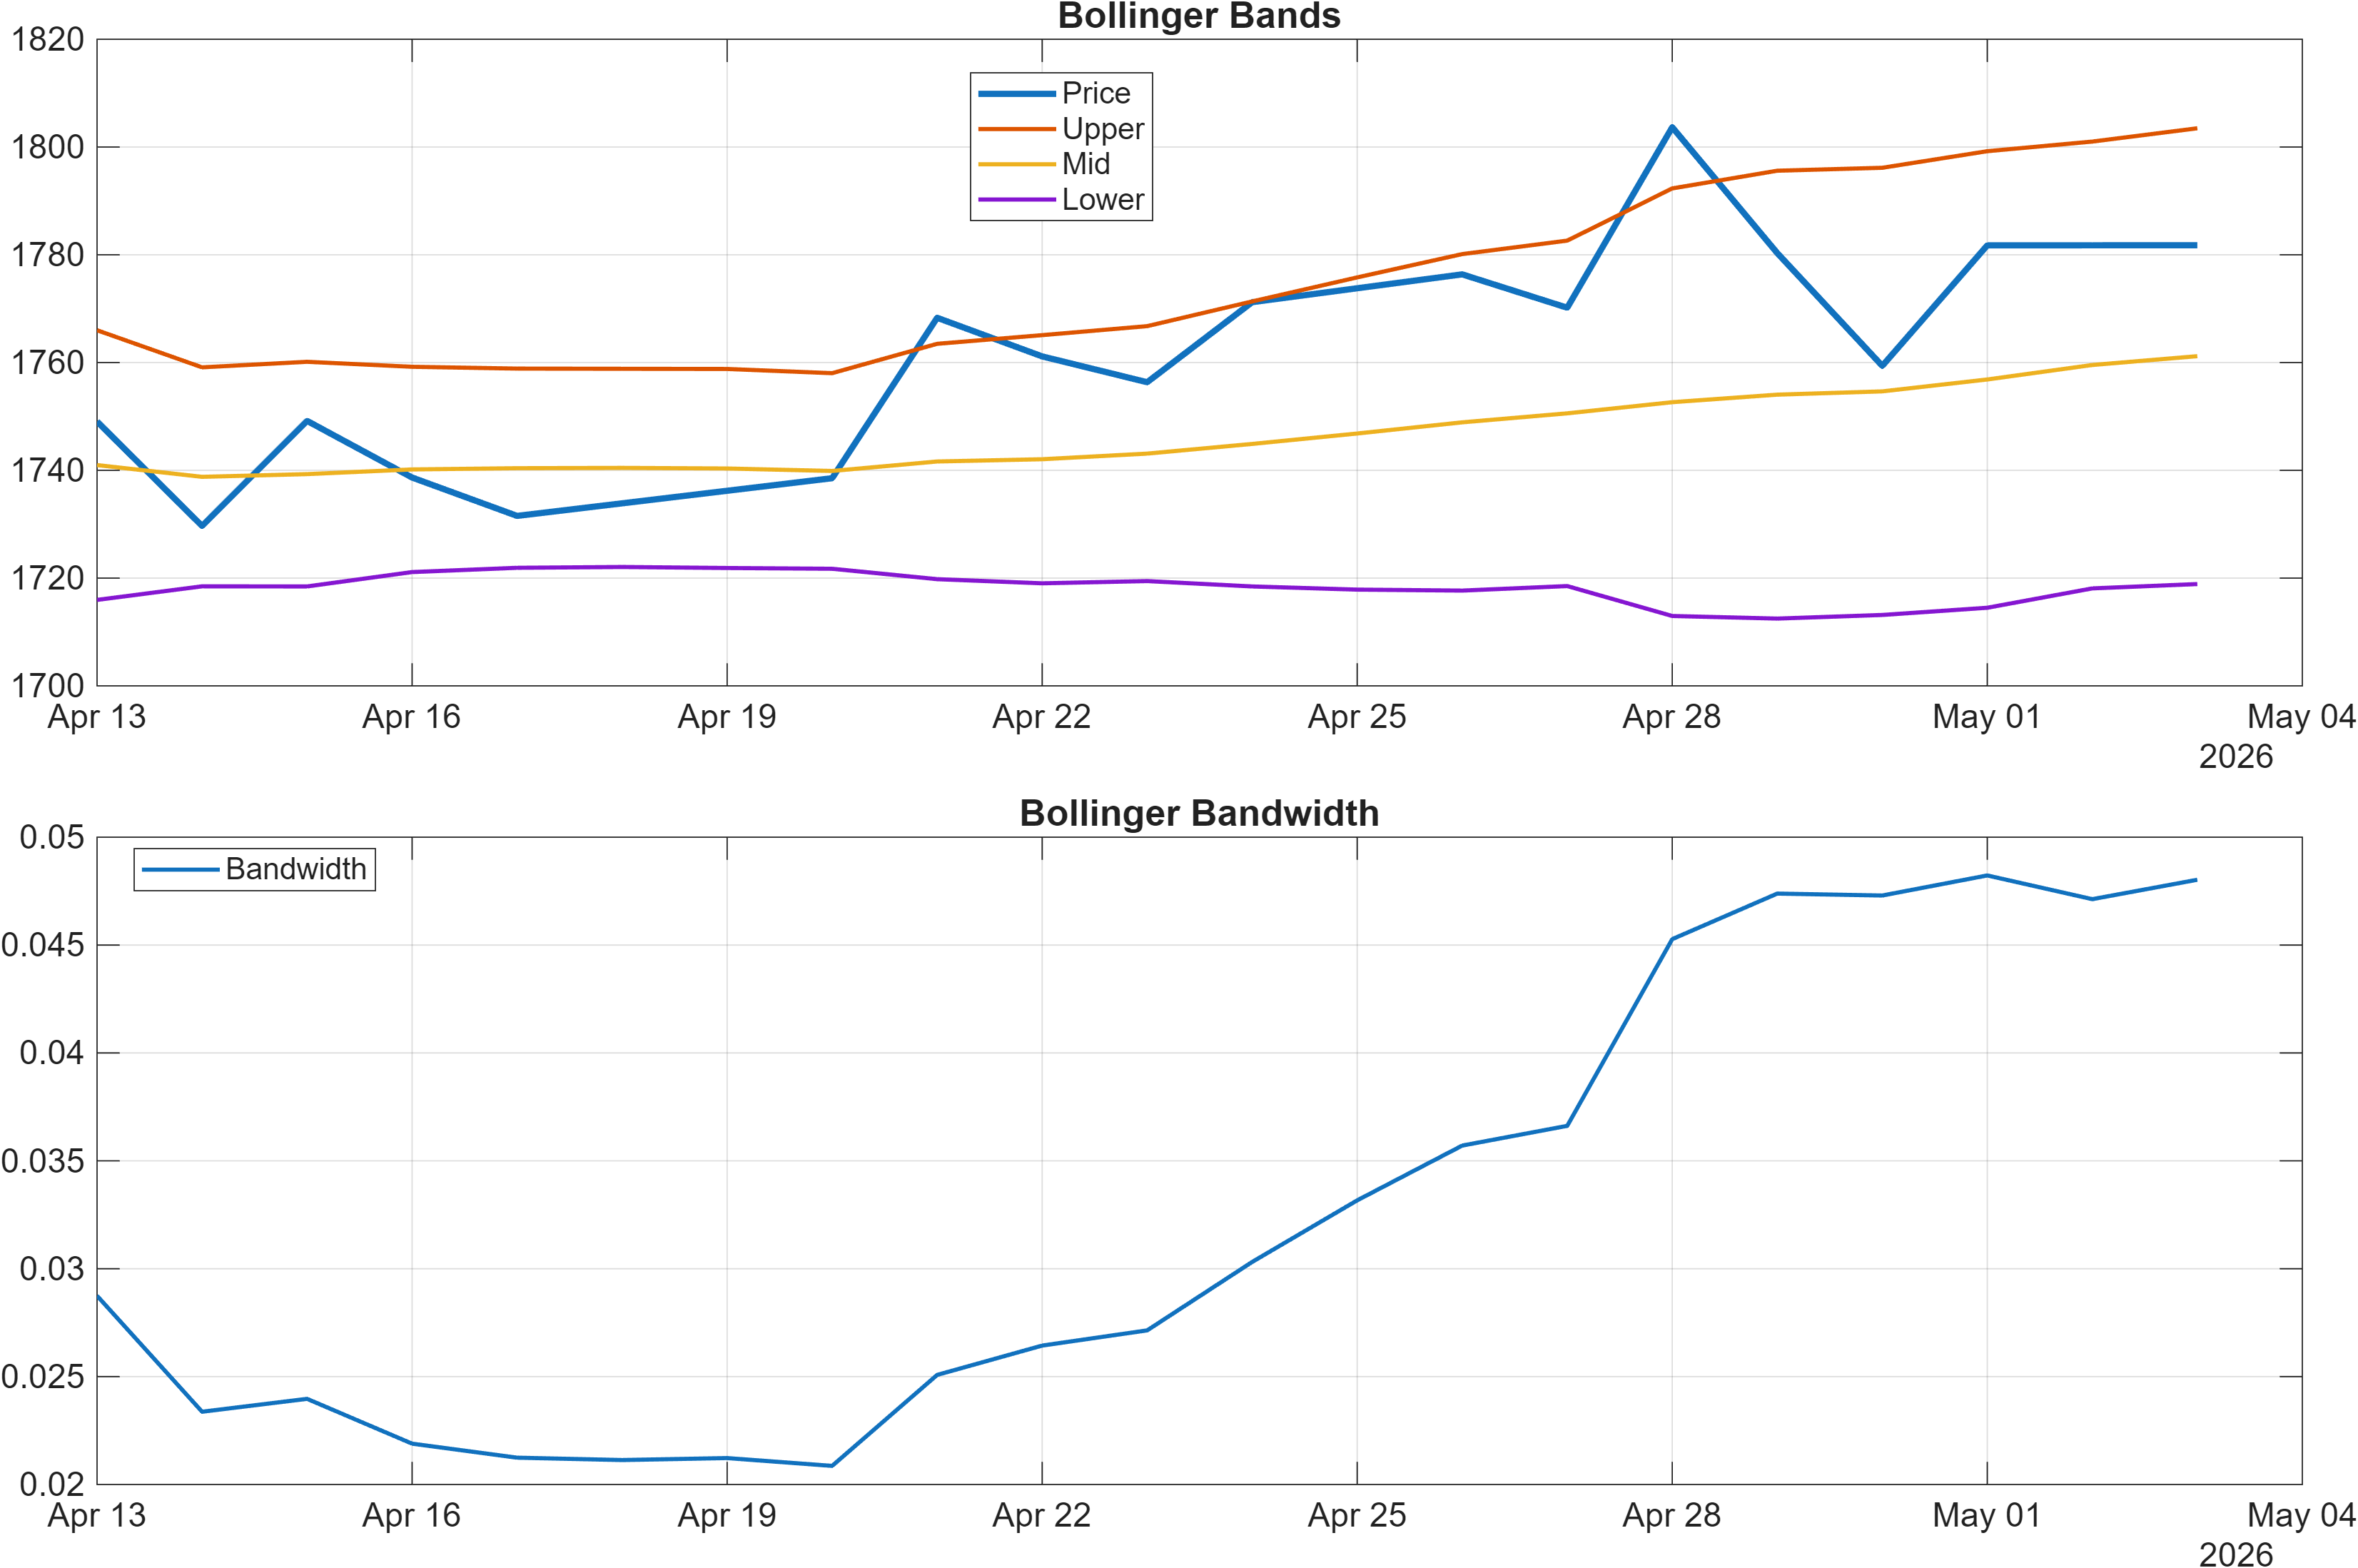
Interpretation: Bandwidth (volatility regime) latest = 0.0480.
Momentum metrics are broadly consistent with the bullish rank posture, but they also suggest a market that is advancing without obvious volatility stress. RSI(14) at 63.37 sits in the constructive zone: elevated enough to confirm positive momentum, but not so extreme that it automatically implies a late-stage move. In parallel, the MACD histogram at 2.4004 supports the idea that upside impulse remains present rather than fading into a flat, low-energy drift.
Volatility adds a second, different lens. Bollinger bandwidth at 0.0480 points to a relatively contained regime. When bandwidth is not expanding aggressively, trend continuation frequently depends less on breakout velocity and more on persistence—a sequence of higher closes and controlled pullbacks that respect nearby support. This profile tends to reward level-based decision-making (Section 4) and de-emphasize “chasing” moves far from support.
The key analytical tension is that constructive momentum can coexist with longer-term structural drag from the moving averages (close vs MA50 bullish, MA50 vs MA200 bearish). In such cases, momentum indicators often act as timing tools rather than regime tools: if RSI holds its bullish bias while price remains above the support band near 1721.3909, the probability-weighted interpretation favors continuation attempts toward 1804.2695. Conversely, if momentum rolls over while price tests support, the mixed trend state can reassert itself quickly.
Net: the dashboard currently reads as “momentum supportive, volatility controlled,” which is compatible with the bullish technical confluence score (0.333) and the bullish blended technical score (0.376) in Section 5—while leaving room for rapid repricing should the market lose level integrity.
4) Support / Resistance zones
Support ~ 1721.3909 | Resistance ~ 1804.2695
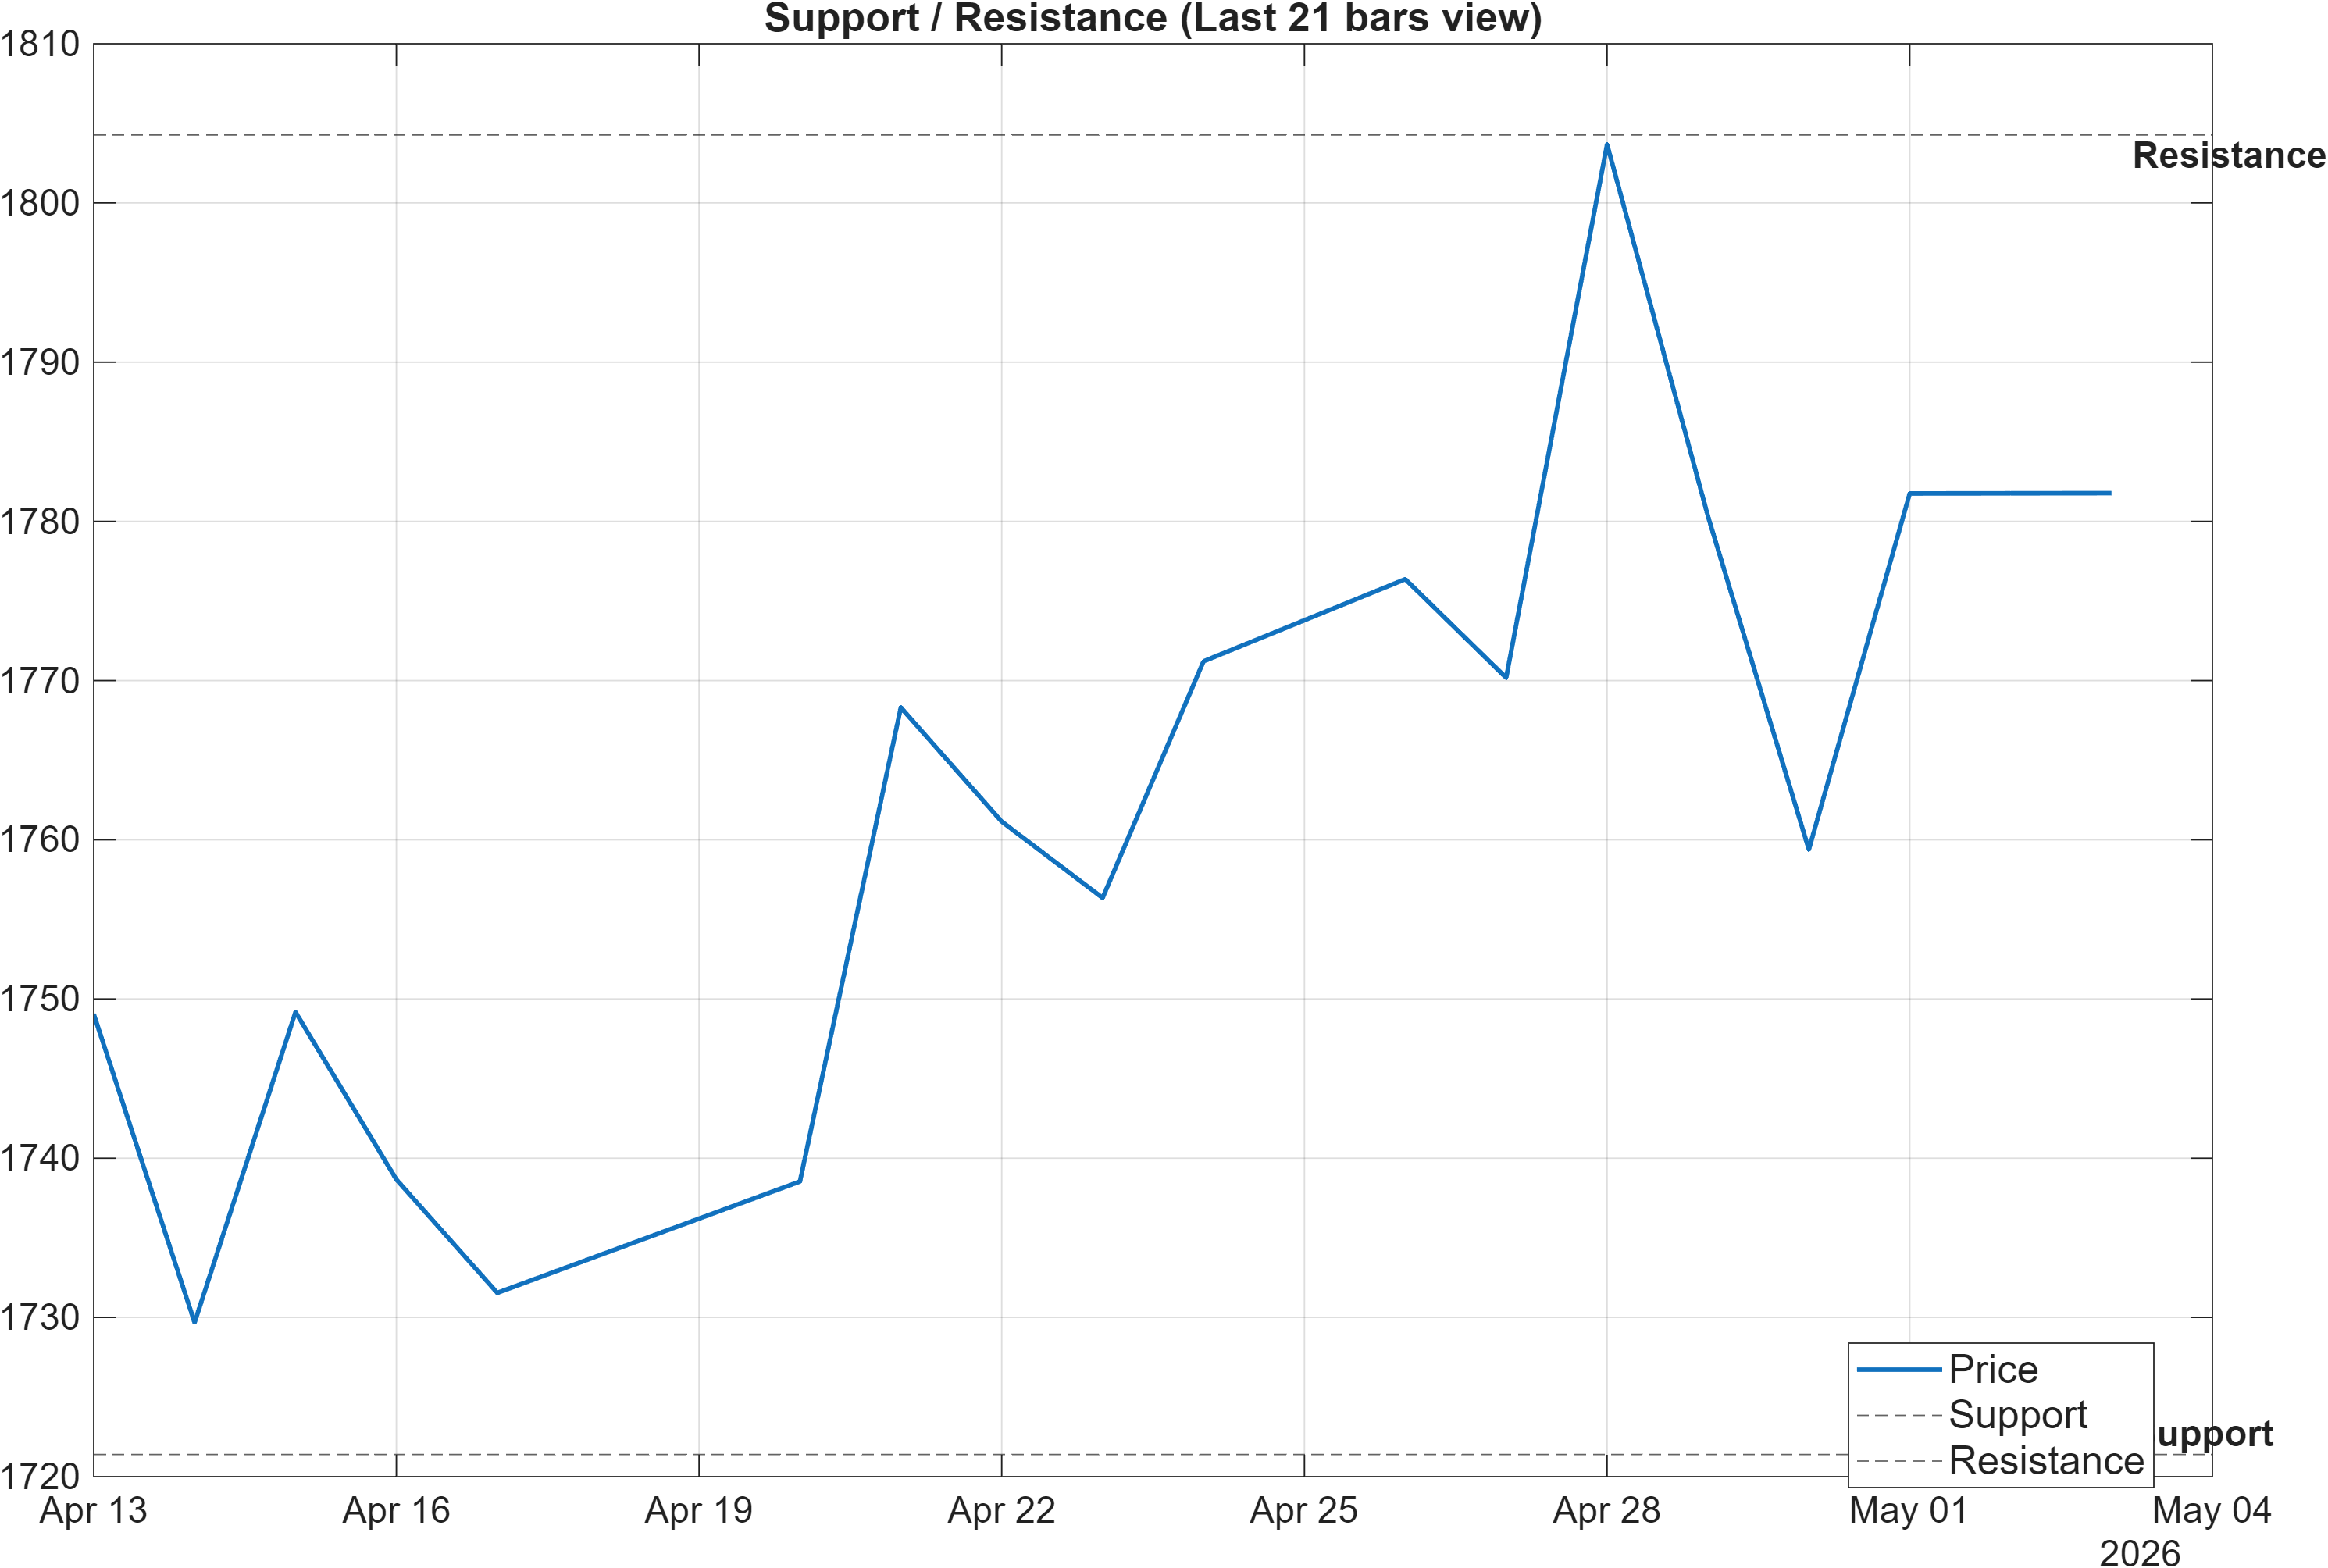
Scenario view: Break above resistance with volume → continuation. Close below support → signal deterioration risk.
The support/resistance map defines the report’s primary decision framework. With support near 1721.3909 and resistance near 1804.2695, CHFARS is effectively being evaluated between two probabilistic “gates”: support acts as the invalidation line for the bullish evidence stack, while resistance is the level that must be absorbed to validate continuation conditions.
This section interacts directly with the mixed trend structure in Section 2. A market can trade above its MA50 and still struggle to transition into a cleaner uptrend if it repeatedly fails at resistance. In that sense, 1804.2695 is not only a price ceiling; it is a test of whether the shorter-term bullish behavior can overcome the longer-term headwind implied by MA50 vs MA200 being bearish.
The moderate volatility regime (bandwidth 0.0480) argues that the most informative signal may be acceptance rather than momentary wicks: sustained trade above resistance would better align with bullish ranks (weekly/monthly #5) and with momentum confirmation (RSI(14) 63.37; MACD histogram 2.4004). By contrast, a close below 1721.3909 would conflict with the bullish rank stack and would likely force a reassessment of whether the 18-signal confluence (0.333 bullish) is describing a fading move.
Tactically, these zones also contextualize the “neutral-heavy” signal distribution in Section 5 (Bull 7 / Bear 1 / Neutral 10). When many indicators are neutral, markets often become level-driven: the next large informational update comes from how price behaves at well-defined boundaries rather than from additional oscillator escalation.
5) Quant Technical Dashboard (18 Signals)
KGNAI AI Technical Analysis Score (Deep Reinforcement Learning): Rank #253 out of 963 (Rank 1 represents the strongest technical positioning and a higher probability of favorable price behavior. As ranks increase toward the maximum, the probability of favorable outcomes weakens and bearish positioning becomes more dominant.) | Label: Neutral | Score: 0.475
18-Signal Technical Confluence Score: 0.333 (Bullish)
Overall Technical Score (18-signal confluence + DRL rank blend): 0.376 (Bullish)
Note: The blended score reflects signal strength weighted against broader AI technical ranking, which may temporarily diverge.
Blended technical score breakdown: 0.376 (Bullish | Bull 7 / Bear 1 / Neutral 10)
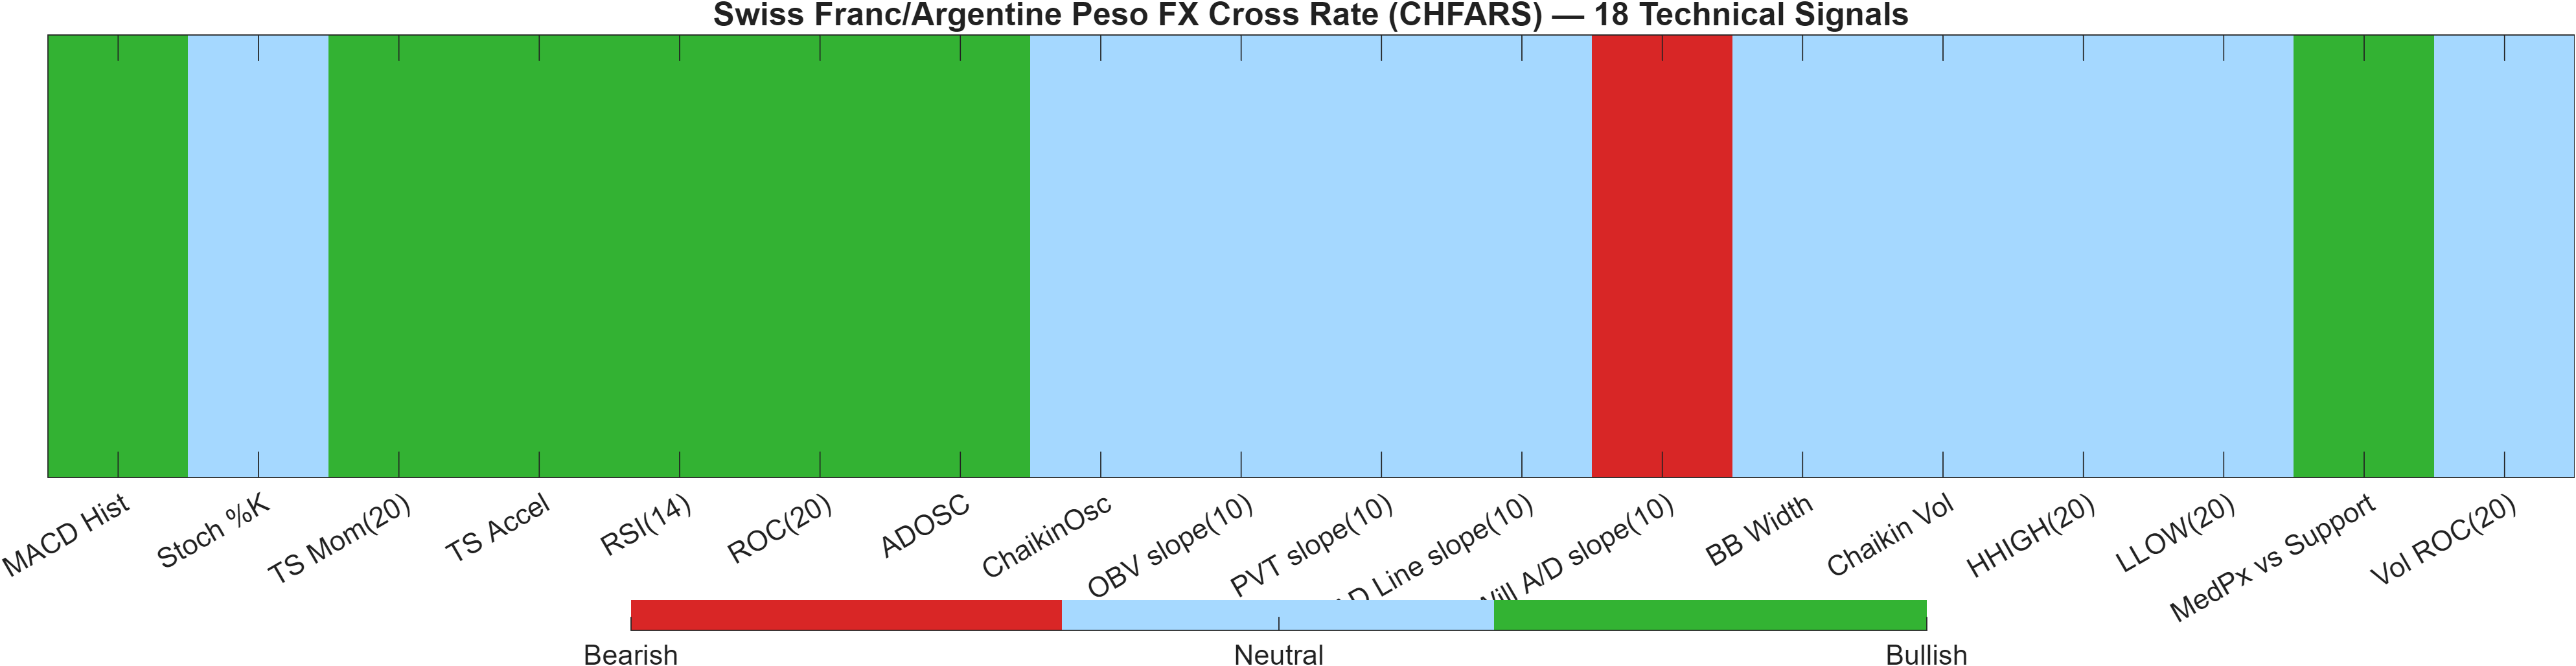
Signal posture: Bullish Neutral Bearish
Signal table (Bull/Bear/Neutral)
| Indicator | Value | Signal |
|---|---|---|
| MACD Hist | 2.4 | Bullish |
| Stoch %K | 53.62 | Neutral |
| TS Mom(20) | 52.07 | Bullish |
| TS Accel | 61.51 | Bullish |
| RSI(14) | 63.37 | Bullish |
| ROC(20) | 3.012 | Bullish |
| ADOSC | 51.24 | Bullish |
| ChaikinOsc | 0 | Neutral |
| OBV slope(10) | 0 | Neutral |
| PVT slope(10) | 0 | Neutral |
| AD Line slope(10) | 0 | Neutral |
| Will A/D slope(10) | -2.272 | Bearish |
| BB Width | 0.04803 | Neutral |
| Chaikin Vol | -24.3 | Neutral |
| HHIGH(20) | 1805 | Neutral |
| LLOW(20) | 1718 | Neutral |
| MedPx vs Support | 60.42 | Bullish |
| Vol ROC(20) | — | Neutral |
Interpretation: Indicator-level signals form the base confluence, which is then adjusted using a separate AI-driven technical ranking model. The final technical score summarizes this combined view.
The technical dashboard is best read as a compression story: many components are neutral (10 out of 18), while the bullish group is meaningful (7) and the bearish group is minimal (1). That distribution tends to occur when a market is trending, but without broad-based participation across every indicator family—often a sign that directional bias exists while conviction is still being “earned” through follow-through at levels.
The confluence score is 0.333 (Bullish), and the blended overall technical score is 0.376 (Bullish). Those two figures place the base indicator read in constructive territory, even after the blend incorporates the more cautious DRL technical rank of #253 (Neutral, score 0.475). This divergence is analytically useful: it flags that while classical/quant indicator evidence leans positive (e.g., RSI(14) 63.37 and MACD histogram 2.4 are bullish in the signal table), the pattern-recognition style model is not confirming a top-tier technical state.
In practical signal terms, that is consistent with what the trend section already implied (close vs MA50 bullish, but MA50 vs MA200 bearish). A market can produce bullish oscillator and momentum reads while still not meeting the threshold for strongest trend-quality classification across a large universe.
The constructive interpretation remains valid so long as the bullish evidence translates into behavior around the defined zones: resilience above 1721.3909 and improving acceptance nearer 1804.2695. If the market slips below support, the current “bullish-but-not-fully-confirmed” state implied by DRL rank #253 becomes more relevant than the confluence score.
6) News sentiment + extractive gist
Note: Instrument-specific news matches were not found, so the digest includes broader market/sector headlines. Links are provided for verification.
Sentiment score (avg): 0.095 | Positive: 44% | Neutral: 44% | Negative: 12%
KGNAI AI News Sentiment Score (normalized -1 to +1): Not available (as of —) | Label: Not available | Overall news score: 0.09
Positive Developments
Recent coverage across major financial outlets indicates a modestly constructive macro tone within parts of the G10 complex, driven by pockets of manufacturing resilience and incremental risk-on positioning in select FX pairs. In the provided dataset, the news mix skews slightly positive (44% positive; sentiment average 0.095), which is consistent with a background where momentum trades can persist without immediate risk-off interruption. References to stronger headline manufacturing readings and improving order components support the idea that activity is not uniformly deteriorating, even if some commentary qualifies the durability of demand. For CHFARS specifically, this backdrop does not function as a direct catalyst (instrument-specific matches are not available), but it can still influence cross-asset risk conditions and USD-directional dynamics that FX crosses often inherit indirectly. In that context, a mildly positive news balance can be viewed as a supportive bias for trend-following behavior—conditional on price holding above key support (1721.3909) and momentum remaining constructive (RSI(14) 63.37).
Neutral / Mixed Developments
The central tendency of the news set is neutral as well (44% neutral; overall news score 0.09), reflecting a market narrative that is not cleanly one-directional. Several items point to routine repricing in broad USD measures and mixed signals across major pairs, which typically translates into range-to-trend transitions rather than persistent directional conviction. For CHFARS, this matters because the technical state already contains a built-in ambiguity: the short-term trend filter is positive (close vs MA50 bullish) while the longer filter is still negative (MA50 vs MA200 bearish). A neutral news regime tends to amplify the importance of technical acceptance at levels—especially resistance near 1804.2695—because macro headlines are less likely to provide decisive, sustained follow-through on their own. The normalized KGNAI news sentiment score is Not available in the provided data, so the sentiment read is limited to the summary distribution and average.
Negative / Risk Signals
Risk signals in the provided news set center on policy uncertainty and trade/tariff headlines, alongside renewed concern about inflation persistence and central bank reaction functions. Even with only 12% negative classification, these themes can have outsized impact in FX by altering rate expectations and volatility conditions. For CHFARS, the key risk is not a single headline, but the possibility that uncertainty triggers risk compression followed by abrupt repricing—particularly relevant when the market is technically constructive but not fully confirmed (DRL technical rank #253, Neutral). If risk narratives intensify, level behavior becomes critical: a break below 1721.3909 would align with the “deterioration risk” scenario and could shift the technical interpretation from trend persistence to regime fragility. Conversely, if the market absorbs risk headlines while maintaining RSI strength (63.37) and stable volatility (bandwidth 0.0480), negative news tone may remain more of a background variable than a driver.
- Whether CHFARS can sustain acceptance near/above 1804.2695 while momentum remains constructive (MACD histogram 2.4004).
- Any volatility regime change away from bandwidth 0.0480, which would alter breakout reliability.
- Macro-policy uncertainty that could pressure risk conditions and increase the odds of a support test at 1721.3909.
Sources referenced: Reuters, Bloomberg, Yahoo Finance, MarketWatch, Investing.com
Snapshot: AI Rank (Short–Mid–Long): Bullish (Bullish–Bullish–Bullish) · Technical Confluence: Bullish · Key Levels: Support ~1721.39 | Resistance ~1804.27 · News Sentiment: Neutral
7) Sources
- AUD/USD Price Forecast: Remains bullish despite hovering around 0.7200 — https://www.fxstreet.com/news/aud-usd-price-forecast-remains-bullish-despite-hovering-around-07200-202605011949
- US Dollar Index rebounds from two-week lows as as tariff tensions resurface — https://www.fxstreet.com/news/us-dollar-index-rebounds-from-two-week-lows-as-as-tariff-tensions-resurface-202605011836
- USD/CAD steadies as weekly slide extends on Loonie strength — https://www.fxstreet.com/news/usd-cad-steadies-as-weekly-slide-extends-on-loonie-strength-202605011807
- EUR/USD trims gains as fresh Trump tariff threats, Iran woes lift USD — https://www.fxstreet.com/news/eur-usd-trims-gains-as-fresh-trump-tariff-threats-iran-woes-lift-usd-202605011801
- Gold extends rally as Japan intervention hammers US Dollar — https://www.fxstreet.com/news/gold-extends-rally-as-japan-intervention-hammers-us-dollar-202605011743
- Dow Jones Industrial Average futures hold near 50K as Iran offer offsets tariff noise — https://www.fxstreet.com/news/dow-jones-industrial-average-futures-hold-near-50k-as-iran-offer-offsets-tariff-noise-202605011656
- Forecasting the upcoming week: Nonfarm Payrolls, US-Iran peace talks on focus as DXY hits two-week lows — https://www.fxstreet.com/news/forecasting-the-upcoming-week-nonfarm-payrolls-us-iran-peace-talks-on-focus-as-dxy-hits-two-week-lows-202605011653
- US President Trump: I will be increasing tariffs on vehicles imported from the European Union — https://www.fxstreet.com/news/us-president-trump-i-will-be-increasing-tariffs-on-vehicles-imported-from-the-european-union-202605011632
You may also like: How KGNAI AI ranks instruments across global markets
Disclaimer: KGNAI provides AI-generated analytics and educational market commentary only. This is not financial advice. Markets involve risk. Always do your own research.