
ZMW/JPY (ZMWJPY) Technical Outlook — 06-May-2026 | Short-term bearish ranks with neutral confluence
KGNAI Signal + Technical Snapshot + News Sentiment Digest
As of: 06-May-2026
Ticker: ZMWJPY
ZMW/JPY (ZMWJPY) currently shows a cross-horizon disagreement: the near-term KGNAI ranks sit deep in the weaker tail of the 957-instrument universe (daily and weekly bearish), while the 3-month horizon stands out as an upper-tier outlier. Technically, the picture is compressed rather than directional—a neutral 18-signal confluence (0.056) and a neutral blended technical score (-0.183) contrast with a bearish DRL technical rank (#832) and a negative MACD histogram (-0.0096). Volatility is not elevated (Bollinger bandwidth latest 0.0224), which tends to increase the importance of nearby decision zones. That puts focus on the defined range: support ~8.0360 and resistance ~8.4380. News sentiment in the digest skews constructive (0.187 average; 44% positive, 6% negative), but it is not instrument-specific, so it should be treated as contextual bias rather than a direct driver.
- Rank stance (Short / Mid / Long): Bearish (Bearish / Bearish / Bearish)
- Technical confluence label: Neutral (18-signal confluence 0.056; blended -0.183)
- Key levels: Support 8.0360 | Resistance 8.4380
- News sentiment bias: Positive (avg 0.187; 44% positive / 6% negative)
- Confirmation / invalidation condition: A sustained close below 8.0360 increases deterioration risk; a break above 8.4380 supports continuation per the scenario view.
KGNAI evaluates assets using large cross-sectional datasets built from millions of structured data points. Inputs incorporate fundamental metrics, technical structures, and systematically processed news sentiment. Statistical models, machine learning, and AI frameworks are used to assess relative positioning, signal alignment, and probabilistic behavior across broad universes.
- Ranks are comparative across the tracked universe, not absolute price targets.
- Confluence reflects alignment among independent signal groups.
- Support/resistance levels are probabilistic decision zones, not guarantees.
- Sentiment provides contextual bias within the broader analytical framework.
1) KGNAI AI Analysis
Region: FOREX
Total universe size: 957 ranked instruments
- Daily rank: #928 out of 957 — Bearish
- Weekly rank: #919 out of 957 — Bearish
- Monthly rank: #877 out of 957 — Bearish
- 3-Monthly rank: #23 out of 957 — Bullish
- 6-Monthly rank: Not available for this horizon — Not available
- Yearly rank: #891 out of 957 — Bearish
Cross-horizon regime tension
The rank structure is not internally consistent, which is often where interpretation matters more than any single horizon. Daily and weekly ranks (#928 and #919) sit in the weakest slice of the universe, reinforcing a short-term posture that remains Bearish. The monthly and yearly ranks (#877 and #891) extend that weakness into longer evaluation windows, implying that the broader comparative footprint is still challenged.
The key exception is the 3-month rank at #23, which is a sharp positive outlier relative to the rest of the curve. Rather than treating this as a clean reversal signal, a more disciplined read is that ZMWJPY is experiencing a timing mismatch: the medium window appears historically favorable in the model’s peer-relative tests, while the most recent windows still score poorly. This profile commonly aligns with markets that are attempting to stabilize after weakness but have not yet produced enough confirming evidence in near-term behavior to lift the shorter ranks.
The practical implication for this report is to rely more heavily on technical confirmation at key levels (Section 4) and on whether momentum/volatility begin to expand (Section 3). The 6-month horizon is Not available in the provided data. As a reminder, KGNAI ranks are cross-sectional: they describe positioning versus 957 instruments rather than offering standalone direction.
2) Price & trend overview
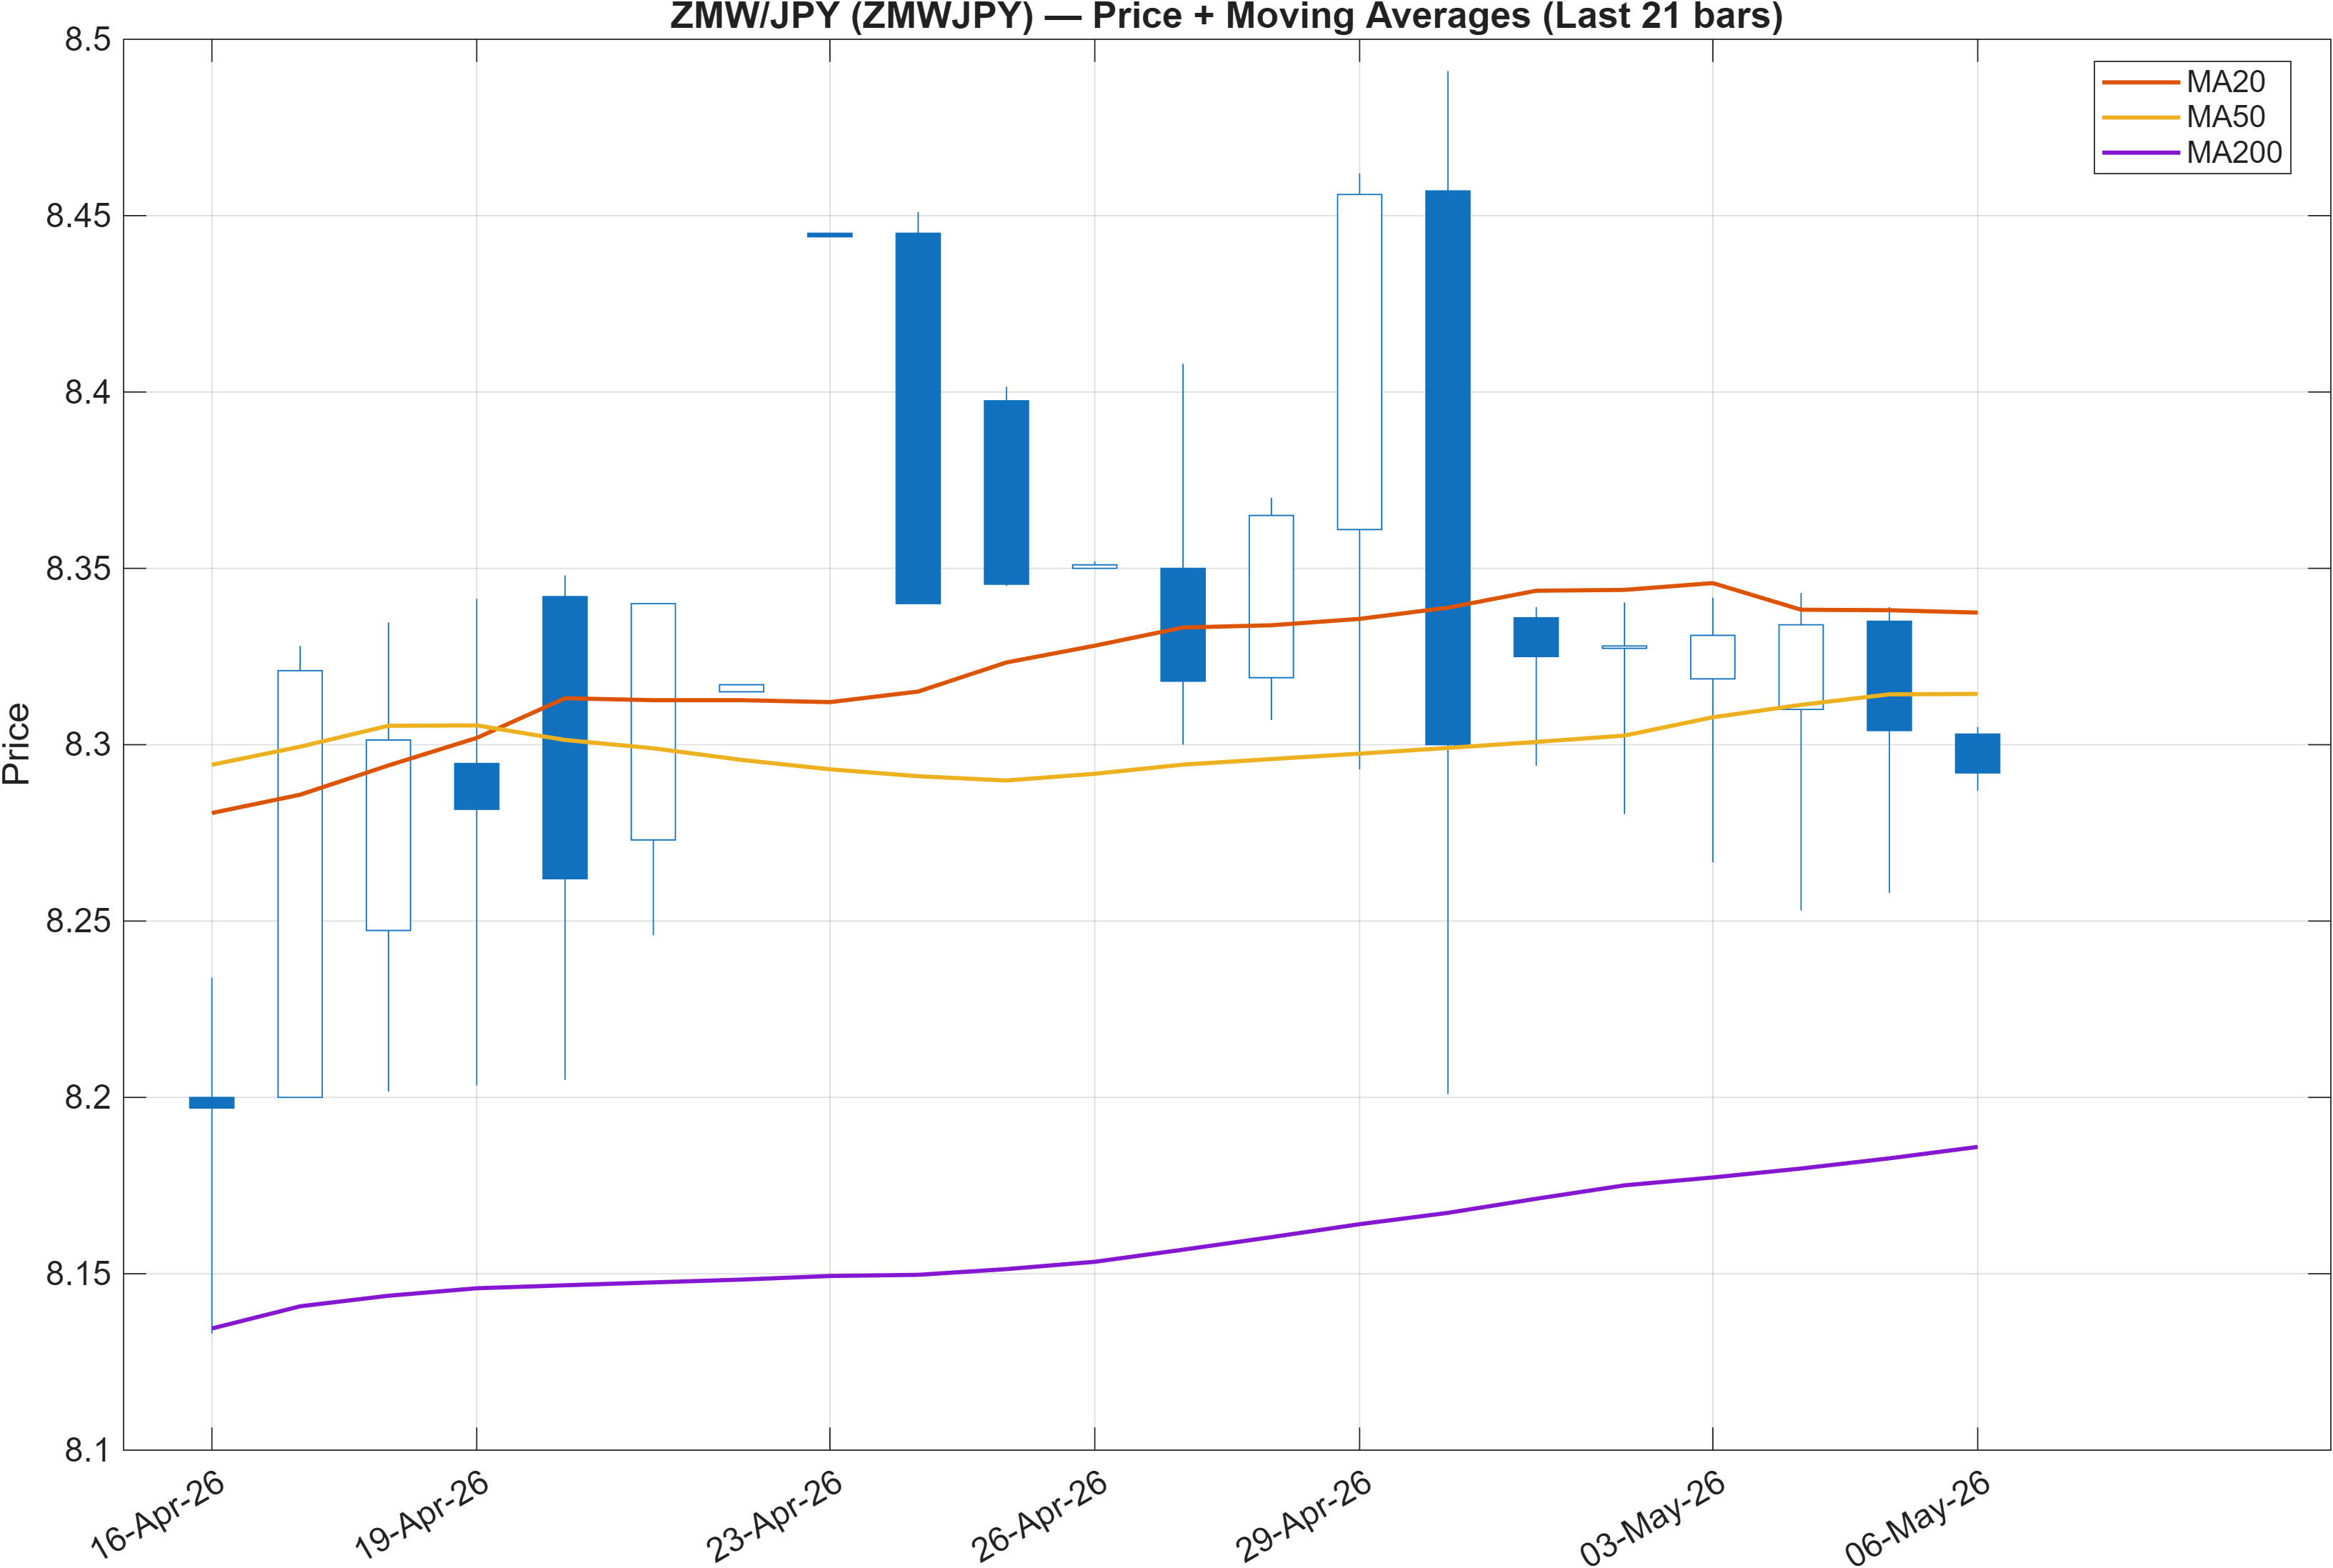
Mixed moving-average structure: local weakness inside a broader cross
The trend read is explicitly split: Close vs MA50 = Bearish, while MA50 vs MA200 = Bullish. This combination often describes a market that is pulling back within a larger, still-positive moving-average alignment. In other words, the longer baseline implied by the MA50/MA200 relationship has not fully rolled over, but the more recent price position relative to MA50 signals that short-term control is not with buyers.
That split aligns with the ranking tension seen earlier: short horizons are weak (daily #928, weekly #919), while a medium window is unusually strong (3-month #23). When those two layers coincide, the analytical focus shifts from “trend-following” to “trend verification.” Specifically, without a clear reclaim of the MA50, the MA50/MA200 bullish cross can behave more like latent support than active trend propulsion.
Trend diagnostics also need to be evaluated alongside volatility: with Bollinger bandwidth at 0.0224 (Section 3), price can oscillate around moving averages without producing durable follow-through. This favors a level-based framework: the moving averages provide structure, but the actionable decision points are more cleanly expressed through the nearby support/resistance zones (8.0360 and 8.4380). If price remains below MA50 while approaching resistance, rallies can behave as tests rather than breakouts; conversely, stabilization above MA50 would better reconcile the bullish MA50/MA200 relationship with short-term behavior.
3) Momentum & volatility dashboard
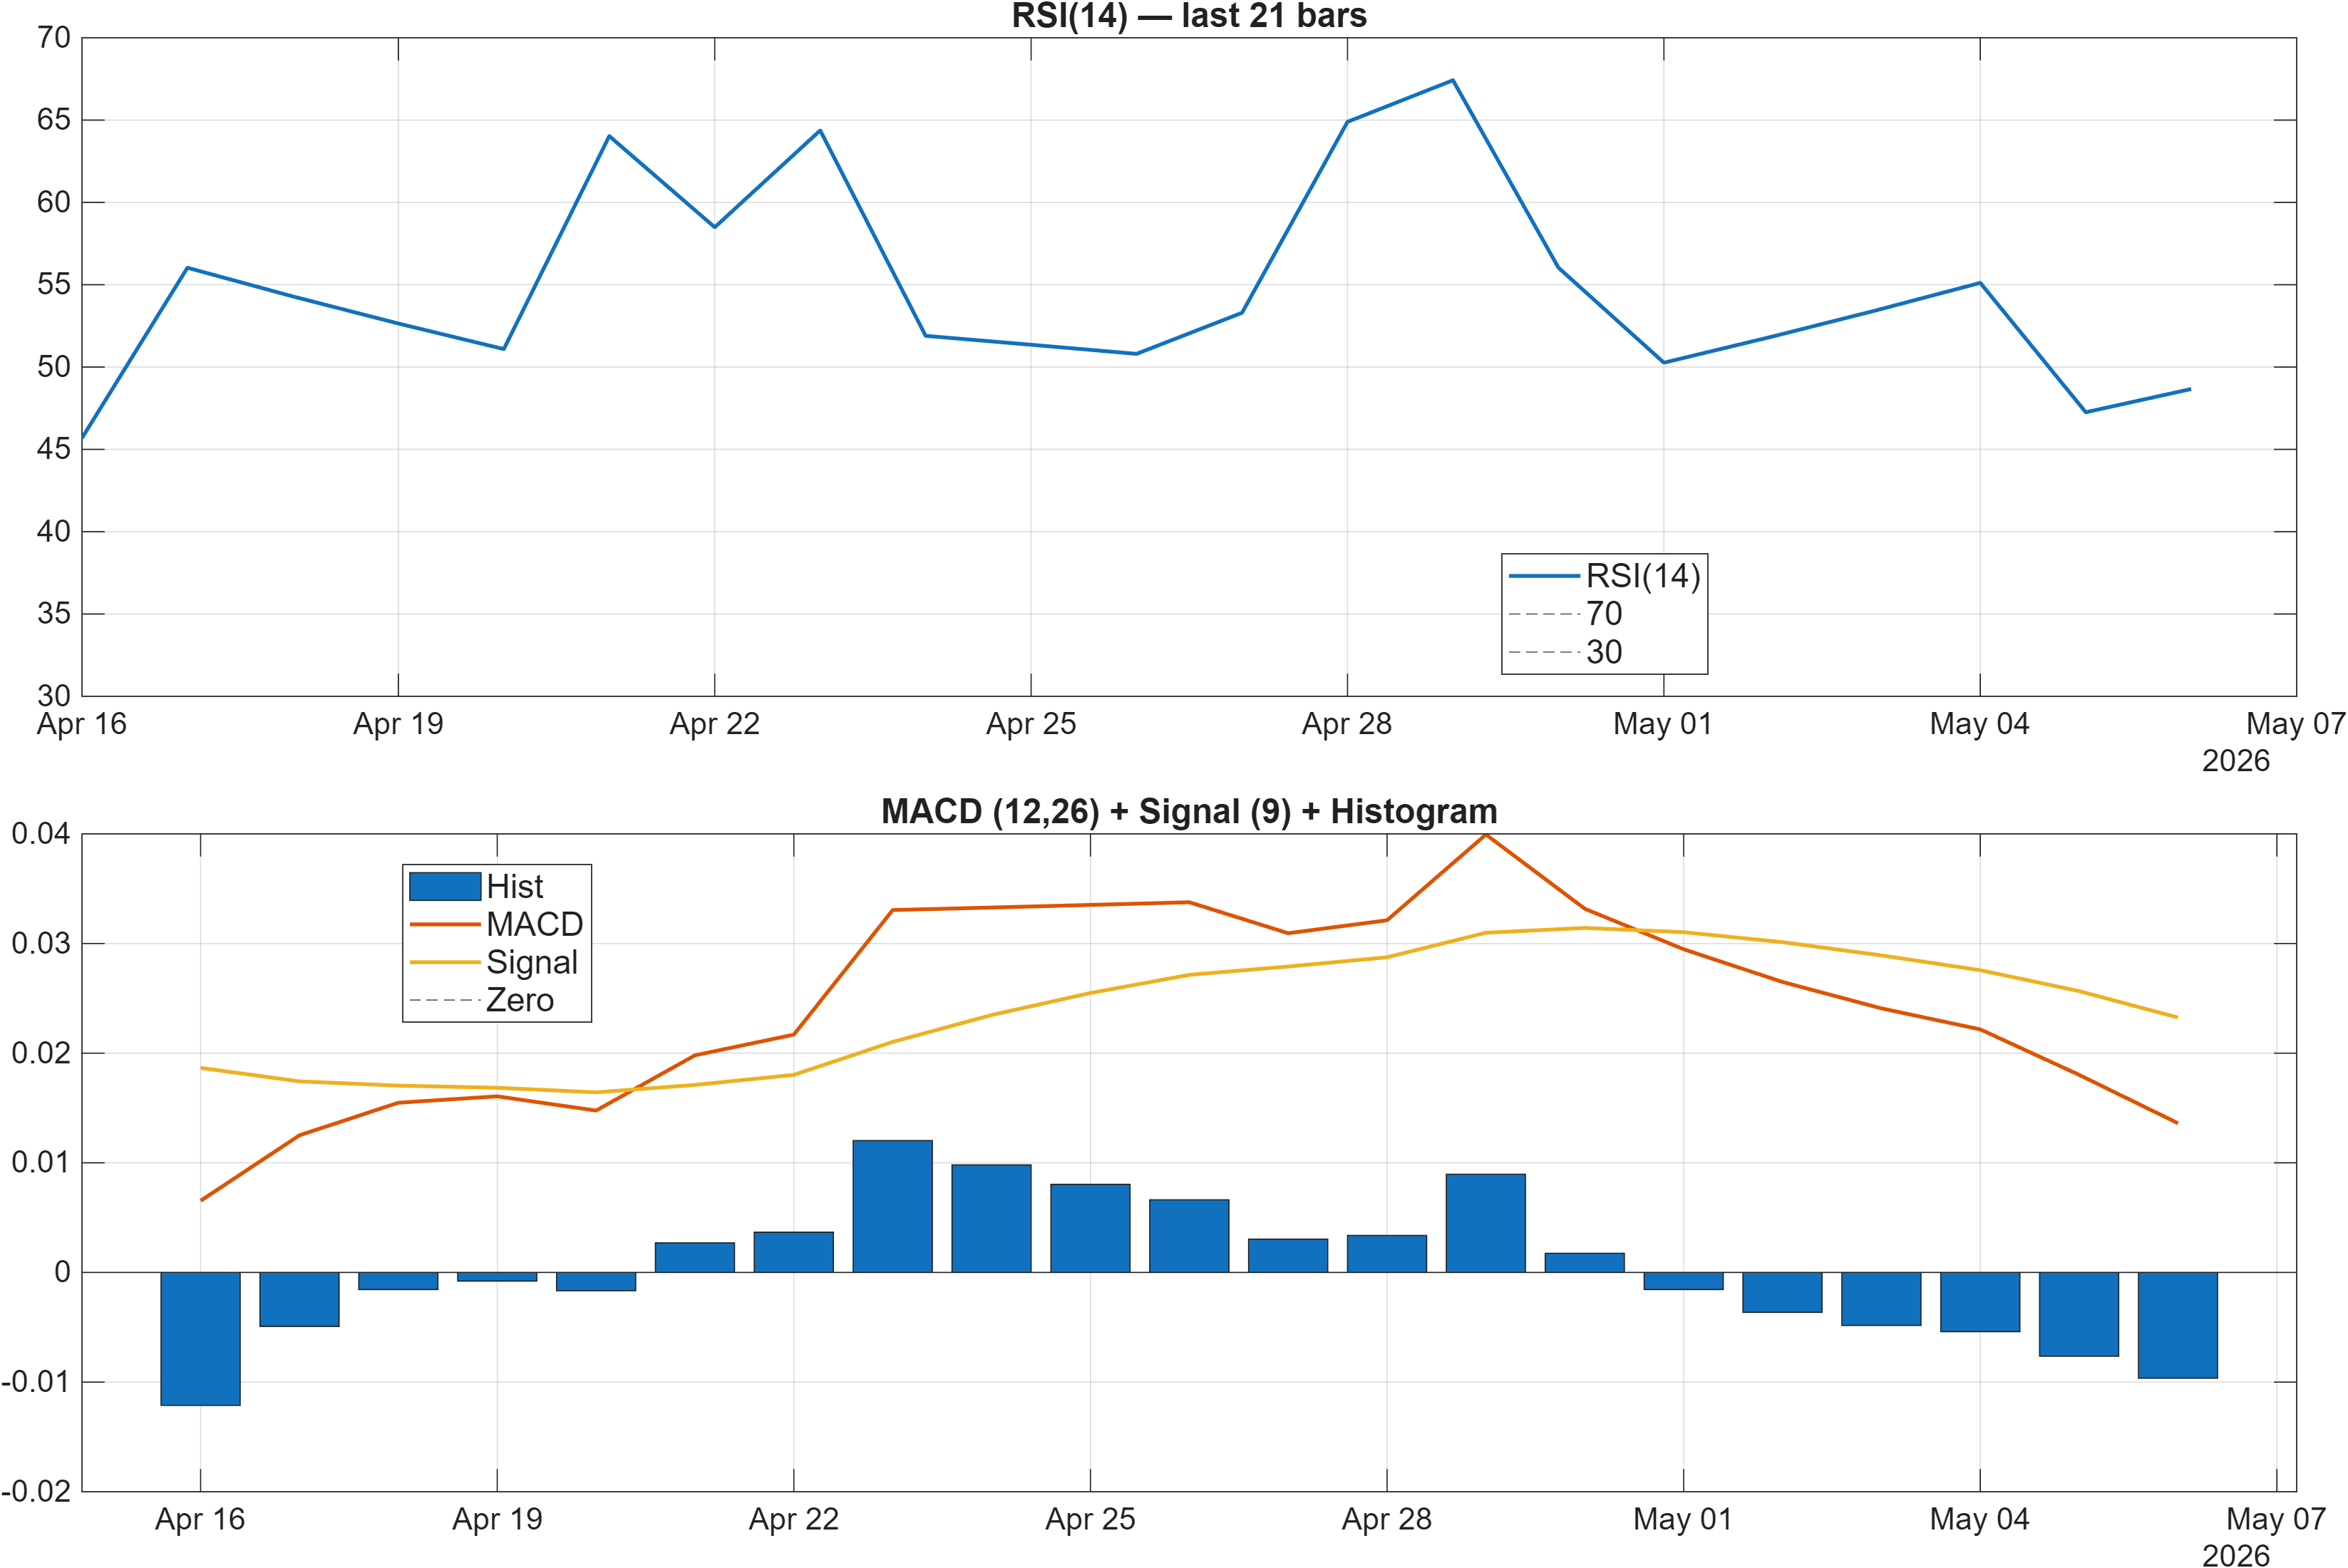
Interpretation: RSI bias = Neutral, MACD hist = -0.0096.
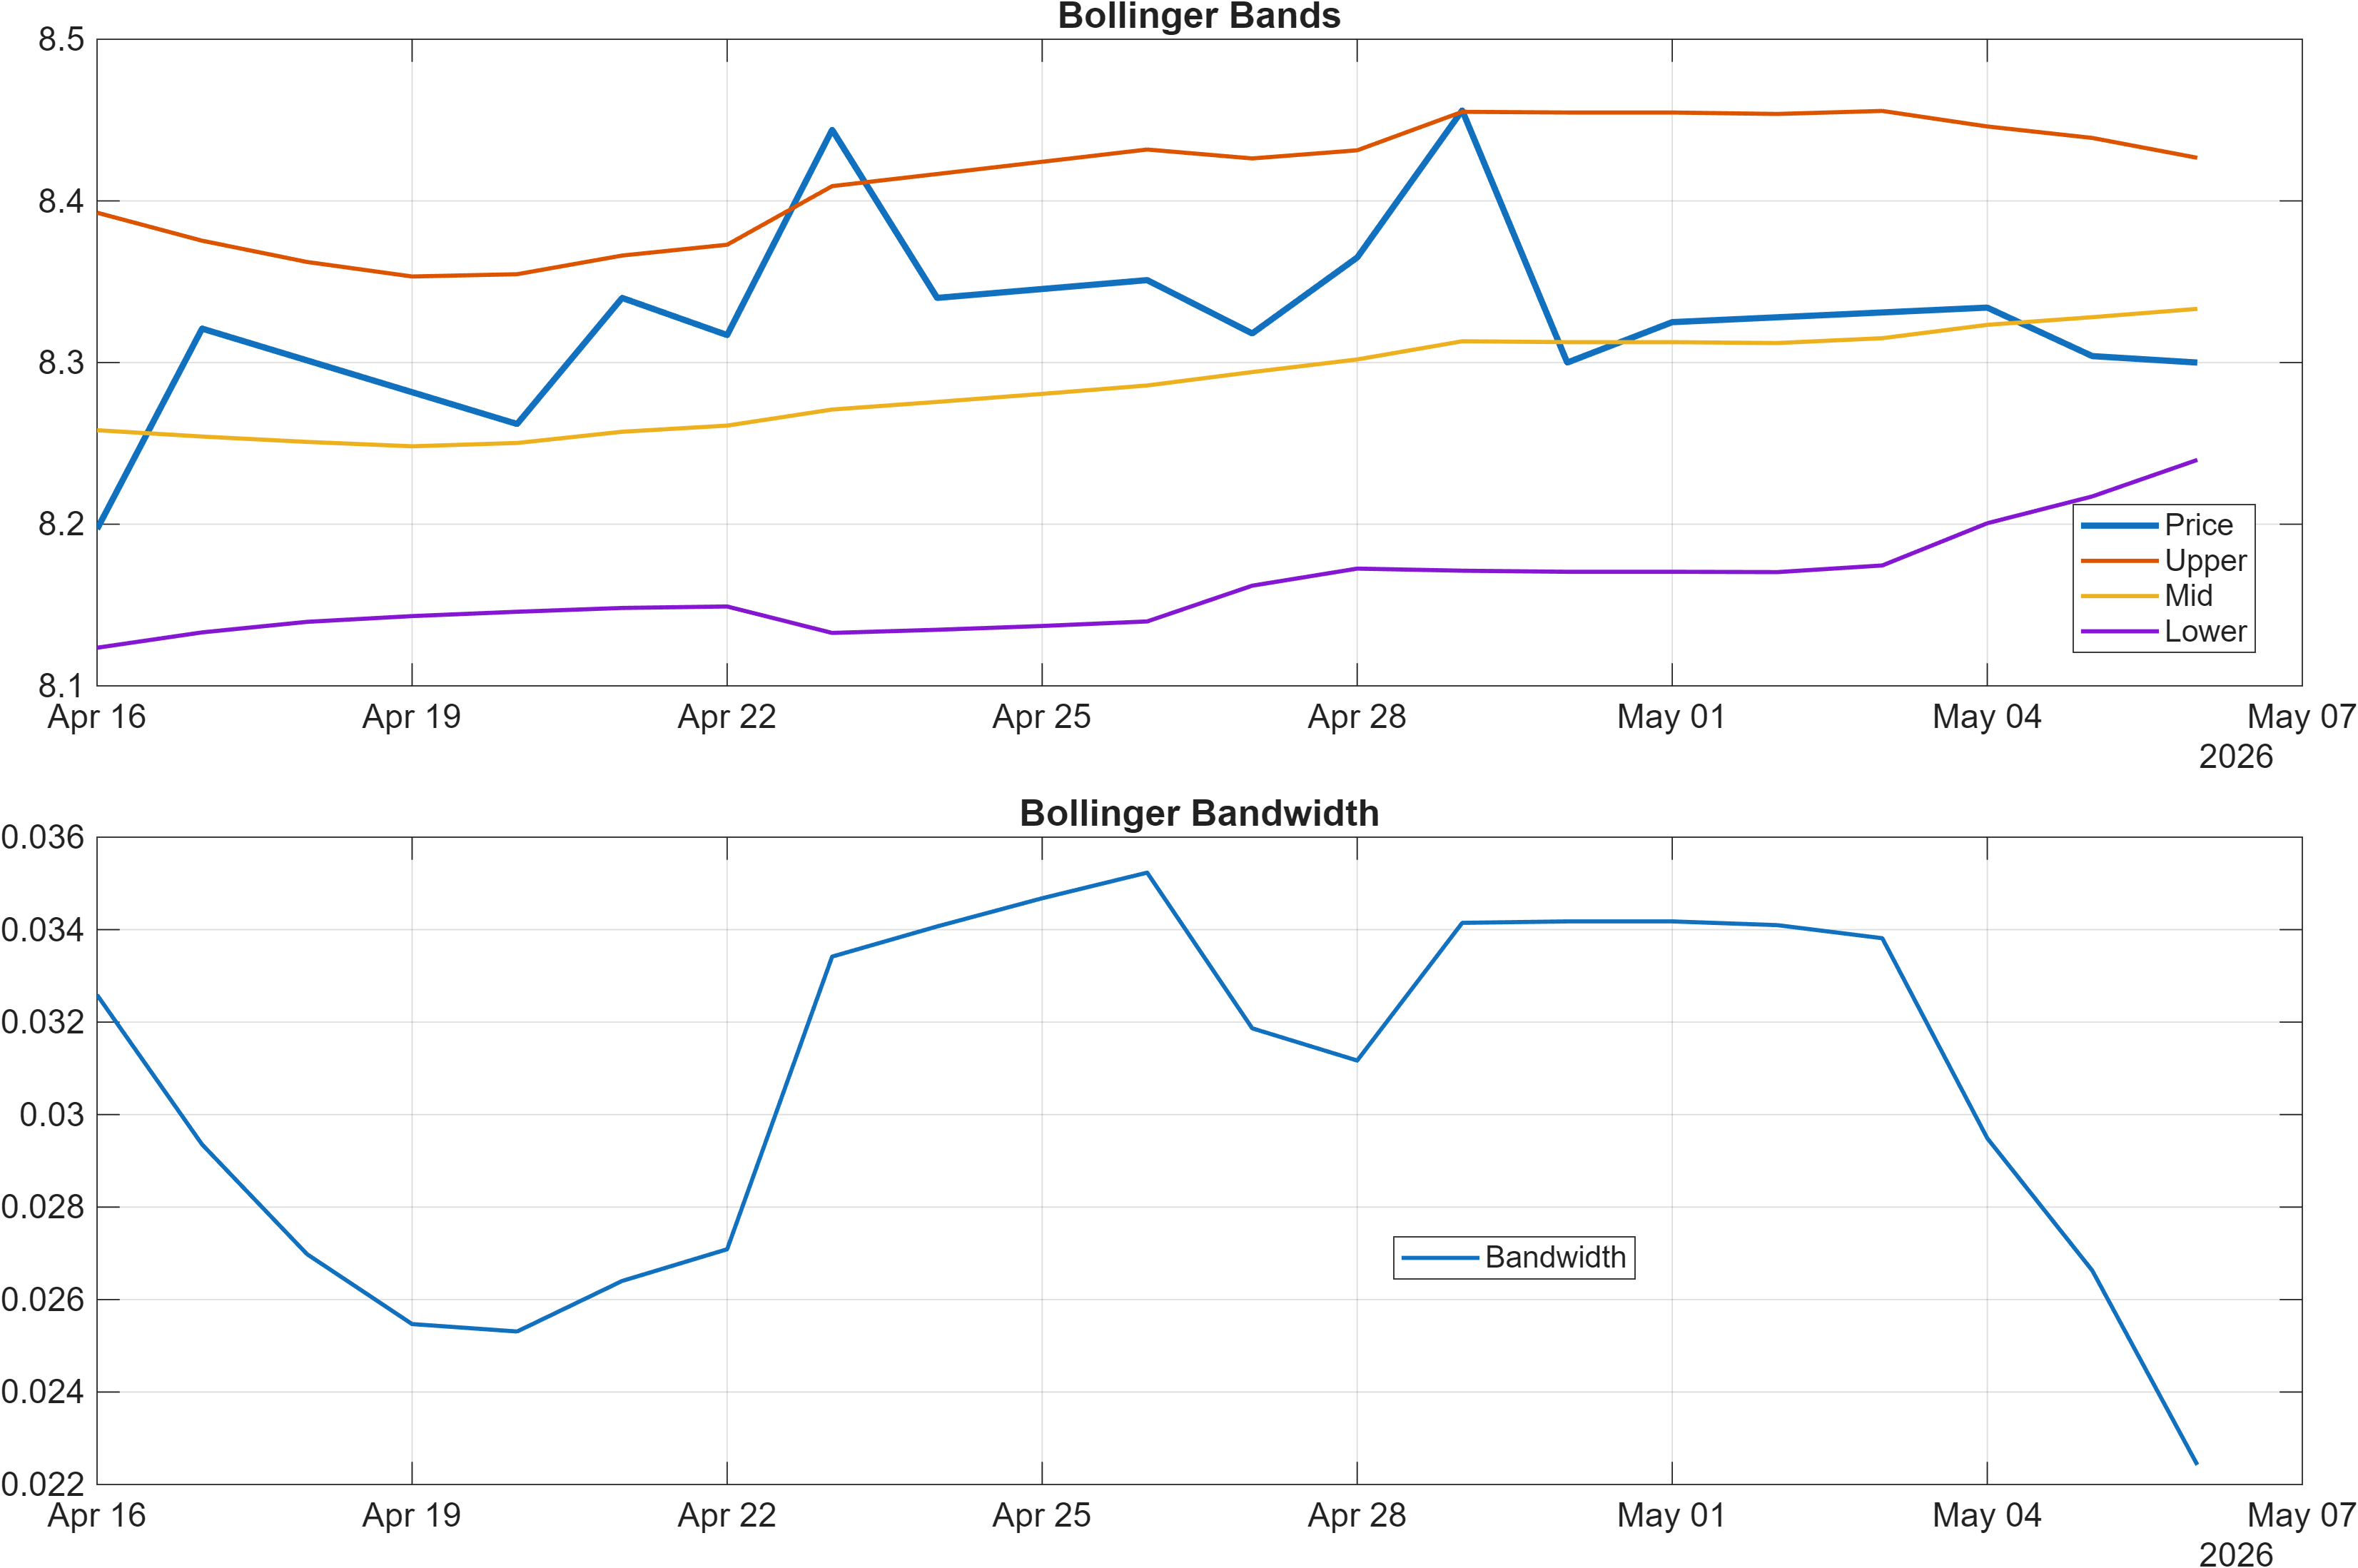
Interpretation: Bandwidth (volatility regime) latest = 0.0224.
Momentum is subdued; volatility remains contained
The momentum stack points to limited directional urgency. RSI(14) sits at 48.67 (neutral), which is consistent with a market not displaying strong overbought/oversold pressure. At the same time, the MACD histogram is modestly negative at -0.009641, indicating downside bias in the momentum differential even though it is not extreme.
A key nuance is that neutral RSI alongside a negative MACD histogram often signals drift rather than capitulation: sellers may be controlling the marginal trend without producing the kind of dislocation that would push RSI lower. This is reinforced by the time-series momentum reading TS Mom(20) at -0.029 and ROC(20) at -0.2524 from the signal table, which lean bearish but do not describe a high-velocity move. In that environment, mean reversion and range behavior tend to compete with trend continuation.
Volatility conditions support that interpretation. Bollinger bandwidth at 0.02242 / 0.0224 (rounded across the dashboard) is comparatively tight, suggesting a compressed regime where breakouts require clear catalysts or strong technical triggers. Compression does not determine direction; it changes the probability map by increasing the importance of level resolution. If bandwidth begins to expand while MACD remains negative, downside tests of support become more credible. Conversely, if bandwidth expands while price reclaims key resistance (Section 4), the neutral RSI backdrop can quickly rotate into a more directional advance without needing to start from oversold conditions.
4) Support / Resistance zones
Support ~ 8.0360 | Resistance ~ 8.4380
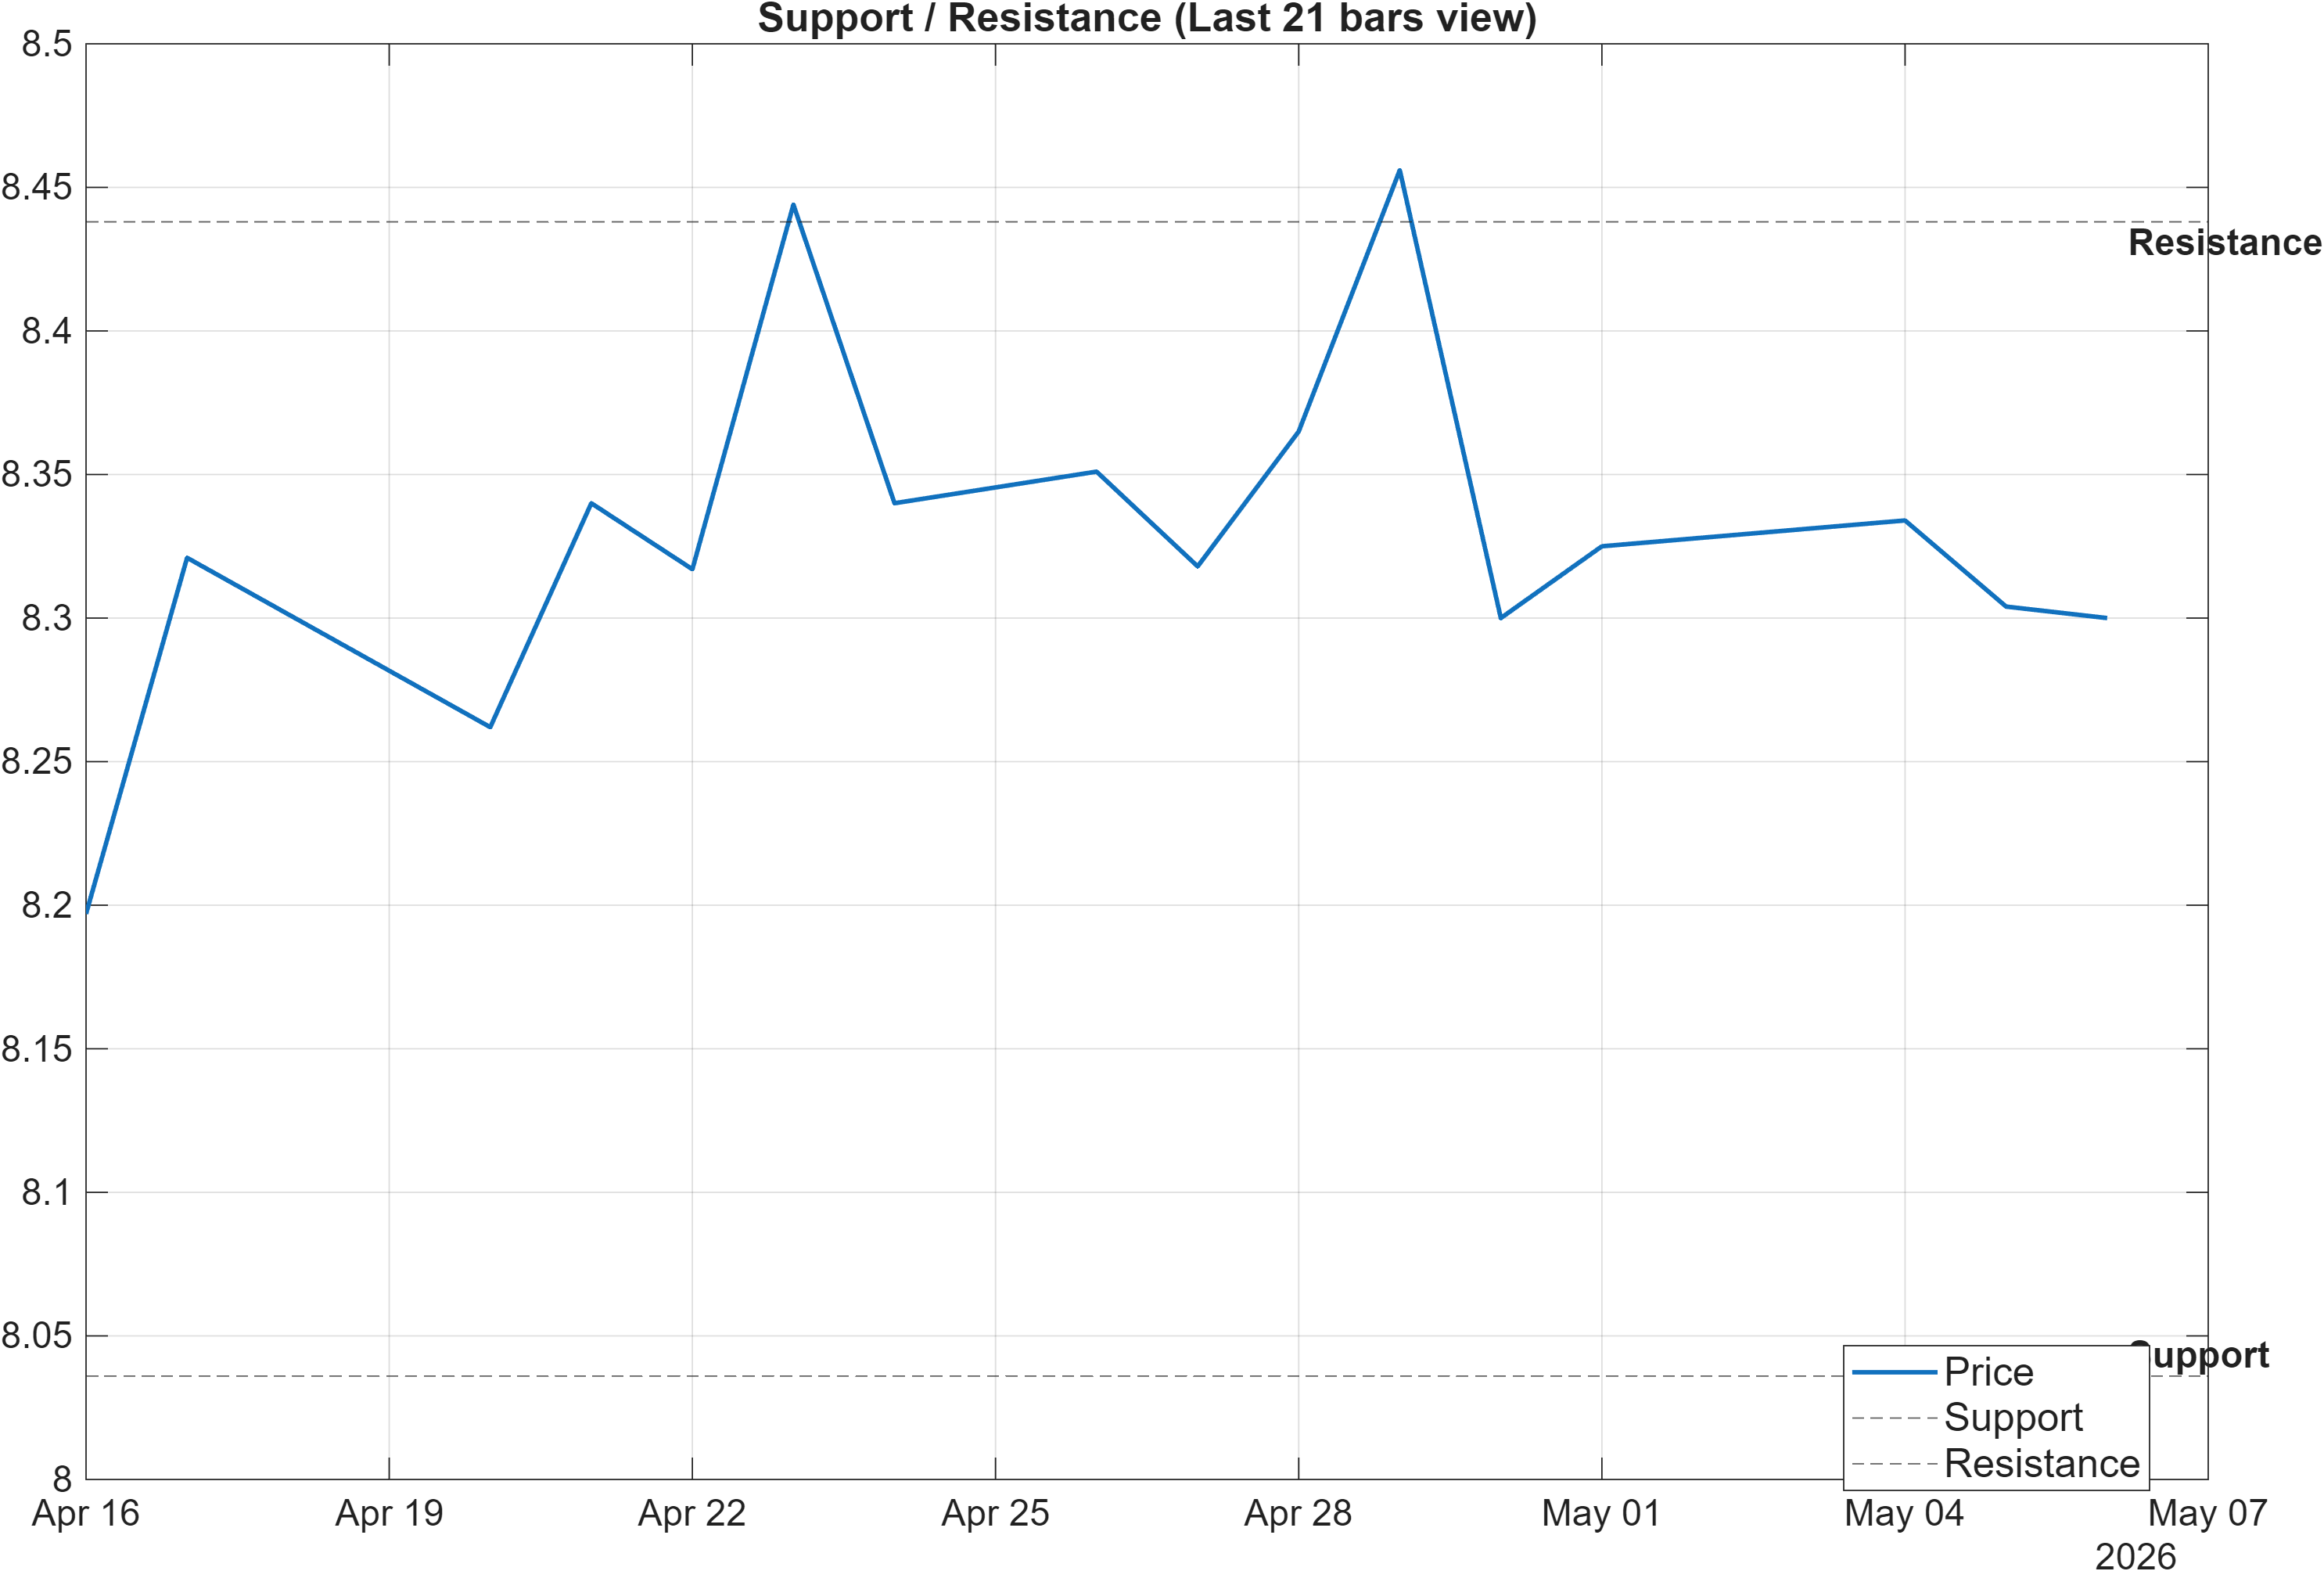
Scenario view: Break above resistance with volume → continuation. Close below support → signal deterioration risk.
Decision-zone framing in a low-volatility regime
With momentum subdued and bandwidth tight (0.0224), the support/resistance map becomes the most informative structure for trade and risk framing. The defined band—8.0360 as support and 8.4380 as resistance—sets a clear probabilistic corridor where signals can be validated or rejected without relying on forecasts.
The scenario guidance is asymmetric in a useful way. A close below 8.0360 is described as “signal deterioration risk,” which fits the broader near-term ranking weakness (daily #928, weekly #919) and the negative MACD histogram (-0.0096). In that case, the neutral RSI (~48.67) would likely have room to move lower before reaching oversold territory, meaning deterioration could unfold without immediate mean-reversion support from RSI extremes.
On the upside, a break above 8.4380 with volume is the continuation trigger. Even though volume is not quantified in the provided data, the presence of a defined trigger is valuable because the technical dashboard is otherwise dominated by neutral readings (9 neutral signals) and a neutral blended score (-0.183). In practical analytical terms, resistance resolution would serve as the missing reconciliation between (a) the bullish MA50 vs MA200 structure and (b) the bearish short-term rank stance. Until one of these levels is resolved, the most consistent interpretation is that price is operating in a range-with-bias framework rather than a clean trend regime.
5) Quant Technical Dashboard (18 Signals)
KGNAI AI Technical Analysis Score (Deep Reinforcement Learning): Rank #832 out of 957 (Rank 1 represents the strongest technical positioning and a higher probability of favorable price behavior. As ranks increase toward the maximum, the probability of favorable outcomes weakens and bearish positioning becomes more dominant.) | Label: Bearish | Score: -0.739
18-Signal Technical Confluence Score: 0.056 (Neutral)
Overall Technical Score (18-signal confluence + DRL rank blend): -0.183 (Neutral)
Note: The blended score reflects signal strength weighted against broader AI technical ranking, which may temporarily diverge.
Blended technical score breakdown: -0.183 (Neutral | Bull 5 / Bear 4 / Neutral 9)
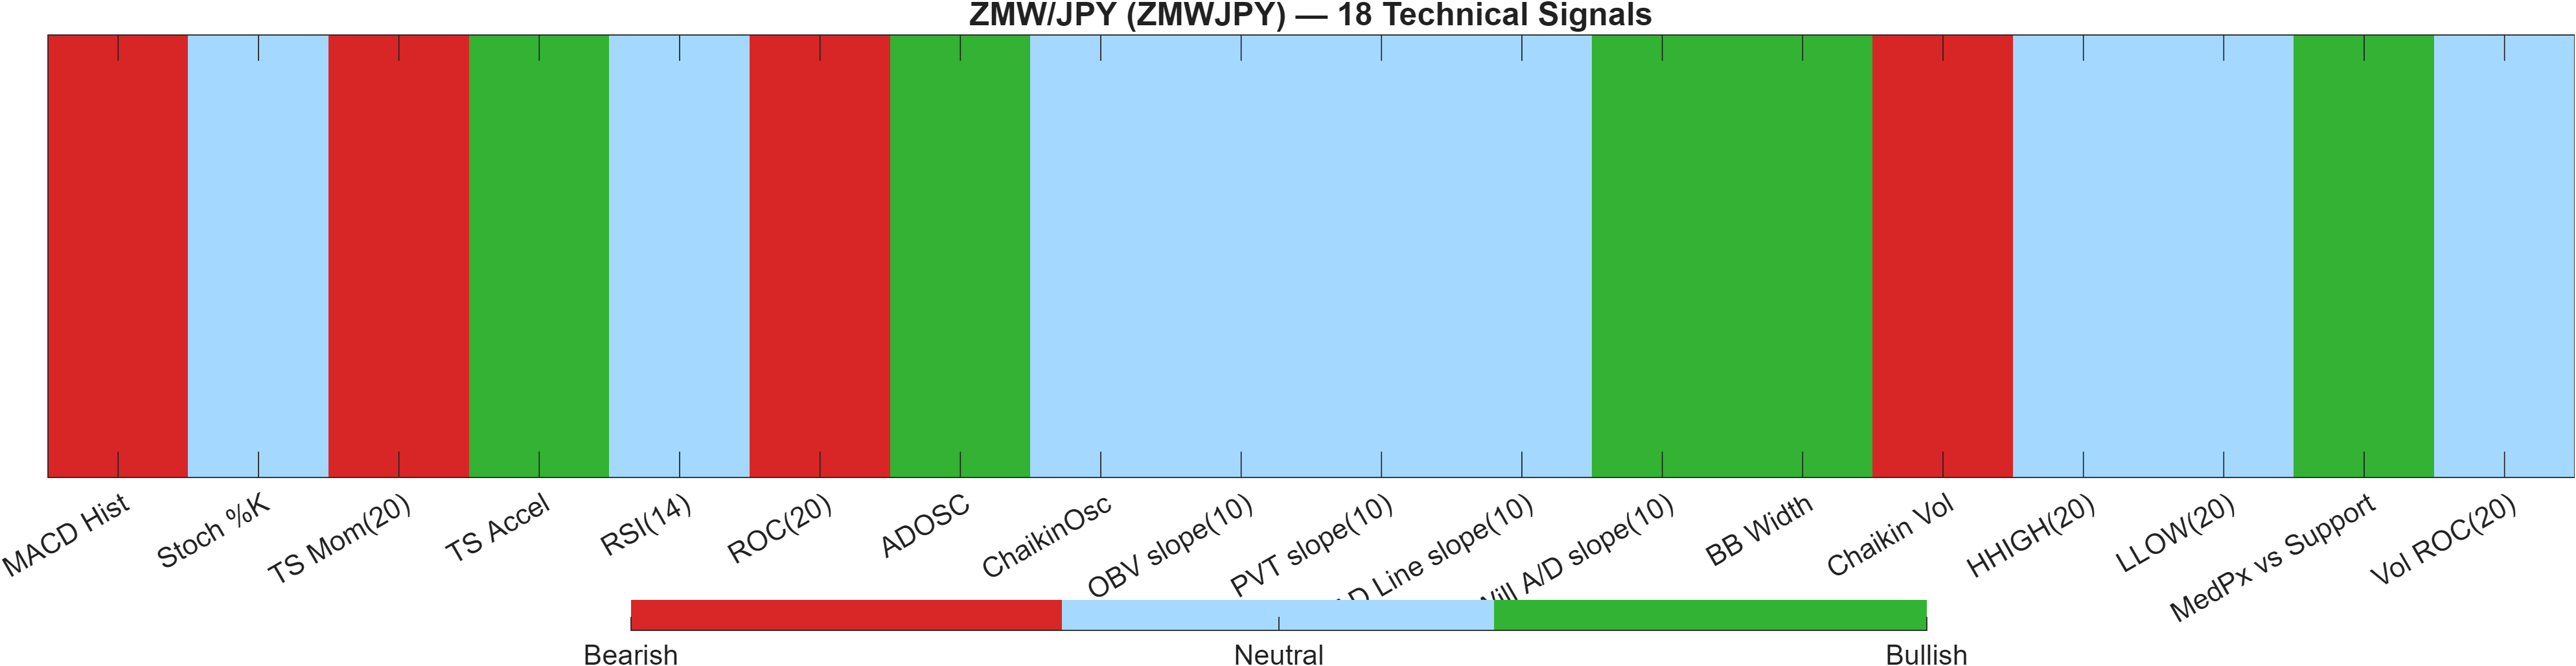
Confluence is neutral, but the AI technical rank remains weak
The technical stack is best described as neutral breadth with a bearish model overlay. The 18-signal confluence score is 0.056 (Neutral), and the blended overall technical score is also neutral at -0.183. That blend matters because it combines discrete indicator states with a separate deep reinforcement learning technical rank, which is #832 out of 957 and labeled Bearish (score -0.739).
The internal composition (Bull 5 / Bear 4 / Neutral 9) indicates that the dashboard is not dominated by bearish signals; instead, it is dominated by non-commitment. That is consistent with RSI(14) at 48.67 (neutral) and Stoch %K at 31.38 (neutral), both of which often sit quietly when the market is deciding between range continuation and breakout.
Where bearish pressure shows up is in momentum and rate-of-change measures: MACD histogram at -0.009641, TS Mom(20) at -0.029, and ROC(20) at -0.2524. Offsetting that, a few participation/volatility-linked readings lean bullish (e.g., ADOSC 19.44 and BB Width 0.02242 flagged bullish in the table). The net effect is a dashboard that does not yet offer clean “all-systems” confirmation; it instead argues for letting the 8.0360 / 8.4380 boundaries adjudicate direction while acknowledging that the AI technical rank remains positioned in the weaker portion of the universe.
Signal table (Bull/Bear/Neutral)
| Indicator | Value | Signal |
|---|---|---|
| MACD Hist | -0.009641 | Bearish |
| Stoch %K | 31.38 | Neutral |
| TS Mom(20) | -0.029 | Bearish |
| TS Accel | 0.01767 | Bullish |
| RSI(14) | 48.67 | Neutral |
| ROC(20) | -0.2524 | Bearish |
| ADOSC | 19.44 | Bullish |
| ChaikinOsc | 0 | Neutral |
| OBV slope(10) | 0 | Neutral |
| PVT slope(10) | 0 | Neutral |
| AD Line slope(10) | 0 | Neutral |
| Will A/D slope(10) | 0.116 | Bullish |
| BB Width | 0.02242 | Bullish |
| Chaikin Vol | 10.71 | Bearish |
| HHIGH(20) | 8.491 | Neutral |
| LLOW(20) | 8.2 | Neutral |
| MedPx vs Support | 0.26 | Bullish |
| Vol ROC(20) | — | Neutral |
Interpretation: Indicator-level signals form the base confluence, which is then adjusted using a separate AI-driven technical ranking model. The final technical score summarizes this combined view.
6) News sentiment + extractive gist
Note: Instrument-specific news matches were not found, so the digest includes broader market/sector headlines.
Sentiment score (avg): 0.187 | Positive: 44% | Neutral: 50% | Negative: 6%
KGNAI AI News Sentiment Score (normalized -1 to +1): Not available (as of —) | Label: Not available | Overall news score: 0.19
Positive Developments
Recent coverage across major financial outlets indicates a broadly constructive tone for risk appetite, with narratives emphasizing periods of reduced geopolitical intensity and a softer U.S. dollar backdrop in parts of the session. In FX, that combination can support rotation flows and reduce near-term demand for defensive positioning, which may help stabilize cross rates that are otherwise technically undecided. The sentiment breakdown supports this tilt: an average score of 0.187 with 44% of items classified as positive and only 6% negative. For ZMWJPY specifically, this constructive bias does not substitute for instrument-level catalysts (which are not present in the provided data), but it can influence how quickly markets respond to technical triggers around resistance (8.4380) versus support (8.0360). In a low-volatility setup (bandwidth 0.0224), incremental shifts in macro tone can matter most when price is already near a decision zone.
Neutral / Mixed Developments
The neutral share of the digest is large (50%), which is consistent with a backdrop where markets are processing routine FX and macro updates without a single dominant directional impulse. That “mixed-but-not-stressed” context fits a technical profile that is also mixed: RSI remains neutral at 48.67 while MACD histogram is modestly negative at -0.0096. When the information flow is balanced, price action tends to respect nearby reference levels more tightly, and short-term mean reversion can coexist with a mild momentum bias. For readers, the key is to separate contextual sentiment from direct drivers: the report’s own note indicates instrument-specific matches were not found, so the news layer should be treated as background conditions rather than a causal explanation for ZMWJPY’s rank dispersion (daily #928 versus 3-month #23).
Negative / Risk Signals
Risk content in the digest is present but limited in frequency (6%), and it clusters around themes that can reintroduce uncertainty into cross-asset pricing—particularly policy or trade-friction narratives. Even when not directly tied to ZMWJPY, such themes can tighten liquidity conditions and compress risk-taking, which may matter more when an instrument is already ranked weak in the near term (weekly #919) and the AI technical rank is positioned in the lower portion of the universe (#832). In practice, a rise in risk-sensitive headlines tends to make level failures more consequential: if price were to close below 8.0360, a risk-off tone can accelerate deterioration by reducing willingness to fade downside breaks. Conversely, if those risk signals remain contained, the market may continue to oscillate inside the defined corridor rather than expanding volatility.
- Whether price resolves 8.0360 support or 8.4380 resistance first, given tight bandwidth (0.0224).
- Whether momentum confirms the break: MACD histogram (-0.0096) improving versus remaining negative.
- Whether the constructive sentiment skew (0.187) persists or shifts toward higher negative share.
Sources referenced: Reuters, Bloomberg, Yahoo Finance, MarketWatch, Investing.com
7) Sources
- Indian Rupee advances on improved market sentiment — https://www.fxstreet.com/news/indian-rupee-advances-on-improved-market-sentiment-202605060432
- US Dollar Index softens below 98.50 on Middle East de-escalation signals — https://www.fxstreet.com/news/us-dollar-index-softens-below-9850-on-middle-east-de-escalation-signals-202605060416
- AUD/USD Price Forecast: Rallies to June 2022 high, closer to mid-0.7200s on weaker USD — https://www.fxstreet.com/news/aud-usd-price-forecast-rallies-to-june-2022-high-closer-to-mid-07200s-on-weaker-usd-202605060409
- Gold refreshes weekly top, eyes mid-$4,600 as USD weakens on US-Iran peace deal hopes — https://www.fxstreet.com/news/gold-refreshes-weekly-top-eyes-mid-4-600-as-usd-weakens-on-us-iran-peace-deal-hopes-202605060343
- Silver Price Forecast: XAG/USD rises above $75.00 as Middle East tensions ease — https://www.fxstreet.com/news/silver-price-forecast-xag-usd-rises-above-7500-as-middle-east-tensions-ease-202605060253
- Japanese Yen gains ground on Trump’s Hormuz pause, intervention caution — https://www.fxstreet.com/news/japanese-yen-gains-ground-on-trumps-hormuz-pause-intervention-caution-202605060223
- China’s RatingDog Services PMI rises to 52.6 in April — https://www.fxstreet.com/news/chinas-ratingdog-services-pmi-rises-to-526-in-april-202605060145
- Canadian Dollar gains ground as easing safe-haven demand weighs on US Dollar — https://www.fxstreet.com/news/canadian-dollar-gains-ground-as-easing-safe-haven-demand-weighs-on-us-dollar-202605060144
You may also like: How KGNAI AI ranks instruments across global markets
Disclaimer: KGNAI provides AI-generated analytics and educational market commentary only. This is not financial advice. Markets involve risk. Always do your own research.