
MXNAUD (Mexican Peso/Australian Dollar) — 01-May-2026 Technical Stance: Bearish Short-Term, Compression Risk
MXNAUD is currently characterized by weak short-horizon positioning inside KGNAI’s cross-sectional FX universe alongside a volatility profile that hints at compression rather than trend expansion. The short-term rank sits deep in the lower tail of the 954-instrument set (daily and weekly both bearish), while the medium-to-long horizons shift to neutral, suggesting the market is not uniformly trending across timeframes. Technically, price is positioned below the MA50 and the MA50 is below the MA200, reinforcing a bearish structure even as momentum indicators show mixed stabilization signals. RSI(14) at 24 and a negative MACD histogram (including -0.0001 and -0.0001381 on the dashboard/table) keep downside pressure in focus, but the Bollinger bandwidth at 0.0326 points to a regime where breakouts may be abrupt once compression resolves. Key decision zones remain clearly defined between 0.0792 support and 0.0816 resistance.
- Rank stance: Short-term Bearish (daily #823 / weekly #787); Mid-term Neutral; Long-term Neutral
- Technical confluence: 18-signal confluence Neutral at -0.167, but blended overall technical score Bearish at -0.387 (DRL rank #907)
- Key levels: Support ~ 0.0792 | Resistance ~ 0.0816
- News sentiment bias: Neutral (avg 0.013; 81% neutral)
- Confirmation / invalidation condition: A sustained close below 0.0792 aligns with deterioration risk; a break above 0.0816 is the primary counter-signal for near-term stabilization.
KGNAI evaluates assets using large cross-sectional datasets built from millions of structured data points. Inputs incorporate fundamental metrics, technical structures, and systematically processed news sentiment. Statistical models, machine learning, and AI frameworks are used to assess relative positioning, signal alignment, and probabilistic behavior across broad universes.
- Ranks are comparative across the tracked universe, not absolute price targets.
- Confluence reflects alignment among independent signal groups.
- Support/resistance levels are probabilistic decision zones, not guarantees.
- Sentiment provides contextual bias within the broader analytical framework.
1) KGNAI AI Analysis
Region: FOREX
Total universe size: 954 ranked instruments
- Daily rank: #823 out of 954 — Bearish
- Weekly rank: #787 out of 954 — Bearish
- Monthly rank: #762 out of 954 — Neutral
- 3-Monthly rank: #699 out of 954 — Neutral
- 6-Monthly rank: #720 out of 954 — Neutral
- Yearly rank: #750 out of 954 — Neutral
Cross-sectional ranks place MXNAUD in the lower tail on the shortest horizons: the daily rank at #823 and weekly at #787 are consistent with a risk profile where adverse price behavior has been more common than favorable behavior versus peers. The more muted tone across longer windows—monthly #762 and 3-monthly #699—suggests a regime that may be transitioning from directional weakness toward consolidation rather than a uniform downtrend.
This time-horizon split matters because FX crosses can oscillate between persistent trend regimes and mean-reverting phases. When short-term ranks are bearish while medium/long ranks remain neutral (including yearly #750), it typically reflects either (1) a recent shock that has not yet “re-rated” the longer window, or (2) a market moving sideways after a drawdown, where short-term momentum stays heavy but longer-horizon drift is less decisive.
The stated term view aligns with this interpretation: Short-term bearish, mid-term neutral, and long-term neutral. For readers using ranks as a positioning filter, the practical implication is to treat the current profile as weak near-term relative strength inside a broader neutral envelope—an environment where confirmation should come from price interaction with the key levels (0.0792 / 0.0816) and from whether technical breadth improves beyond the current blended technical posture (overall technical score -0.387).
2) Price & trend overview
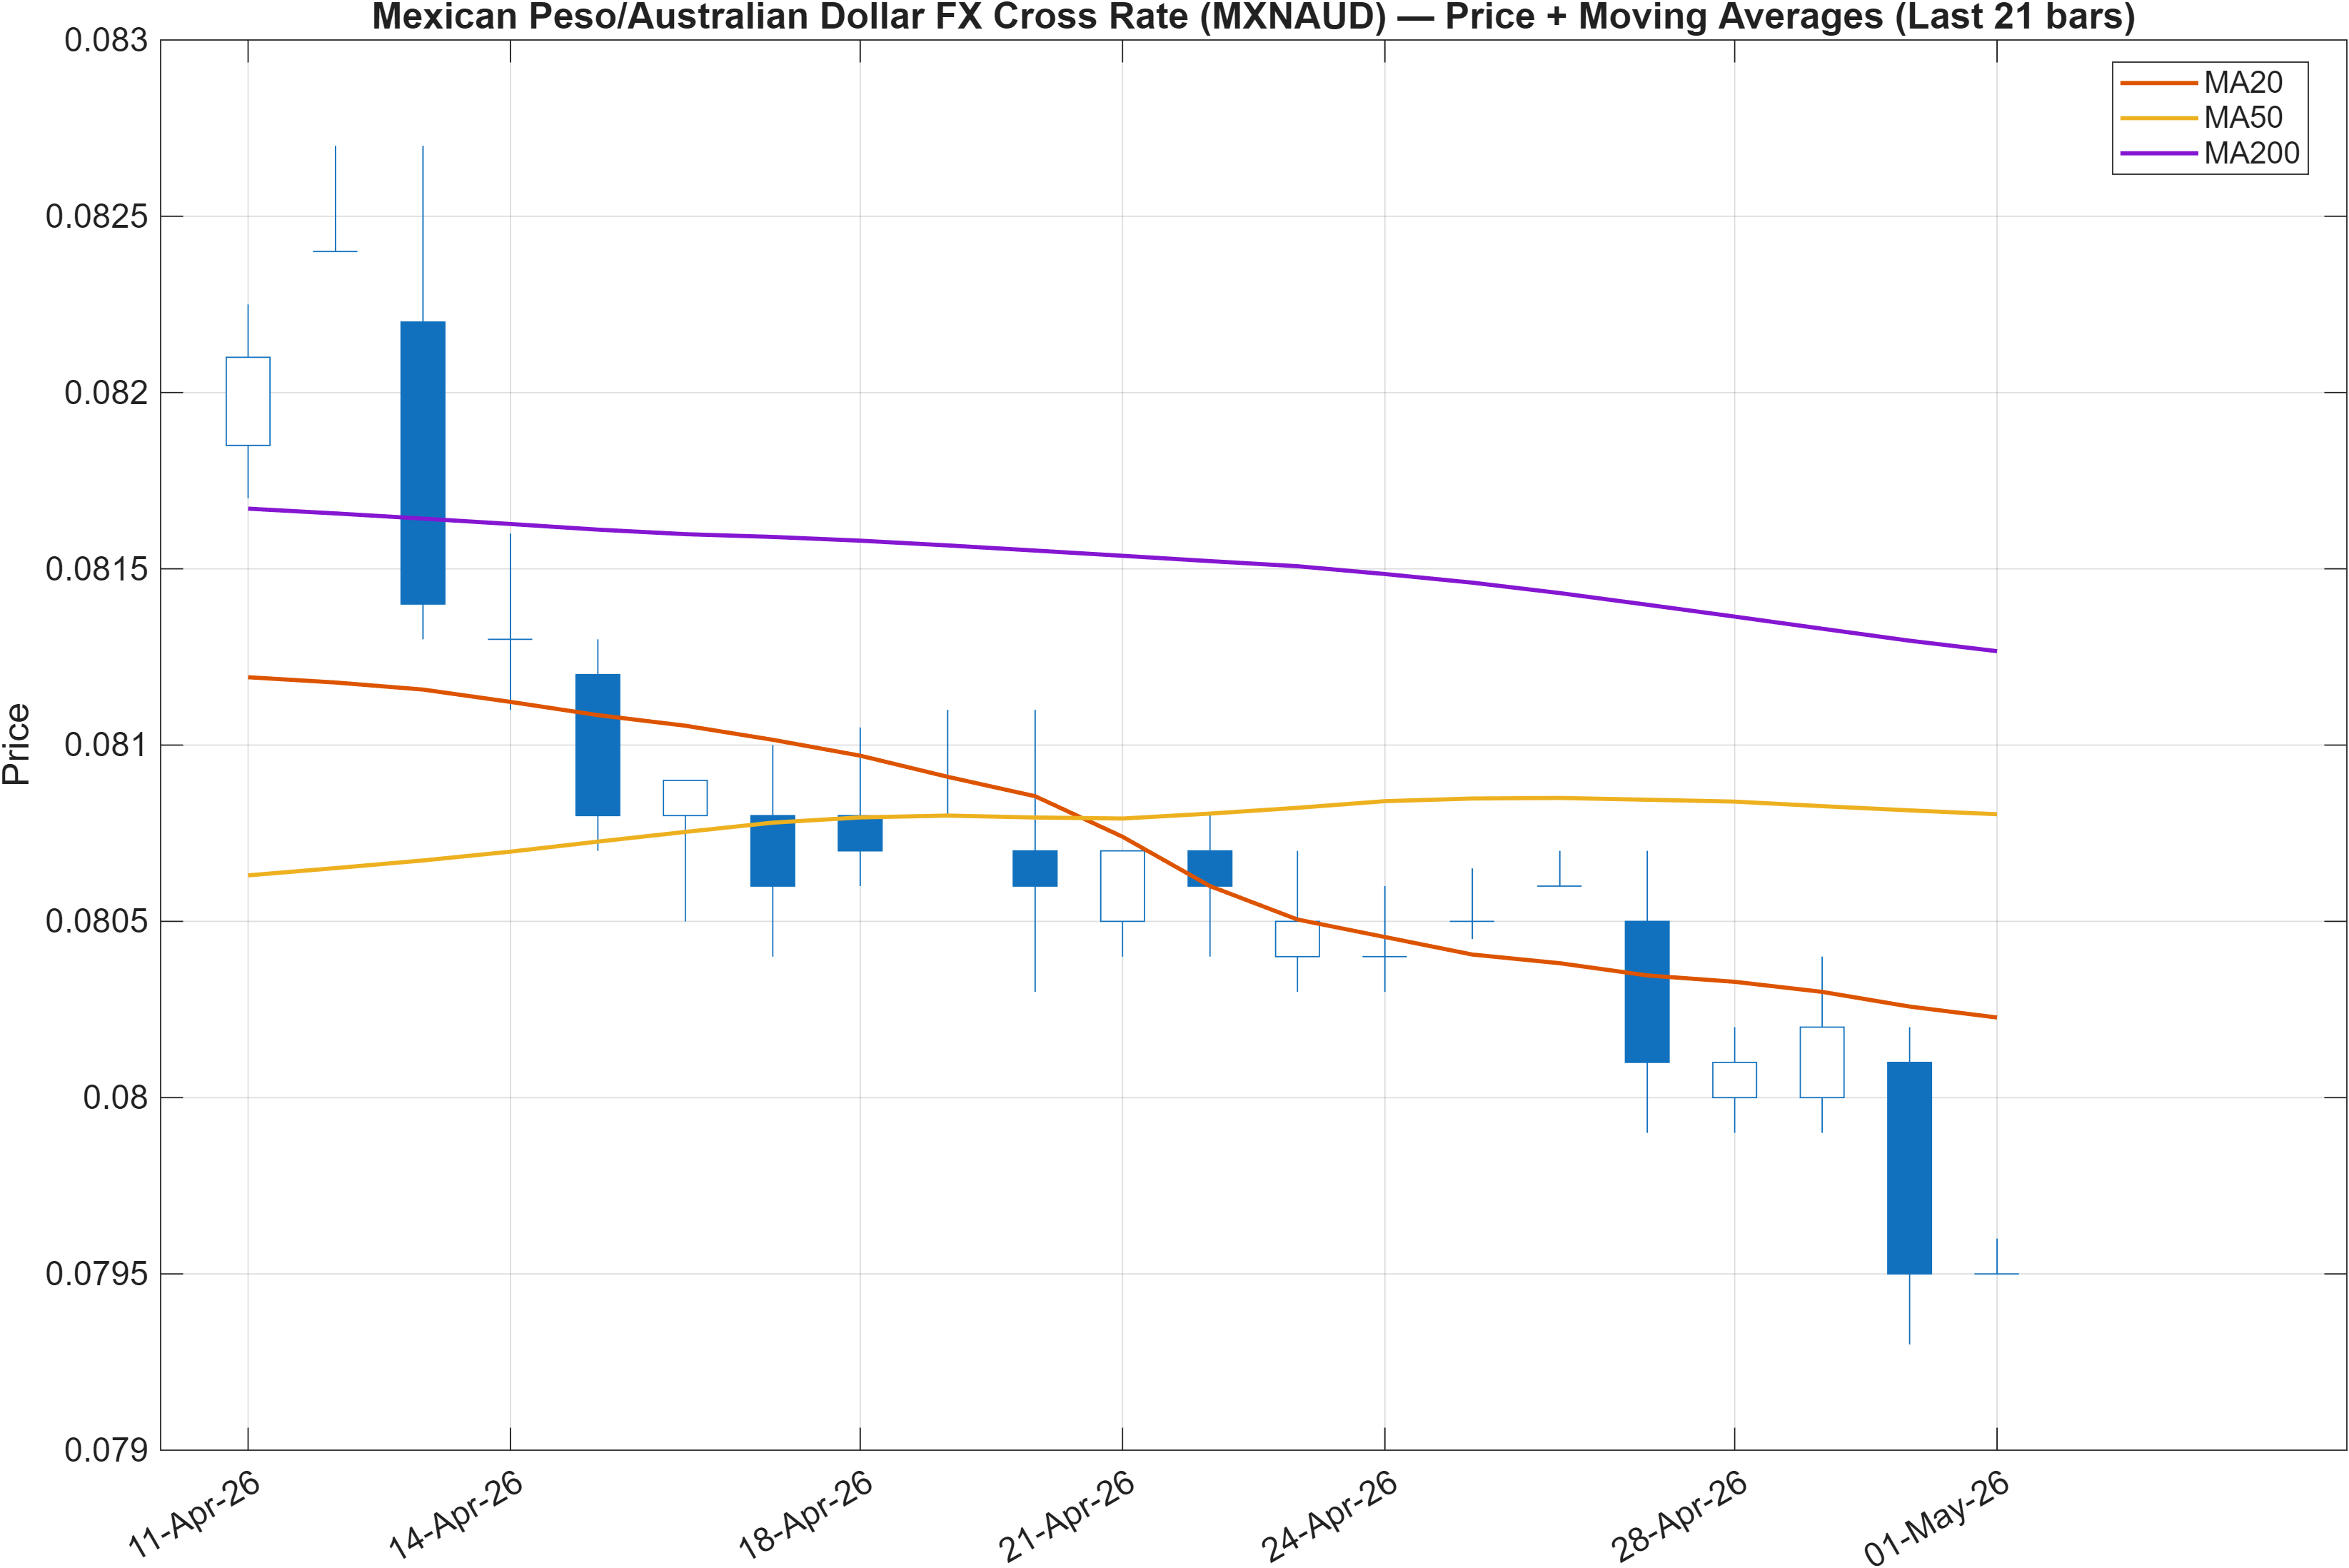
Interpretation: Close vs MA50 = Bearish, MA50 vs MA200 = Bearish.
Trend structure vs consolidation pressure
The moving-average structure is unambiguous on direction: the close below MA50 and MA50 below MA200 configuration represents a bearish trend template, commonly associated with lower highs and a market that has struggled to sustain rebounds. However, the broader report framing (“compression”) suggests the market may be entering a phase where directional follow-through is less persistent than the trend template alone would imply.
That distinction is important in FX crosses where trend signals can remain bearish while realized volatility falls, producing narrower ranges before the next impulse move. The nearby support/resistance map—support around 0.0792 and resistance around 0.0816—fits the idea of a tight decision corridor. When price is trapped between these zones, trend indicators may lag while the market awaits a catalyst for expansion.
From a market-structure standpoint, a bearish MA stack tends to make resistance more “active”: rebounds into the overhead region often encounter supply earlier, especially when short-term relative ranking is weak (daily #823). Conversely, the neutrality on longer horizons (3-monthly #699) argues against assuming uninterrupted downside without level-based confirmation. In practice, the chart should be read as bearish bias with compression risk: the direction is down-tilted, but the next meaningful move is more likely to be validated by a level break than by incremental drift.
A constructive change would require not only probing resistance, but sustaining behavior that contradicts the bearish template—namely holding above 0.0816 long enough for the short-horizon signals to re-rate. Until then, the moving-average state keeps the benefit of the doubt with the sellers, even if price action becomes temporarily range-bound.
3) Momentum & volatility dashboard
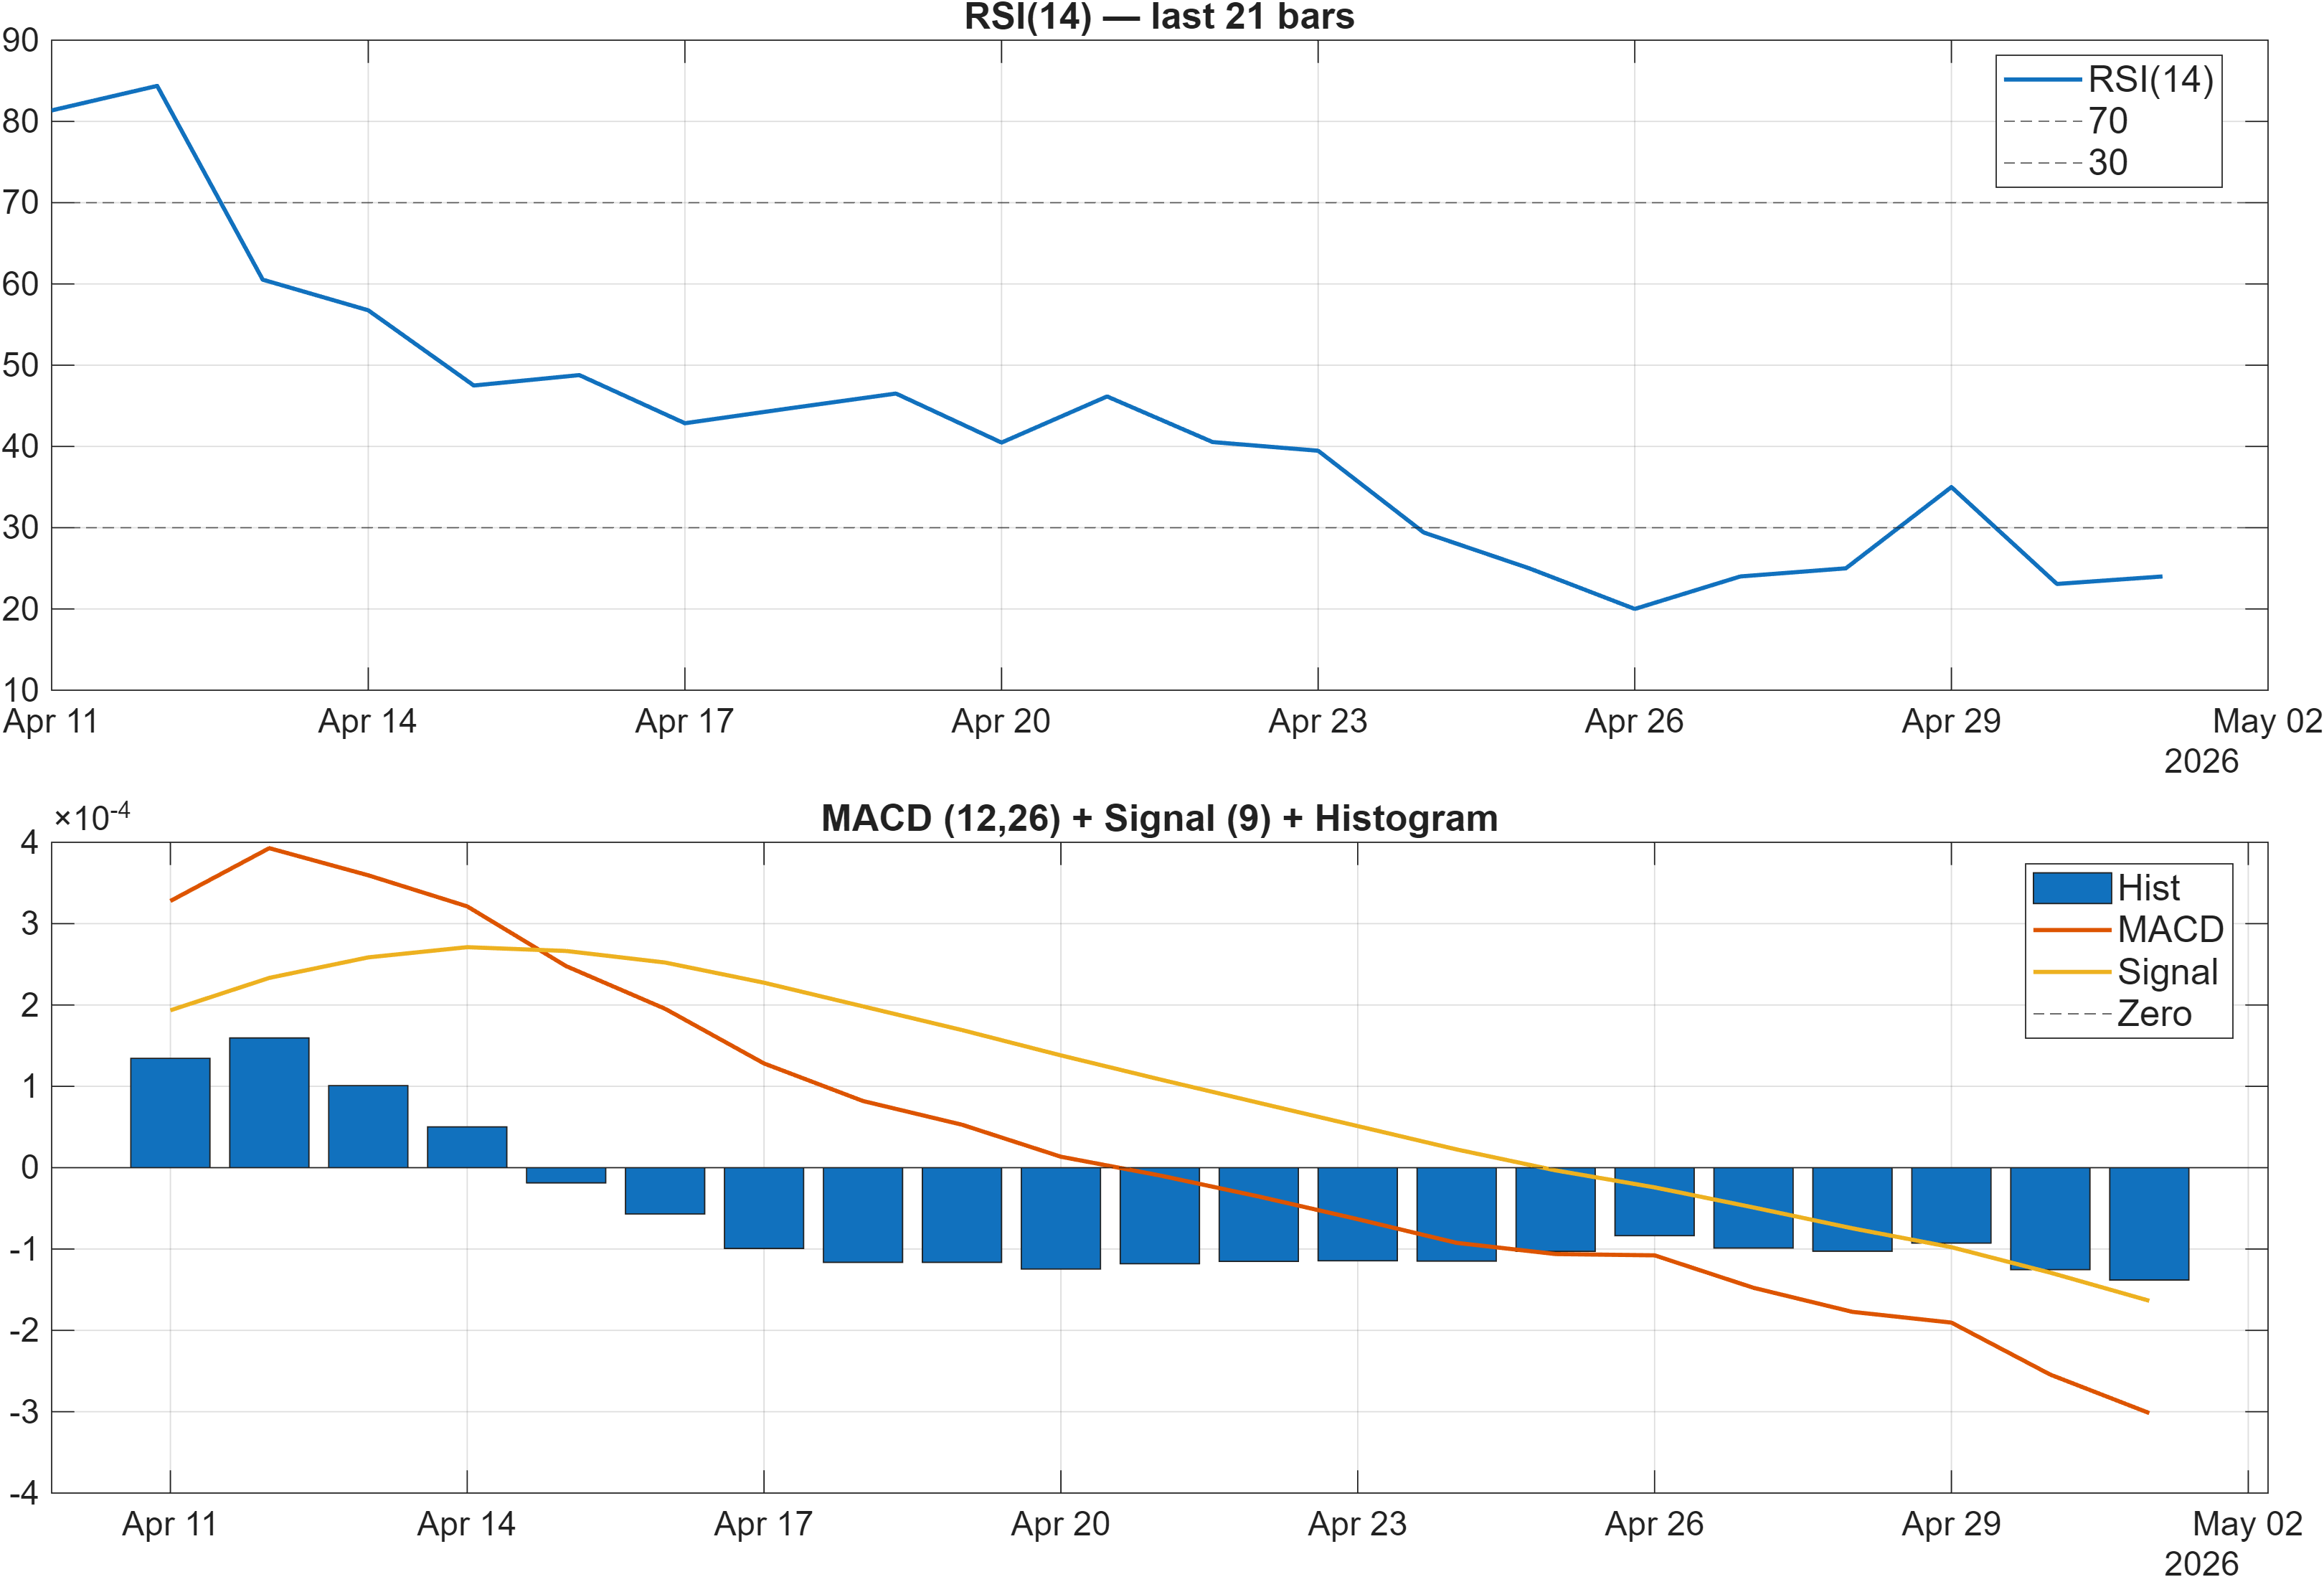
Interpretation: RSI bias = Bearish, MACD hist = -0.0001.
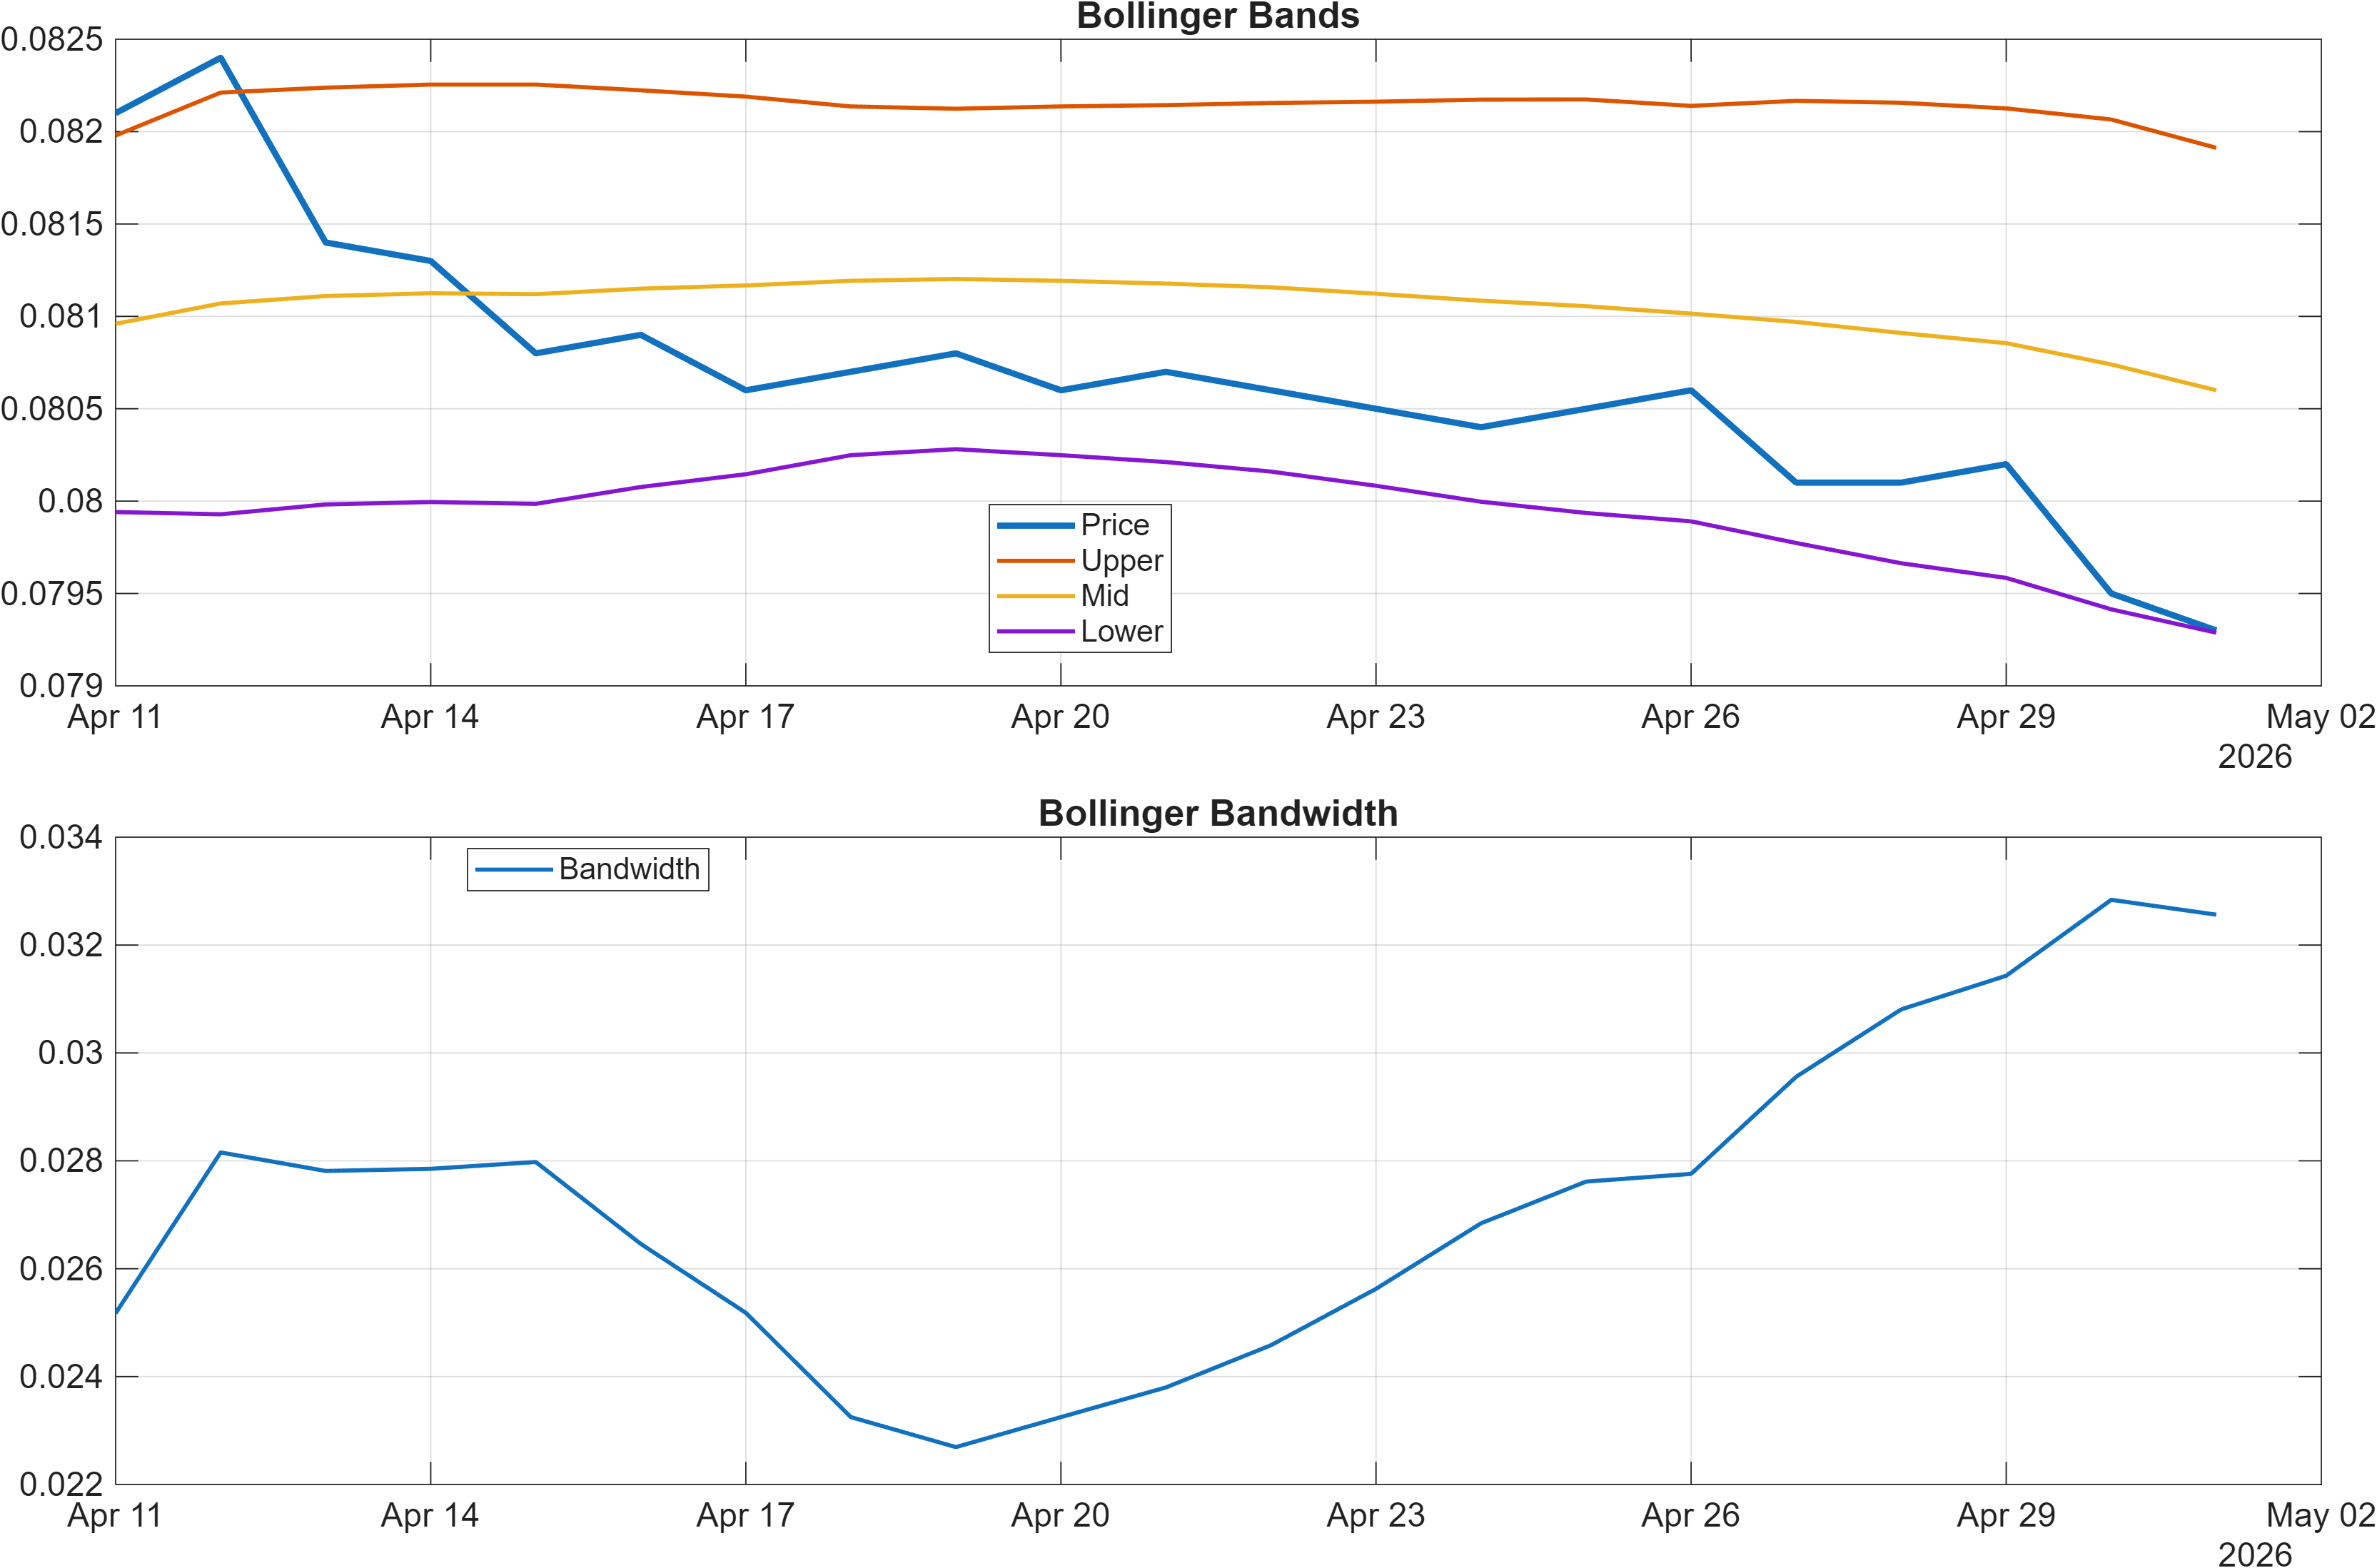
Interpretation: Bandwidth (volatility regime) latest = 0.0326.
Bearish momentum with “low-vol” breakout asymmetry
Momentum remains skewed to the downside. RSI(14) at 24 sits in a depressed zone, consistent with bearish bias rather than a balanced, mean-reverting state. At the same time, MACD histogram is still negative (dashboard -0.0001; signal table -0.0001381), reinforcing that the prevailing impulse has not flipped. In combination, these suggest that any rebounds may be corrective unless momentum broadens materially.
The more nuanced element is volatility. Bollinger bandwidth at 0.0326 indicates relatively tight dispersion versus periods of expansion. Compression can coexist with bearish momentum: the market may “bleed” lower in small increments or coil into a narrow range, then reprice quickly once a boundary gives way. This is where level sensitivity increases: small moves can carry more information than usual because they occur in a low-bandwidth regime.
Internally, the signal mix also hints at tension between oversold conditions and trend continuation. Stoch %K at 13.33 is flagged bullish while RSI remains bearish, a classic short-term divergence that can precede either a reflexive bounce or a shallow consolidation. Meanwhile, time-series momentum measures (TS Mom(20) -0.0029 and TS Accel -0.0047) are bearish, arguing that the larger impulse still dominates despite oversold readings.
Net: the dashboard supports a base case of bearish momentum inside a compression regime. In that setup, confirmation is less about “calling a turn” and more about watching whether the market breaks 0.0792 with follow-through, or reclaims 0.0816 in a way that forces momentum indicators to re-rate.
4) Support / Resistance zones
Support ~ 0.0792 | Resistance ~ 0.0816
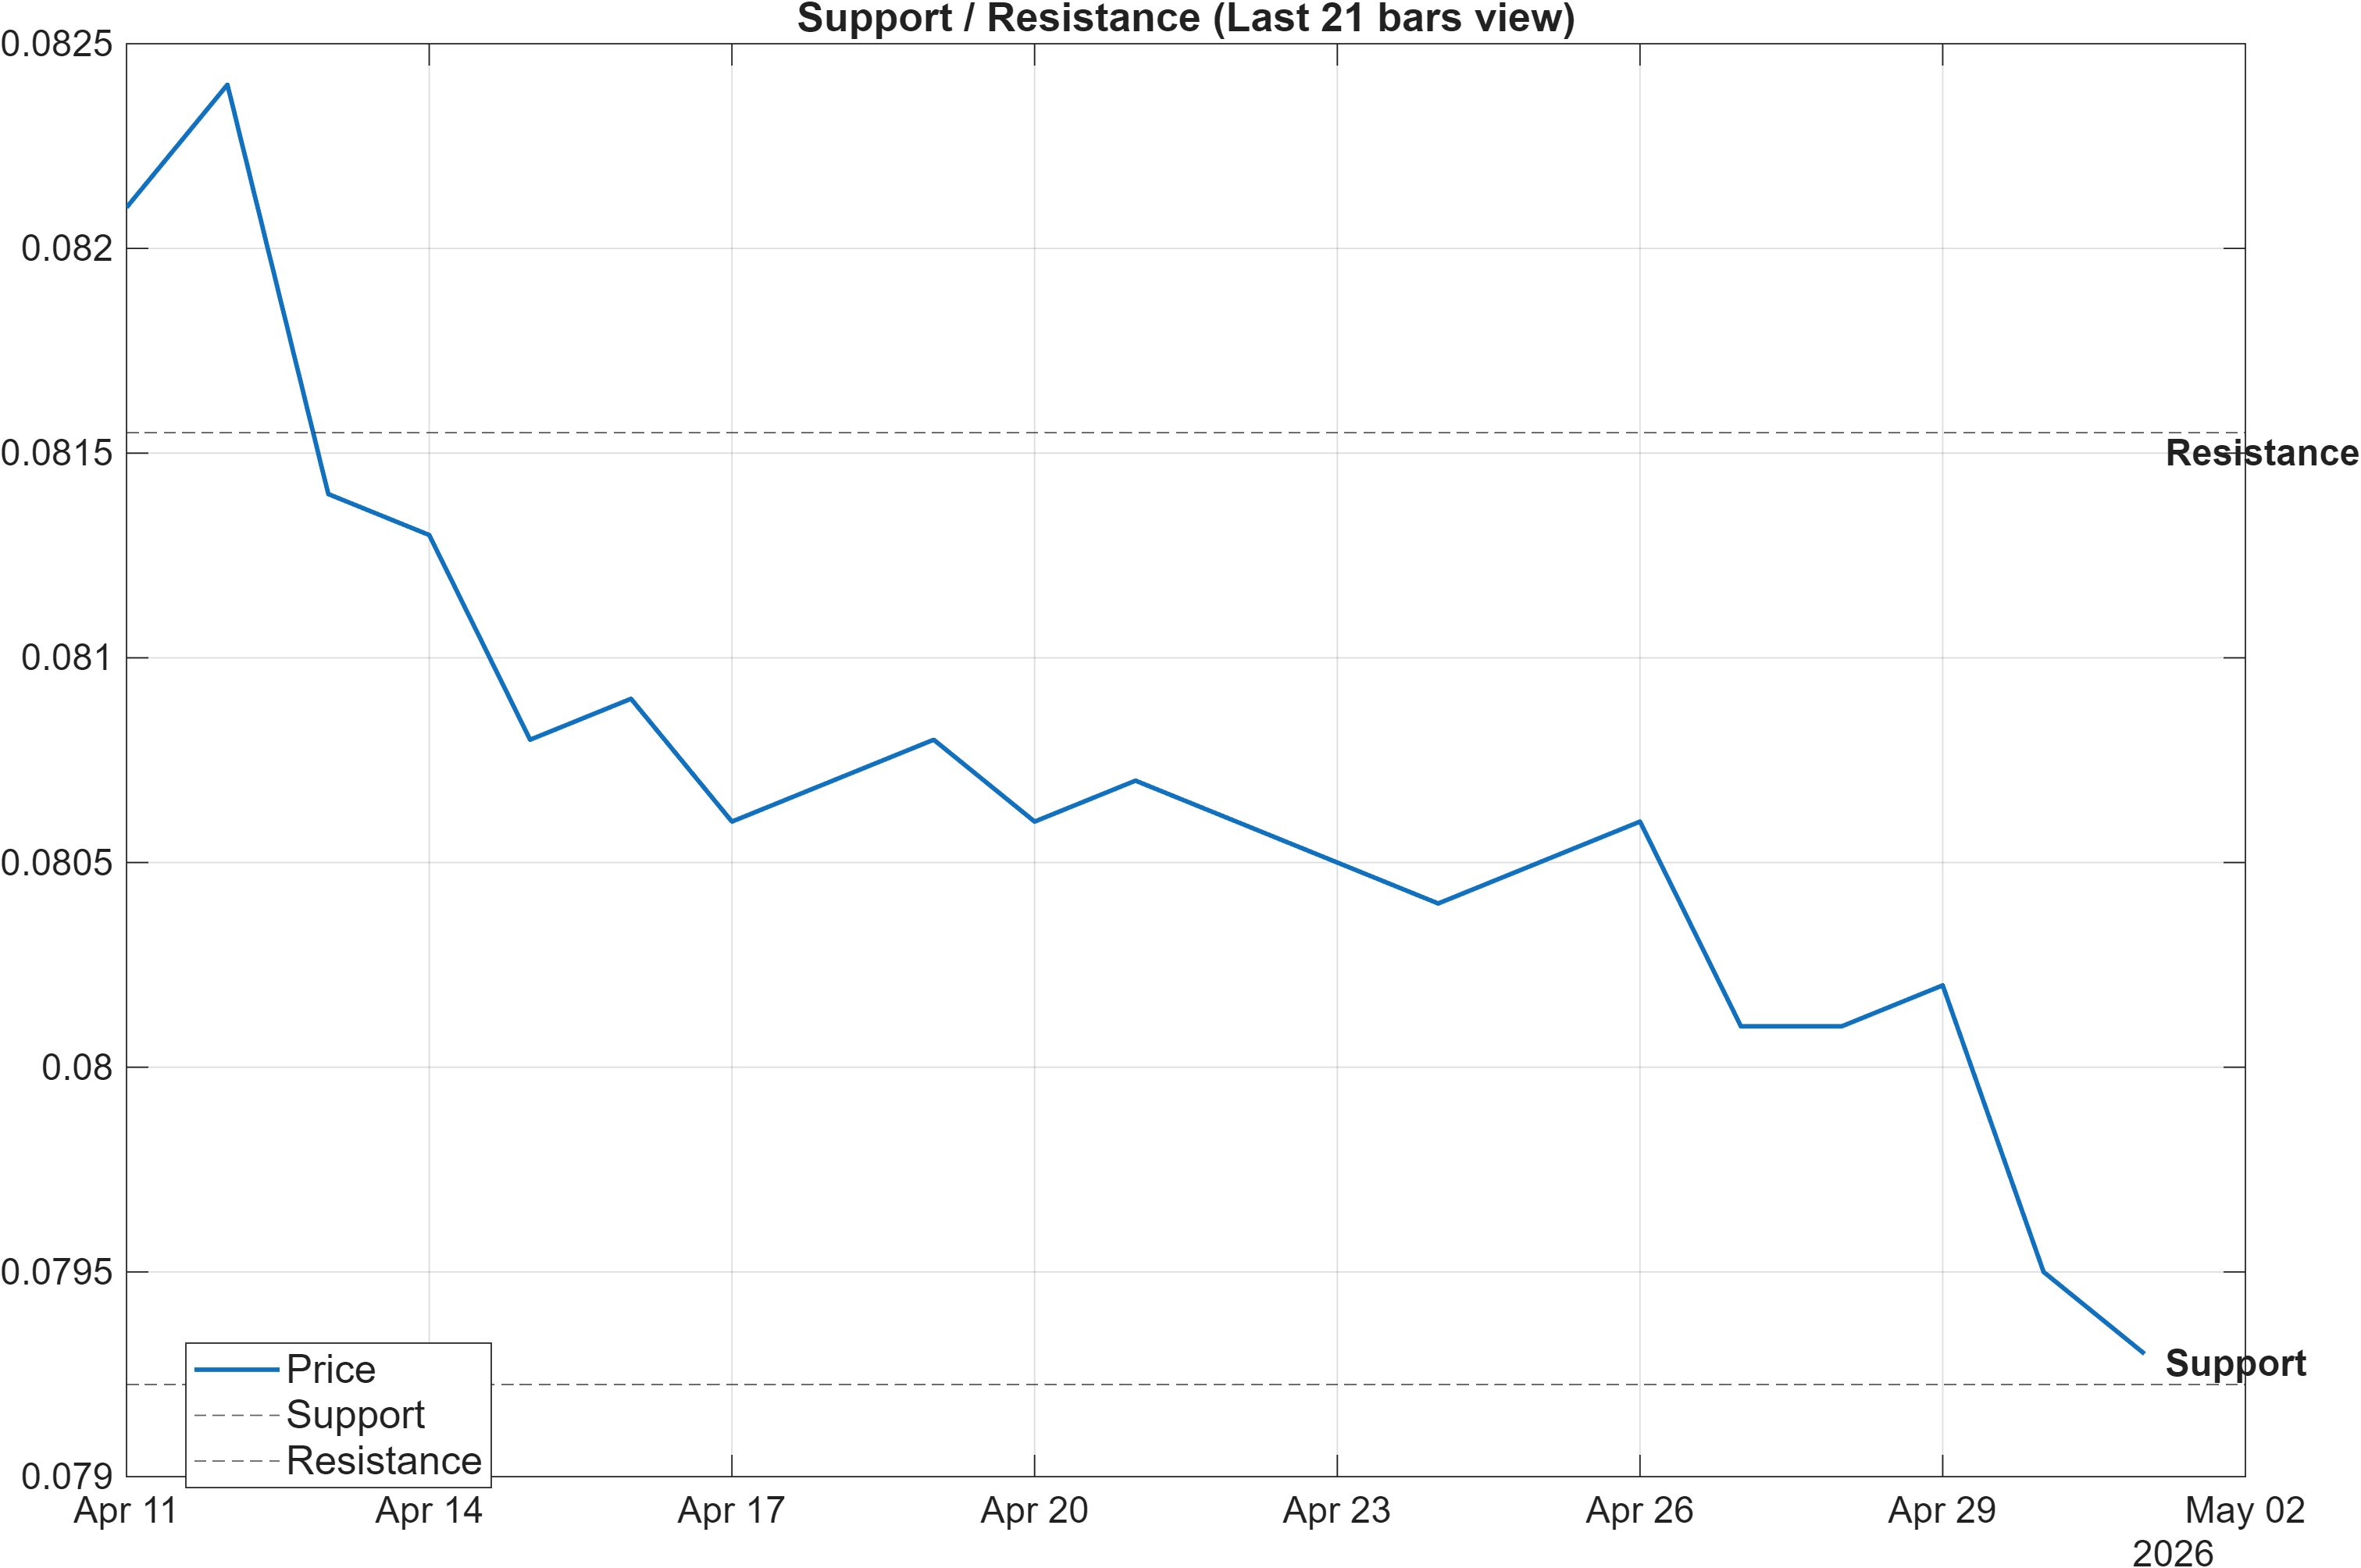
Scenario view: Break above resistance with volume → continuation. Close below support → signal deterioration risk.
Decision zones as regime tests (not price targets)
With volatility compressed (bandwidth 0.0326), the distance between the main decision zones—support near 0.0792 and resistance near 0.0816—becomes the primary framing tool. In a compressed regime, the market often “chooses” a direction via level violation rather than gradual trend drift, especially when the moving-average structure remains bearish (close < MA50; MA50 < MA200).
The support zone at 0.0792 functions as the key risk boundary for downside continuation. A close below support aligns with the report’s deterioration-risk framing and would be consistent with the short-horizon rank weakness (daily #823, weekly #787) and bearish blended technical score (-0.387). Under that path, oversold momentum (RSI 24) may not prevent incremental downside if sellers remain in control.
Resistance at 0.0816 is the nearer-term “stress test” for the bearish template. A credible reclaim would need more than an intraday probe; it would ideally coincide with improving participation/flow proxies and a shift in momentum tone. The indicator table shows several flow metrics sitting neutral (e.g., OBV slope(10) 0)—a backdrop that can make resistance breaks less durable unless confirmed by broader signal improvement.
Framed probabilistically: between 0.0792 and 0.0816, the market is effectively in evaluation mode. Outside that range, the probability of a regime shift (either renewed weakness or stabilization) rises, particularly given the low-bandwidth context.
5) Quant Technical Dashboard (18 Signals)
KGNAI AI Technical Analysis Score (Deep Reinforcement Learning): Rank #907 out of 954 (Rank 1 represents the strongest technical positioning and a higher probability of favorable price behavior. As ranks increase toward the maximum, the probability of favorable outcomes weakens and bearish positioning becomes more dominant.) | Label: Bearish | Score: -0.901
18-Signal Technical Confluence Score: -0.167 (Neutral)
Overall Technical Score (18-signal confluence + DRL rank blend): -0.387 (Bearish)
Note: The blended score reflects signal strength weighted against broader AI technical ranking, which may temporarily diverge.
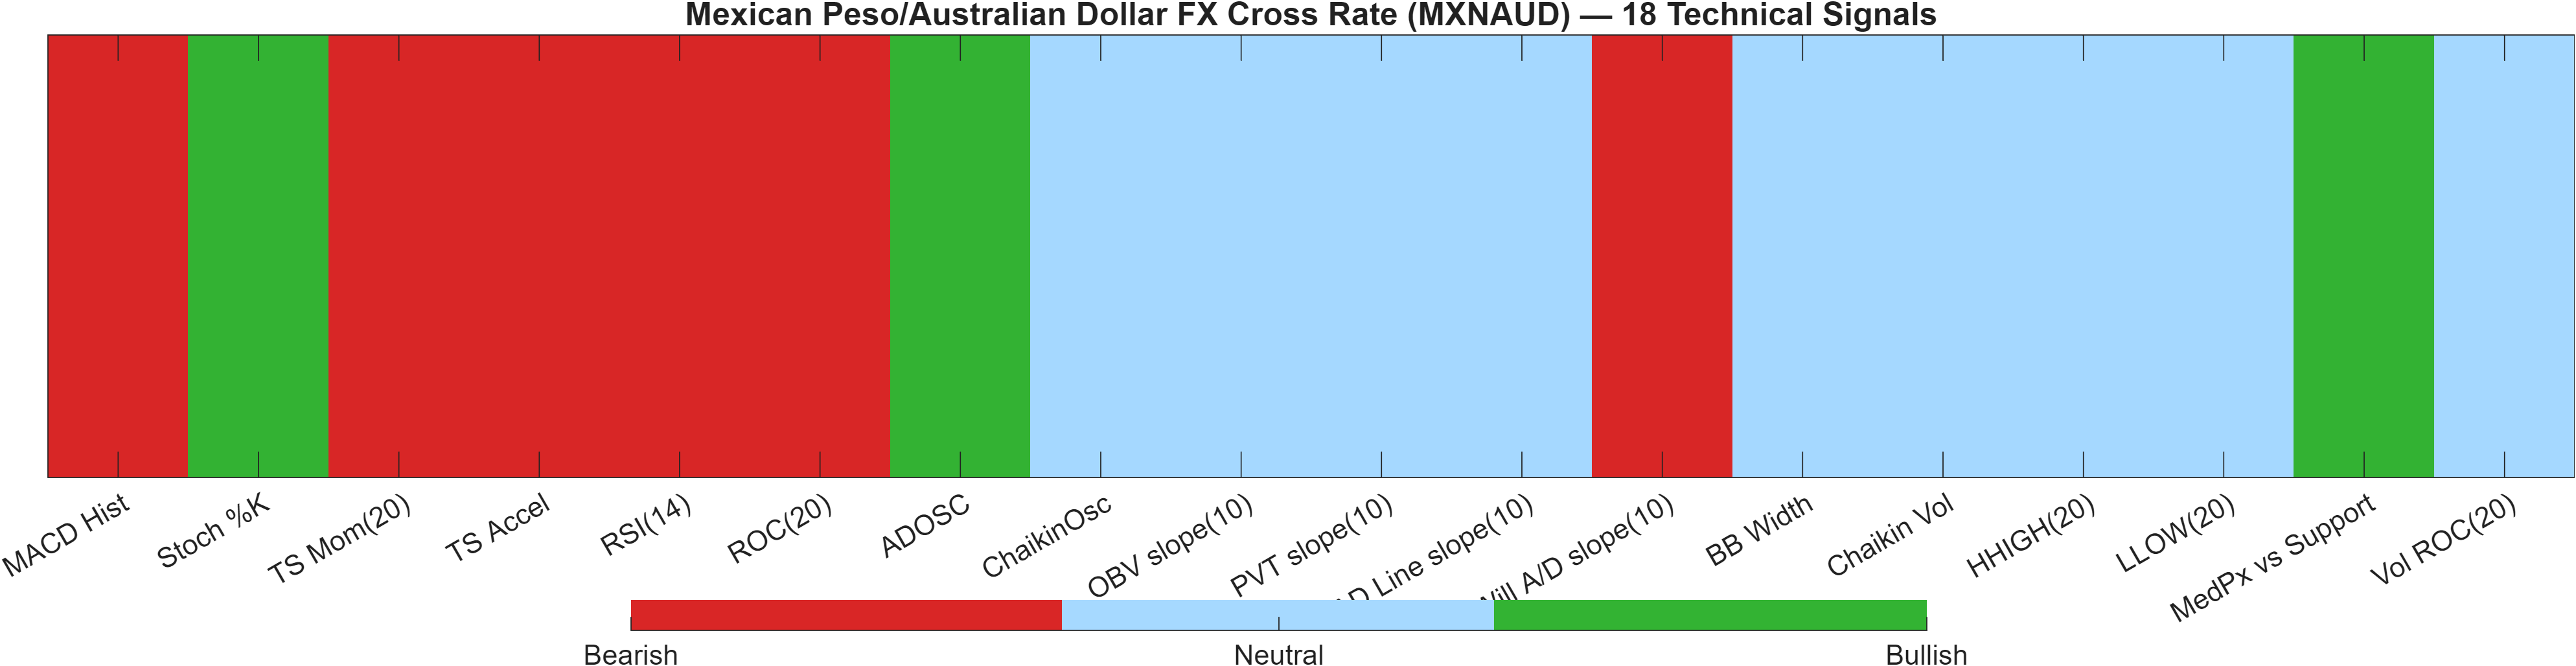
Blended technical score breakdown: -0.387 (Bearish | Bull 3 / Bear 6 / Neutral 9)
Confluence vs AI rank: a controlled divergence
The dashboard highlights a meaningful split: the 18-signal confluence score is -0.167, labeled Neutral, yet the blended overall technical score is -0.387, labeled Bearish. This divergence is largely explained by the DRL technical rank at #907 (score -0.901), which is positioned near the weakest end of the 954-instrument universe.
Interpreting that blend: indicator-level readings are not uniformly bearish (the breakdown shows Bull 3 / Bear 6 / Neutral 9), but the AI ranking layer is signaling that—relative to peers—the recent technical behavior has been persistently unfavorable. In other words, the market can look “less bad” on a subset of classical indicators while still ranking poorly when pattern/structure features are evaluated cross-sectionally.
Selected signal implications (momentum, mean reversion, and range state)
The table’s bearish momentum cluster (e.g., RSI(14) 24, ROC(20) -3.762, TS Mom(20) -0.0029) supports the bearish blended outcome. At the same time, the presence of a bullish Stoch %K (13.33) and a bullish MedPx vs Support reading (0.000325) fits with a market that may be hovering near a decision boundary rather than trending smoothly. The neutral volatility inputs (BB Width 0.03256) reinforce the “compression” label: the system is not seeing broad-based expansion even as downside bias persists.
Signal table (Bull/Bear/Neutral)
| Indicator | Value | Signal |
|---|---|---|
| MACD Hist | -0.0001381 | Bearish |
| Stoch %K | 13.33 | Bullish |
| TS Mom(20) | -0.0029 | Bearish |
| TS Accel | -0.0047 | Bearish |
| RSI(14) | 24 | Bearish |
| ROC(20) | -3.762 | Bearish |
| ADOSC | 50 | Bullish |
| ChaikinOsc | 0 | Neutral |
| OBV slope(10) | 0 | Neutral |
| PVT slope(10) | 0 | Neutral |
| AD Line slope(10) | 0 | Neutral |
| Will A/D slope(10) | -0.0014 | Bearish |
| BB Width | 0.03256 | Neutral |
| Chaikin Vol | -12.91 | Neutral |
| HHIGH(20) | 0.0827 | Neutral |
| LLOW(20) | 0.0793 | Neutral |
| MedPx vs Support | 0.000325 | Bullish |
| Vol ROC(20) | — | Neutral |
Interpretation: Indicator-level signals form the base confluence, which is then adjusted using a separate AI-driven technical ranking model. The final technical score summarizes this combined view.
6) News sentiment + extractive gist
Note: Instrument-specific news matches were not found, so the digest includes broader market/sector headlines. Links are provided for verification.
Sentiment score (avg): 0.013 | Positive: 12% | Neutral: 81% | Negative: 6%
KGNAI AI News Sentiment Score (normalized -1 to +1): Not available (as of —) | Label: Not available | Overall news score: 0.01
Positive Developments
Recent coverage across major financial outlets indicates a modestly constructive tone centered on selective risk appetite in parts of G10 FX and on tactical stabilization in related crosses. The aggregate sentiment distribution—12% positive and an average score of 0.013—does not imply a strong pro-risk surge, but it does suggest that outright negative narratives are not dominating the broader tape. For MXNAUD specifically, this backdrop can matter indirectly through correlation channels: when risk conditions are steady, oversold technicals (RSI(14) at 24) can translate into short-lived mean reversion rather than immediate trend continuation. The key is whether constructive tone coincides with a technical reclaim of nearby resistance (0.0816) or whether it remains “macro-noise” while the cross stays below trend-defining averages (close vs MA50 bearish; MA50 vs MA200 bearish).
Neutral / Mixed Developments
The dominant feature of the news read-through is neutrality: 81% of items are classified neutral, consistent with a market environment where positioning and technical structure can outweigh headline flow for short intervals. This aligns with the technical characterization of compression (Bollinger bandwidth 0.0326), where markets can remain range-bound even when directional trend templates are bearish. In this setting, mixed narratives often amplify sensitivity to levels rather than generating sustained follow-through. For MXNAUD, that suggests the most relevant “news impact” may be second-order—shaping intraday volatility—while the more durable signal still comes from whether price holds above 0.0792 or breaks below it.
Negative / Risk Signals
Risk signals appear present but limited in breadth: negative classifications are only 6%, yet the content mix reflects intermittent risk-off concerns that can tighten liquidity and increase FX cross volatility. In a low-bandwidth regime (0.0326), even small increases in volatility can lead to sharper moves through local support/resistance. That matters because MXNAUD’s short-horizon ranks are weak (daily #823, weekly #787), and the blended technical score is bearish (-0.387)—a configuration that can make downside breaks more “accepted” by the tape when risk sentiment deteriorates. If risk tone worsens while MACD histogram remains negative (-0.0001), a close below 0.0792 would be consistent with the system’s deterioration-risk scenario.
- Whether price acceptance develops beyond 0.0816 resistance or fails quickly back into the range.
- Whether downside probes produce a close below 0.0792, aligning with bearish ranks and blended technical score.
- Whether volatility expands from the current compressed state (bandwidth 0.0326), increasing breakout risk.
Sources referenced: Reuters, Bloomberg, Yahoo Finance, MarketWatch, Investing.com
7) Sources
Not available in the provided data.
You may also like: How KGNAI AI ranks instruments across global markets
Disclaimer: KGNAI provides AI-generated analytics and educational market commentary only. This is not financial advice. Markets involve risk. Always do your own research.