
CLFEUR (CLF/EUR) — 25-Feb-2026 Technical Alignment Improves, Longer-Horizon Rank Drag Persists
CLF/EUR (CLFEUR) is showing a clearer near-term technical improvement while remaining split across horizons in KGNAI’s cross-sectional ranking framework. In the ranked universe of 958 instruments, the daily rank (#11) sits in the top decile, but the monthly (#938) and 3‑monthly (#917) placements remain in the lower tail—an internal tension that often appears during regime transitions. On price structure, the moving-average configuration is supportive (Close vs MA50 = Bullish; MA50 vs MA200 = Bullish), while momentum reads as restrained rather than extended (RSI(14) = 52) despite a positive MACD histogram (0.0060). Volatility is present but not extreme, with Bollinger bandwidth 0.0153. Key decision zones are defined by support ~37.4052 and resistance ~39.1820, with news sentiment broadly neutral (avg -0.002) due to limited instrument-specific matches in the provided feed.
- Rank stance (Short / Mid / Long): Mixed with a bullish tilt (Daily/Weekly bullish; Monthly/3‑Monthly bearish; 6‑Monthly bullish).
- Technical confluence: Bullish (18-signal confluence 0.333; blended overall technical score 0.457).
- Key levels: Support 37.4052 | Resistance 39.1820.
- News sentiment bias: Neutral (avg -0.002; 75% neutral).
- Confirmation / invalidation: Continuation improves on acceptance above 39.1820; deterioration risk increases on a close below 37.4052.
KGNAI evaluates assets using large cross-sectional datasets built from millions of structured data points. Inputs incorporate fundamental metrics, technical structures, and systematically processed news sentiment. Statistical models, machine learning, and AI frameworks are used to assess relative positioning, signal alignment, and probabilistic behavior across broad universes.
- Ranks are comparative across the tracked universe, not absolute price targets.
- Confluence reflects alignment among independent signal groups.
- Support/resistance levels are probabilistic decision zones, not guarantees.
- Sentiment provides contextual bias within the broader analytical framework.
1) KGNAI AI Analysis
Region: FOREX
Total universe size: 958 ranked instruments
- Daily rank: #11 out of 958 — Bullish
- Weekly rank: #95 out of 958 — Bullish
- Monthly rank: #938 out of 958 — Bearish
- 3-Monthly rank: #917 out of 958 — Bearish
- 6-Monthly rank: #44 out of 958 — Bullish
- Yearly rank: Not available for this horizon — Not available
The rank profile is best read as timeframe dispersion: strong near-term placement alongside weak intermediate horizons. A #11 daily rank and #95 weekly rank imply CLFEUR is currently screening well versus peers—often consistent with improving trend structure or favorable short-run factor exposure. However, the #938 monthly and #917 3‑monthly ranks sit near the bottom of the 958-instrument universe, indicating that the broader multi-month behavior set still maps to a comparatively weaker regime.
The #44 6‑monthly rank adds nuance: it suggests the weakness is not uniform across all longer horizons, and that the instrument may be cycling from a previously stronger longer-horizon state into a choppier medium-term phase—or that the most recent short-term improvement is beginning to repair longer-run characteristics.
KGNAI ranks each instrument across large universes using multiple proprietary AI tests and statistical models (millions of data points). Lower ranks generally indicate stronger probability of favorable performance behavior, while higher ranks indicate weaker probability and more bearish positioning.
Term view: Short-term: Bullish. Mid-term: Bearish. Long-term: Bullish. This configuration favors discipline around confirmation: when short-term ranks lead while monthly ranks lag, follow-through often matters more than the initial breakout attempt.
Want the full universe and complete rank tables? Unlock full access on KGNAI: https://www.kgnai.com/pricing
2) Price & trend overview
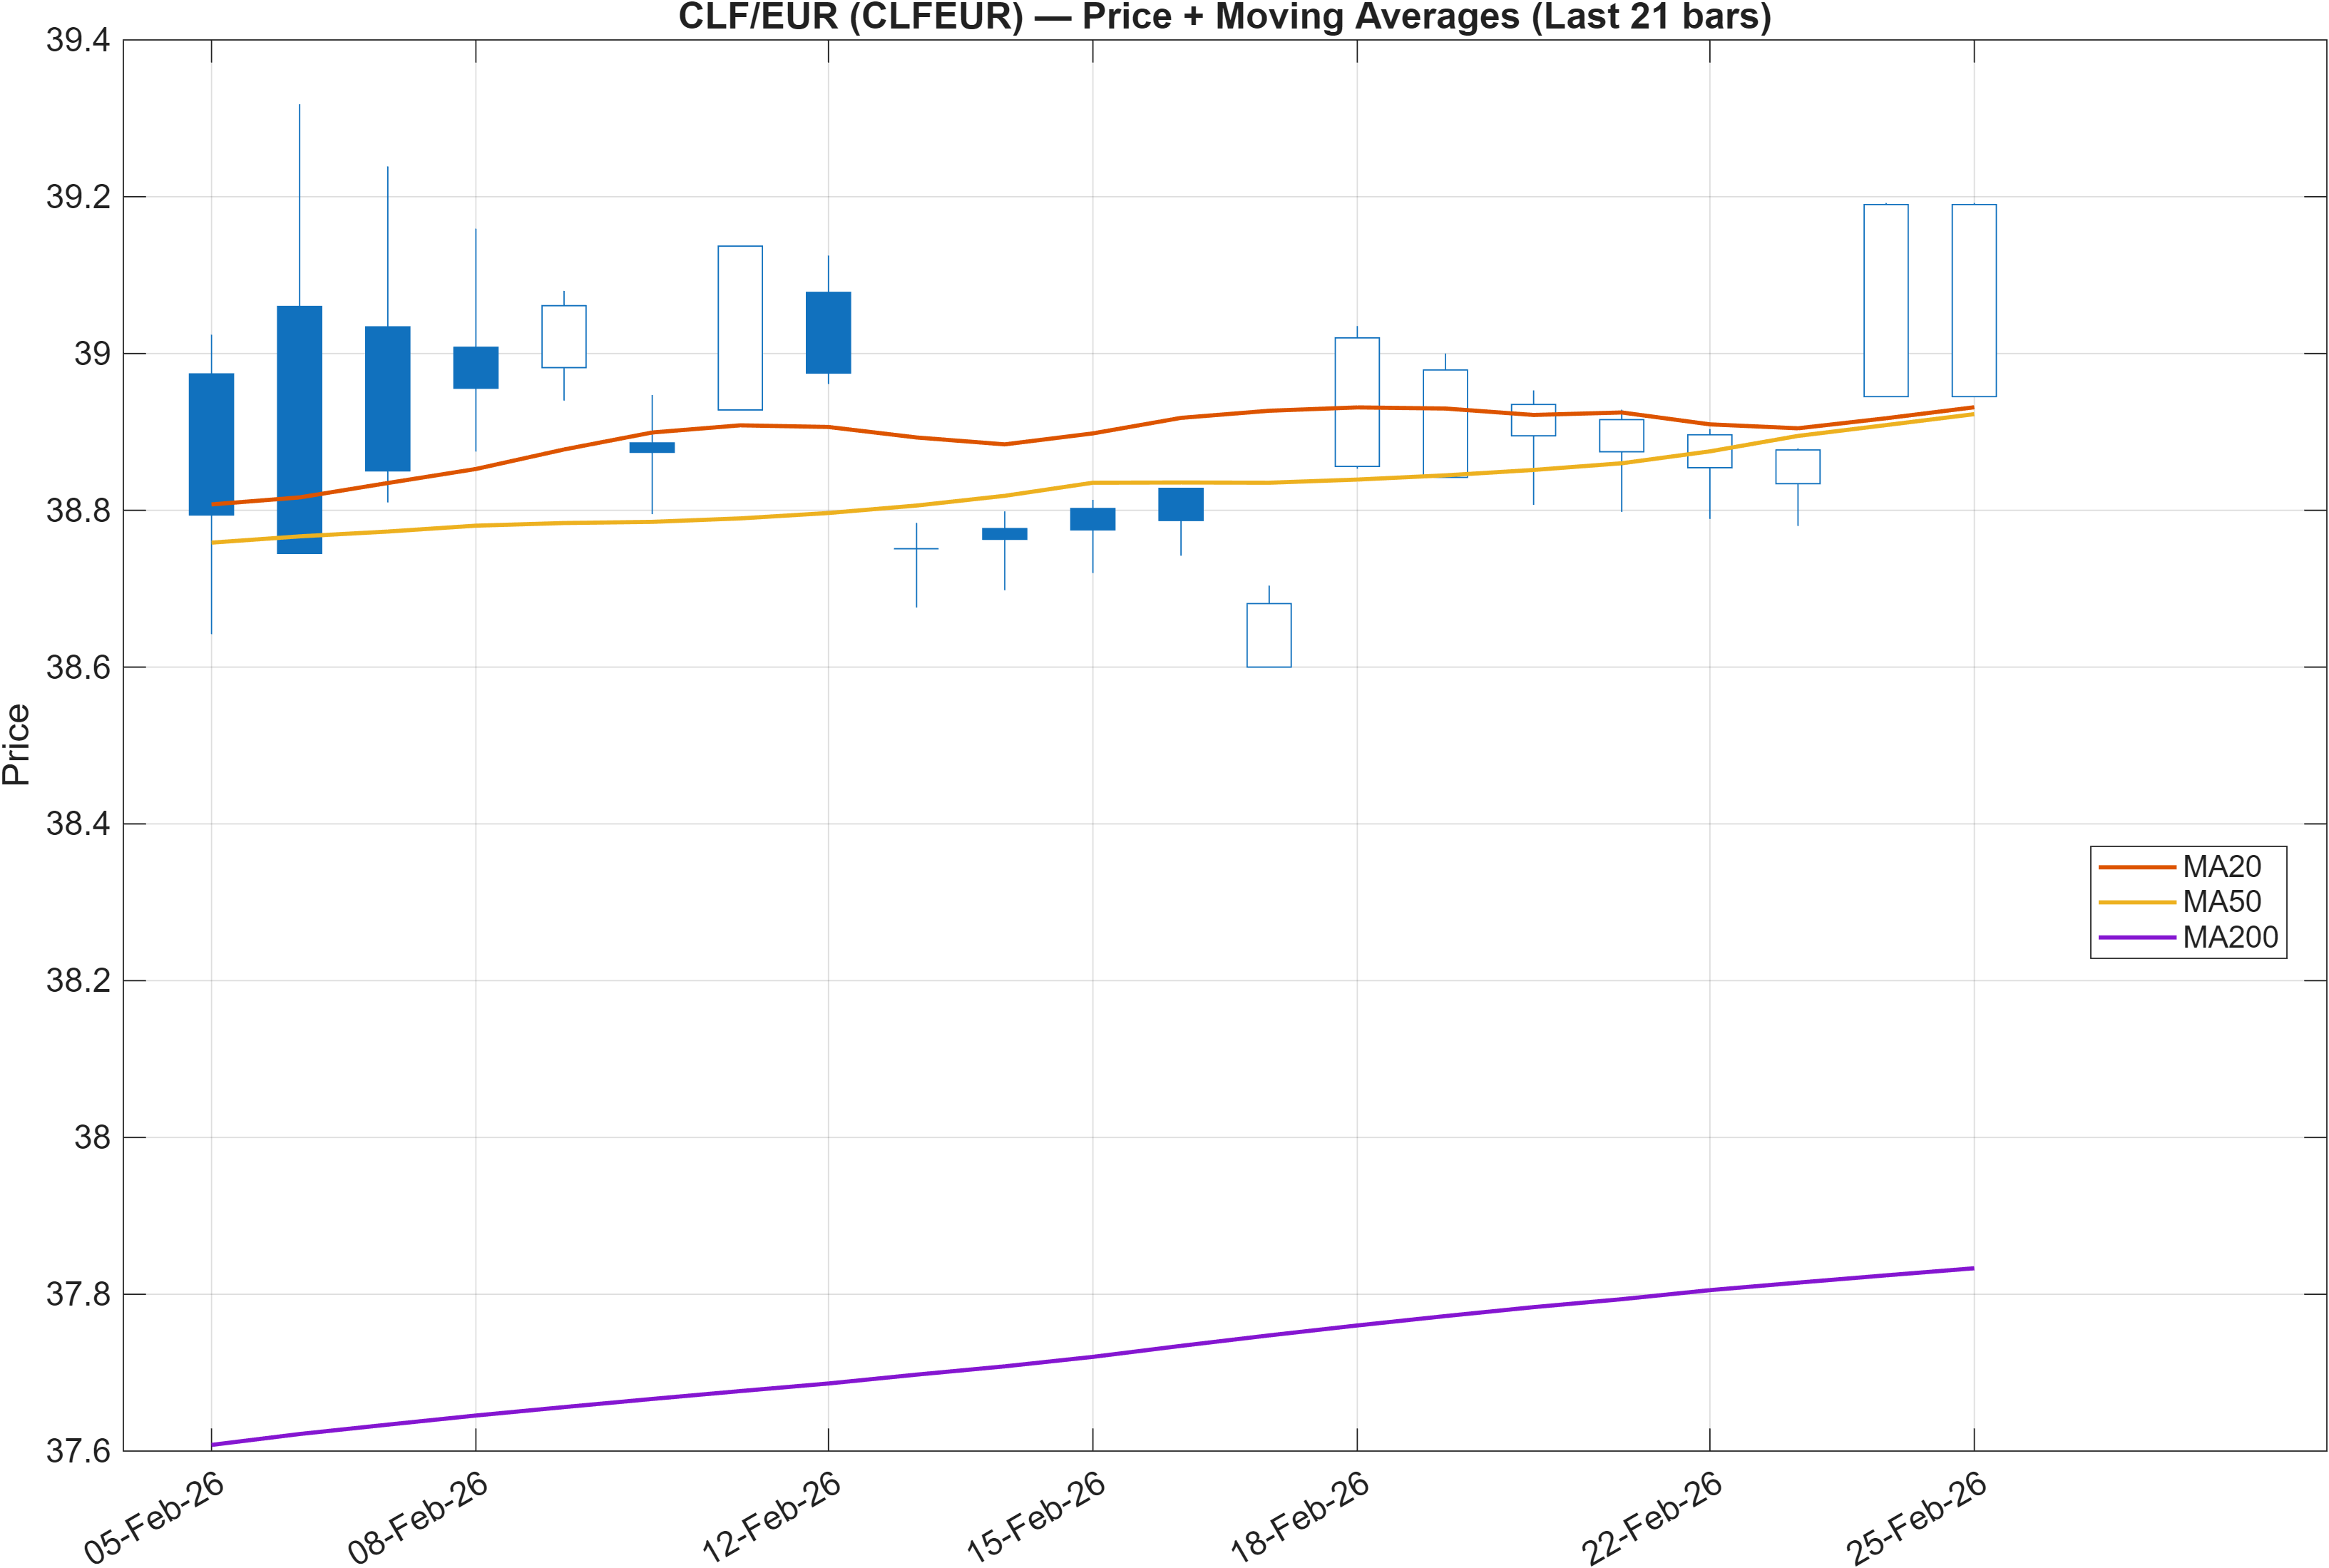
The trend picture is constructive from a classic market-structure perspective: Close vs MA50 = Bullish and MA50 vs MA200 = Bullish. This combination typically reflects both improving short-run direction and a supportive longer baseline, reducing the probability that strength is purely a mean-reversion bounce. In other words, the moving-average “stack” suggests the market is leaning toward trend continuation rather than immediate reversion.
The key analytical tension is whether this price/MA alignment can overcome the medium-horizon rank drag implied by monthly #938 and 3‑monthly #917. When ranks are weak at intermediate horizons, markets can still rally—but they often do so with more frequent pullbacks and tighter decision zones. That makes level-based validation more important than narrative.
Structurally, the nearby zones highlighted later—support ~37.4052 and resistance ~39.1820—become the practical anchors for trend evaluation. A market can “look bullish” on MA alignment yet still fail if it cannot hold above support during retracements or if it repeatedly rejects at resistance.
The current context therefore reads as a potential transition phase: trend signals are turning up, but the cross-sectional medium-term ranking still reflects the prior regime. Until the market demonstrates repeated acceptance above key levels, the trend case remains stronger on structure than on multi-month ranking confirmation.
Interpretation: Close vs MA50 = Bullish, MA50 vs MA200 = Bullish.
3) Momentum & volatility dashboard
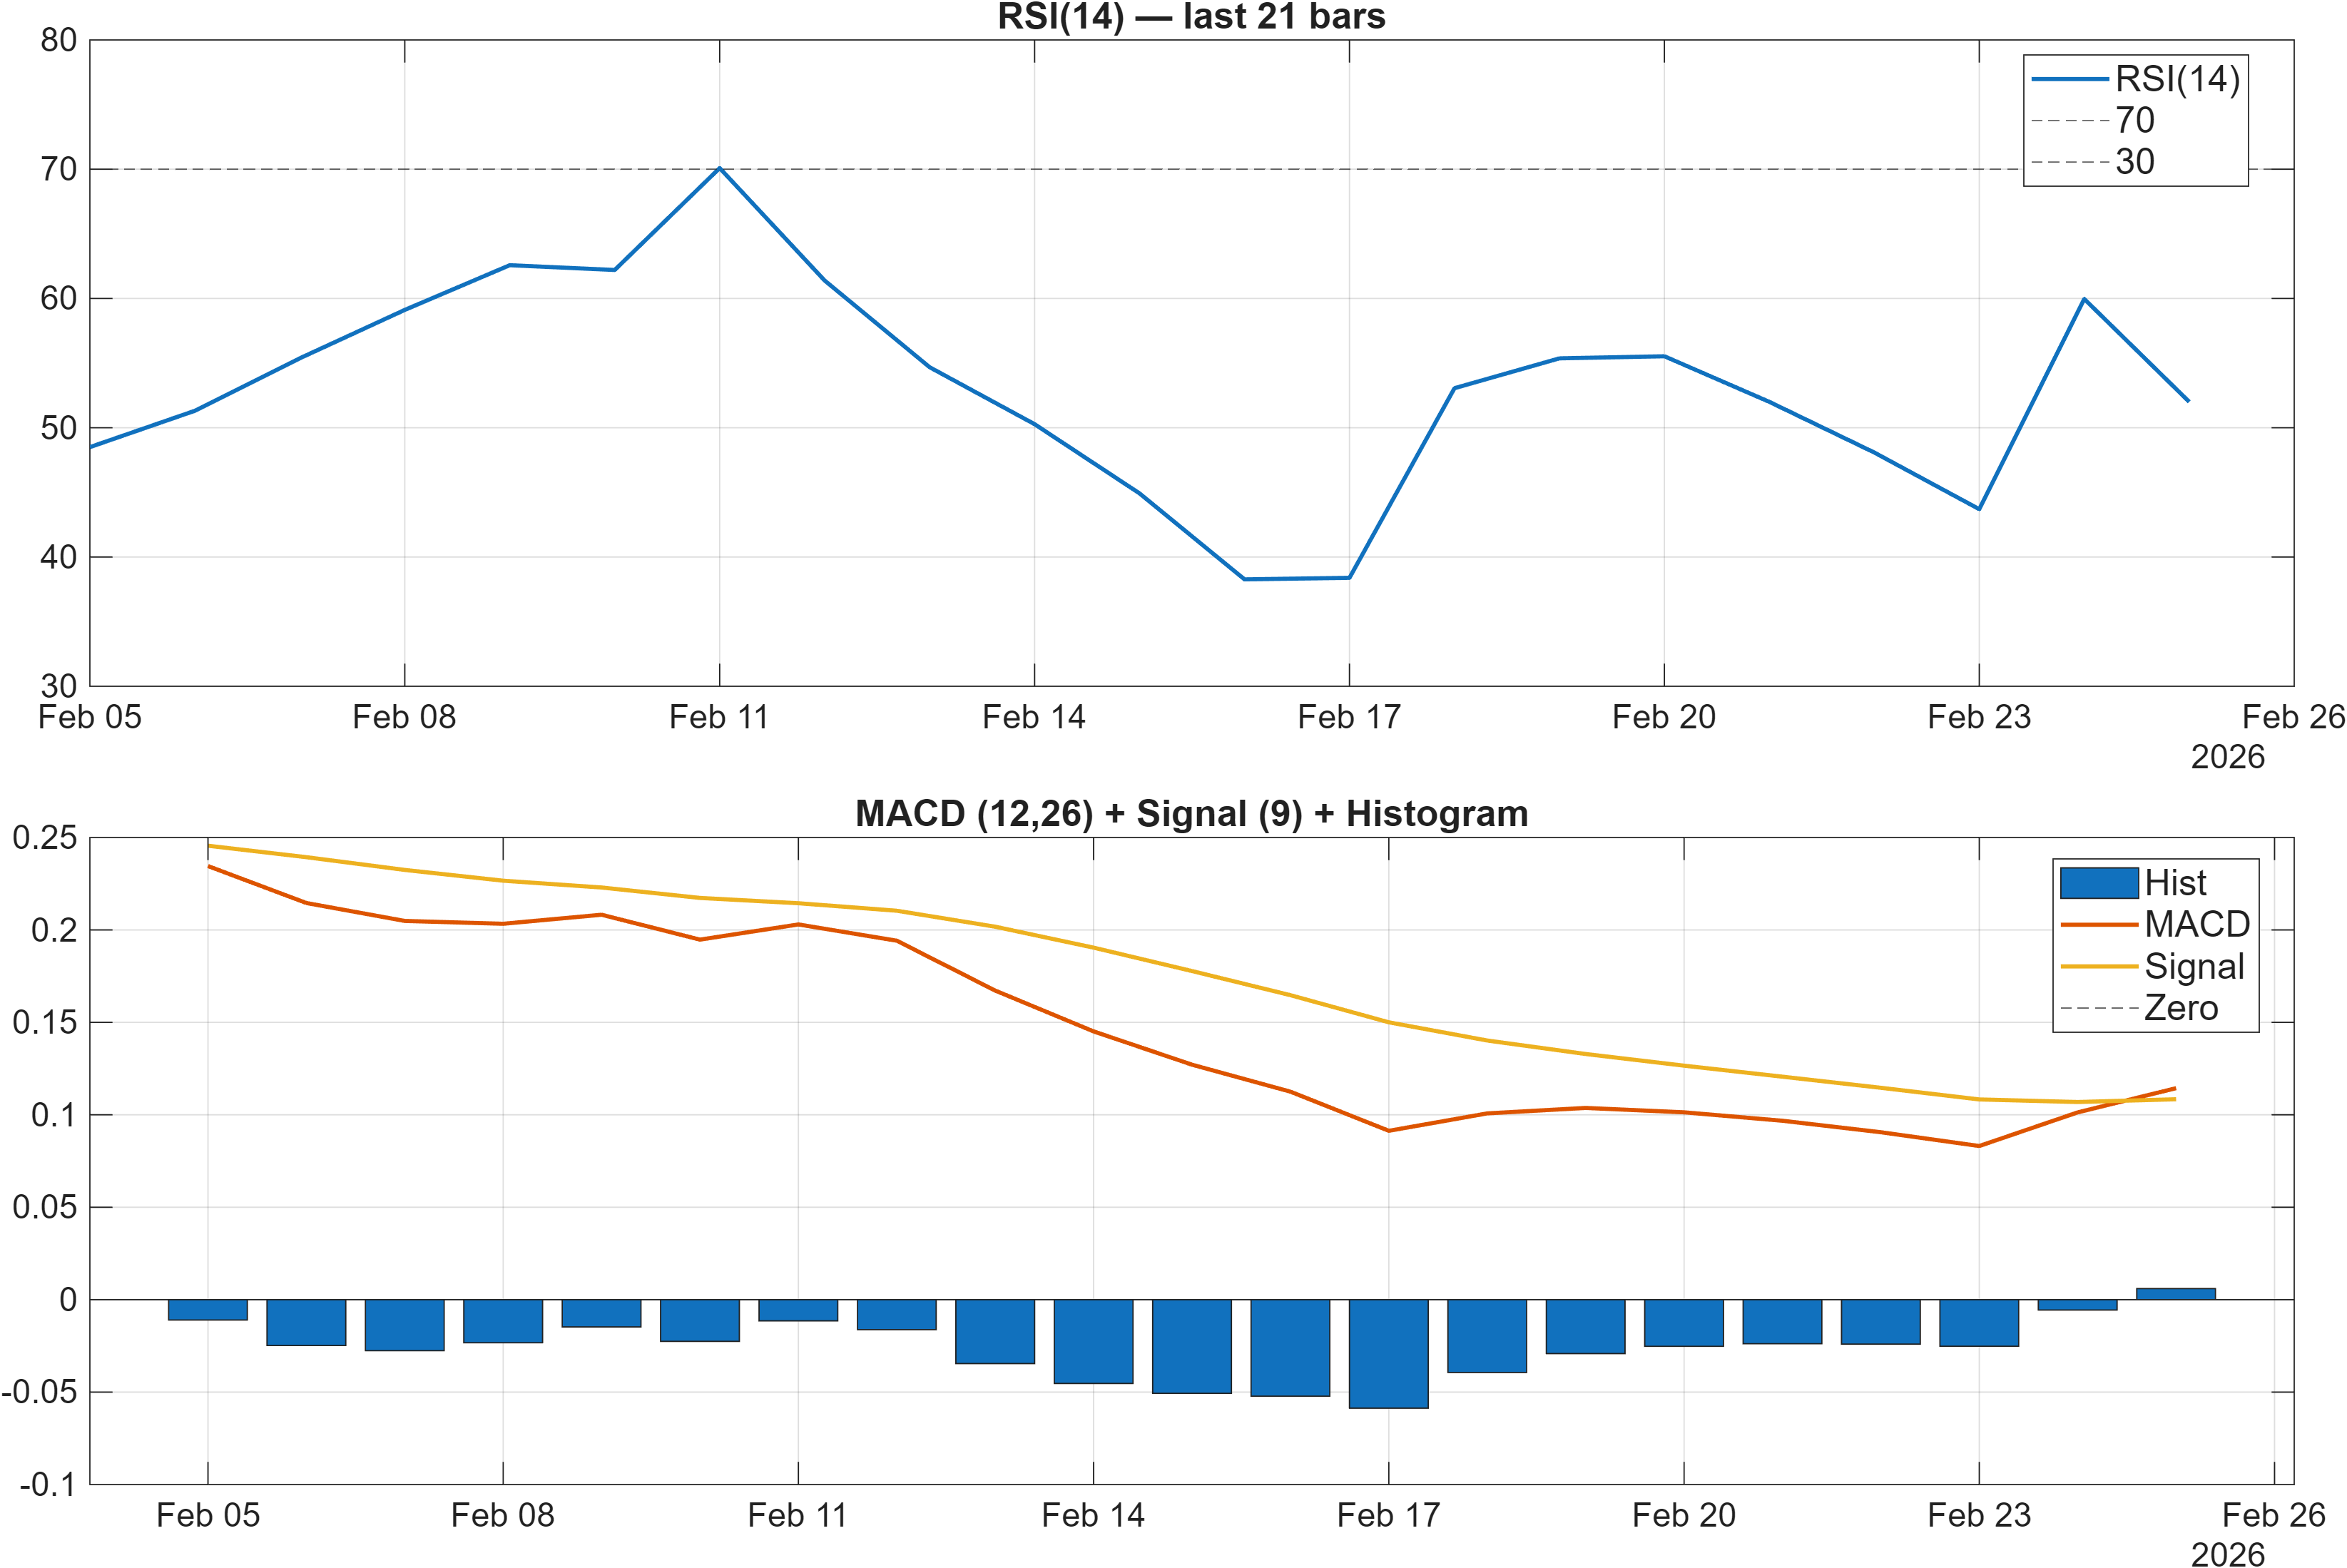
Momentum is sending a measured message rather than an overheated one. The RSI(14) = 52 sits in a neutral zone, which often indicates that price strength—if present—has not yet translated into a stretched oscillator state. That matters because it reduces the immediate “crowded” feel that typically accompanies late-stage impulses.
At the same time, trend-momentum is not absent: the MACD histogram at 0.0060 is positive, consistent with improving directional bias. In a market that already shows bullish moving-average alignment, a positive MACD histogram can function as a reinforcement signal—though its informational value is highest when it expands rather than stays narrowly positive.
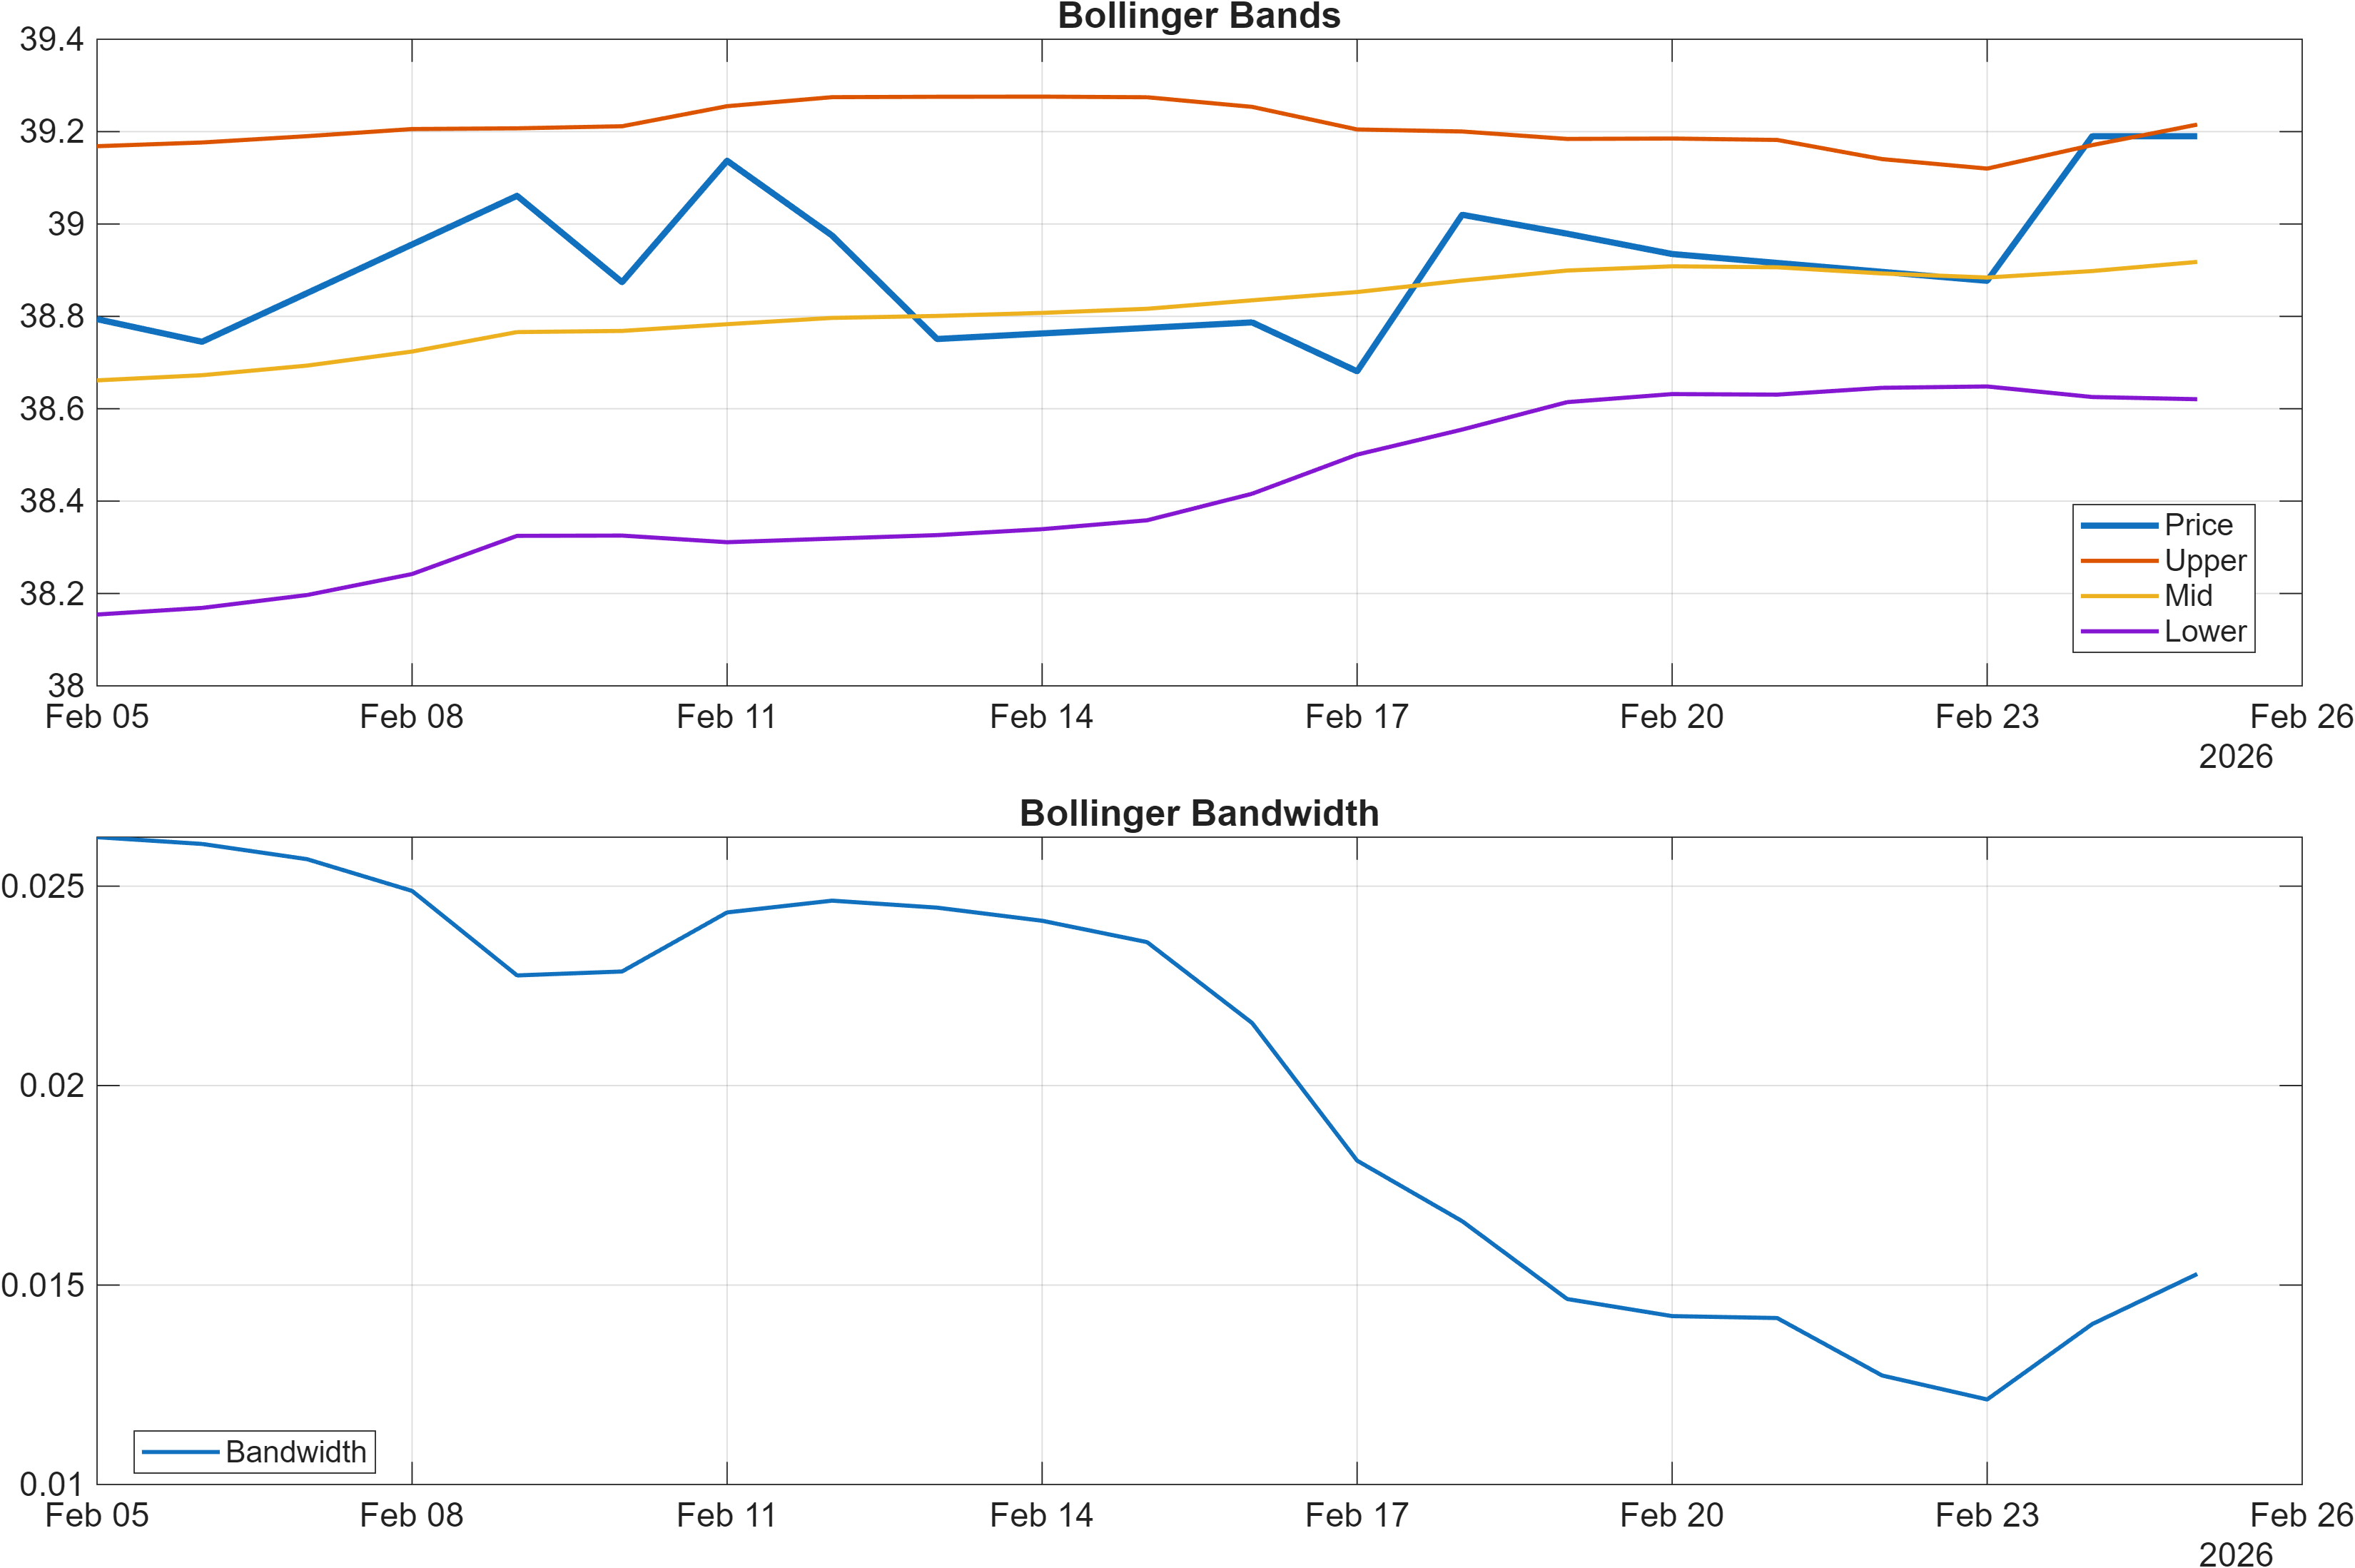
Volatility is present but not extreme, with bandwidth 0.0153 (and BB Width shown in the signal table at 0.01528). This is consistent with a market that can move, but is not necessarily in a fully expanded “breakout volatility” state. In practice, such a regime can support orderly continuation, but it can also allow for false starts if price tests resistance without a decisive volatility expansion.
The combined read is alignment with room to prove: bullish structure with neutral RSI and mildly positive MACD. The more the histogram and bandwidth expand together, the more the move resembles a persistent trend phase rather than a fragile drift.
Interpretation: RSI bias = Neutral, MACD hist = 0.0060.
Interpretation: Bandwidth (volatility regime) latest = 0.0153.
4) Support / Resistance zones
Support ~ 37.4052 | Resistance ~ 39.1820
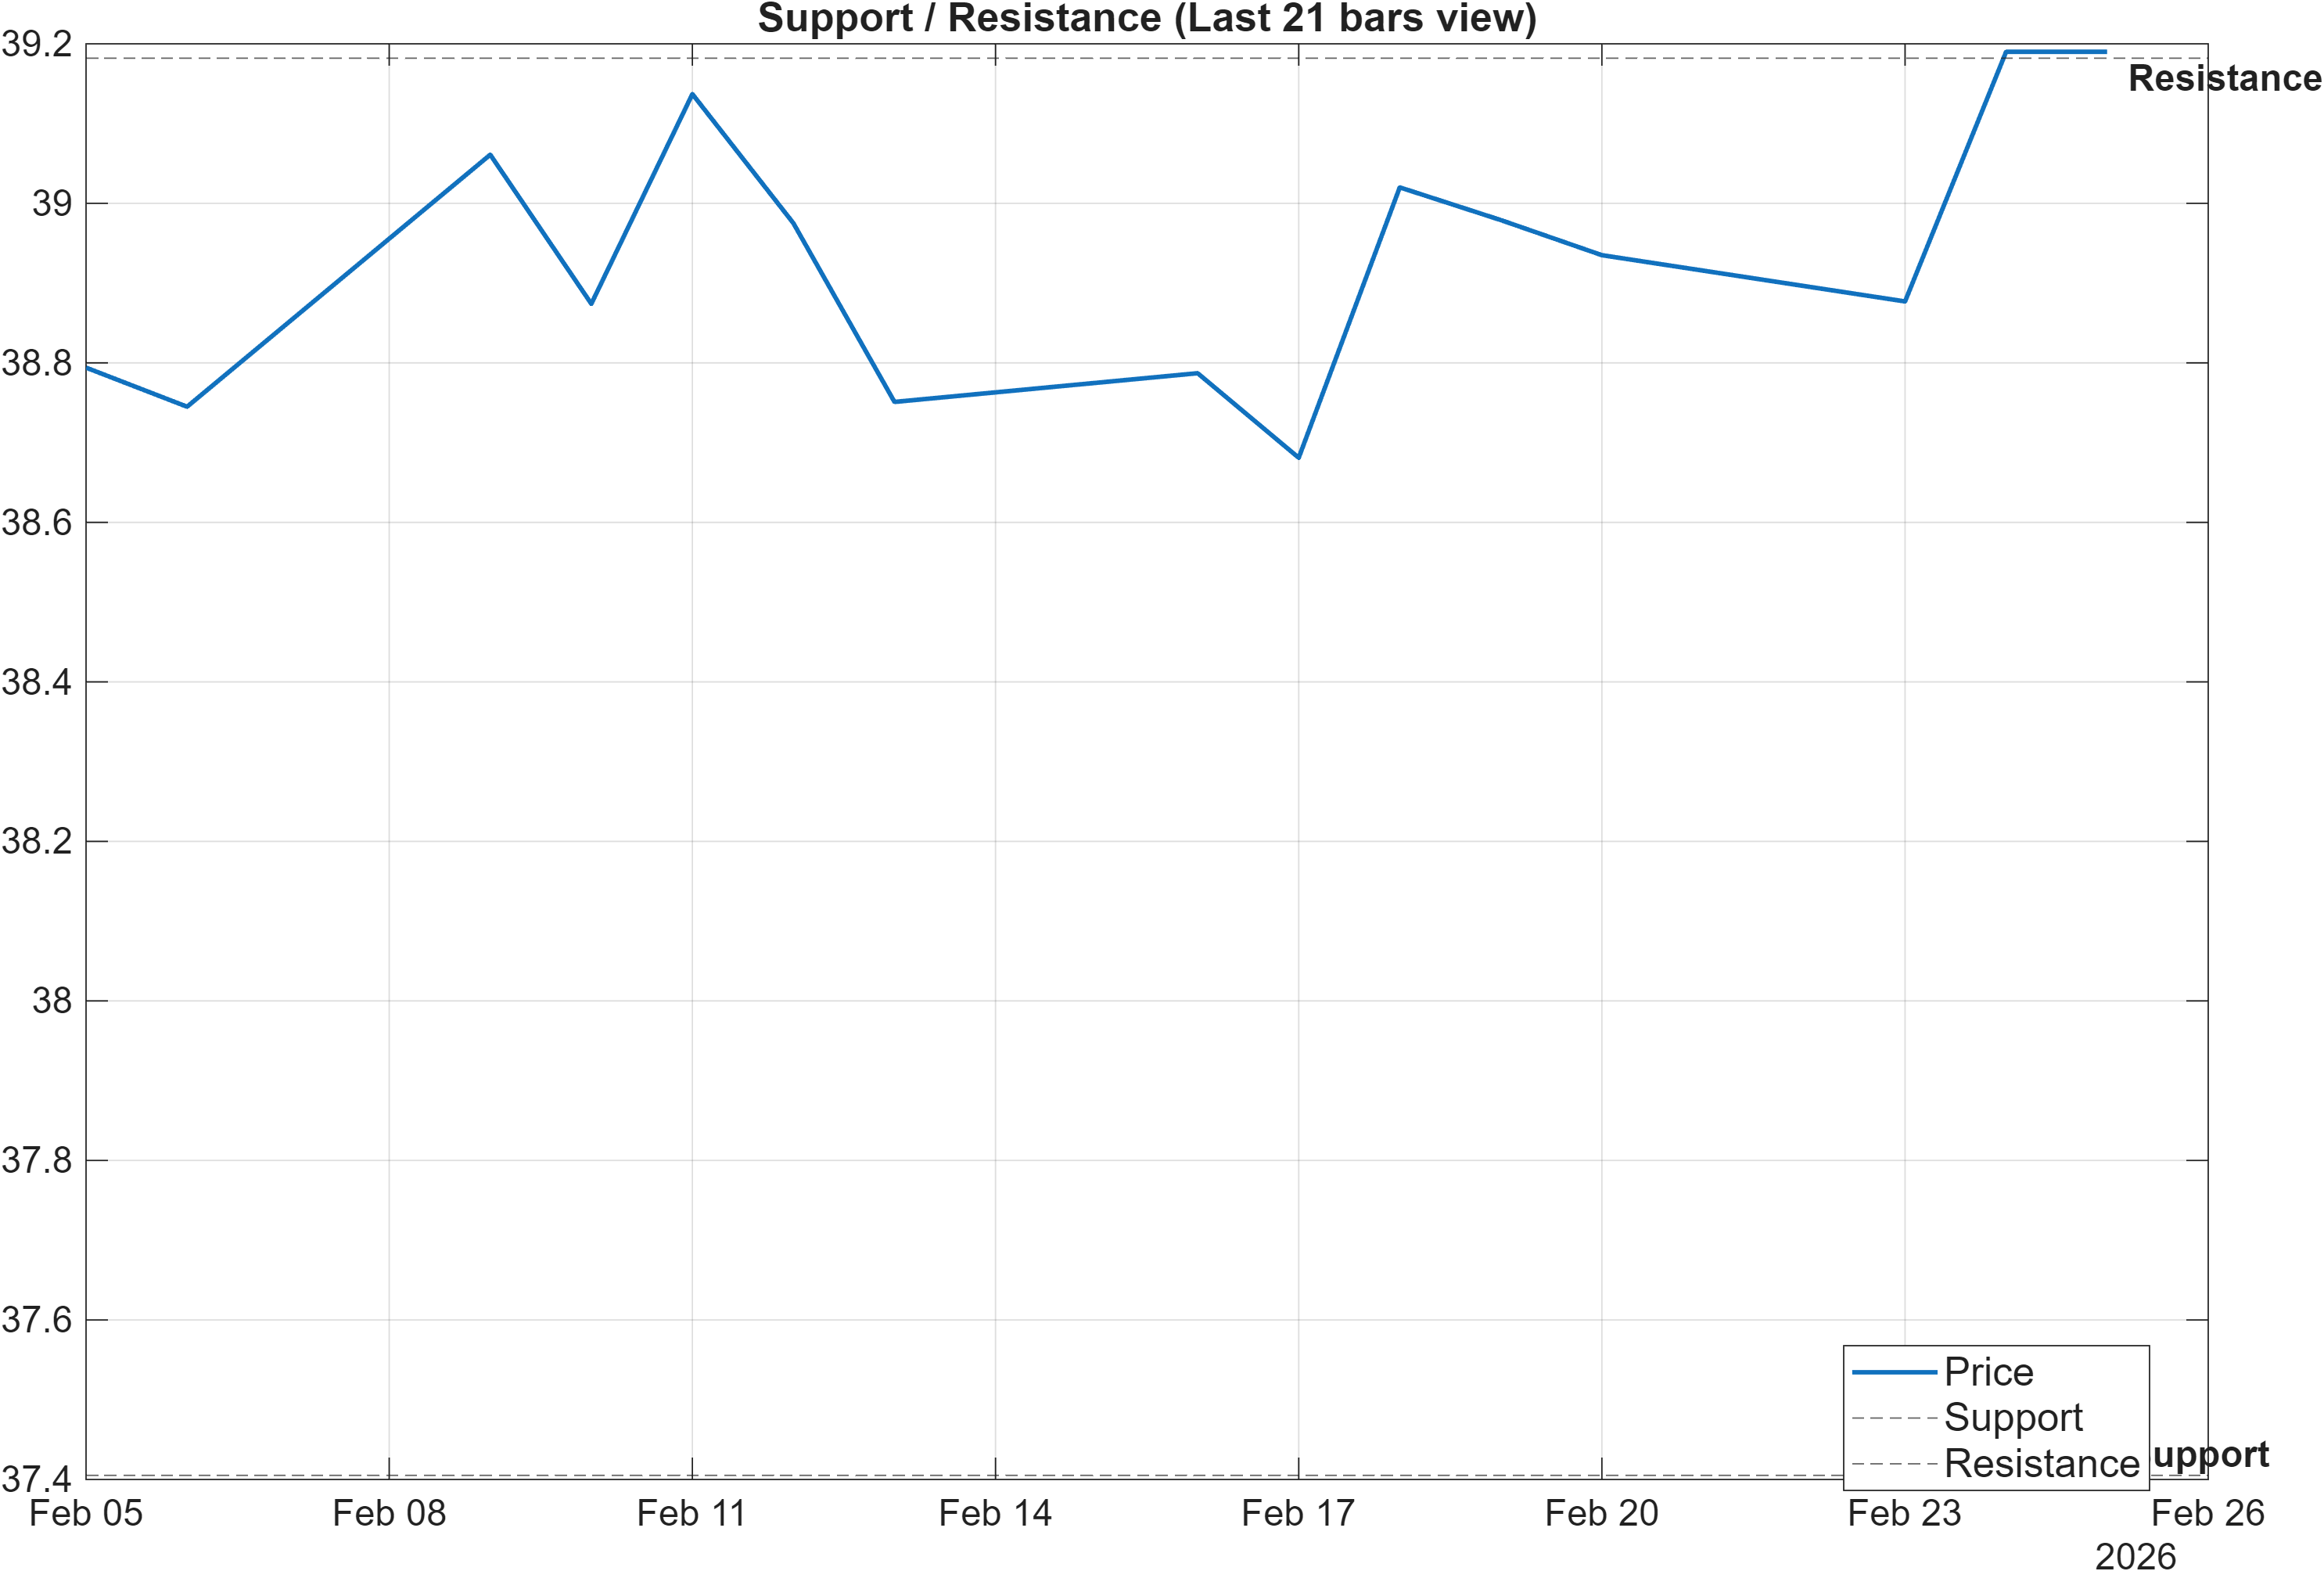
The current setup is level-driven: the distance between 37.4052 support and 39.1820 resistance frames a relatively tight decision corridor where acceptance or rejection can quickly shift the short-term risk profile. With the daily rank in the top decile (#11) and moving averages bullish, resistance becomes the primary “proof” level—less because it is a magic number and more because it tests whether demand is strong enough to convert improvement into continuation.
The risk case is equally well-defined. When intermediate-horizon ranks are weak (monthly #938, 3‑monthly #917), downside excursions can reappear abruptly if the market loses its structural footing. A close below 37.4052 would not only violate support but would also raise the probability that the recent bullish alignment is a temporary upswing within a broader choppy regime.
The most informative behavior is often how price reacts after the first test of resistance or support. Repeated tests with diminishing follow-through can indicate signal exhaustion, whereas a clean break with sustained trading above resistance is more consistent with regime continuation—particularly if accompanied by expanding momentum (MACD histogram) and a non-complacent volatility posture (bandwidth).
Scenario view: Break above resistance with volume → continuation. Close below support → signal deterioration risk.
5) Quant Technical Dashboard (18 Signals)
KGNAI AI Technical Analysis Score (Deep Reinforcement Learning): Rank #122 out of 958 (Rank 1 represents the strongest technical positioning and a higher probability of favorable price behavior. As ranks increase toward the maximum, the probability of favorable outcomes weakens and bearish positioning becomes more dominant.) | Label: Bullish | Score: 0.745
18-Signal Technical Confluence Score: 0.333 (Bullish)
Overall Technical Score (18-signal confluence + DRL rank blend): 0.457 (Bullish)
Note: The blended score reflects signal strength weighted against broader AI technical ranking, which may temporarily diverge.
Blended technical score breakdown: 0.457 (Bullish | Bull 8 / Bear 2 / Neutral 8)
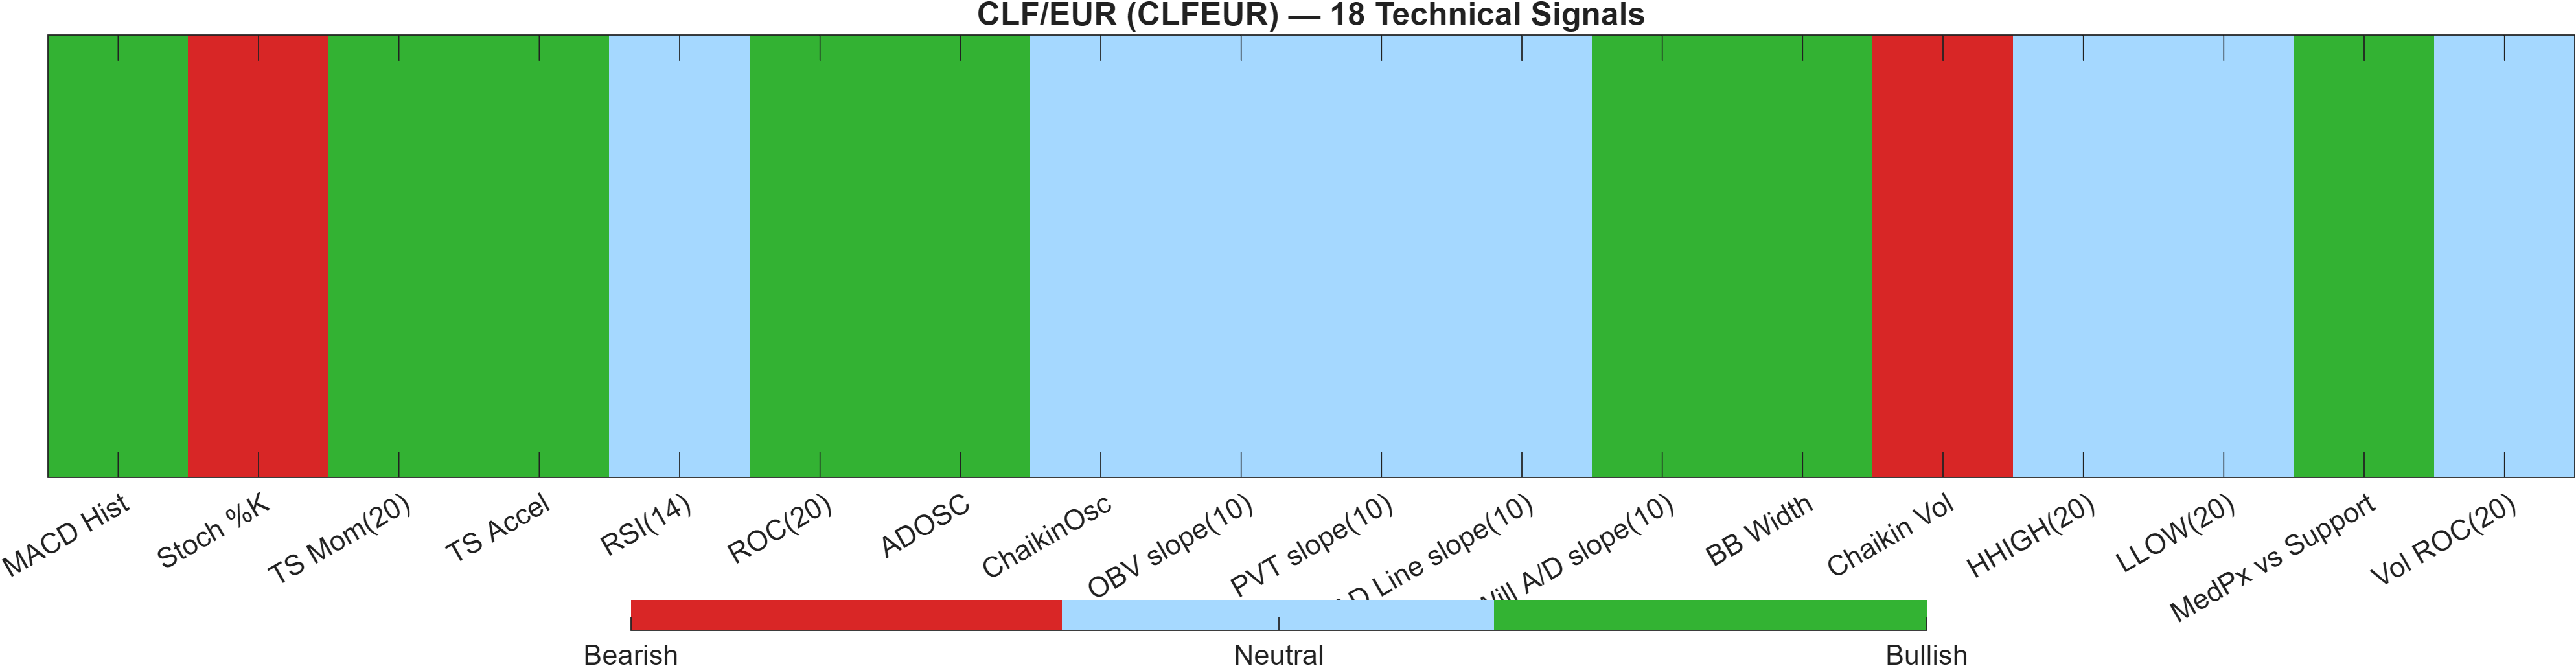
The technical dashboard is notable for broad but not unanimous alignment. The 18-signal confluence is 0.333 (Bullish), and the blended overall technical score is 0.457 (Bullish), with a balanced distribution (Bull 8 / Bear 2 / Neutral 8). This mix often appears when trend direction improves but participation/confirmation signals are still catching up—especially relevant given the rank dispersion across timeframes.
The AI technical rank from the DRL model is #122 out of 958 with a 0.745 score (Bullish), which places the instrument in a relatively strong comparative technical bucket even though the confluence score is only moderately positive. Interpreting the blend: the model is assigning meaningful weight to the broader technical positioning versus peers, while the indicator stack itself still contains enough neutral readings to limit conviction.
Among the more actionable divergences, momentum is supportive through MACD Hist 0.005996 (Bullish), yet the oscillator layer flags potential short-term stretch via Stoch %K 99.66 (Bearish). That combination can coexist in trending markets, but it tends to increase the importance of how price behaves near 39.1820 resistance—either a controlled consolidation (trend-friendly) or a fast rejection (mean-reversion risk).
Signal table (Bull/Bear/Neutral)
| Indicator | Value | Signal |
|---|---|---|
| MACD Hist | 0.005996 | Bullish |
| Stoch %K | 99.66 | Bearish |
| TS Mom(20) | 0.445 | Bullish |
| TS Accel | 0.1343 | Bullish |
| RSI(14) | 52 | Neutral |
| ROC(20) | 1.149 | Bullish |
| ADOSC | 99.6 | Bullish |
| ChaikinOsc | 0 | Neutral |
| OBV slope(10) | 0 | Neutral |
| PVT slope(10) | 0 | Neutral |
| AD Line slope(10) | 0 | Neutral |
| Will A/D slope(10) | 0.448 | Bullish |
| BB Width | 0.01528 | Bullish |
| Chaikin Vol | 1.157 | Bearish |
| HHIGH(20) | 39.32 | Neutral |
| LLOW(20) | 38.6 | Neutral |
| MedPx vs Support | 1.663 | Bullish |
| Vol ROC(20) | — | Neutral |
The confluence message is therefore not “all clear,” but rather tilted bullish with localized overbought risk. In this configuration, price acceptance above resistance and stabilization of oscillators often matter more than any single indicator reading.
Interpretation: Indicator-level signals form the base confluence, which is then adjusted using a separate AI-driven technical ranking model. The final technical score summarizes this combined view.
6) News sentiment + extractive gist
Note: Instrument-specific news matches were not found, so the digest includes broader market/sector headlines. Links are provided for verification.
Sentiment score (avg): -0.002 | Positive: 12% | Neutral: 75% | Negative: 12%
KGNAI AI News Sentiment Score (normalized -1 to +1): Not available (as of —) | Label: Not available | Overall news score: -0.00
Positive Developments
Recent coverage across major financial outlets indicates a generally steady risk backdrop for G10/major FX, with pockets of support coming from policy and data expectations rather than a single dominant catalyst. The tone has leaned toward constructive where inflation prints and central-bank paths appear clearer, and where equity or risk benchmarks remain resilient. In that environment, currencies can respond more to relative rates and incremental positioning than to abrupt shocks. For CLFEUR specifically, a neutral-to-constructive macro tape can complement a technically improving setup—particularly when price is already aligned with the moving averages (Close vs MA50 bullish; MA50 vs MA200 bullish). The main “positive” contribution here is the absence of a strongly negative sentiment skew; the provided sentiment split remains dominated by neutral coverage (75%), with positives and negatives balanced at 12% each.
Neutral / Mixed Developments
The news flow is mixed and largely macro-driven, with limited instrument-specific linkage in the provided data. That reduces the explanatory power of the sentiment score for CLFEUR and shifts emphasis back to observable market structure and levels. The aggregate sentiment reading is effectively flat (-0.002), consistent with a market that may trade more on technical acceptance/rejection around nearby zones than on a persistent narrative impulse. Additionally, the platform’s normalized news sentiment score is listed as Not available, which further reinforces that the “news” component should be treated as contextual bias rather than a primary signal driver for this instrument on this date.
Negative / Risk Signals
Risk framing in the broader headlines includes ongoing sensitivity to policy uncertainty and rate-path repricing, both of which can increase short-horizon FX volatility and raise the frequency of false technical breaks. When policy headlines dominate, short-term rankings (such as the #11 daily) can remain strong while the medium-term ranks (monthly #938, 3‑monthly #917) lag—an environment where rallies can be more fragile if confirmation is not sustained. For CLFEUR, that points back to level discipline: failure to hold 37.4052 would be more consistent with “risk-off” whipsaw behavior than with orderly continuation, especially if momentum does not broaden beyond the current modestly positive MACD histogram.
- Whether price can accept above 39.1820 without a rapid reversal, given the mixed horizon ranks.
- Whether RSI(14) = 52 and the MACD histogram (0.0060) expand in tandem (momentum confirmation).
- Whether volatility (bandwidth 0.0153) expands meaningfully on breaks, or stays muted (higher false-break risk).
Snapshot: AI Rank (Short–Mid–Long): Mixed (Bullish tilt) (Bullish–Bearish–Bullish) · Technical Confluence: Bullish · Key Levels: Support ~37.41 | Resistance ~39.18 · News Sentiment: Neutral
Sources referenced: Reuters, Bloomberg, Yahoo Finance, MarketWatch, Investing.com
7) Sources
- USD/CHF weakens below 0.7750 as Trump's speech weigh on US Dollar — https://www.fxstreet.com/news/usd-chf-weakens-below-07750-as-trumps-speech-weigh-on-us-dollar-202602250451
- India Gold price today: Gold rises, according to FXStreet data — https://www.fxstreet.com/news/india-gold-price-today-gold-rises-according-to-fxstreet-data-202602250435
- Pound Sterling remains stronger above 1.3500 following Trump’s State of the Union — https://www.fxstreet.com/news/pound-sterling-remains-stronger-above-13500-following-trumps-state-of-the-union-202602250421
- EUR/USD rises to 1.1800 neighborhood amid renewed USD selling and trade uncertainties — https://www.fxstreet.com/news/eur-usd-rises-to-11800-neighborhood-amid-renewed-usd-selling-and-trade-uncertainties-202602250352
- Japanese Yen steadies against US Dollar following Trump’s SOTU — https://www.fxstreet.com/news/usd-jpy-steadies-near-15600-following-trumps-sotu-202602250325
- NZD/USD rises to near 0.5980 as US Dollar corrects after Trump’s SOTU speech — https://www.fxstreet.com/news/nzd-usd-rises-to-near-05980-as-us-dollar-corrects-after-trumps-sotu-speech-202602250324
- Gold advances back closer to $5,200 mark amid geopolitical tensions and USD weakness — https://www.fxstreet.com/news/gold-advances-back-closer-to-5-200-mark-amid-geopolitical-tensions-and-usd-weakness-202602250319
- President Trump’s SOTU: One of the main reasons for US economic turnaround is tariffs — https://www.fxstreet.com/news/what-to-expect-from-trumps-state-of-the-union-tonight-202602242345
You may also like: How KGNAI AI ranks instruments across global markets
Disclaimer: KGNAI provides AI-generated analytics and educational market commentary only. This is not financial advice. Markets involve risk. Always do your own research.