
GBPCLP (UK Pound Sterling/Chilean Peso) — 27-Feb-2026 Neutral regime with selective bullish momentum signals
GBPCLP sits in a broadly neutral KGNAI ranking posture across most horizons as of 27-Feb-2026, with cross-timeframe dispersion that matters for risk framing. The 3-Monthly rank (#74 out of 956) stands out as comparatively strong versus a more middling Daily rank (#497) and Monthly rank (#586), implying recent trend structure may be stabilizing without full confirmation across shorter windows. Technically, moving-average structure remains bearish (close vs MA50 and MA50 vs MA200), yet the indicator layer leans constructive: MACD histogram at 0.4786 and an 18-signal confluence score of 0.389 (Bullish) contrast with a weak DRL technical rank (#890/956). Volatility appears contained with Bollinger bandwidth at 0.0157, increasing the importance of nearby decision zones around support 1163.1121 and resistance 1217.7843.
- Rank stance (Short / Mid / Long): Neutral (Daily #497; Weekly #222) / Neutral (Monthly #586; 6-Monthly #208) / Neutral (Yearly #441) with a notable exception: 3-Monthly Bullish (#74).
- Technical confluence label: Bullish (18-signal score 0.389) while the blended overall technical score is Neutral (0.014).
- Key levels: Support ~ 1163.1121 | Resistance ~ 1217.7843.
- News sentiment bias: Neutral (avg 0.016; 31% positive / 50% neutral / 19% negative).
- Confirmation / invalidation condition: A sustained push through 1217.7843 supports continuation framing; a close below 1163.1121 increases deterioration risk per the scenario definition.
KGNAI evaluates assets using large cross-sectional datasets built from millions of structured data points. Inputs incorporate fundamental metrics, technical structures, and systematically processed news sentiment. Statistical models, machine learning, and AI frameworks are used to assess relative positioning, signal alignment, and probabilistic behavior across broad universes.
- Ranks are comparative across the tracked universe, not absolute price targets.
- Confluence reflects alignment among independent signal groups.
- Support/resistance levels are probabilistic decision zones, not guarantees.
- Sentiment provides contextual bias within the broader analytical framework.
1) KGNAI AI Analysis
Region: FOREX
Total universe size: 956 ranked instruments
- Daily rank: #497 out of 956 — Neutral
- Weekly rank: #222 out of 956 — Neutral
- Monthly rank: #586 out of 956 — Neutral
- 3-Monthly rank: #74 out of 956 — Bullish
- 6-Monthly rank: #208 out of 956 — Neutral
- Yearly rank: #441 out of 956 — Neutral
The rank stack for GBPCLP is best read as a timeframe disagreement rather than a single directional message. Most horizons cluster in the middle of the 956-instrument universe (Daily #497, Monthly #586, Yearly #441), consistent with a market that is not exhibiting persistent cross-sectional strength or weakness versus peers. The exception is the 3-Monthly rank at #74, which sits in the upper decile of the tracked universe and signals that the intermediate window has recently displayed comparatively favorable behavior.
This split often arises when an earlier trend impulse still benefits the intermediate lookback, while more recent action becomes range-bound or structurally ambiguous—an interpretation consistent with other parts of the dashboard that show bullish indicator fragments but bearish moving-average structure. The Weekly rank (#222) and 6-Monthly rank (#208) sit closer to the upper quartile than the median, suggesting the “neutral” label may be a function of dispersion rather than uniformly weak readings.
From a decision standpoint, KGNAI’s stated Term view remains Neutral across short-, mid-, and long-term framing, which is coherent given the lack of broad agreement among horizons. In this configuration, rank changes tend to behave more like probability shifts than durable regime confirmation—especially when technical models (see Section 5) diverge materially.
Term view: Short-term: Neutral. Mid-term: Neutral. Long-term: Neutral.
Want the full universe and complete rank tables? Unlock full access on KGNAI: https://www.kgnai.com/pricing
2) Price & trend overview
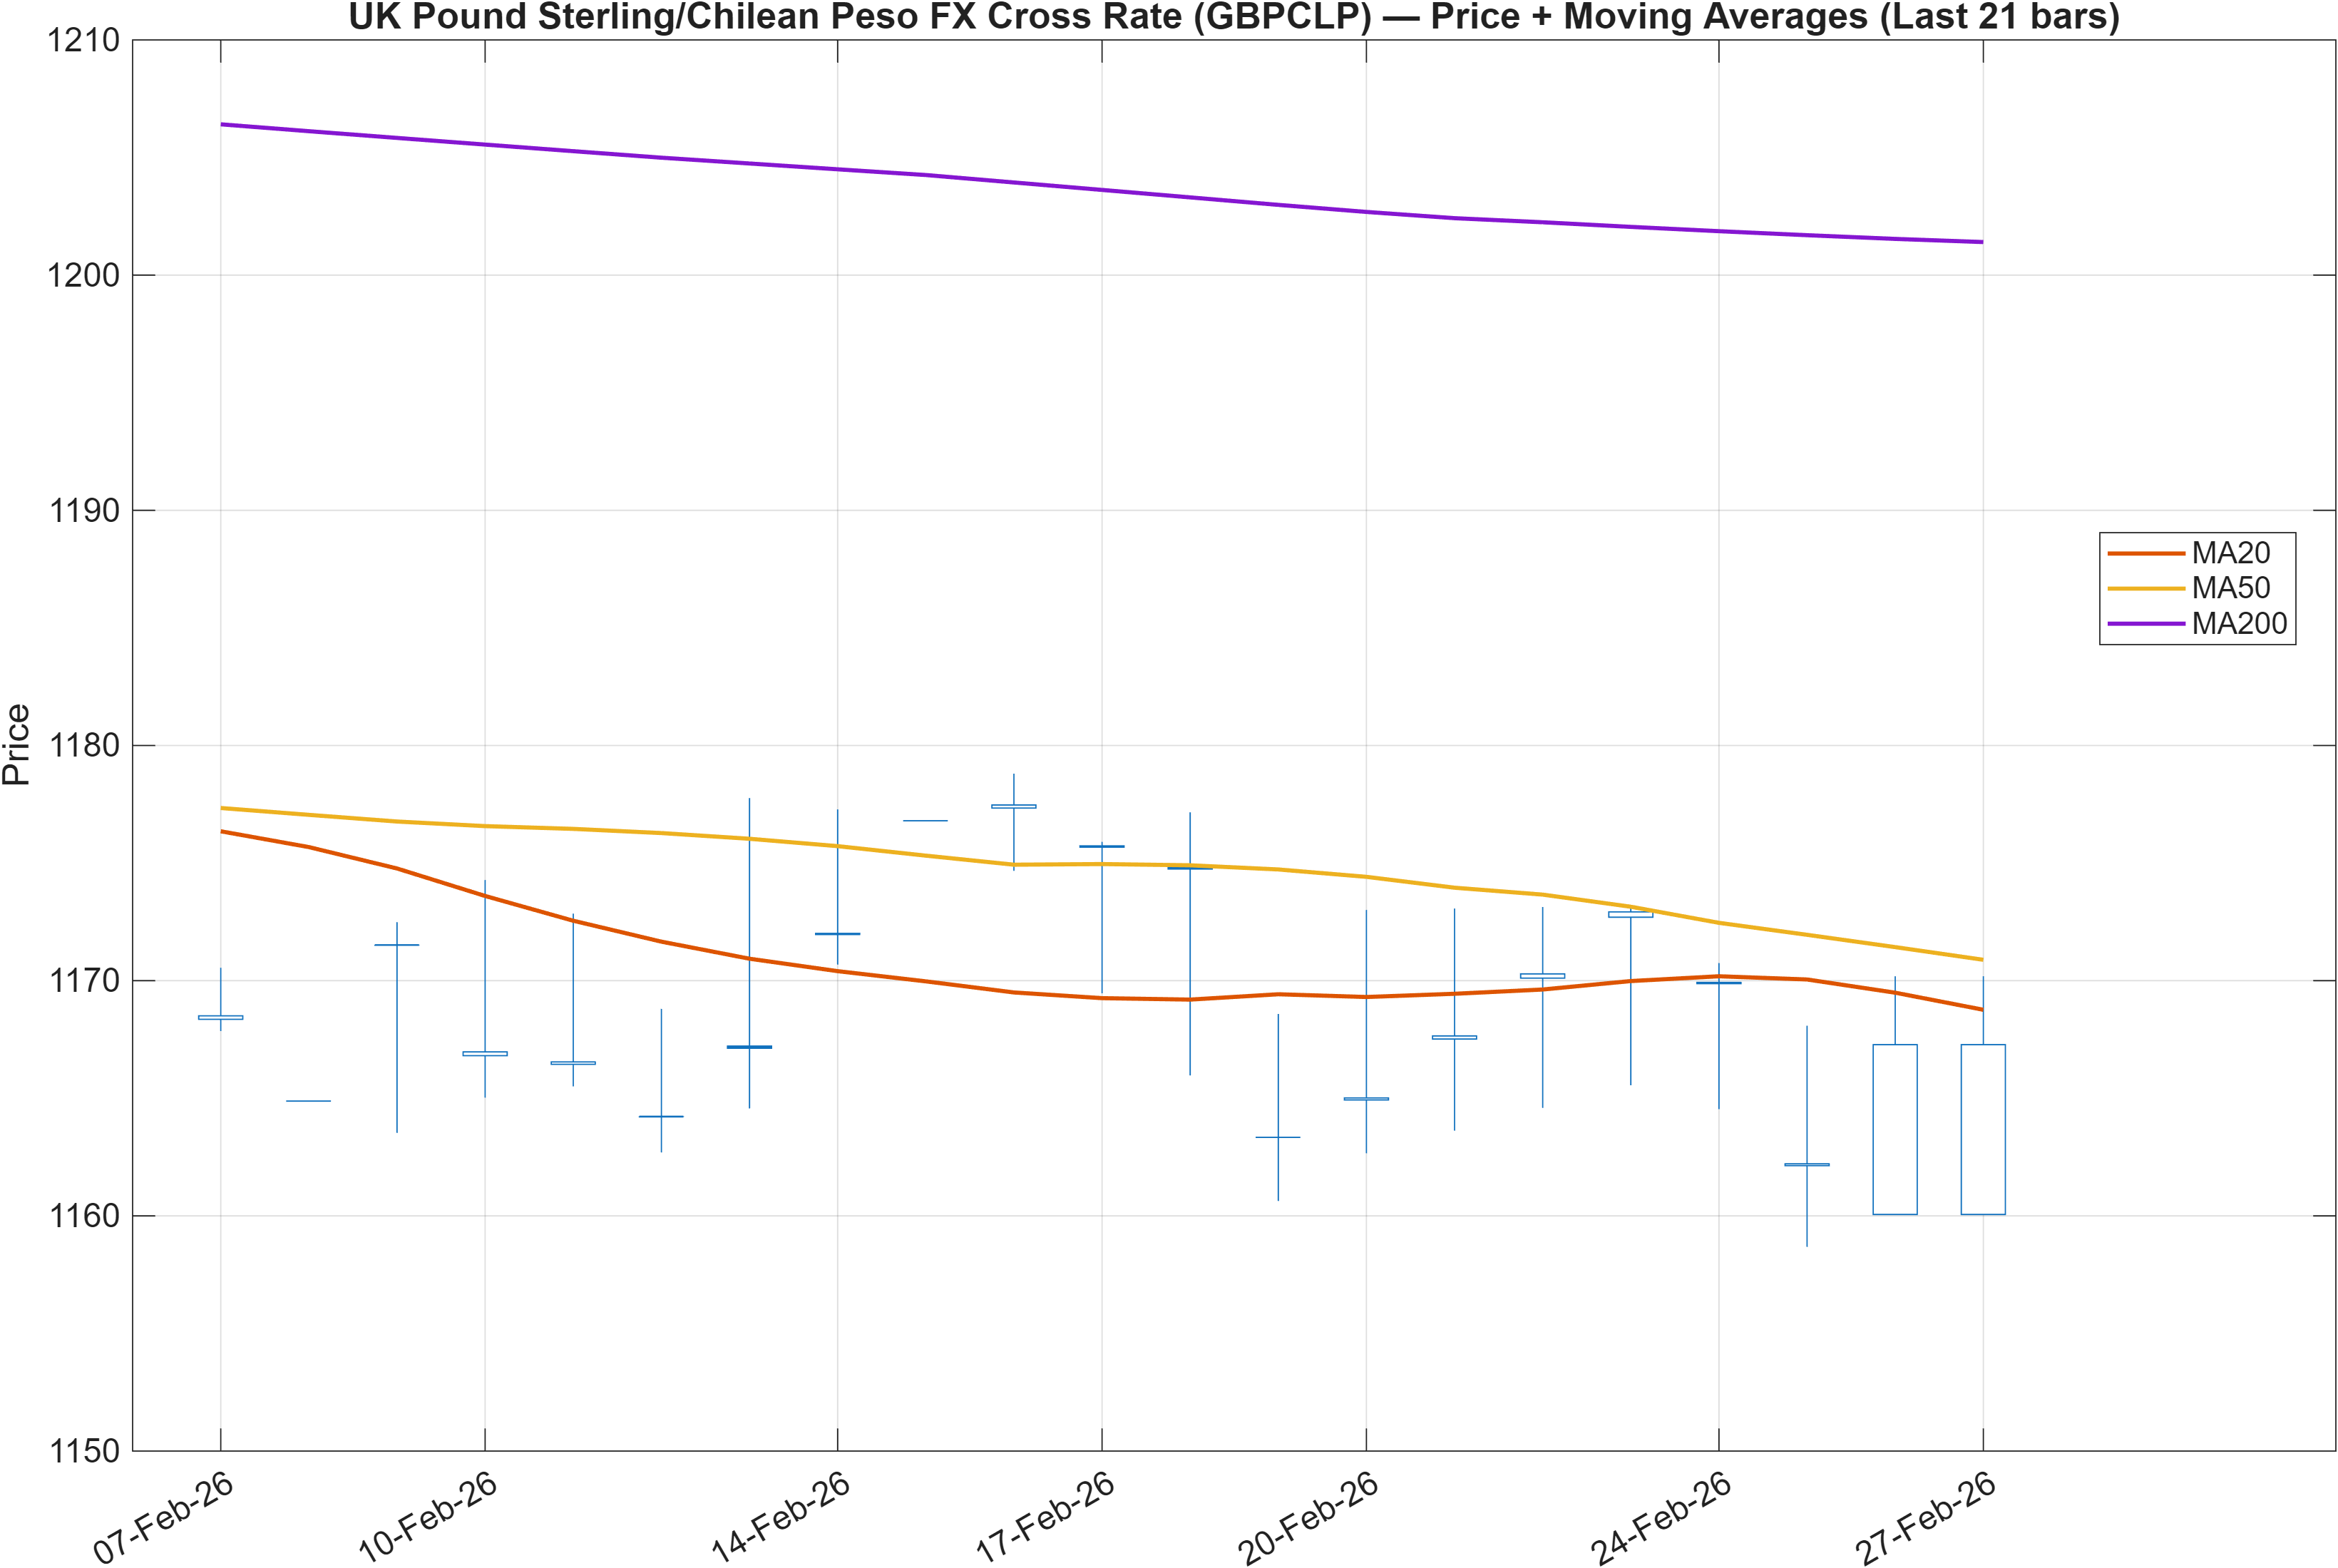
Interpretation: Close vs MA50 = Bearish, MA50 vs MA200 = Bearish.
Trend structure vs intermediate rank strength
GBPCLP’s trend lens is defined by a bearish moving-average configuration: the close remains below the MA50 and the MA50 sits below the MA200. This combination typically reflects an established downtrend or a market that has not yet repaired enough structure to shift medium-term trend classification. That said, the AI rank profile complicates the narrative: the 3-Monthly rank (#74) implies comparatively favorable behavior over that window despite the bearish MA stack, a pattern that often appears when a pair is attempting to base or transition from trend to range.
When MA structure remains bearish, continuation risk persists unless the market can consistently hold above shorter moving averages and compress downside follow-through. The support/resistance map reinforces this “decision-zone” framing: with support at 1163.1121 and resistance at 1217.7843, GBPCLP’s next meaningful trend read likely depends on whether price can migrate away from support while testing the upper boundary.
The broader rank context also suggests the market is not uniformly strong versus peers at shorter horizons: the Daily rank (#497) and Monthly rank (#586) sit closer to the center-to-lower half of the universe, consistent with trend inertia and incomplete reversal confirmation. In practical allocation terms, this configuration tends to reward discipline around levels rather than extrapolation from a single lookback window.
3) Momentum & volatility dashboard
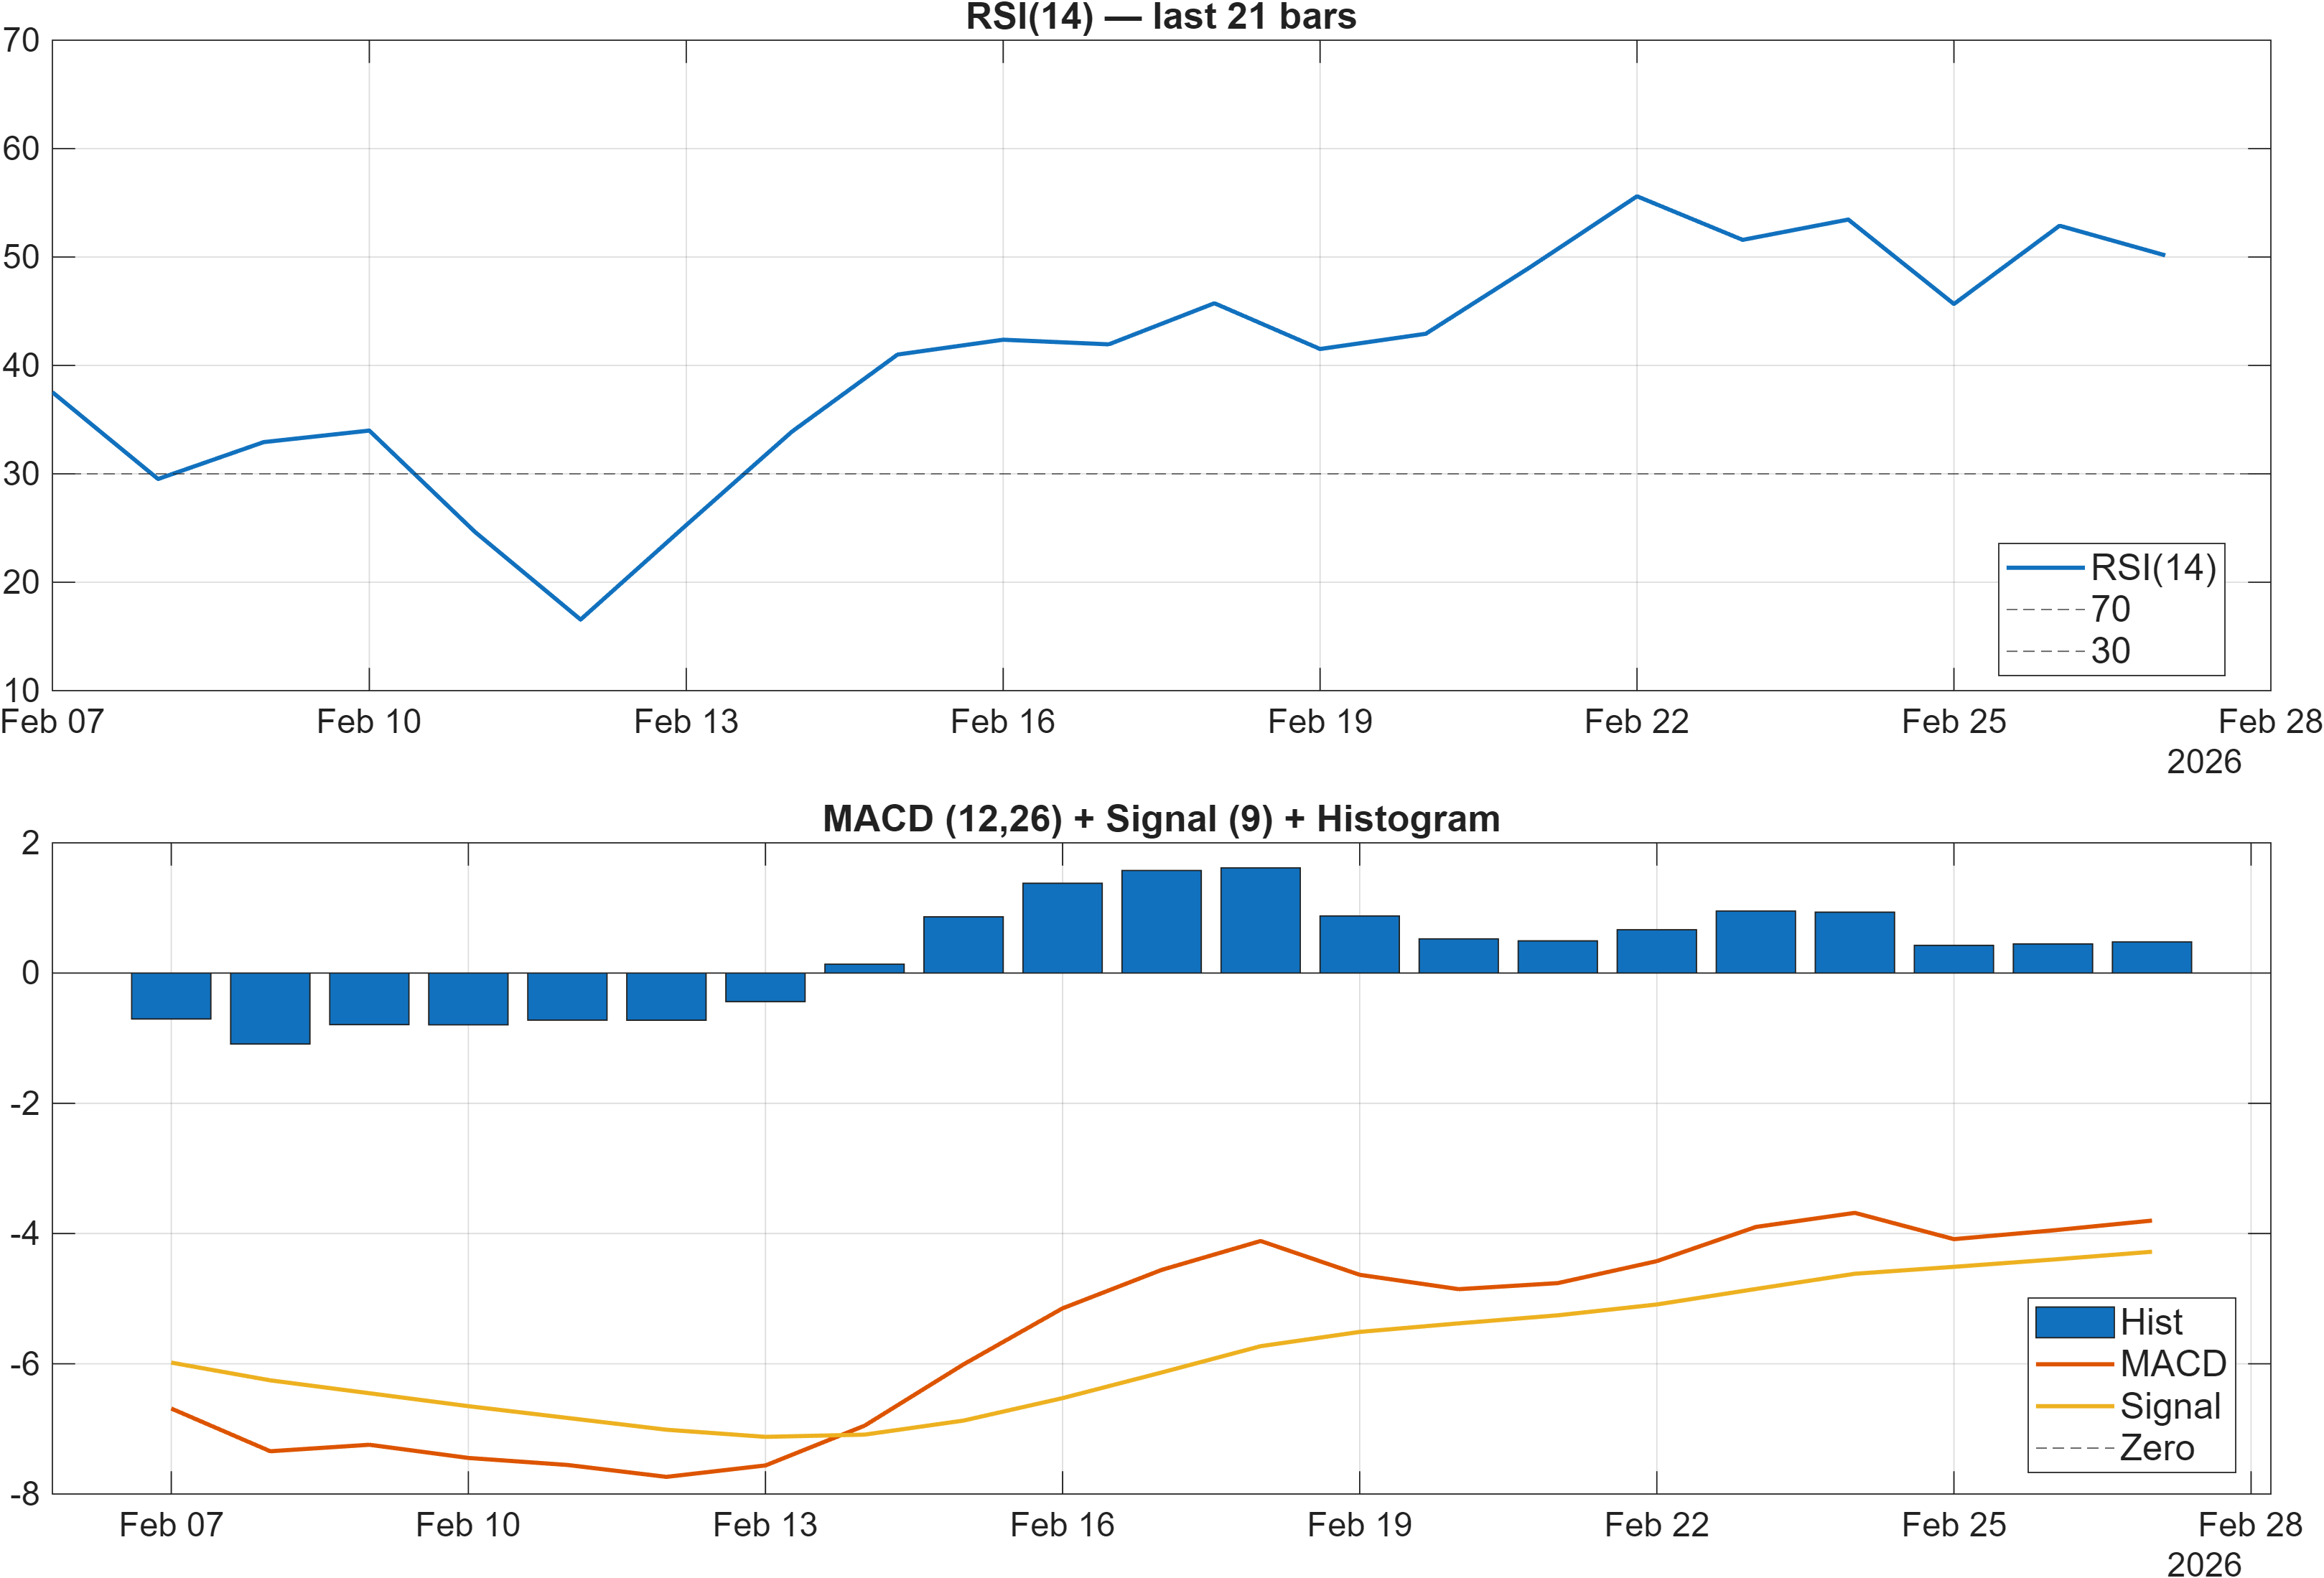
Interpretation: RSI bias = Neutral, MACD hist = 0.4786.
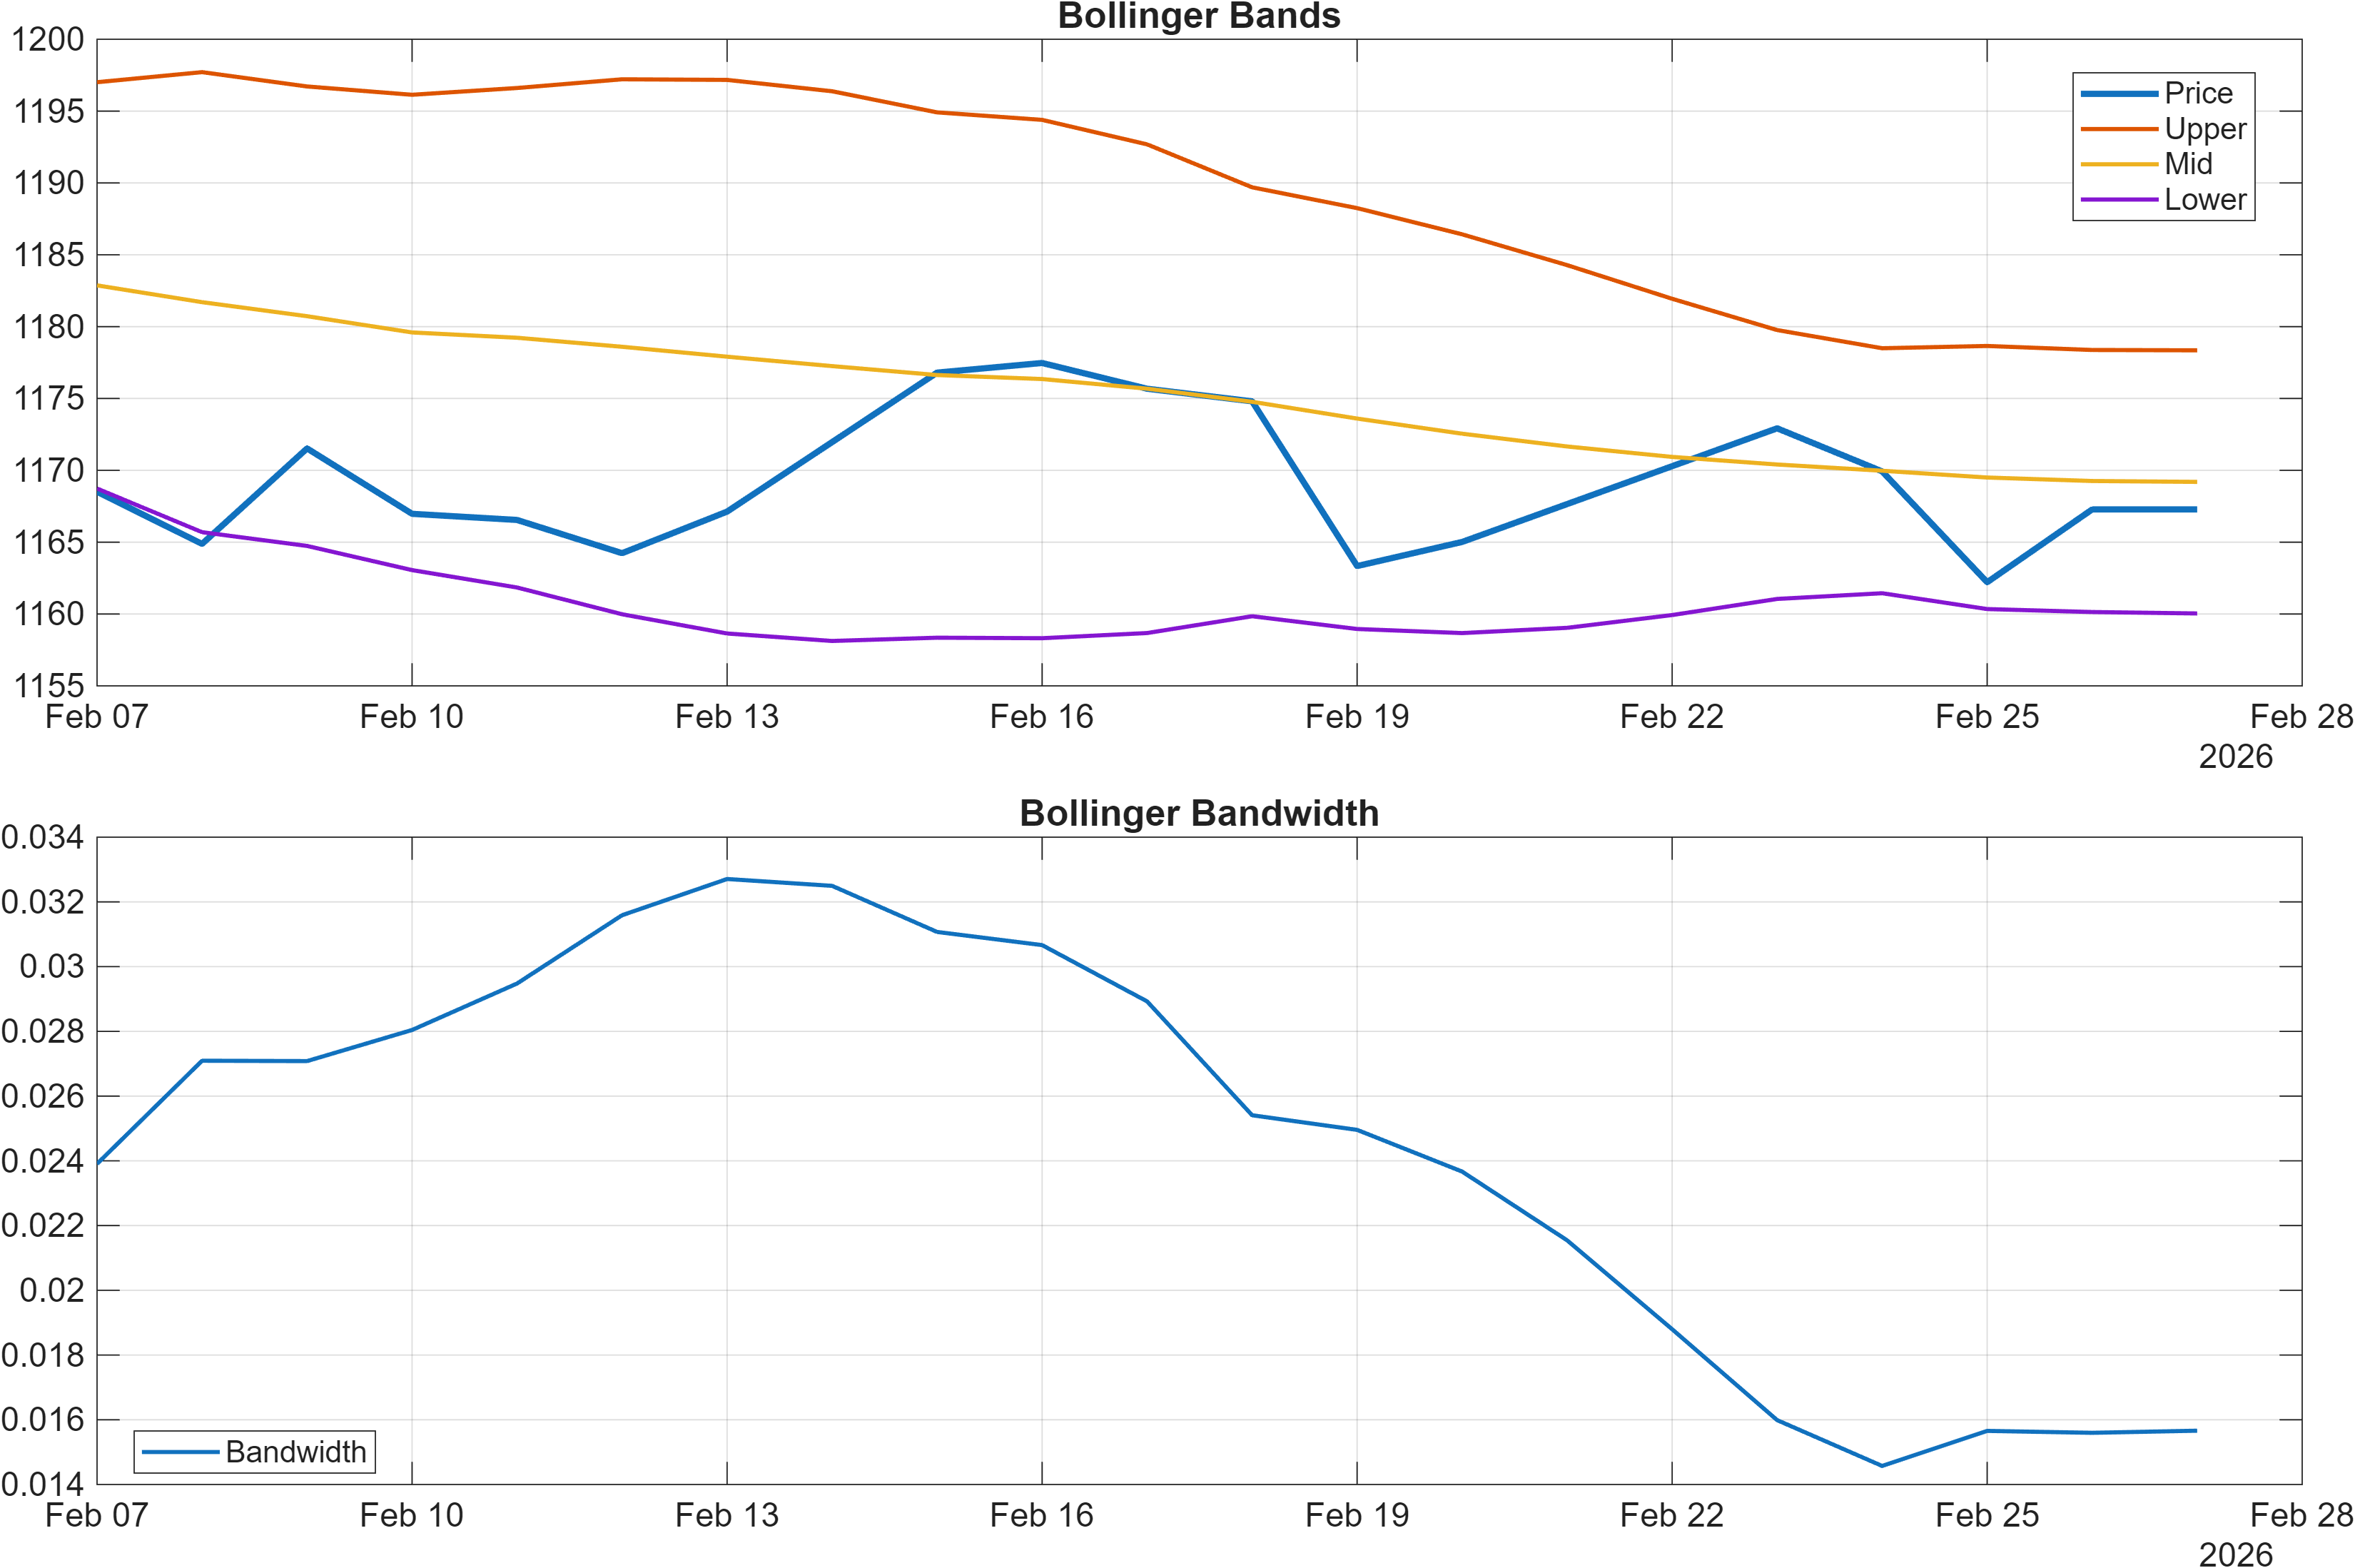
Interpretation: Bandwidth (volatility regime) latest = 0.0157.
Momentum improvement without strong volatility expansion
The momentum dashboard points to a measured bullish tilt rather than a high-conviction impulse. RSI remains neutral (RSI(14) is shown at 50.15 in the signal table), which typically aligns with range behavior or an equilibrium state where neither overbought nor oversold conditions dominate. In contrast, the MACD histogram at 0.4786 registers on the bullish side, indicating positive momentum pressure relative to its recent baseline.
Volatility conditions are notably contained. The latest Bollinger bandwidth reads 0.0157, with the table showing BB Width 0.01566. This is consistent with a compression regime where breakouts—if they occur—can be more sensitive to nearby levels, but also more prone to false starts if broader participation does not arrive. The implication is that momentum signals (like MACD) may flash earlier than trend confirmation (like MA50/MA200 alignment), creating a divergence between “turn” indicators and “trend” indicators.
Several additional momentum readings in the 18-signal set support the idea of mild upside bias: TS Mom(20) is 2.4 and ROC(20) is 0.206, both labeled bullish, while Stoch %K at 46.53 remains neutral. The composite picture is incremental improvement rather than a synchronized acceleration—consistent with the broader neutral rank stance across short and long horizons.
4) Support / Resistance zones
Support ~ 1163.1121 | Resistance ~ 1217.7843
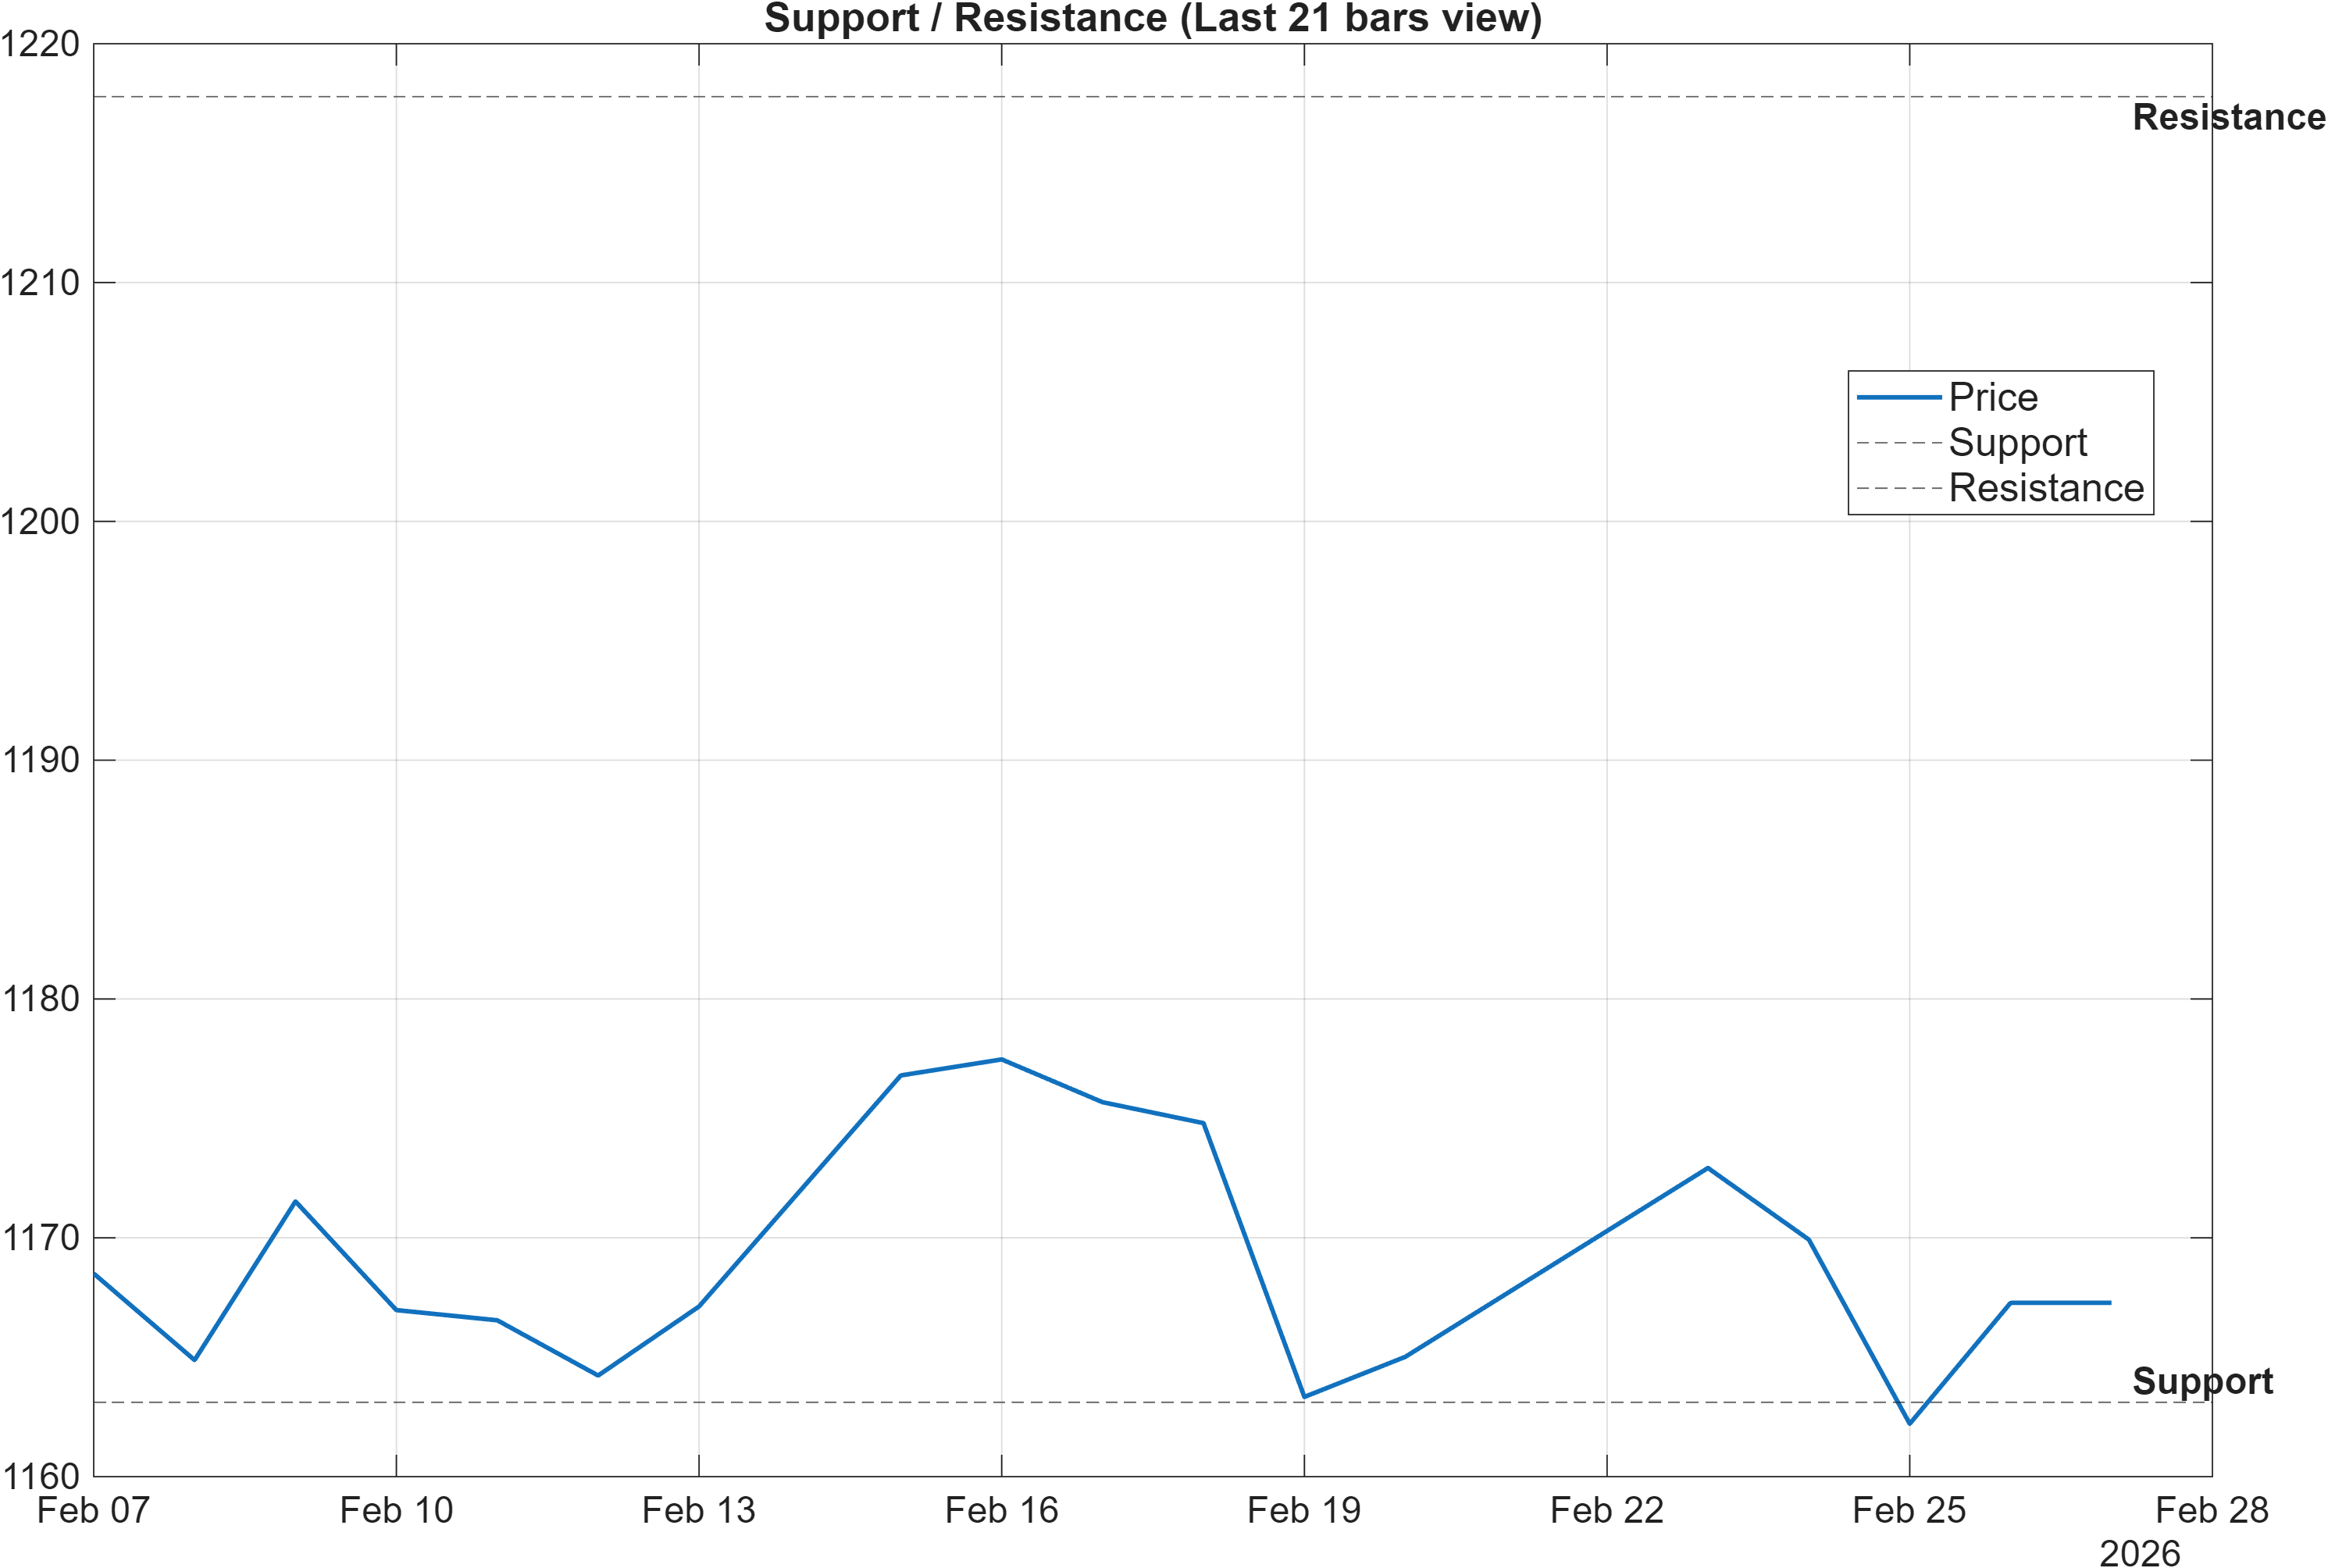
Scenario view: Break above resistance with volume → continuation. Close below support → signal deterioration risk.
Decision zones: regime confirmation vs deterioration
With volatility compressed (bandwidth 0.0157), the 1163.1121–1217.7843 structure becomes the primary lens for mapping regime outcomes. In a neutral rank regime (Daily #497, Yearly #441), support and resistance are less about “targets” and more about classification: whether the market is transitioning into trend continuation, reverting to mean, or breaking down into renewed weakness.
The technical mix makes the resistance zone particularly informative. Momentum indicators (including MACD hist 0.4786) can support tests of the upper boundary, but the bearish MA stack tends to act as an overhead structural constraint until price action proves otherwise. A clean break above 1217.7843 would align the level-based framework with the indicator layer, improving alignment with the stronger 3-Monthly rank (#74).
On the downside, a close below 1163.1121 would not just be a level violation; it would also pressure the interpretation that recent bullish signals represent a base-building phase. In that case, the weak DRL technical rank (#890/956) (Section 5) becomes more relevant: it signals that, despite pockets of bullish indicator readings, broader pattern recognition still assesses the technical positioning as poor relative to the universe.
5) Quant Technical Dashboard (18 Signals)
KGNAI AI Technical Analysis Score (Deep Reinforcement Learning): Rank #890 out of 956 (Rank 1 represents the strongest technical positioning and a higher probability of favorable price behavior. As ranks increase toward the maximum, the probability of favorable outcomes weakens and bearish positioning becomes more dominant.) | Label: Bearish | Score: -0.862
18-Signal Technical Confluence Score: 0.389 (Bullish)
Overall Technical Score (18-signal confluence + DRL rank blend): 0.014 (Neutral)
Note: The blended score reflects signal strength weighted against broader AI technical ranking, which may temporarily diverge.
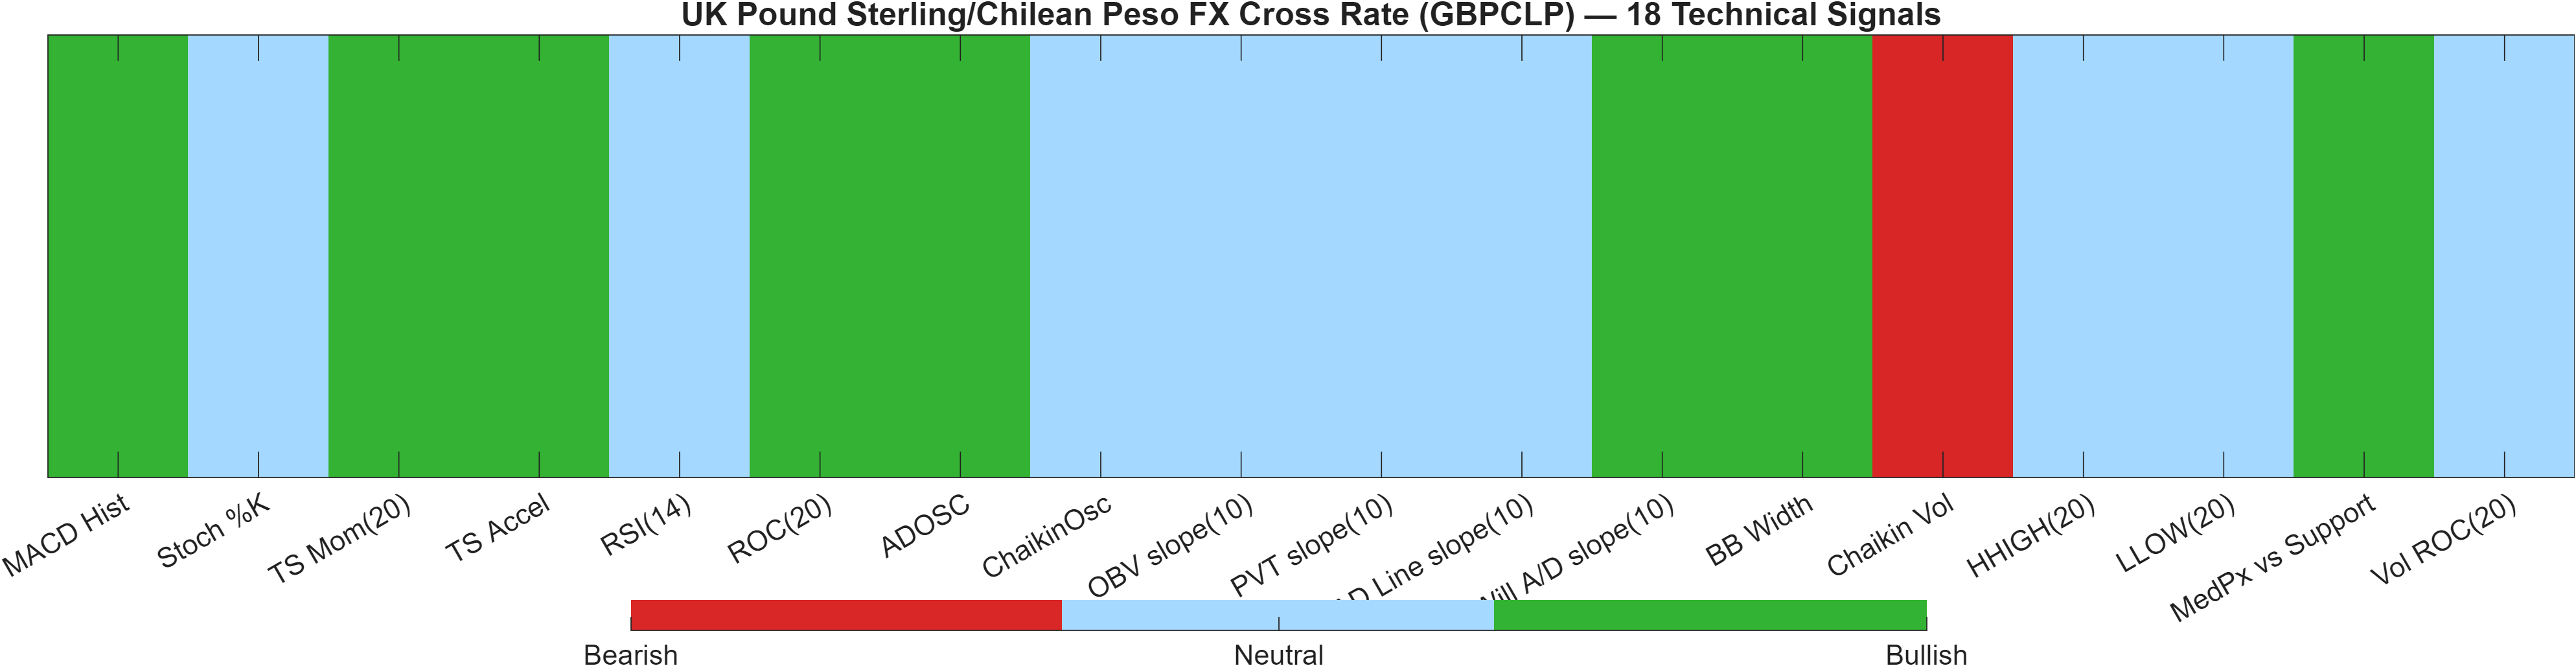
Blended technical score breakdown: 0.014 (Neutral | Bull 8 / Bear 1 / Neutral 9)
Model divergence: indicator confluence vs AI technical rank
The most analytically relevant feature in this section is the internal disagreement between indicator-level confluence and the deep learning technical rank. On one hand, the 18-signal confluence score is 0.389 (Bullish), and the breakdown shows Bull 8 / Bear 1 / Neutral 9, which is consistent with a market where a meaningful subset of indicators has turned supportive. On the other hand, the DRL technical rank is #890 out of 956 with a Bearish label and score -0.862, placing it in the lower tail of the universe by that model’s standards.
The blend reconciles these two perspectives into an Overall Technical Score of 0.014 (Neutral). This neutral outcome is not “no signal”; it is a signal of instability in inference. Typically, this happens when short-horizon indicators (e.g., MACD hist 0.4786, TS Mom(20) 2.4) improve while higher-order structure remains impaired (consistent with bearish moving averages and the DRL model’s assessment).
The single bearish indicator in the table—Chaikin Vol at 22.78—adds a subtle caution: volatility/participation behavior can be inconsistent even when price-momentum measures improve. In compressed-volatility regimes (bandwidth 0.0157), this mix can produce short bursts of directional movement that do not evolve into persistent trends unless level breaks (Section 4) and rank improvements (Section 1) begin to align.
Signal table (Bull/Bear/Neutral)
| Indicator | Value | Signal |
|---|---|---|
| MACD Hist | 0.4786 | Bullish |
| Stoch %K | 46.53 | Neutral |
| TS Mom(20) | 2.4 | Bullish |
| TS Accel | 28.58 | Bullish |
| RSI(14) | 50.15 | Neutral |
| ROC(20) | 0.206 | Bullish |
| ADOSC | 85.64 | Bullish |
| ChaikinOsc | 0 | Neutral |
| OBV slope(10) | 0 | Neutral |
| PVT slope(10) | 0 | Neutral |
| AD Line slope(10) | 0 | Neutral |
| Will A/D slope(10) | 2.138 | Bullish |
| BB Width | 0.01566 | Bullish |
| Chaikin Vol | 22.78 | Bearish |
| HHIGH(20) | 1179 | Neutral |
| LLOW(20) | 1159 | Neutral |
| MedPx vs Support | 2.013 | Bullish |
| Vol ROC(20) | — | Neutral |
Interpretation: Indicator-level signals form the base confluence, which is then adjusted using a separate AI-driven technical ranking model. The final technical score summarizes this combined view.
6) News sentiment + extractive gist
Note: Instrument-specific news matches were not found, so the digest includes broader market/sector headlines. Links are provided for verification.
Sentiment score (avg): 0.016 | Positive: 31% | Neutral: 50% | Negative: 19%
KGNAI AI News Sentiment Score (normalized -1 to +1): Not available (as of —) | Label: Not available | Overall news score: 0.02
Positive Developments
Recent coverage across major financial outlets indicates a constructive tone in parts of the global risk narrative, particularly around corporate restructuring and select risk-sensitive FX themes. The dominant positive thread is an improved investor response to operational efficiency stories and technology-enabled cost resets, which can strengthen broader equity sentiment and, at times, temper safe-haven demand. In G10 FX commentary, some reporting also reflects episodic support for higher-yielding or commodity-linked currencies when central bank messaging is perceived as relatively hawkish. For GBPCLP, these positives operate indirectly: when global risk appetite is stable and volatility remains contained, cross rates can spend more time respecting technical ranges rather than trending erratically. That backdrop aligns with a neutral sentiment mix (0.016 average; 50% neutral) rather than a one-sided narrative capable of overwhelming the technical framework.
Neutral / Mixed Developments
The neutral bucket is characterized by routine macro positioning and policy-watch coverage—updates on major currency pairs, incremental political noise, and forward-looking event risk without a clear consensus impulse. For sterling in particular, the tone appears mixed: political developments and policy expectations can create short-lived swings without establishing a durable trend signal. In parallel, broader FX reporting highlights the market’s ongoing sensitivity to scheduled data releases and cross-asset risk moves, which can generate tactical flows while leaving medium-horizon direction unresolved. This “information-heavy, signal-light” environment is consistent with the report’s technical blend: despite a Bullish 18-signal confluence (0.389), the overall technical score remains Neutral (0.014), implying confirmation is still conditional.
Negative / Risk Signals
Risk-oriented coverage emphasizes policy intervention rhetoric, pockets of weaker confidence data, and sporadic geopolitical escalation—factors that can shift FX correlations and trigger abrupt repricing even when technicals suggest compression. Reports highlighting concern over currency weakness and policy vigilance underscore the potential for headline-driven volatility in FX, particularly where officials attempt to influence expectations. Additionally, macro commentary pointing to softer consumer confidence and labor-market stress introduces downside risk to sentiment and can reinforce defensive positioning. For GBPCLP, these risks matter less as direct drivers and more as catalysts that can push the cross toward its defined decision zones. With support at 1163.1121 and resistance at 1217.7843, negative shocks increase the probability that price tests (or violates) support before the moving-average structure has time to improve.
- Whether sentiment remains broadly neutral while GBPCLP approaches 1217.7843 or 1163.1121.
- Any shift in policy-related FX rhetoric that coincides with volatility expansion beyond the current bandwidth regime (0.0157).
- Whether momentum (e.g., MACD hist 0.4786) persists as moving-average structure remains bearish.
Sources referenced: Reuters, Bloomberg, Yahoo Finance, MarketWatch, Investing.com
Snapshot: AI Rank (Short–Mid–Long): Neutral (Neutral–Neutral–Neutral) · Technical Confluence: Bullish · Key Levels: Support ~1163.11 | Resistance ~1217.78 · News Sentiment: Neutral
7) Sources
Not available in the provided data.
You may also like: How KGNAI AI ranks instruments across global markets
Disclaimer: KGNAI provides AI-generated analytics and educational market commentary only. This is not financial advice. Markets involve risk. Always do your own research.