
USDFKP (USDFKP) — May 20, 2026 Technical Confluence vs Neutral Ranks
USDFKP sits in a mixed regime where cross-horizon ranks remain broadly neutral while the shorter-cycle technical layer skews constructive. In the 952-instrument FOREX universe, the daily (#430) and weekly (#409) ranks indicate mid-pack positioning, while the 3-monthly rank (#915) flags weaker intermediate behavior. At the same time, the technical stack leans positive: RSI is 64.92, MACD histogram is 0.0011, and the 18-signal framework prints a 0.444 (Bullish) confluence with a 0.356 (Bullish) blended technical score. This combination typically reflects an instrument attempting to stabilize and rotate higher while broader regime tests remain unconvinced. Key decision levels are clearly defined at support ~0.7344 and resistance ~0.7563, with news tone currently neutral based on an average sentiment score of 0.021 and a majority-neutral mix.
- Rank stance: Short-term Neutral | Mid-term Bearish (3-monthly #915/952) | Long-term Neutral
- Technical confluence: Bullish (18-signal 0.444; blended 0.356)
- Key levels: Support ~0.7344 | Resistance ~0.7563
- News sentiment bias: Neutral (avg 0.021; 56% neutral)
- Confirmation / invalidation: Acceptance above 0.7563 supports continuation conditions; sustained closes below 0.7344 increase deterioration risk.
What KGNAI Measures
KGNAI evaluates assets using large cross-sectional datasets built from millions of structured data points. Inputs incorporate fundamental metrics, technical structures, and systematically processed news sentiment. Statistical models, machine learning, and AI frameworks are used to assess relative positioning, signal alignment, and probabilistic behavior across broad universes.
How to Read This Report
- Ranks are comparative across the tracked universe, not absolute price targets.
- Confluence reflects alignment among independent signal groups.
- Support/resistance levels are probabilistic decision zones, not guarantees.
- Sentiment provides contextual bias within the broader analytical framework.
KGNAI Signal + Technical Snapshot + News Sentiment Digest
As of: 20-May-2026
Ticker: USDFKP
1) KGNAI AI Analysis
Region: FOREX
Total universe size: 952 ranked instruments
- Daily rank: #430 out of 952 — Neutral
- Weekly rank: #409 out of 952 — Neutral
- Monthly rank: #597 out of 952 — Neutral
- 3-Monthly rank: #915 out of 952 — Bearish
- 6-Monthly rank: #355 out of 952 — Neutral
- Yearly rank: Not available for this horizon — Not available
The rank profile implies short-horizon stability without strong leadership. Daily (#430) and weekly (#409) standings sit close to the universe midpoint, consistent with a market that is tradable but not strongly differentiated on near-term probability tests. The monthly rank (#597) drifts into the lower half, suggesting that recent strength has not fully converted into persistent advantage over the broader peer set.
The key tension is the intermediate horizon: the 3-monthly rank at #915 is in the lower tail of the 952-instrument universe, a configuration often associated with prior drawdown, weak follow-through, or unstable trend persistence when measured across multiple model tests. Importantly, the 6-monthly rank at #355 returns to a more neutral-upper-middle posture, implying the weakness is not uniformly long-duration; rather, it looks like a mid-cycle pocket of underperformance embedded inside a longer neutral band.
From a regime perspective, this “neutral–bearish–neutral” term view can occur when an instrument is attempting to transition away from a weaker intermediate phase. It places greater weight on confirmation via price structure and on whether technical signals can remain constructive long enough to pull higher-horizon ranks out of the lower tail.
Term view: Short-term: Neutral. Mid-term: Bearish. Long-term: Neutral.
Yearly rank: Not available in the provided data.
Want the full universe and complete rank tables? Unlock full access on KGNAI: https://www.kgnai.com/pricing
2) Price & trend overview
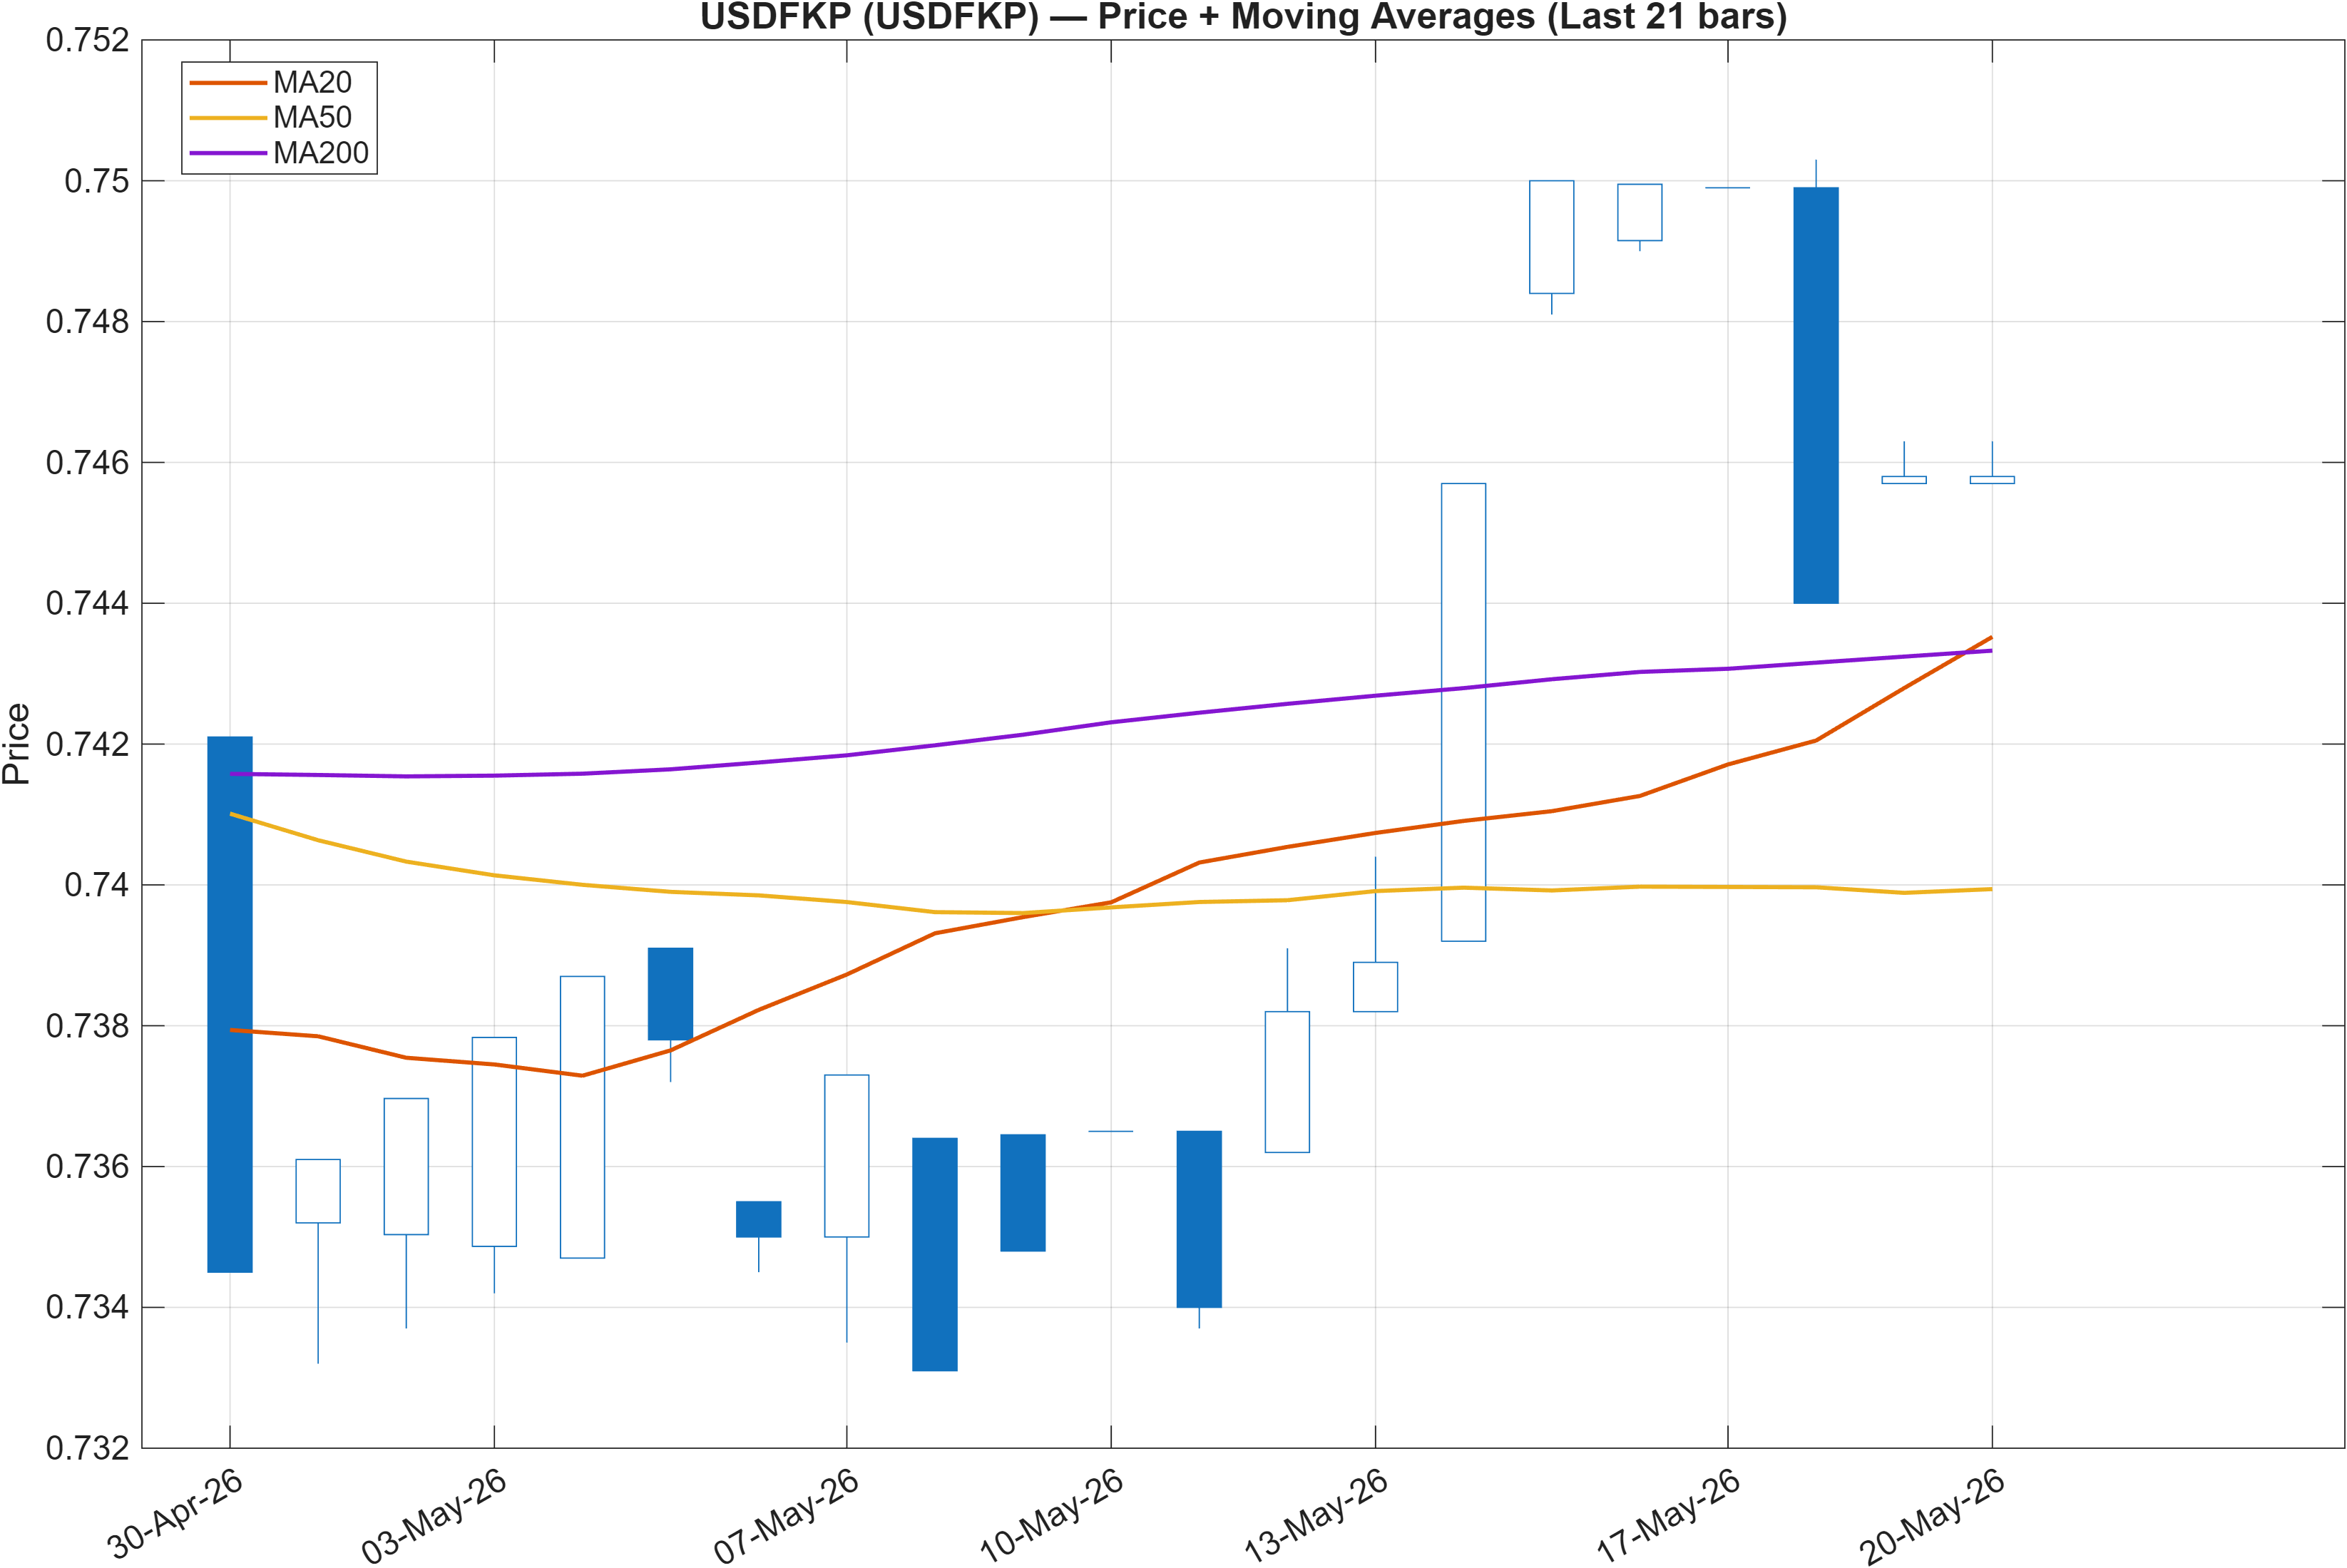
Interpretation: Close vs MA50 = Bullish, MA50 vs MA200 = Bearish.
The moving-average configuration points to a timeframe split rather than a clean trend. A bullish close relative to the MA50 suggests the most recent price action is holding above intermediate reference, often consistent with a rebound phase or an early-stage continuation attempt. However, the MA50 remaining bearish versus the MA200 indicates the longer trend structure has not fully repaired; this is commonly seen when price improves first, then the faster average turns, and only later does the slower average respond.
This structure helps explain why the rank stack stays neutral on daily/weekly (#430 and #409) while failing to recover on the 3-month horizon (#915). When the short-term tape is constructive but the medium-to-long moving-average relationship is still lagging, the market frequently oscillates between breakout attempts and mean-reversion pullbacks, particularly near well-defined levels such as 0.7344 and 0.7563.
For positioning discipline, this is the type of setup where trend persistence matters more than single-session strength. Continued closes supportive of the MA50 bias would be consistent with improving participation, while inability to sustain strength can keep the MA50/MA200 relationship in a bearish posture, reinforcing the weaker intermediate rank reading. The message is not directional certainty; it is a regime label: short-term constructive inside a longer-term repair process.
3) Momentum & volatility dashboard
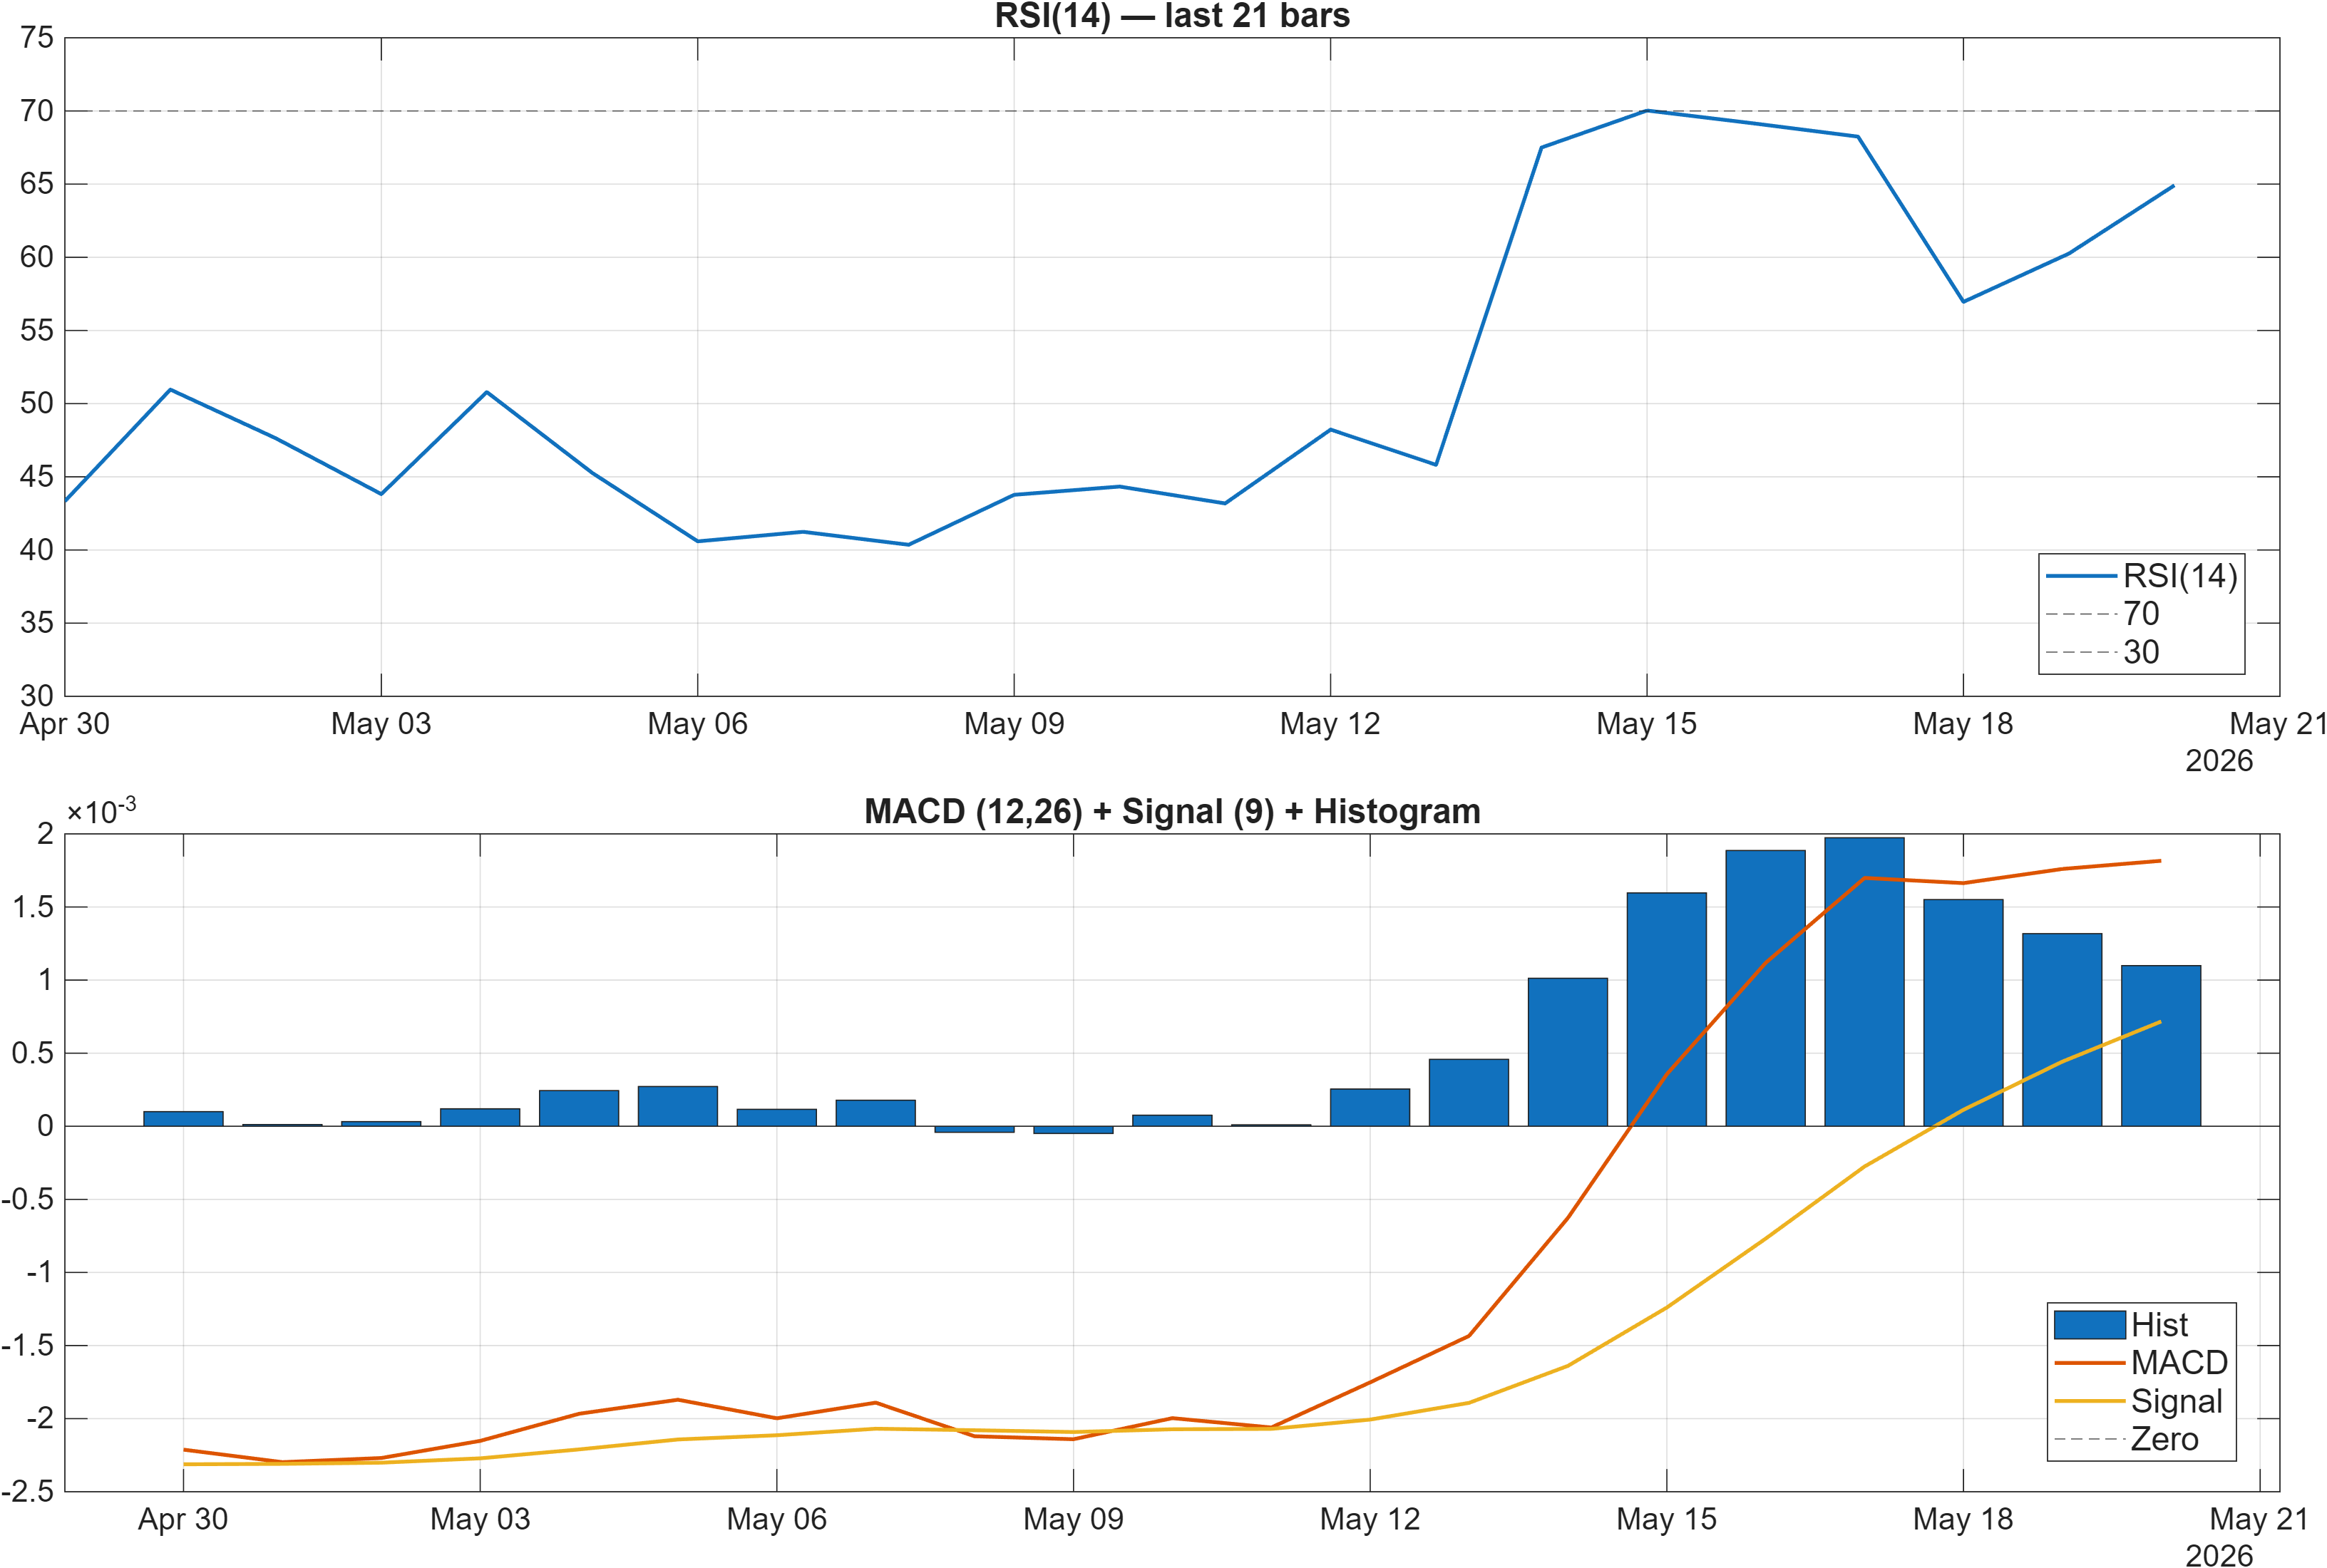
Interpretation: RSI bias = Bullish, MACD hist = 0.0011.
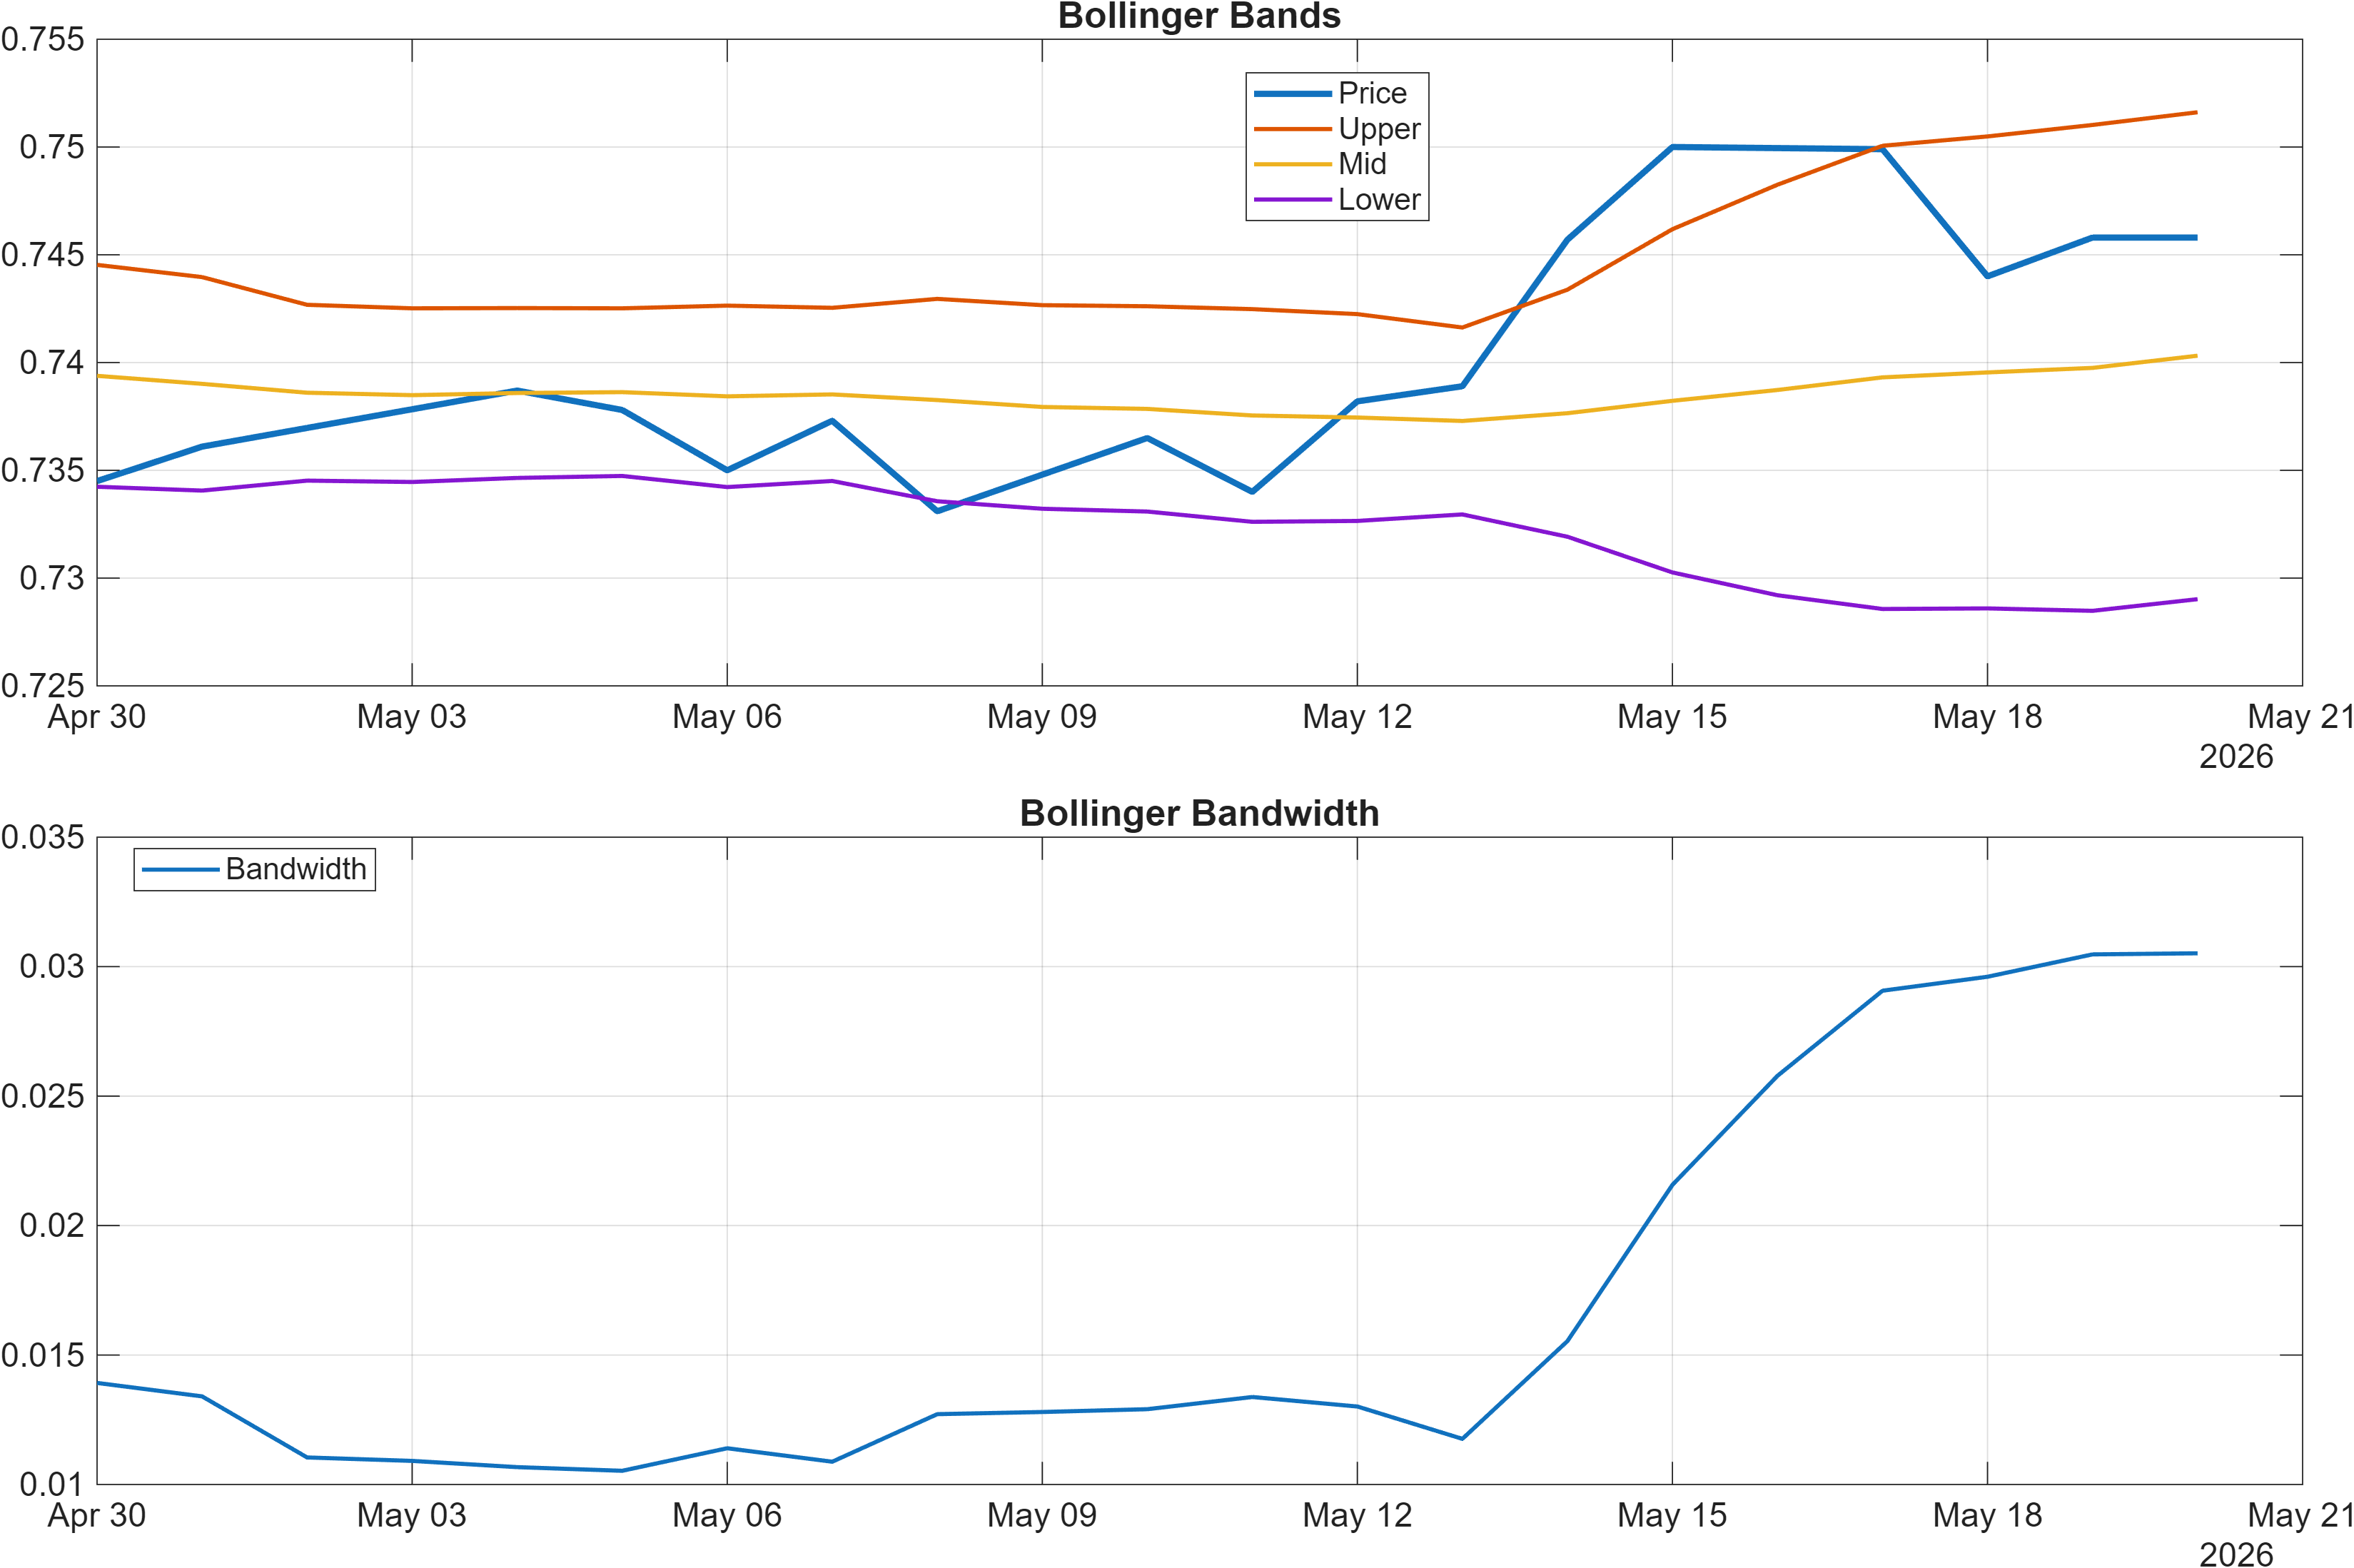
Interpretation: Bandwidth (volatility regime) latest = 0.0305.
Momentum is presently skewed toward continuation risk rather than immediate mean reversion. RSI(14) at 64.92 sits in a constructive zone where upside pressure is evident without necessarily implying a fully extended condition. In parallel, the MACD histogram at 0.0011 is positive, which typically aligns with improving short-cycle trend traction—particularly useful when the moving-average stack (Section 2) is still mixed.
Volatility, however, looks contained. Bollinger Bandwidth at 0.0305 indicates a relatively tighter regime versus what would be expected in a fully directional expansion phase. That matters because bullish momentum readings inside a lower-volatility envelope can resolve in two different ways: (1) a controlled grind higher with modest pullbacks, or (2) a failed breakout that slips back into range behavior once momentum cools.
Given the rank backdrop—daily/weekly neutral (#430/#409) but 3-month bearish (#915)—the momentum/volatility mix is best read as a test of persistence. Momentum is pointing the right way, but volatility has not yet “confirmed” through expansion. That places analytical weight on whether price can push into and hold above resistance (0.7563) without requiring a volatility spike, or whether the market returns to support proximity (0.7344) as compression persists.
Net: the dashboard shows positive momentum with restrained volatility, a configuration that often precedes a decision point rather than offering a one-directional signal on its own.
4) Support / Resistance zones
Support ~ 0.7344 | Resistance ~ 0.7563
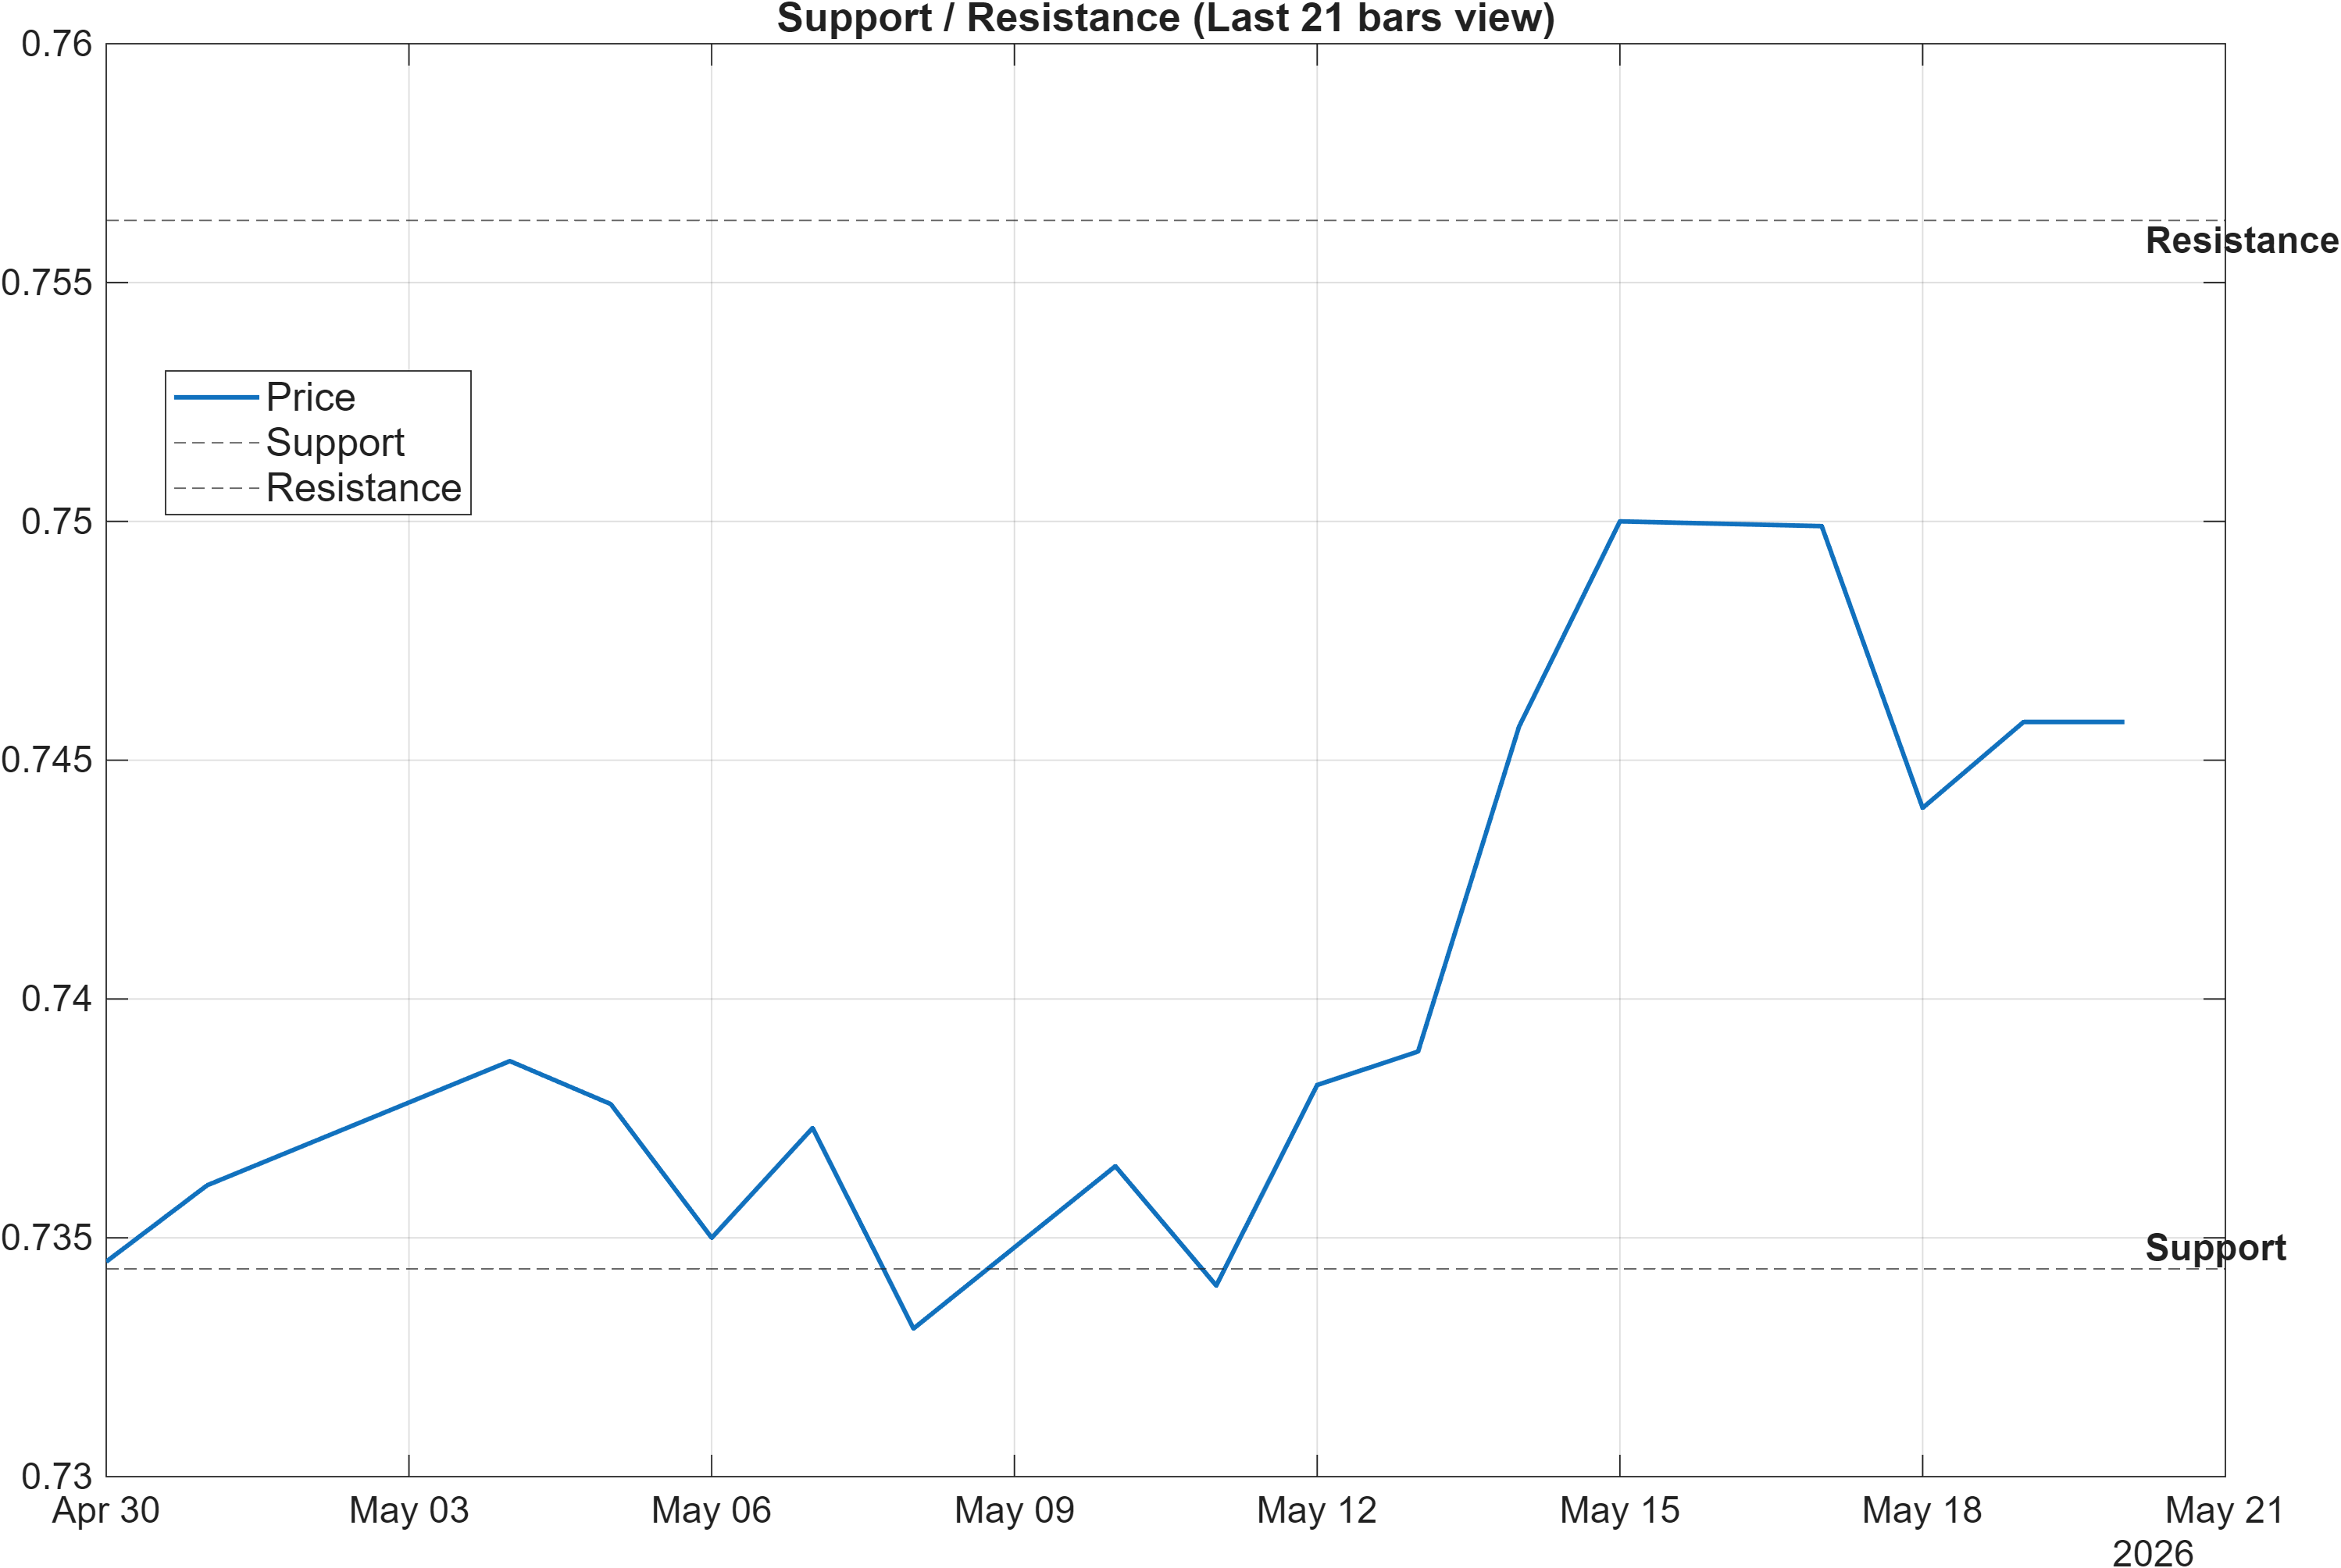
Scenario view: Break above resistance with volume → continuation. Close below support → signal deterioration risk.
The 0.7344–0.7563 bracket is the current decision corridor, and it interacts directly with the “mixed” regime visible elsewhere. With RSI(14) at 64.92 and a positive MACD histogram (0.0011), price is carrying momentum that can pressure the upper boundary. Yet the intermediate rank weakness (3-monthly #915) argues for respecting failed-break risk until the market demonstrates sustained acceptance beyond resistance.
From a structure standpoint, resistance at 0.7563 is the level that can convert “constructive indicators” into “validated trend behavior.” If price can hold above that zone, it typically improves the probability that near-term bullish readings translate into higher-horizon rank repair, potentially lifting monthly (currently #597) out of the lower half and reducing the disconnect with daily/weekly neutral standings.
Conversely, support at 0.7344 is the line that protects the constructive signal stack from reverting into a range breakdown narrative. A sustained close below support would align with the intermediate bearish rank and would be consistent with momentum rolling over despite currently bullish RSI bias. In that case, bullish confluence can fade quickly, especially when volatility is relatively contained (bandwidth 0.0305), because compression regimes can unwind into directional moves once the boundary fails.
Operationally, these levels function less as “targets” and more as probabilistic inflection zones. The market is currently priced in a manner where the next durable signal is more likely to come from level interaction than from incremental changes in oscillator readings.
5) Quant Technical Dashboard (18 Signals)
KGNAI AI Technical Analysis Score (Deep Reinforcement Learning): Rank #405 out of 952 (Rank 1 represents the strongest technical positioning and a higher probability of favorable price behavior. As ranks increase toward the maximum, the probability of favorable outcomes weakens and bearish positioning becomes more dominant.) | Label: Neutral | Score: 0.149
18-Signal Technical Confluence Score: 0.444 (Bullish)
Overall Technical Score (18-signal confluence + DRL rank blend): 0.356 (Bullish)
Note: The blended score reflects signal strength weighted against broader AI technical ranking, which may temporarily diverge.
Blended technical score breakdown: 0.356 (Bullish | Bull 8 / Bear 0 / Neutral 10)
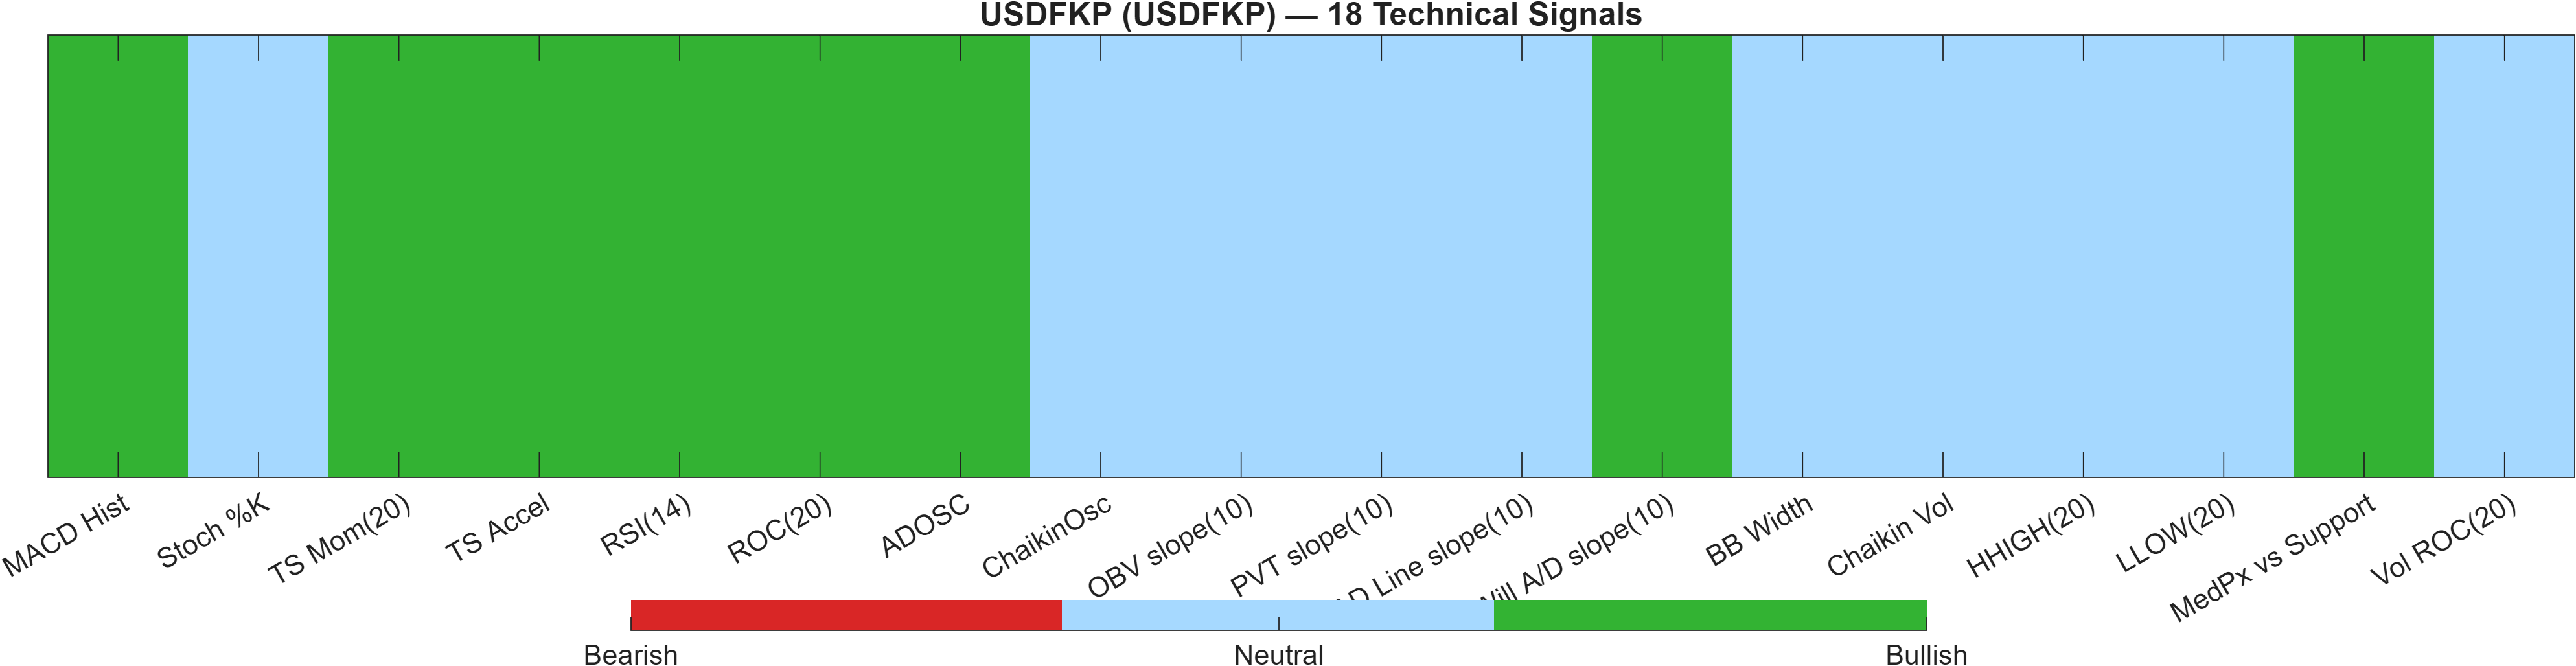
Signal table (Bull/Bear/Neutral)
| Indicator | Value | Signal |
|---|---|---|
| MACD Hist | 0.001099 | Bullish |
| Stoch %K | 72.89 | Neutral |
| TS Mom(20) | 0.0097 | Bullish |
| TS Accel | 0.0188 | Bullish |
| RSI(14) | 64.92 | Bullish |
| ROC(20) | 1.318 | Bullish |
| ADOSC | 58.33 | Bullish |
| ChaikinOsc | 0 | Neutral |
| OBV slope(10) | 0 | Neutral |
| PVT slope(10) | 0 | Neutral |
| AD Line slope(10) | — | Neutral |
| Will A/D slope(10) | 0.0089 | Bullish |
| BB Width | 0.03052 | Neutral |
| Chaikin Vol | -7.28 | Neutral |
| HHIGH(20) | 0.7503 | Neutral |
| LLOW(20) | 0.7331 | Neutral |
| MedPx vs Support | 0.01165 | Bullish |
| Vol ROC(20) | — | Neutral |
Interpretation: Indicator-level signals form the base confluence, which is then adjusted using a separate AI-driven technical ranking model. The final technical score summarizes this combined view.
The technical layer shows breadth without bearish opposition: the blended breakdown reports Bull 8 / Bear 0 / Neutral 10. That composition is notable because it often characterizes markets that are improving, but not yet in a full expansion regime. The confluence score of 0.444 (Bullish) and overall blended technical score of 0.356 (Bullish) indicate that, on balance, independent indicators are pointing in the same direction.
At the same time, the DRL technical rank at #405 remains Neutral with a score of 0.149. This is the type of divergence that frequently appears when indicator signals react faster than cross-sectional, behavior-based ranking models. In practice, it means the setup is technically constructive, but the market has not yet “earned” a stronger standing relative to peers through sustained realized behavior.
Within the signal set, momentum and flow-oriented readings support the constructive view (e.g., RSI 64.92, MACD histogram 0.001099, ADOSC 58.33), while volatility and range-state measures remain mostly neutral (BB Width 0.03052, HHIGH(20) 0.7503, LLOW(20) 0.7331). The result is a coherent message: positive internal tone inside a still-structured range, placing emphasis on whether price can convert confluence into a confirmed break of 0.7563 without slipping below 0.7344.
6) News sentiment + extractive gist
Note: Instrument-specific news matches were not found, so the digest includes broader market/sector headlines. Links are provided for verification.
Sentiment score (avg): 0.021 | Positive: 25% | Neutral: 56% | Negative: 19%
KGNAI AI News Sentiment Score (normalized -1 to +1): Not available (as of —) | Label: Not available | Overall news score: 0.02
Positive Developments
Recent coverage across major financial outlets indicates a modestly constructive macro backdrop for the USD in the near term, with market narratives emphasizing yield support and periodic demand for defensive positioning during risk-sensitive sessions. In FX, this tends to reinforce follow-through when technicals are already improving, consistent with USDFKP’s positive momentum readings (RSI 64.92; MACD histogram 0.0011). Some reporting also highlights episodes of policy vigilance and sensitivity to “excess volatility,” which can dampen one-way price action and keep markets orderly—often compatible with a Bollinger Bandwidth reading like 0.0305 that suggests contained volatility. Overall, the news tone does not appear to be a dominant driver for this instrument, but it provides a supportive context for a controlled push toward key resistance if technical acceptance emerges.
Neutral / Mixed Developments
Broader market items remain mixed and largely informational, with a significant portion of the flow not directly mapping to USDFKP-specific catalysts. This aligns with the sentiment distribution where 56% of coverage is neutral and the average score is only 0.021. In practical market-structure terms, a neutral news tape can reduce the probability of abrupt volatility expansion and leave price discovery more dependent on technical levels and cross-asset positioning. That is consistent with the current “range-with-bias” feel implied by support at 0.7344 and resistance at 0.7563. The key implication is that absent a clear narrative shock, USDFKP may continue to trade primarily off momentum persistence and level interaction rather than headline-driven repricing.
Negative / Risk Signals
Risk signaling in the broader coverage centers on geopolitics, trade policy uncertainty, and event-risk around policy decisions—factors that can alter risk appetite and shift safe-haven dynamics quickly. For FX, such risks can produce short-lived spikes that either validate breakouts or force reversals back into established ranges. This matters for USDFKP because the rank stack is not uniformly strong: the 3-monthly rank (#915) remains a clear caution flag even as shorter-cycle technical confluence is bullish (0.444). If risk narratives intensify, the market may prioritize liquidity and defensive positioning, which can challenge constructive technical setups before they confirm above 0.7563. With volatility currently contained (bandwidth 0.0305), a shock-driven regime change is a non-trivial tail risk.
- What to monitor next: Whether sentiment remains broadly neutral (56%) or shifts meaningfully away from the current average (0.021).
- What to monitor next: Any volatility pickup that changes the current compression profile (bandwidth 0.0305).
- What to monitor next: Price behavior at 0.7563 and 0.7344 as the primary confirmation/invalidations zones.
Sources referenced: Reuters, Bloomberg, Yahoo Finance, MarketWatch, Investing.com
Snapshot: AI Rank (Short–Mid–Long): Mixed (Neutral–Bearish–Neutral) · Technical Confluence: Bullish · Key Levels: Support ~0.73 | Resistance ~0.76 · News Sentiment: Neutral
7) Sources
- AUD/JPY Price Forecast: Loses ground below 113.00, bullish vibe remains intact — https://www.fxstreet.com/news/aud-jpy-price-forecast-loses-ground-below-11300-bullish-vibe-remains-intact-202605200442
- India Gold price today: Gold falls, according to FXStreet data — https://www.fxstreet.com/news/india-gold-price-today-gold-falls-according-to-fxstreet-data-202605200439
- Silver Price Forecast: XAG/USD remains calm above $73.50 as inflationary risks increase — https://www.fxstreet.com/news/silver-price-forecast-xag-usd-remains-calm-above-7350-as-inflationary-risks-increase-202605200433
- UK CPI set to show a temporary inflation respite as energy price cap shields consumers — https://www.fxstreet.com/news/uk-cpi-data-set-to-show-a-temporary-inflation-respite-in-april-providing-leeway-to-boe-202605200215
- British Pound stays depressed below 213.00 vs JPY amid UK political chaos, ahead of UK CPI — https://www.fxstreet.com/news/british-pound-stays-depressed-below-21300-vs-jpy-amid-uk-political-chaos-ahead-of-uk-cpi-202605200415
- Swiss Franc weakens as safe-haven demand lifts USD — https://www.fxstreet.com/news/swiss-franc-weakens-as-safe-haven-demand-lifts-usd-202605200402
- Gold drops to fresh low since late March on firmer USD and hawkish Fed bets — https://www.fxstreet.com/news/gold-drops-to-fresh-low-since-late-march-on-firmer-usd-and-hawkish-fed-bets-202605200351
- WTI drifts lower below $103.50 as traders weigh mixed signals from Trump — https://www.fxstreet.com/news/wti-drifts-lower-below-10350-as-traders-weigh-mixed-signals-from-trump-202605200350
You may also like: How KGNAI AI ranks instruments across global markets
Disclaimer: KGNAI provides AI-generated analytics and educational market commentary only. This is not financial advice. Markets involve risk. Always do your own research.