
EUR/QAR (EURQAR) Technical, Rank & Sentiment Review — 15-May-2026 (Cautious, confirmation-driven stance)
KGNAI Signal + Technical Snapshot + News Sentiment Digest
As of: 15-May-2026
Ticker: EURQAR
EUR/QAR (EURQAR) currently presents a split profile: the cross-sectional daily rank is weak versus the tracked universe, while multiple technical components lean constructive. The rank stack shows Short-term Bearish with Mid/Long Neutral, suggesting the model is not yet rewarding the latest price behavior with durable relative positioning. At the same time, moving-average structure is described as Close vs MA50 = Bullish and MA50 vs MA200 = Bullish, while momentum inputs include a Bullish RSI bias alongside a small positive MACD histogram (0.0055). Volatility remains measured with Bollinger Bandwidth at 0.0379, which often implies that breakouts—if they occur—can be sensitive to nearby levels. The immediate decision map is defined by Support ~4.0457 and Resistance ~4.1683, where confirmation/invalidation becomes clearer than relying on point forecasts.
- Rank stance: Short Bearish | Mid Neutral | Long Neutral
- Technical confluence label: 18-signal confluence Neutral (0.056), while the blended technical score is Bullish (0.310)
- Key levels: Support ~4.0457 | Resistance ~4.1683
- News sentiment bias: Mildly positive (avg 0.165; Positive 50%, Neutral 44%, Negative 6%)
- Confirmation / invalidation: A sustained hold above 4.1683 supports continuation framing; a close below 4.0457 increases deterioration risk per the scenario view.
KGNAI evaluates assets using large cross-sectional datasets built from millions of structured data points. Inputs incorporate fundamental metrics, technical structures, and systematically processed news sentiment. Statistical models, machine learning, and AI frameworks are used to assess relative positioning, signal alignment, and probabilistic behavior across broad universes.
- Ranks are comparative across the tracked universe, not absolute price targets.
- Confluence reflects alignment among independent signal groups.
- Support/resistance levels are probabilistic decision zones, not guarantees.
- Sentiment provides contextual bias within the broader analytical framework.
1) KGNAI AI Analysis
Region: FOREX
Total universe size: 963 ranked instruments
- Daily rank: #872 out of 963 — Bearish
- Weekly rank: #689 out of 963 — Neutral
- Monthly rank: #373 out of 963 — Neutral
- 3-Monthly rank: #562 out of 963 — Neutral
- 6-Monthly rank: #489 out of 963 — Neutral
- Yearly rank: #658 out of 963 — Neutral
The rank stack is best read as a time-horizon disagreement. The daily rank (#872/963) sits in the weaker tail of the universe, consistent with a near-term posture that the model classifies as Bearish. However, longer windows are largely Neutral, including the monthly rank (#373) which is closer to the middle of the distribution than the daily print implies.
This pattern often appears when recent price action has improved faster than the broader, cross-sectional tests are willing to validate. In other words, EURQAR may be showing localized technical strength, but the relative-probability framework is still cautious about persistence when compared with the full 963-instrument set.
Term labeling reinforces that stance: Short-term Bearish against Mid-term Neutral and Long-term Neutral. Operationally, that mix tends to reward confirmation at key levels more than incremental drift—especially when short-horizon rank remains in the lower cohort while longer horizons do not confirm a broad-based improvement. The base framework is conservative by design: rank movements are monitored for persistence rather than isolated jumps, and signal balance is treated as a relative probability shift rather than a directional guarantee.
Access note: Want the full universe and complete rank tables? Unlock full access on KGNAI: https://www.kgnai.com/pricing
2) Price & trend overview
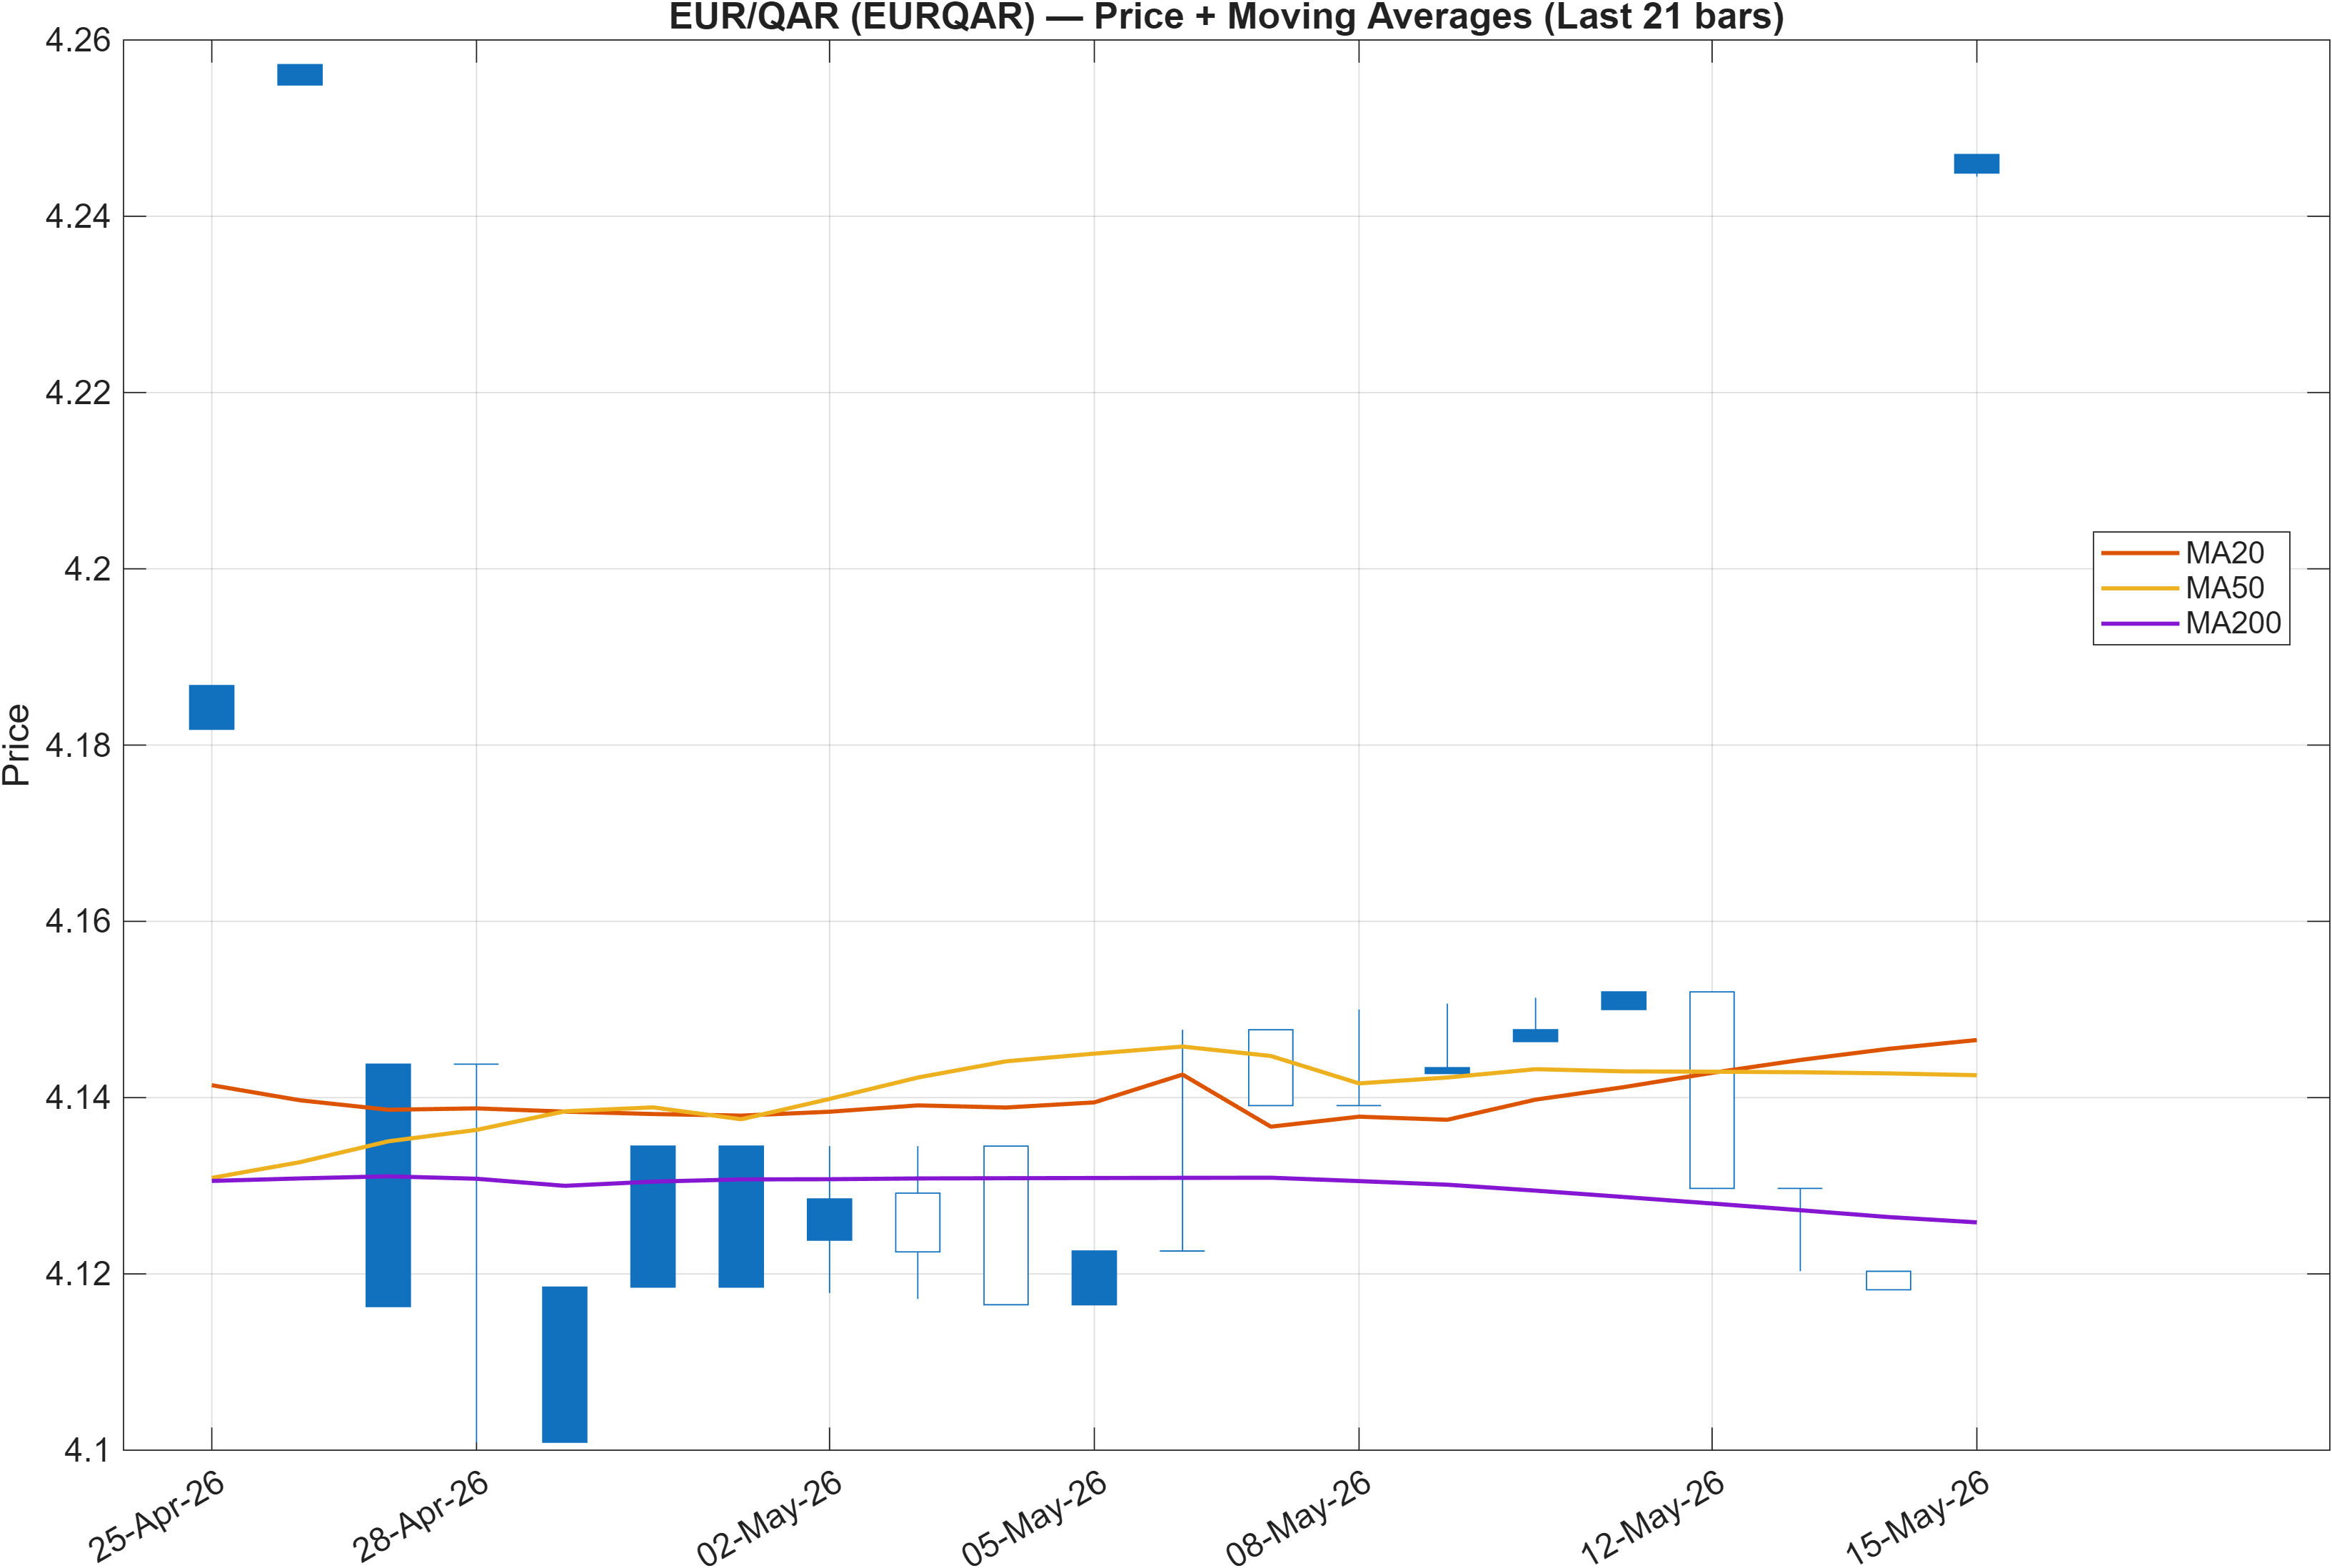
Trend diagnostics are comparatively constructive: the provided interpretation states Close vs MA50 = Bullish and MA50 vs MA200 = Bullish. In classic trend language, that combination is consistent with an instrument trading above its intermediate trend while the intermediate trend is positioned above the longer trend—often associated with an “uptrend structure” even when shorter-horizon conditions are noisy.
The analytical tension is that this trend structure coexists with a cross-sectional daily rank (#872/963) that is notably weak. When trend and rank diverge, the practical read is not that one is “wrong,” but that the market may be in a transition phase: price structure can improve before the broader probability tests—especially those built to be conservative—re-rate the instrument.
The location of key zones matters because trend-following signals can look clean while still being vulnerable to mean reversion if the market fails to defend nearby support. The report identifies Support ~4.0457 and Resistance ~4.1683, which effectively bracket the near-term decision range. In that context, the moving-average structure reads as constructive, but the framework still prefers validation through behavior at 4.1683 (acceptance above) or deterioration risk if the market loses 4.0457.
With the current mix (trend positives, rank caution), the cleanest analytical posture is to treat the trend as intact but not fully confirmed by the broader cross-sectional ranking. That keeps the focus on whether price can sustain trade away from the decision zones rather than on extrapolating the moving-average configuration alone.
3) Momentum & volatility dashboard
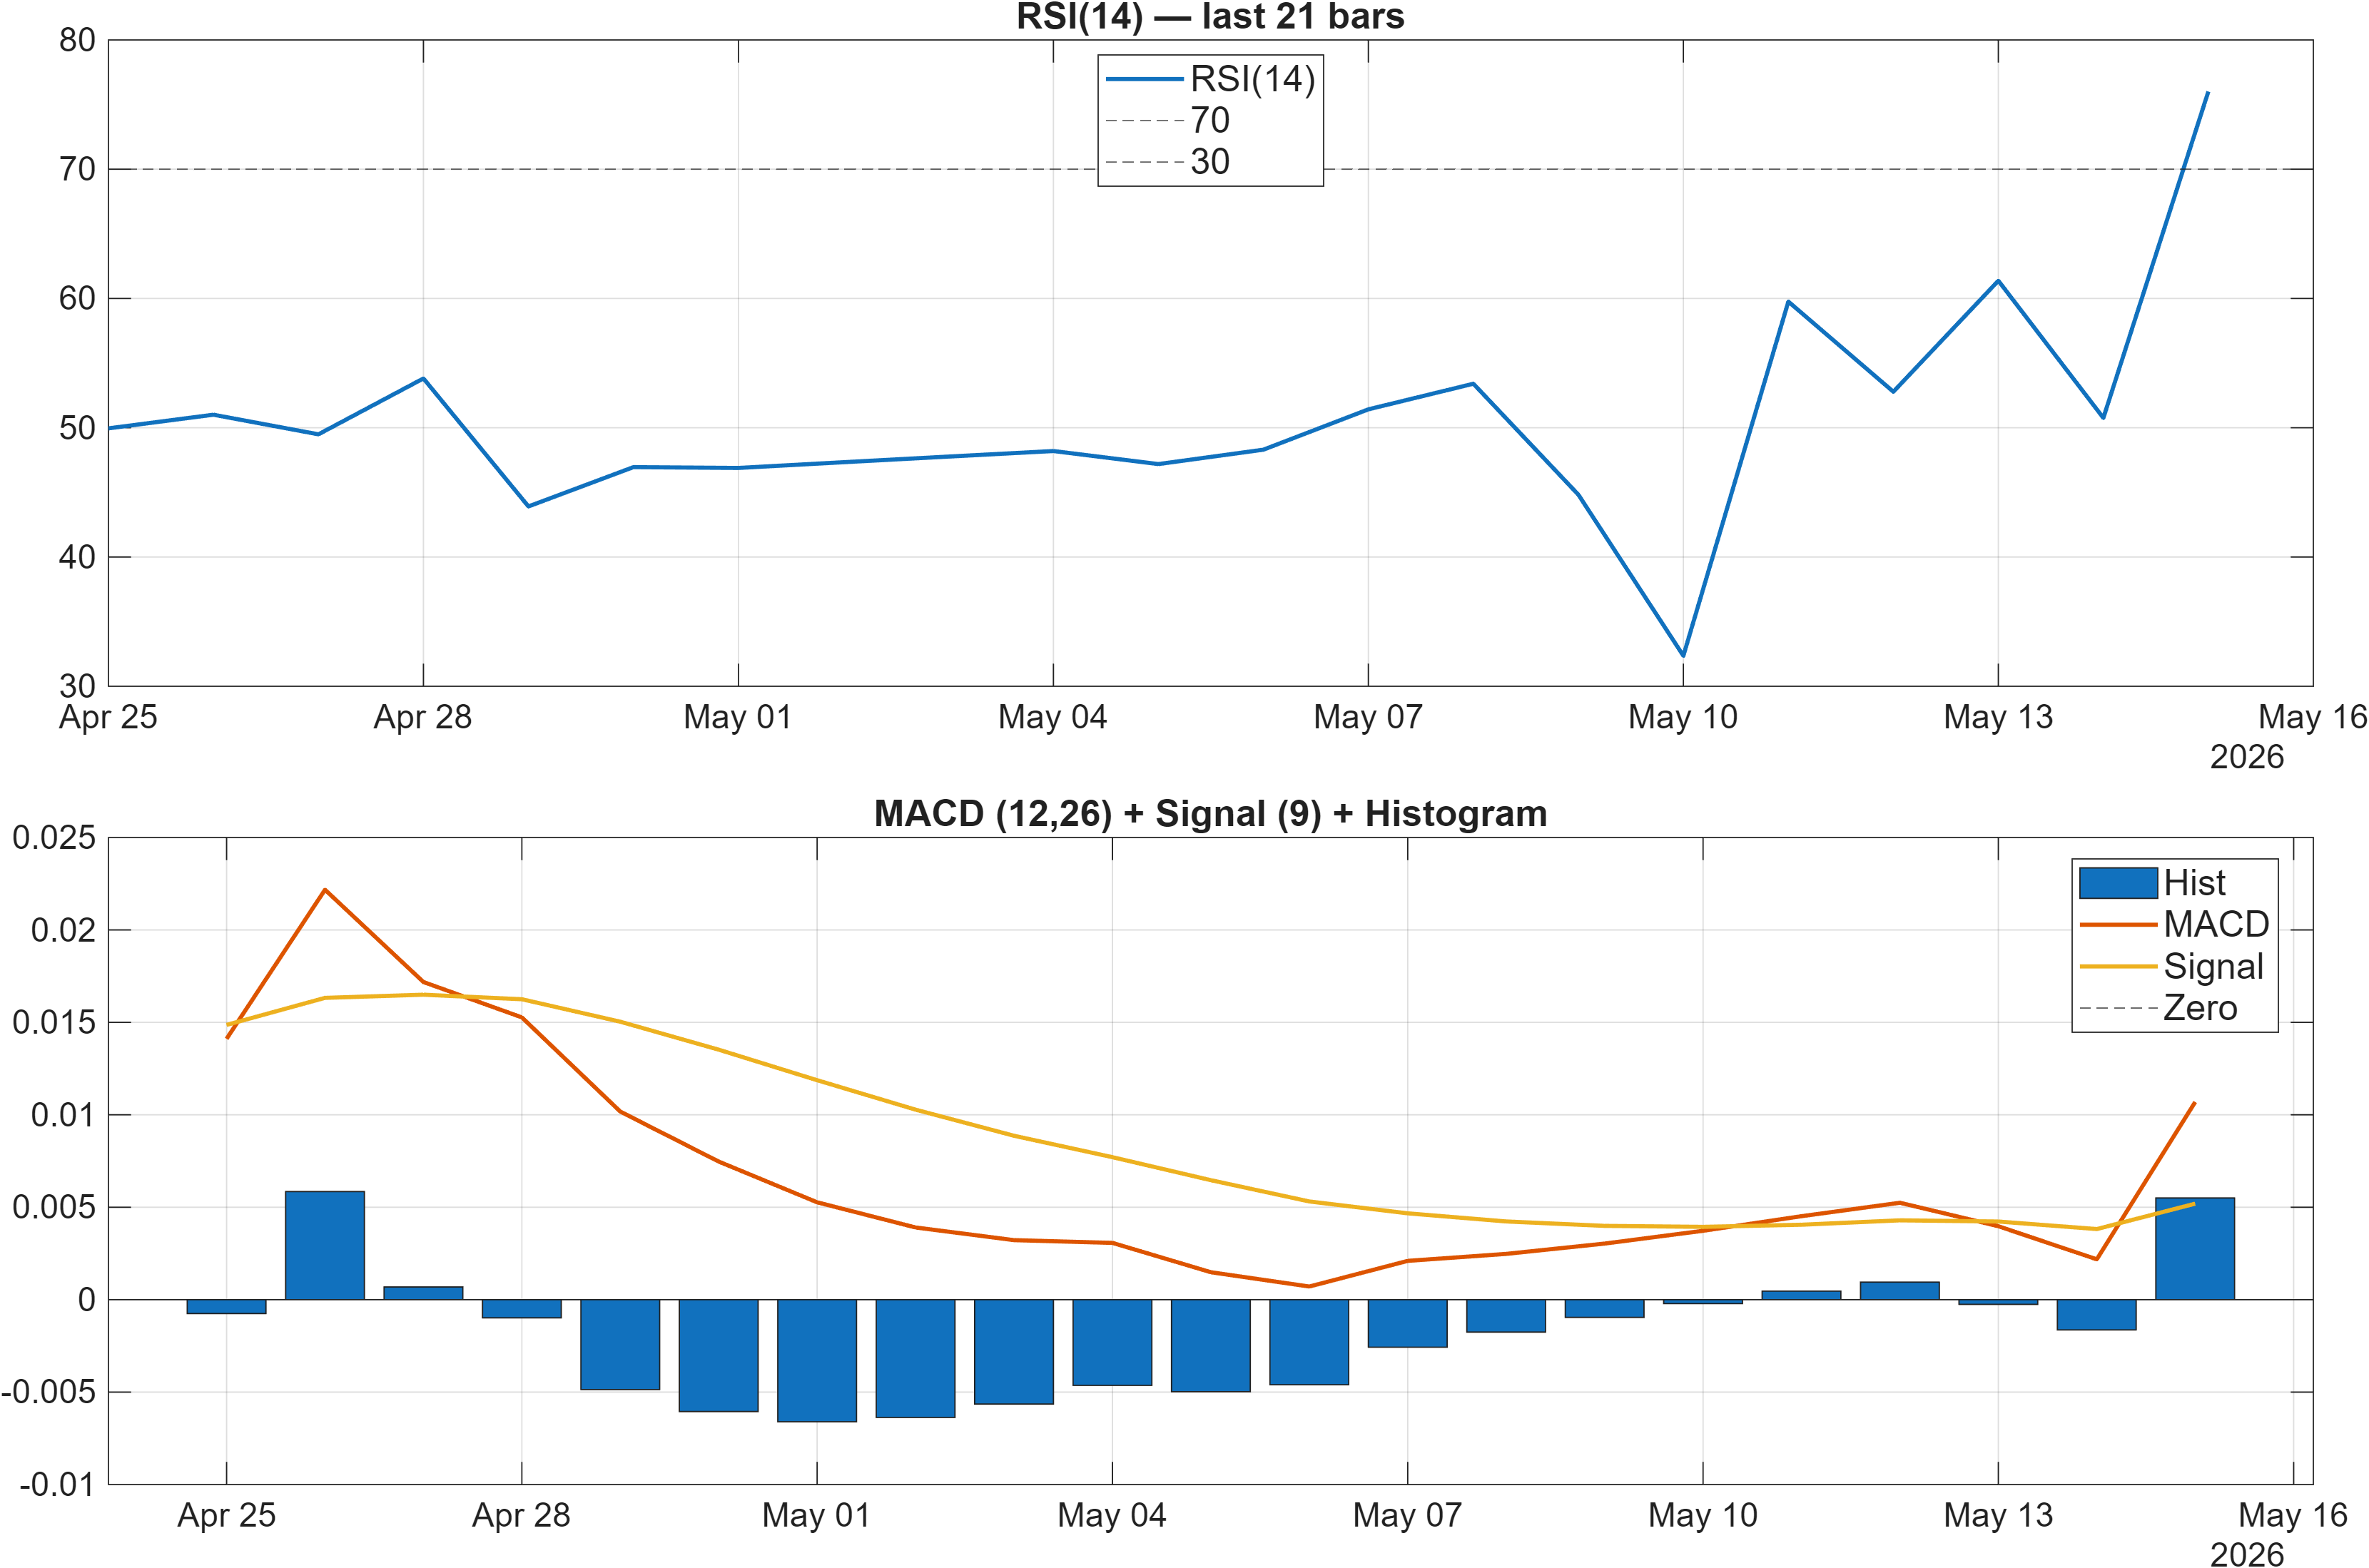
Momentum inputs lean supportive on balance, but they also hint at late-cycle behavior within the current swing. The dashboard interpretation flags RSI bias = Bullish, and the signal table shows RSI(14) at 76.01. That level typically sits in an elevated regime, which can be consistent with trend strength, but it also increases sensitivity to pullbacks if follow-through fails.
MACD is modestly constructive: the interpretation notes MACD hist = 0.0055, aligning with the table value 0.005501 marked Bullish. At the same time, other momentum elements show friction—Stoch %K at 98.37 is labeled Bearish, and both TS Mom(20) at -0.01 and TS Accel at -0.2173 are also bearish. The combined message is “uptrend characteristics, but momentum is stretched and not uniformly accelerating.”
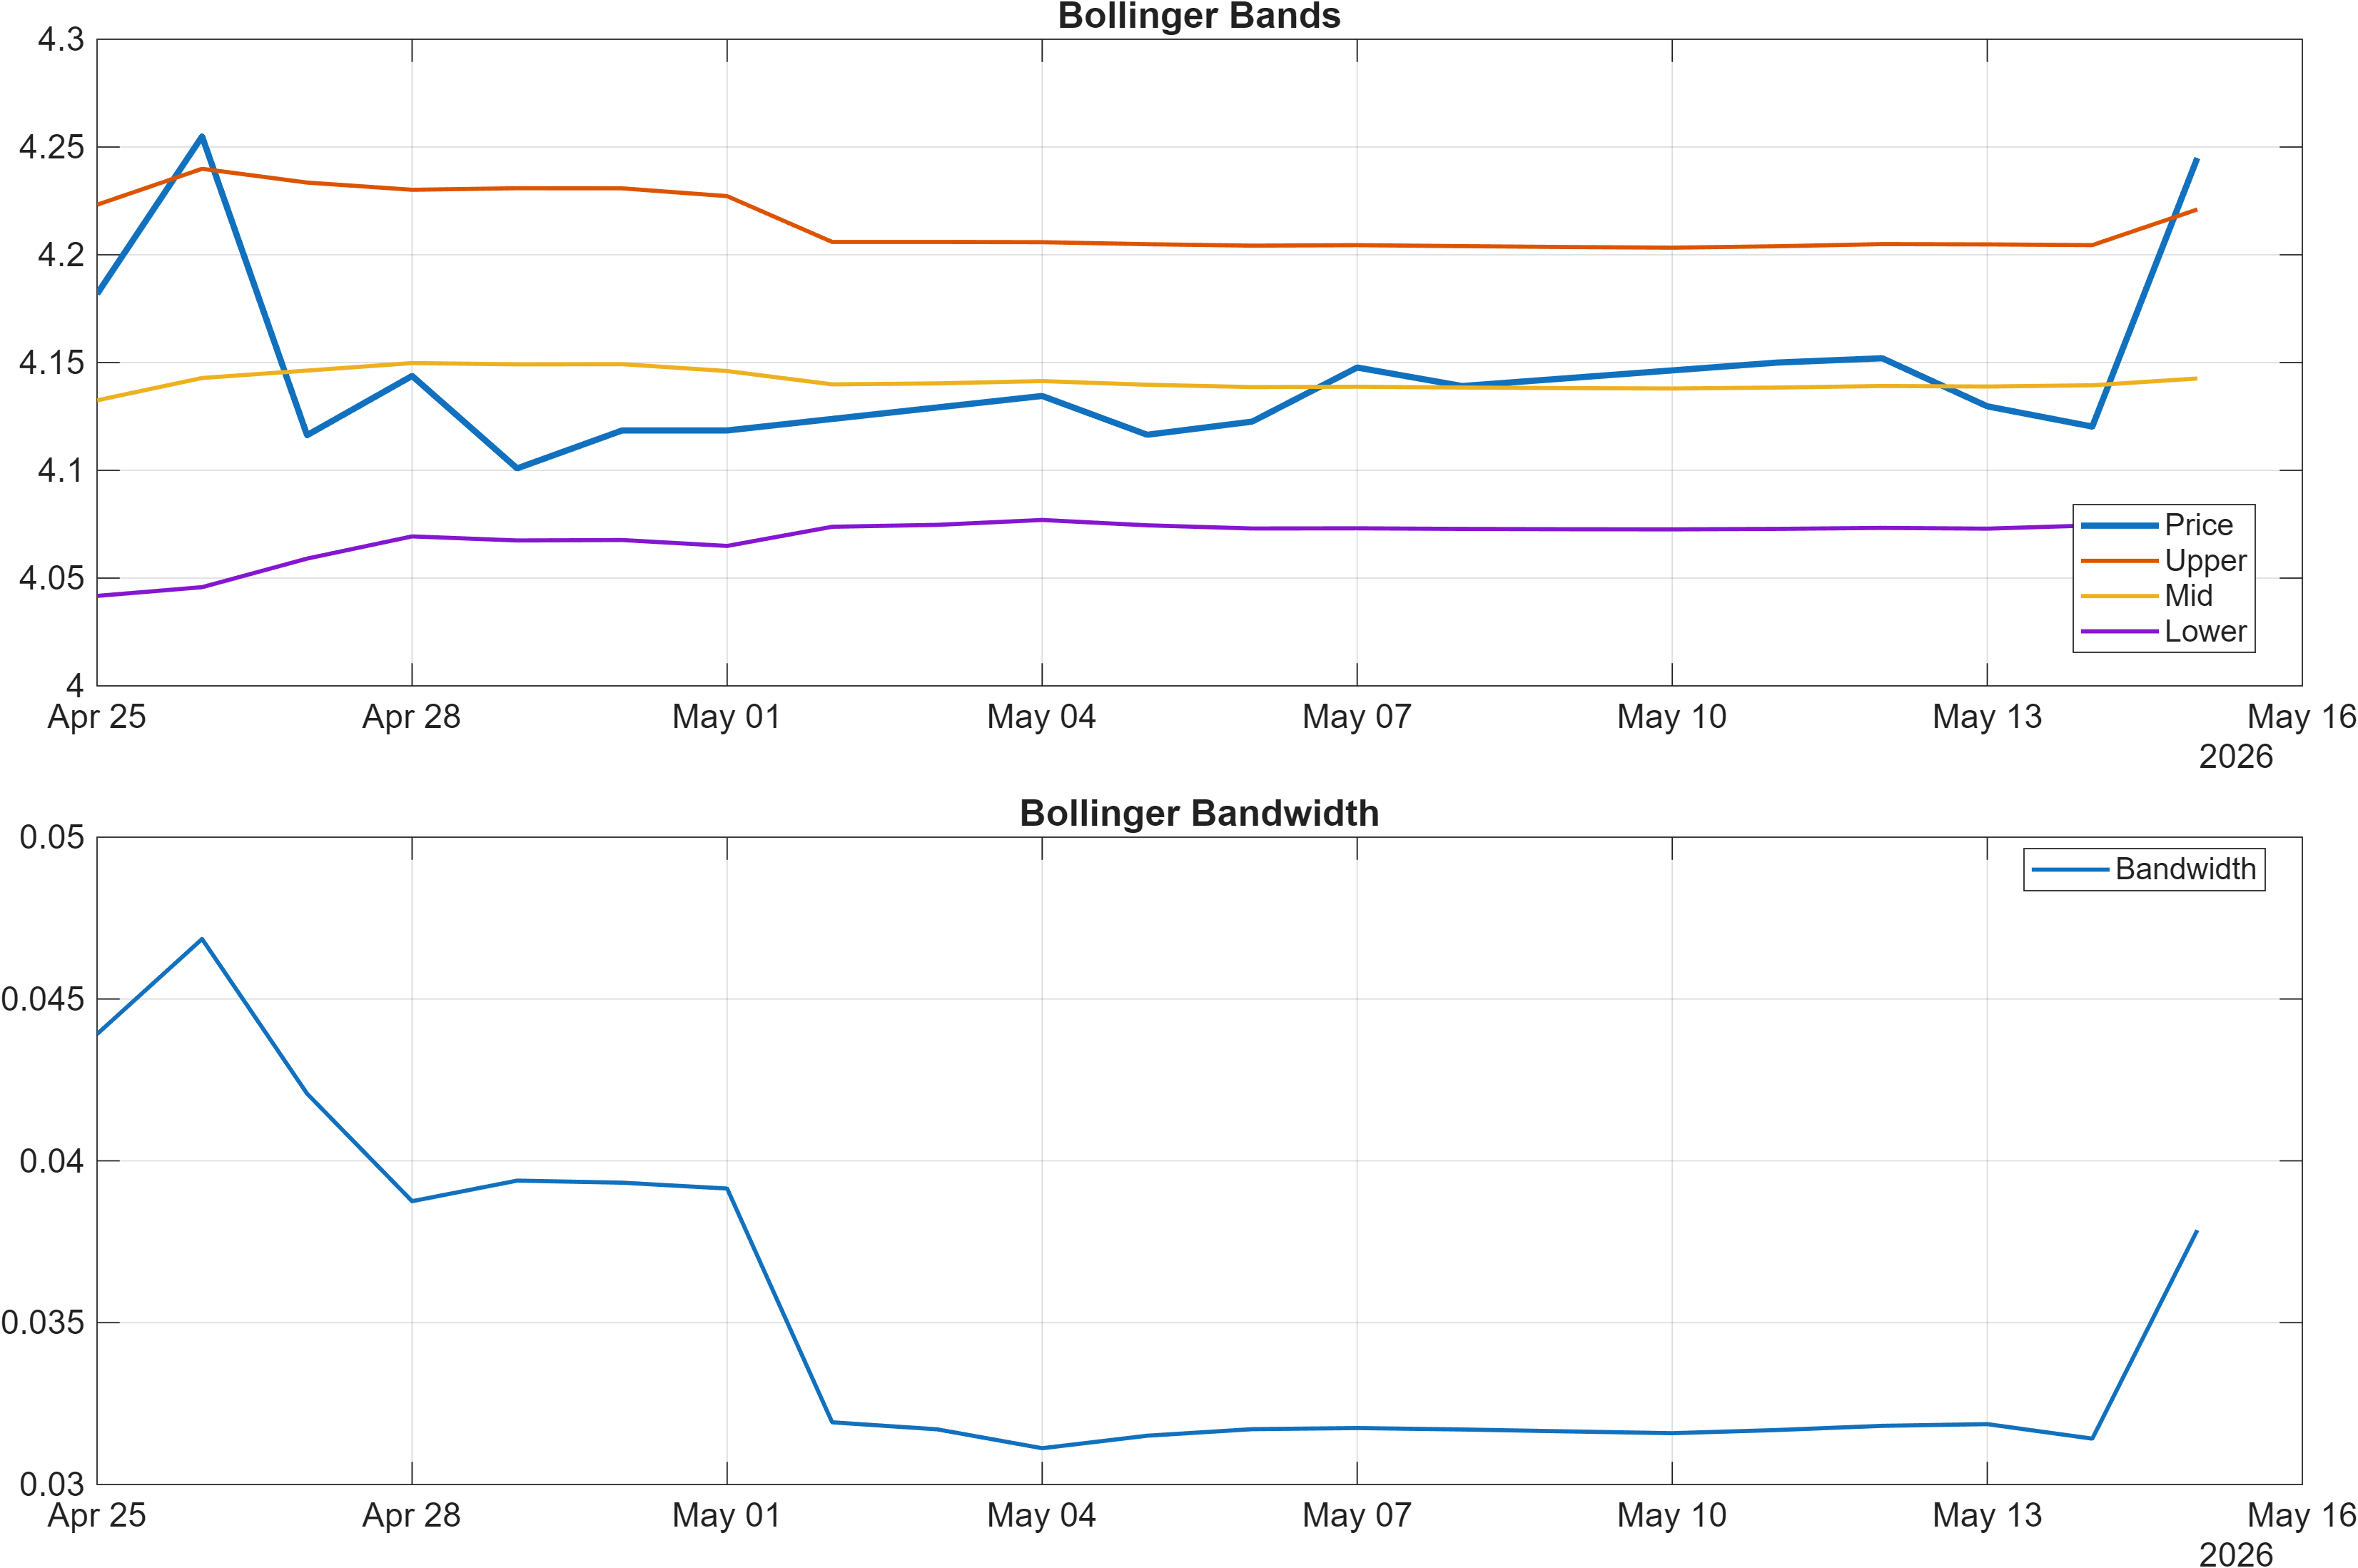
Volatility is contained rather than expansive, with Bandwidth (volatility regime) latest = 0.0379 (table BB Width 0.03786, neutral). Lower-to-moderate bandwidth often coincides with tighter trading conditions, where breaks above resistance can matter more because they represent a regime shift rather than routine noise. In short: momentum is positive but uneven; volatility is not signaling a broad expansion yet, placing extra weight on the nearby structural levels.
4) Support / Resistance zones
Support ~ 4.0457 | Resistance ~ 4.1683
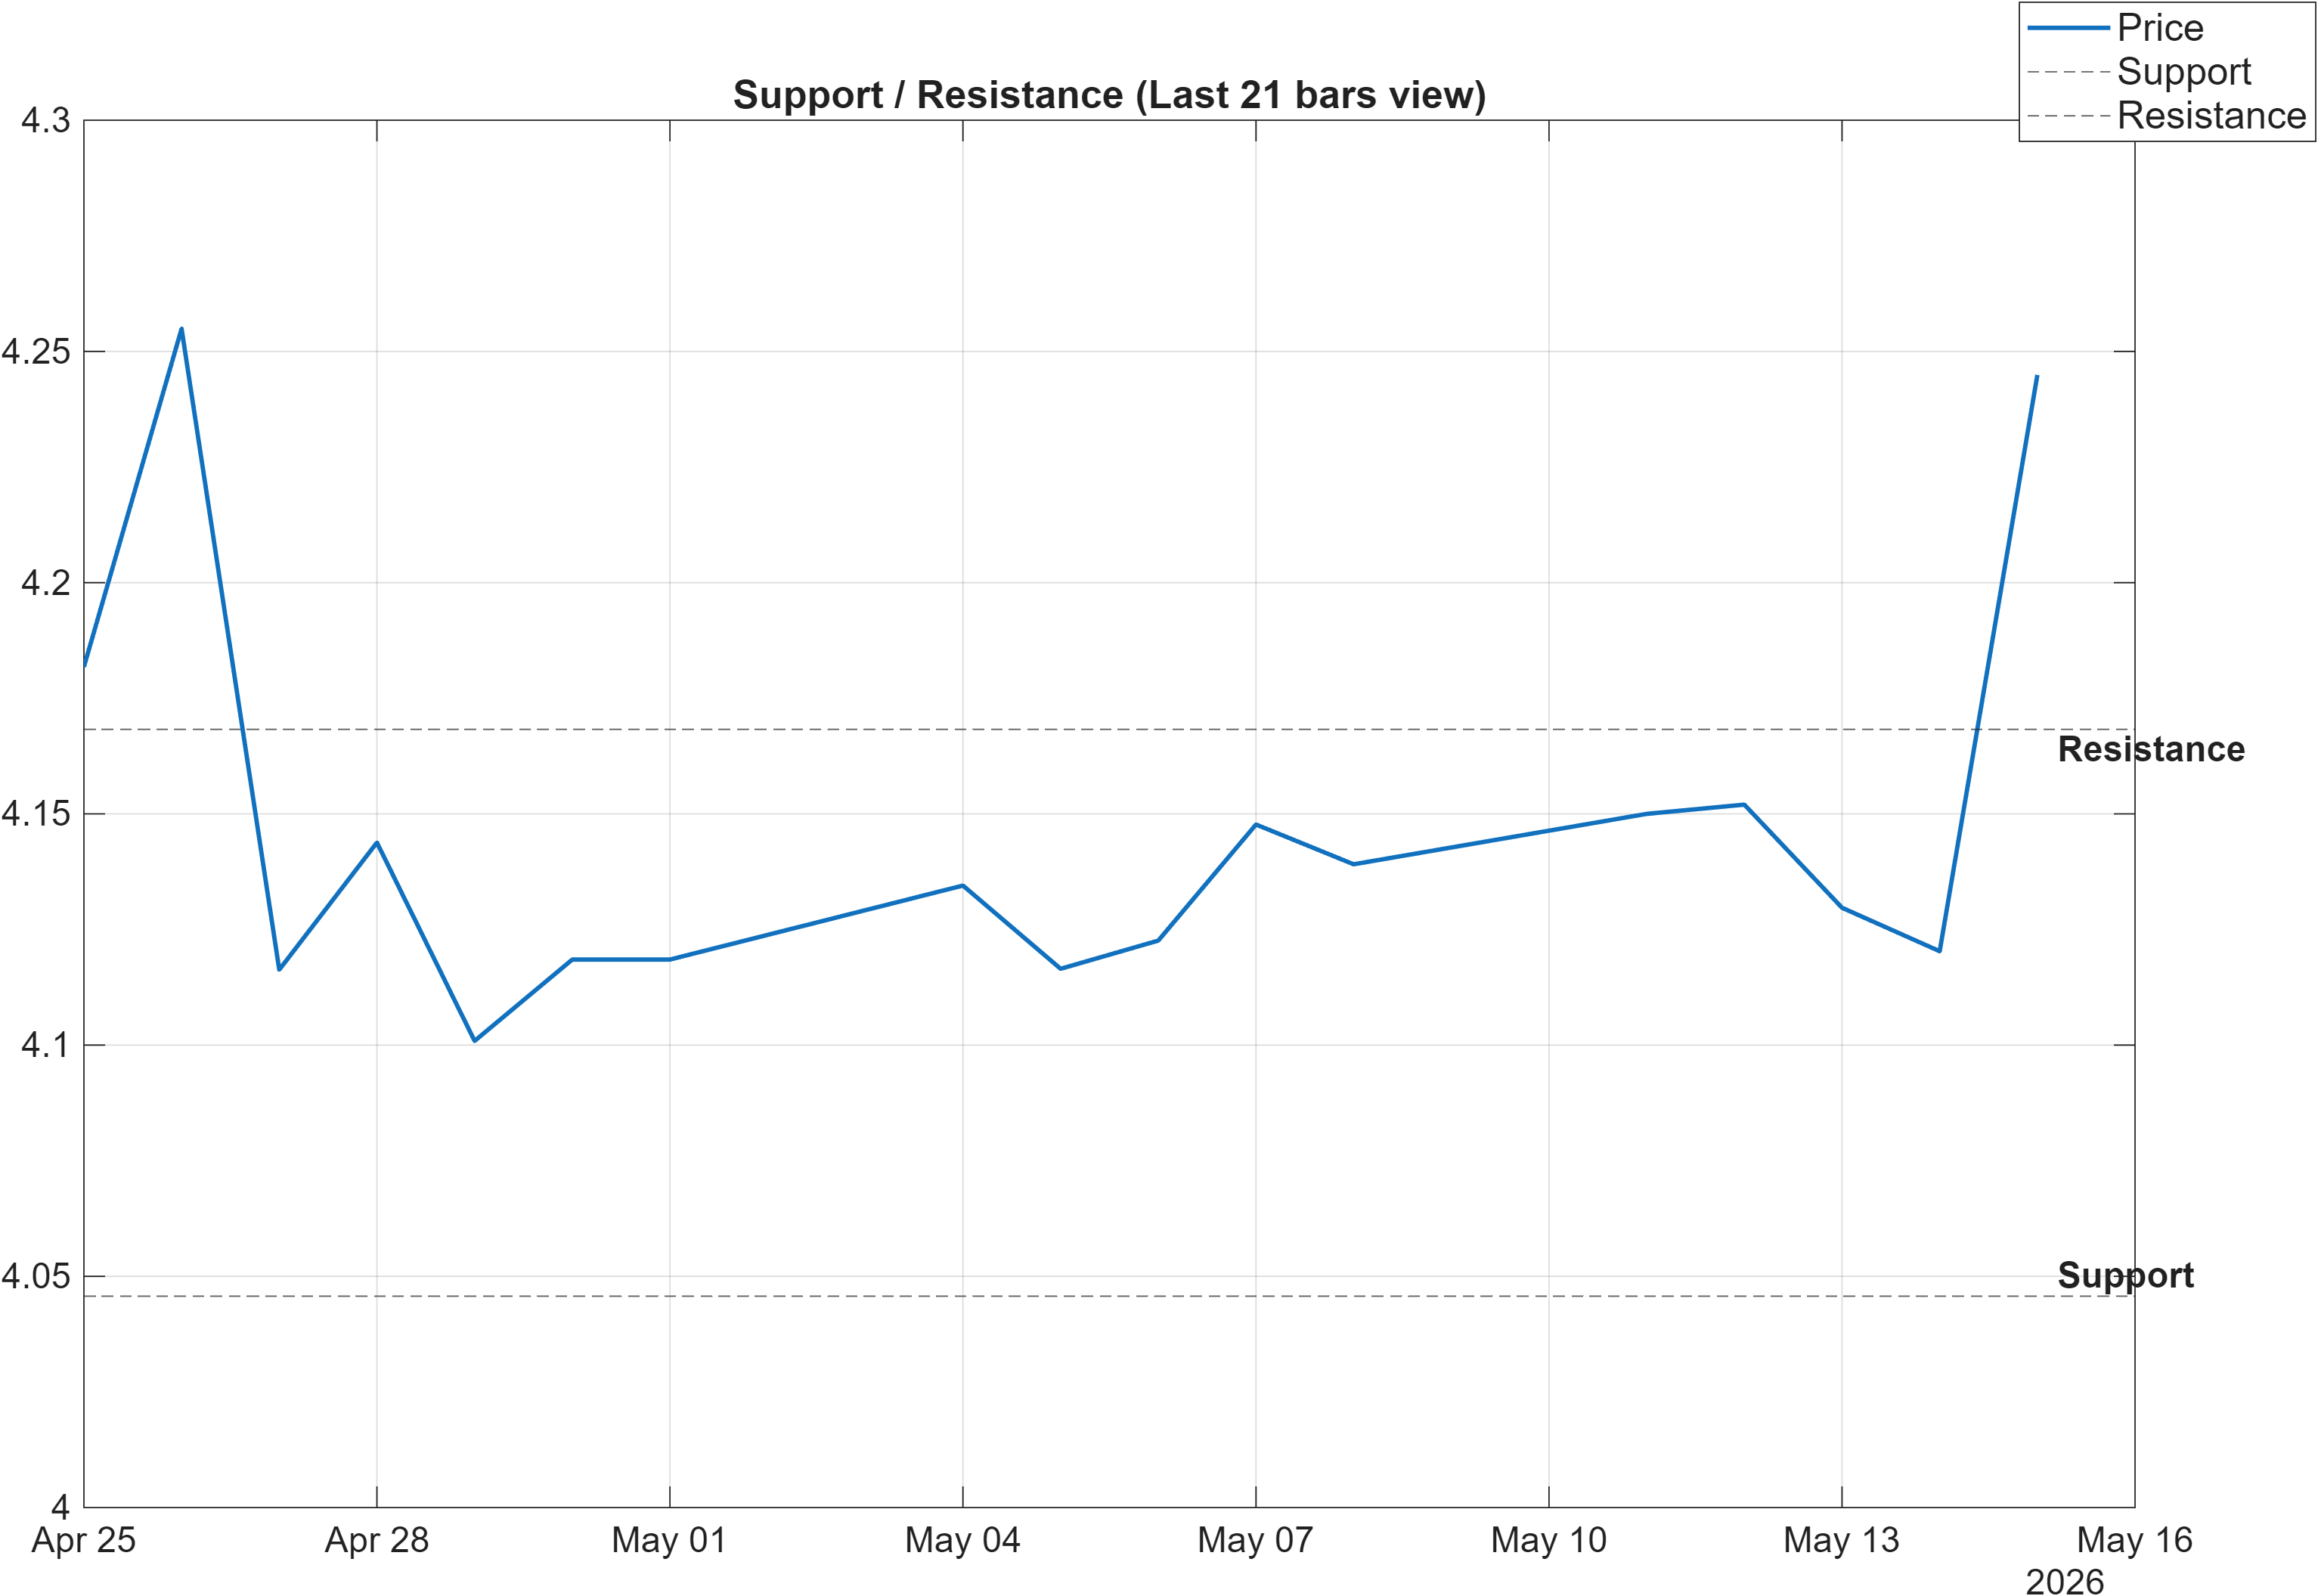
The level structure is tight enough that execution quality tends to dominate thesis quality. With Support ~4.0457 and Resistance ~4.1683, EURQAR is framed around two zones that can cleanly separate “trend continuation” from “failed advance / retrace risk,” without relying on forecasting.
The scenario language provided is explicit: break above resistance with volume → continuation, while a close below support → signal deterioration risk. Even without adding volume analytics beyond what’s stated, the structure itself is consistent with a market that may require acceptance above 4.1683 to convert bullish moving-average conditions into a more robust continuation profile.
The technical dashboard provides supporting context for why these levels matter now. Elevated momentum (e.g., RSI(14) 76.01) can persist in trending markets, but it also increases the likelihood that pullbacks test structure. Meanwhile, volatility is not especially wide (bandwidth 0.0379), which can make failed breaks more common if participation doesn’t broaden. That combination argues for treating 4.1683 not as a “target,” but as a validation boundary where the market must demonstrate staying power.
On the downside, 4.0457 functions as the nearby “line in the sand” for the current constructive interpretation of trend. A close below it would not automatically negate longer-horizon neutrality (monthly and 6-month ranks are neutral), but it would align more closely with the weak daily rank (#872) and raise the odds that the recent upswing was more corrective than durable. In a mixed-rank environment, these zones are the most defensible way to impose discipline on the narrative.
5) Quant Technical Dashboard (18 Signals)
KGNAI AI Technical Analysis Score (Deep Reinforcement Learning): Rank #46 out of 963 (Rank 1 represents the strongest technical positioning and a higher probability of favorable price behavior. As ranks increase toward the maximum, the probability of favorable outcomes weakens and bearish positioning becomes more dominant.) | Label: Bullish | Score: 0.904
18-Signal Technical Confluence Score: 0.056 (Neutral)
Overall Technical Score (18-signal confluence + DRL rank blend): 0.310 (Bullish)
Note: The blended score reflects signal strength weighted against broader AI technical ranking, which may temporarily diverge.
Blended technical score breakdown: 0.310 (Bullish | Bull 5 / Bear 4 / Neutral 9)
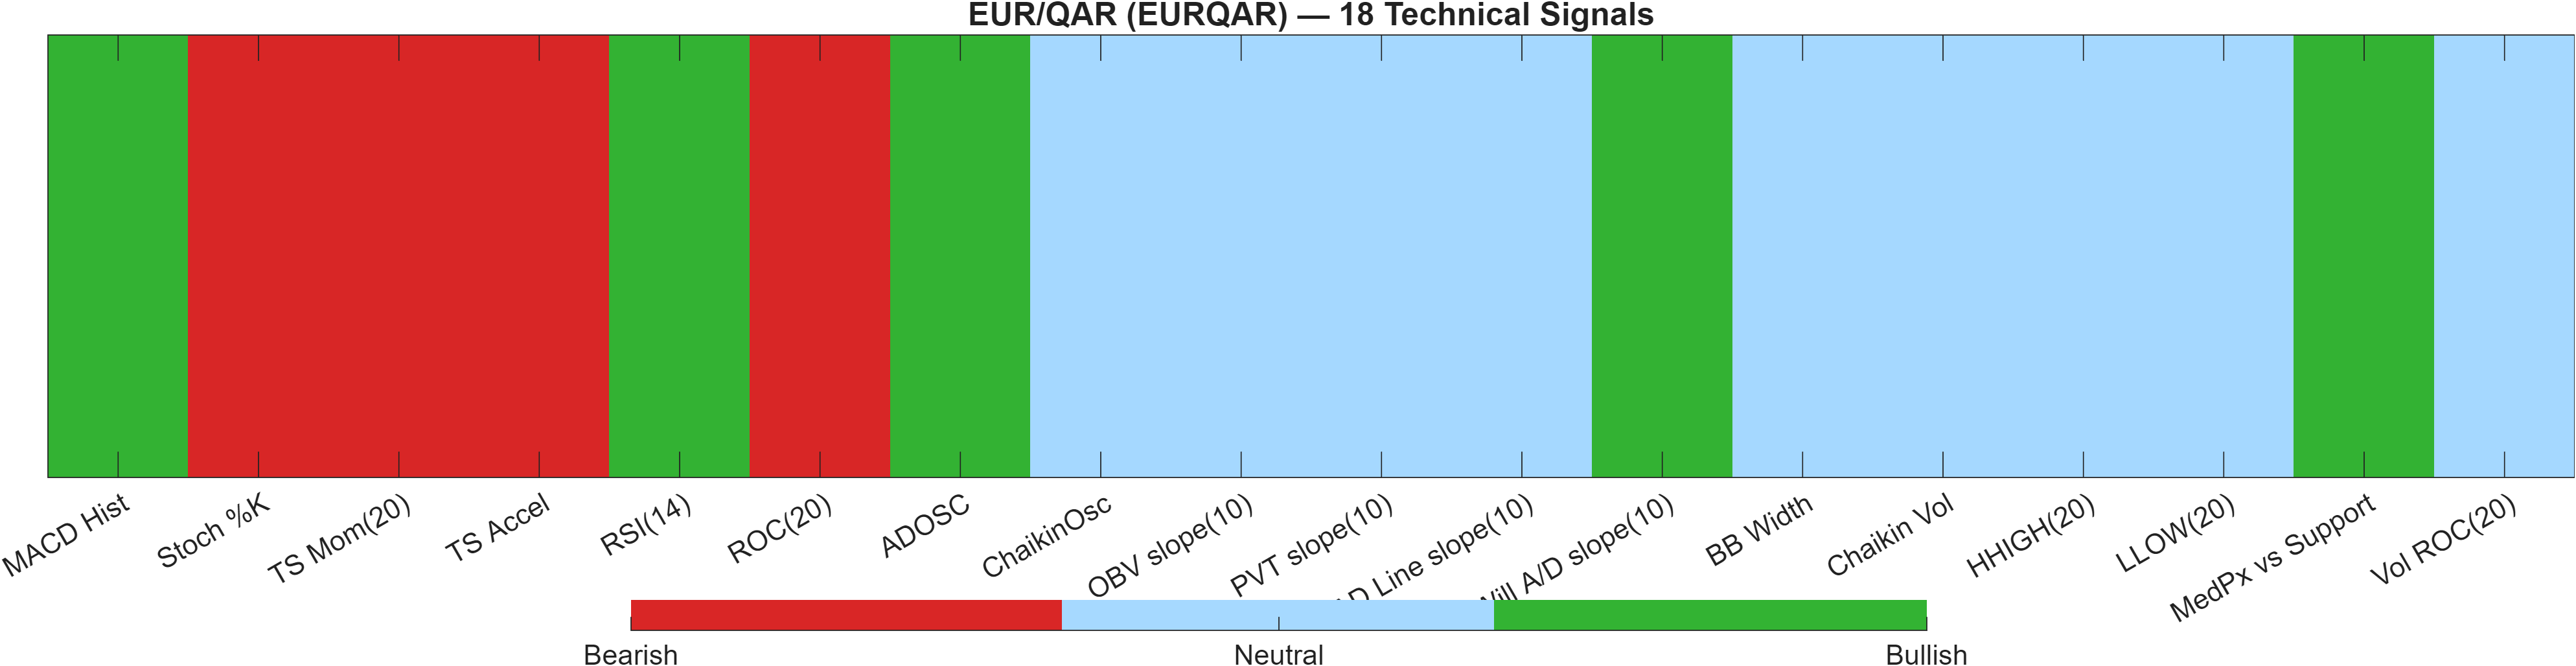
The dashboard’s main insight is a compression vs. ranking asymmetry. On one hand, the 18-signal confluence score is 0.056 and labeled Neutral, reflecting a signal map dominated by “wait-and-see” readings (Neutral 9) with only a small net tilt (Bull 5 vs Bear 4). On the other hand, the separate AI technical model is emphatically constructive, with a DRL technical rank of #46 out of 963 and a Bullish label (score 0.904).
When confluence is neutral but the AI technical rank is in the strong cohort, it typically means the model is detecting pattern-level structure that is not fully captured by a simple majority vote of indicators. The blended outcome reflects that: Overall Technical Score 0.310, labeled Bullish. This is precisely the kind of “temporary divergence” the note references.
At the indicator level, the mix is intuitive. Constructive readings include MACD Hist 0.005501 (Bullish) and RSI(14) 76.01 (Bullish), while counterweights include Stoch %K 98.37 (Bearish) and ROC(20) -0.235 (Bearish). The neutrality cluster (e.g., BB Width 0.03786, multiple volume/flow slopes at 0) reinforces that the market is not broadcasting broad participation across all sub-signals.
Signal table (Bull/Bear/Neutral)
| Indicator | Value | Signal |
|---|---|---|
| MACD Hist | 0.005501 | Bullish |
| Stoch %K | 98.37 | Bearish |
| TS Mom(20) | -0.01 | Bearish |
| TS Accel | -0.2173 | Bearish |
| RSI(14) | 76.01 | Bullish |
| ROC(20) | -0.235 | Bearish |
| ADOSC | 8 | Bullish |
| ChaikinOsc | 0 | Neutral |
| OBV slope(10) | 0 | Neutral |
| PVT slope(10) | 0 | Neutral |
| AD Line slope(10) | 0 | Neutral |
| Will A/D slope(10) | 0.1464 | Bullish |
| BB Width | 0.03786 | Neutral |
| Chaikin Vol | -48.92 | Neutral |
| HHIGH(20) | 4.257 | Neutral |
| LLOW(20) | 4.101 | Neutral |
| MedPx vs Support | 0.2001 | Bullish |
| Vol ROC(20) | — | Neutral |
The clean takeaway is that EURQAR’s technical posture is constructive but not unanimous: the blended framework leans bullish, yet the internal signal mix contains enough bearish momentum elements to keep the market sensitive to the 4.1683/4.0457 decision band.
6) News sentiment + extractive gist
Note: Instrument-specific news matches were not found, so the digest includes broader market/sector headlines. Links are provided for verification.
Sentiment score (avg): 0.165 | Positive: 50% | Neutral: 44% | Negative: 6%
KGNAI AI News Sentiment Score (normalized -1 to +1): Not available (as of —) | Label: Not available | Overall news score: 0.17
Positive Developments
Recent coverage across major financial outlets indicates a mildly constructive tone for broad risk assets, shaped by intermittent optimism around trade and selective resilience in global markets. The aggregate sentiment mix supports this: a 0.165 average score with 50% positive items against only 6% negative. For FX, that backdrop can matter indirectly through shifts in risk appetite, commodity-linked flows, and relative-rate expectations. At the same time, the positivity is described more as “incremental improvement” than a clean re-rating, which aligns with EURQAR’s mixed framework: constructive technical structure alongside a weaker short-horizon rank. In practice, the constructive news tone may help stabilize near-term positioning, but it does not remove the need for level-based confirmation around 4.1683 and defense of 4.0457. With instrument-specific matches not available, the sentiment signal should be treated as contextual rather than causal for EURQAR.
Neutral / Mixed Developments
The neutral cluster (reflected in 44% of items) suggests that macro cross-currents remain unresolved: markets are simultaneously processing rates narratives, geopolitical uncertainty, and mixed moves across traditional hedges. This “two-way” environment often maps to EURQAR’s technical configuration, where some indicators are supportive (e.g., MACD histogram 0.0055) while others warn of stretch (e.g., RSI(14) 76.01 alongside a bearish Stoch %K 98.37). In such regimes, volatility can stay contained until it doesn’t—consistent with the measured bandwidth 0.0379. The neutral take is that broader narratives may keep price action reactive around nearby support/resistance rather than directional on its own.
Negative / Risk Signals
Risk coverage remains present even if not dominant, and the sentiment distribution still contains a 6% negative share—enough to matter when positioning is tight. For FX markets, risk-off impulses can transmit quickly through USD strength, higher real-rate expectations, or sudden liquidity preference. That type of macro risk would be consistent with EURQAR failing to hold its decision structure, particularly if price slips below 4.0457, which the scenario view flags as deterioration risk. Importantly, the framework already shows a weak cross-sectional daily rank (#872/963), so negative macro surprises can amplify the “short-term bearish / mid-to-long neutral” tension. In this setup, the clean risk lens is to watch whether any broader risk episode coincides with momentum cooling from elevated conditions (e.g., RSI 76.01) rather than expecting volatility to expand pre-emptively.
- Whether EURQAR can sustain acceptance above 4.1683 while volatility remains relatively contained (0.0379 bandwidth).
- Any momentum cooling signals given elevated RSI(14) 76.01 and bearish Stoch %K 98.37.
- Whether broader risk tone shifts enough to pressure support near 4.0457.
Sources referenced: Reuters, Bloomberg, Yahoo Finance, MarketWatch, Investing.com
Snapshot: AI Rank (Short–Mid–Long): Mixed (Bearish–Neutral–Neutral) · Technical Confluence: Neutral · Key Levels: Support ~4.05 | Resistance ~4.17 · News Sentiment: Positive
7) Sources
- WTI Price Forecast: Rises to near $98.50 as bullish bias prevails — https://www.fxstreet.com/news/wti-price-forecast-rises-to-near-9850-as-bullish-bias-prevails-202605150525
- Indian Rupee remains weak amid concerns over India’s forex reserves — https://www.fxstreet.com/news/indian-rupee-remains-weak-amid-concerns-over-indias-forex-reserves-202605150524
- Gold weakens below $4,600 as USD rallies on Fed hike bets and geopolitical risks — https://www.fxstreet.com/news/gold-declines-for-fourth-straight-day-as-hawkish-fed-bets-and-geopolitics-support-usd-202605150343
- Asian stocks fall before Trump-Xi talks; South Korea’s Kospi slumps from record high — https://www.fxstreet.com/news/asia-stocks-fall-before-trump-xi-talks-south-koreas-kospi-slumps-from-record-high-202605150459
- BOJ expected to raise rates to 1.0% in June, hike again in Q4 — Reuters poll — https://www.fxstreet.com/news/boj-expected-to-raise-rates-to-10-in-june-hike-again-in-q4-reuters-poll-202605150451
- AUD/JPY Price Forecast: Slips to near 114.00, but maintains bullish structure above 100-day average — https://www.fxstreet.com/news/aud-jpy-price-forecast-slips-to-near-11400-but-maintains-bullish-structure-above-100-day-average-202605150439
- India Gold price today: Gold falls, according to FXStreet data — https://www.fxstreet.com/news/india-gold-price-today-gold-falls-according-to-fxstreet-data-202605150435
- British Pound hangs near one-week low vs JPY; seems vulnerable below 212.00/100-day SMA — https://www.fxstreet.com/news/british-pound-hangs-near-one-week-low-vs-jpy-seems-vulnerable-below-21200-100-day-sma-202605150417
You may also like: How KGNAI AI ranks instruments across global markets
Disclaimer: KGNAI provides AI-generated analytics and educational market commentary only. This is not financial advice. Markets involve risk. Always do your own research.