
USDFJD (USD/FJD) — Neutral-to-Mixed Technical Alignment as of 13-May-2026
USD/FJD (USDFJD) is currently characterized by mixed cross-horizon positioning: a neutral short- to mid-term rank profile alongside a materially weaker long-term rank backdrop. In technical terms, the setup is not defined by a single dominant signal; instead, it reflects a blend of mildly constructive momentum readings (including RSI(14) at 56.09) and offsetting bearish elements (such as a MACD histogram at -0.0001439 and a 6-month rank of #896). Volatility conditions remain relevant: Bollinger Bandwidth at 0.0145 suggests a relatively contained regime where breaks can become more informative than oscillations. From a levels perspective, the market is framed by a defined decision corridor—support near 2.1711 and resistance near 2.2447—where acceptance or rejection is likely to shape the next phase of trend behavior. News sentiment is modest and broadly neutral (0.026 average), consistent with a market lacking a strong narrative catalyst in the provided feed.
Key Takeaways
- Rank stance: Short-term Neutral | Mid-term Neutral | Long-term Bearish
- Technical confluence label: Neutral (18-signal confluence score 0.167; blended score 0.315 labeled Bullish)
- Key levels: Support ~ 2.1711 | Resistance ~ 2.2447
- News sentiment bias: Neutral (avg 0.026; 25% positive / 63% neutral / 12% negative)
- Confirmation / invalidation condition: Confirmation improves on sustained acceptance above 2.2447; deterioration risk increases on closes below 2.1711.
What KGNAI Measures
KGNAI evaluates assets using large cross-sectional datasets built from millions of structured data points. Inputs incorporate fundamental metrics, technical structures, and systematically processed news sentiment. Statistical models, machine learning, and AI frameworks are used to assess relative positioning, signal alignment, and probabilistic behavior across broad universes.
How to Read This Report
- Ranks are comparative across the tracked universe, not absolute price targets.
- Confluence reflects alignment among independent signal groups.
- Support/resistance levels are probabilistic decision zones, not guarantees.
- Sentiment provides contextual bias within the broader analytical framework.
1) KGNAI AI Analysis
Region: FOREX
Total universe size: 960 ranked instruments
- Daily rank: #365 out of 960 — Neutral
- Weekly rank: #108 out of 960 — Bullish
- Monthly rank: #490 out of 960 — Neutral
- 3-Monthly rank: #593 out of 960 — Neutral
- 6-Monthly rank: #896 out of 960 — Bearish
- Yearly rank: Not available for this horizon — Not available
The rank stack for USDFJD is best read as time-horizon dispersion rather than a single-direction call. The weekly rank (#108) sits in the upper tier of the 960-instrument universe, contrasting with a daily rank (#365) that is closer to the middle of the distribution. This combination often appears when an intermediate move remains intact but shorter-term trading conditions become more balanced.
The longer horizon is materially weaker: the 6-month rank (#896) places the instrument in the lower tail of the universe, implying that longer-run behavior has been comparatively less favorable versus peers. Meanwhile, the monthly (#490) and 3-month (#593) ranks sit in broadly neutral territory, suggesting the market has not yet rebuilt sufficient persistence to resolve that longer-term drag.
From a regime perspective, this mixture supports the stated term view—Short-term Neutral, Mid-term Neutral, Long-term Bearish—and highlights why confirmation should be sought through independent technical clustering rather than any single rank point. The absence of a yearly rank is explicitly flagged as Not available in the provided data, keeping the interpretation anchored to the horizons shown.
2) Price & trend overview
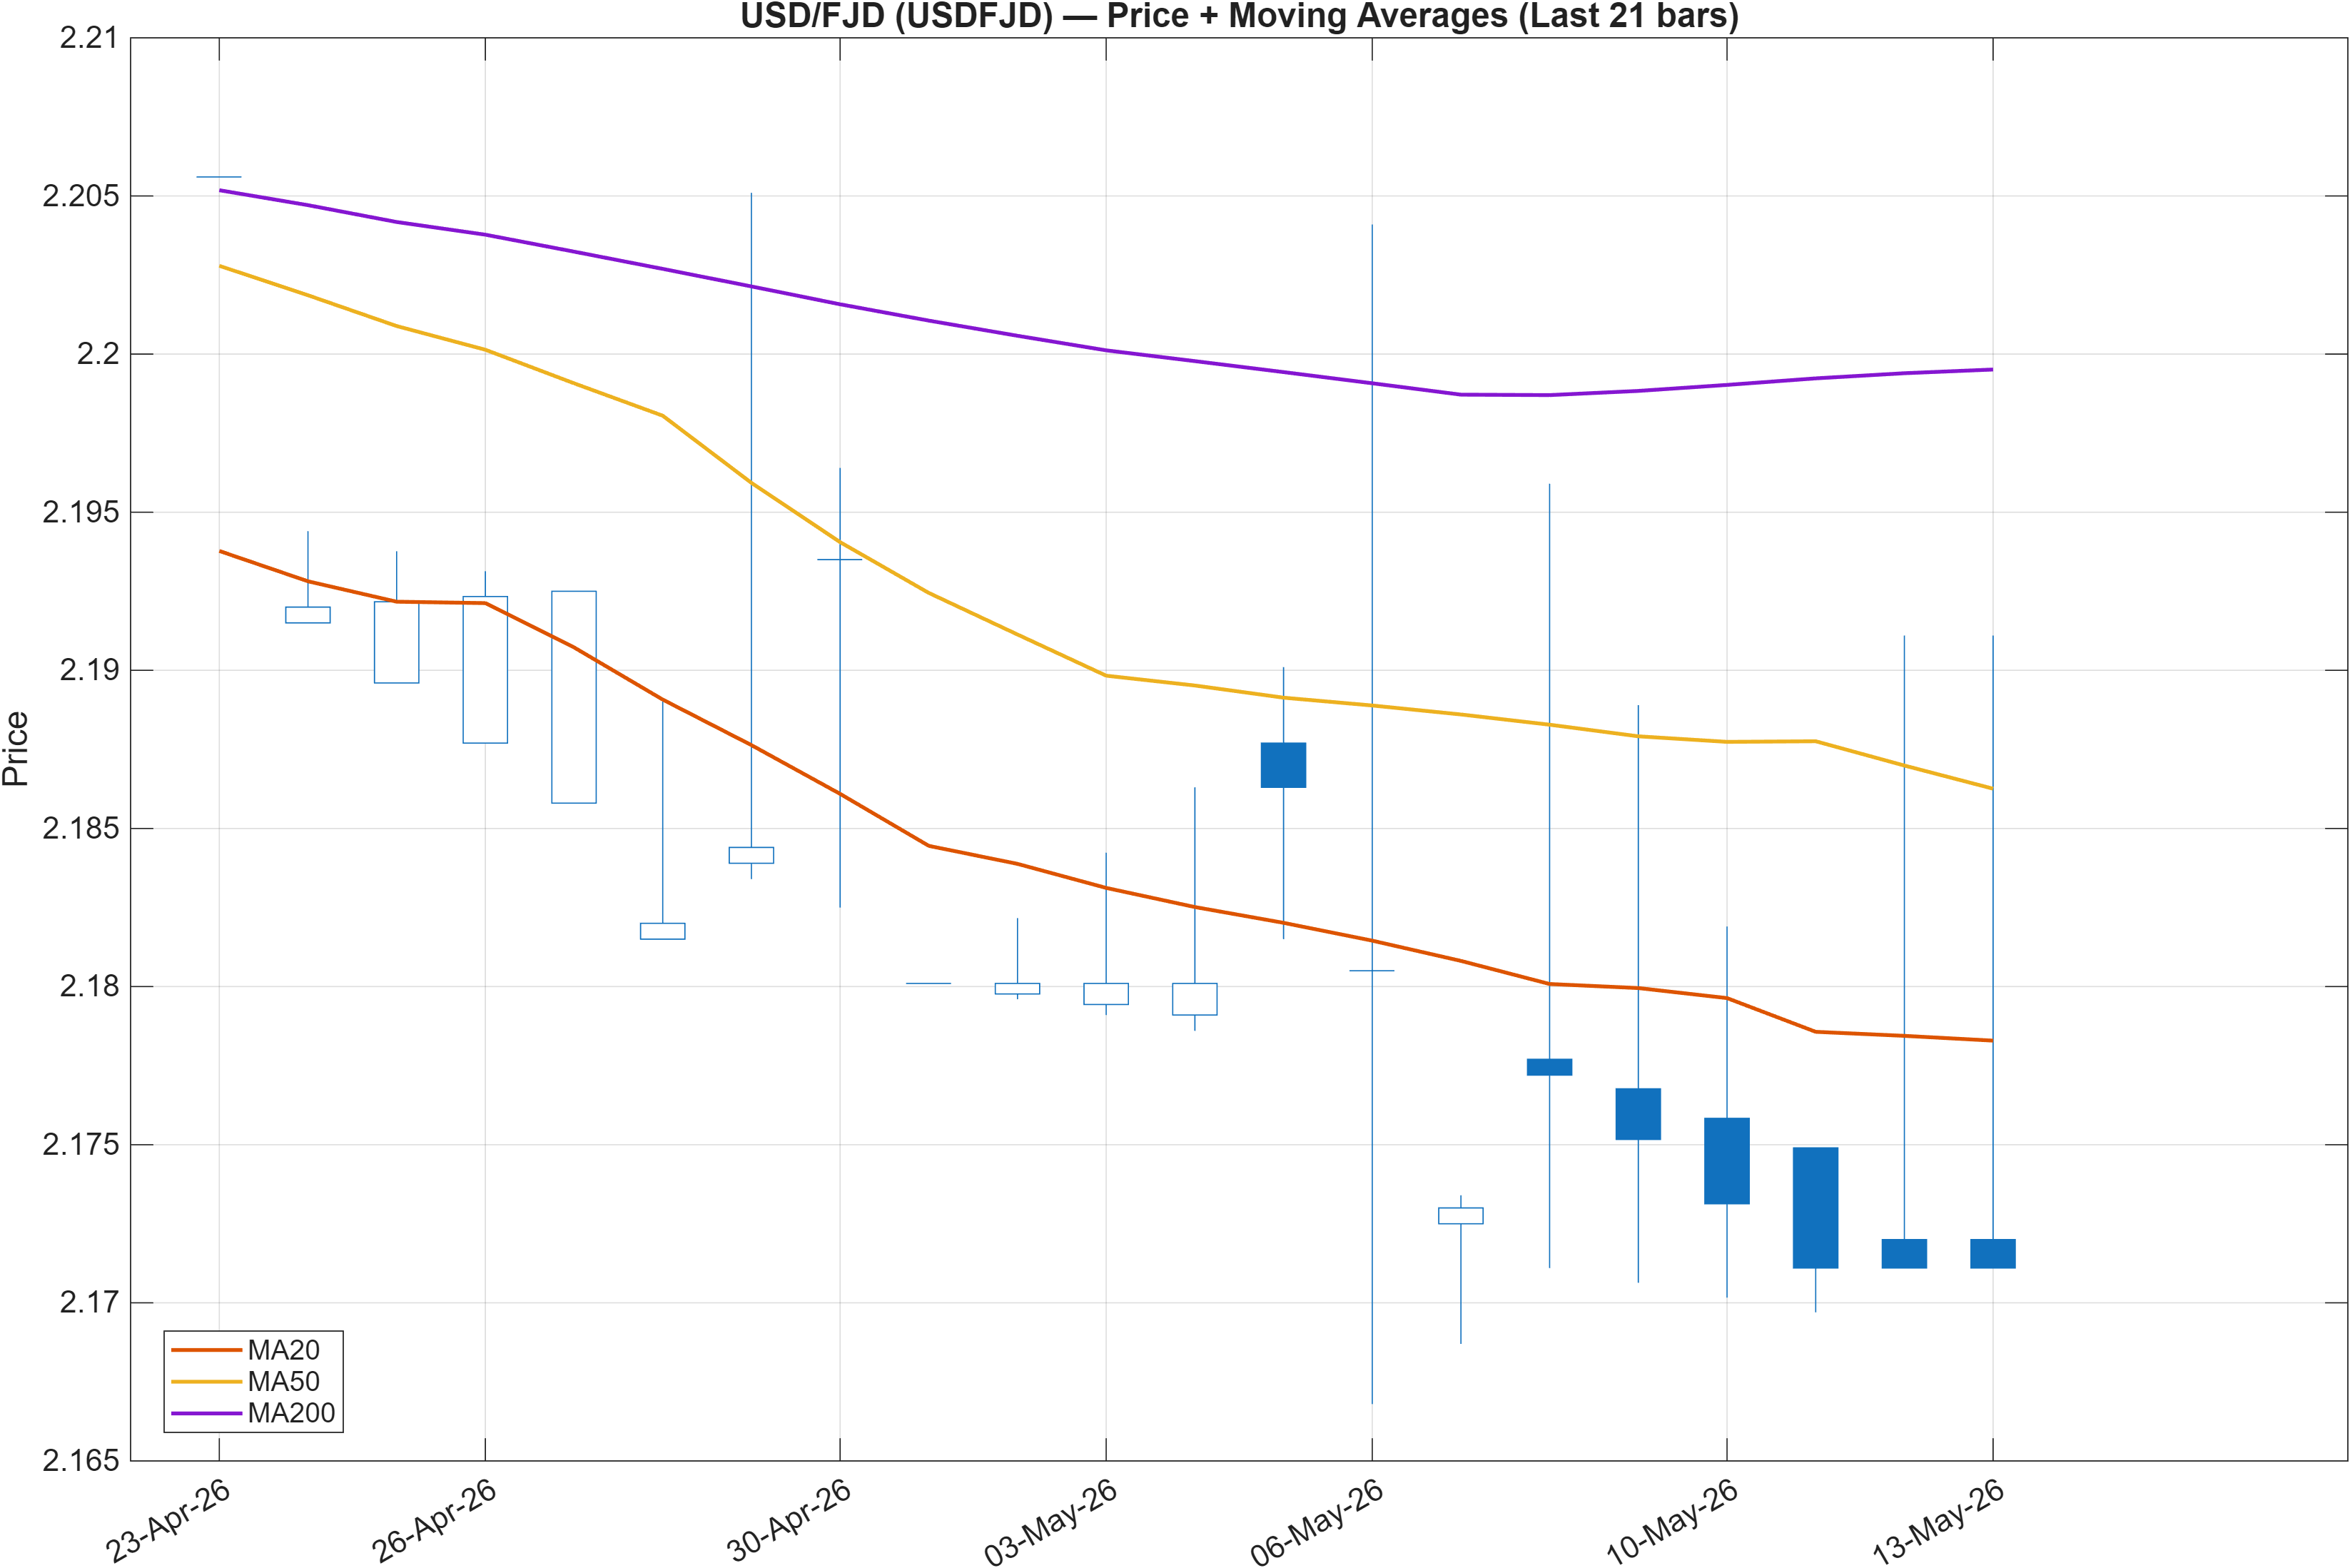
Trend diagnostics here are explicitly defined by moving-average relationships: Close vs MA50 = Bullish, while MA50 vs MA200 = Bearish. This split typically signals a market that has improved in the nearer term but has not yet repaired the broader structure. In practice, that can translate into a tactical up-bias that still trades within a strategically cautious envelope.
This is consistent with the rank profile: a comparatively stronger weekly rank (#108) can coexist with a weaker 6-month rank (#896) when the market is working through a transition rather than trending cleanly. The implication is not that direction is predetermined, but that trend-following signals may be more sensitive to level acceptance and follow-through than to the initial crossover dynamics.
When the short-term trend (close vs MA50) and long-term trend (MA50 vs MA200) disagree, a common failure mode is trend-chop: recoveries can stall before establishing a durable higher-high / higher-low sequence. In that context, the nearby decision zone defined later—2.1711 support and 2.2447 resistance—becomes the practical bridge between “rebound” and “structure repair.” The moving-average split argues for treating any directional attempt as conditional until price action demonstrates sustained acceptance beyond those boundaries.
3) Momentum & volatility dashboard
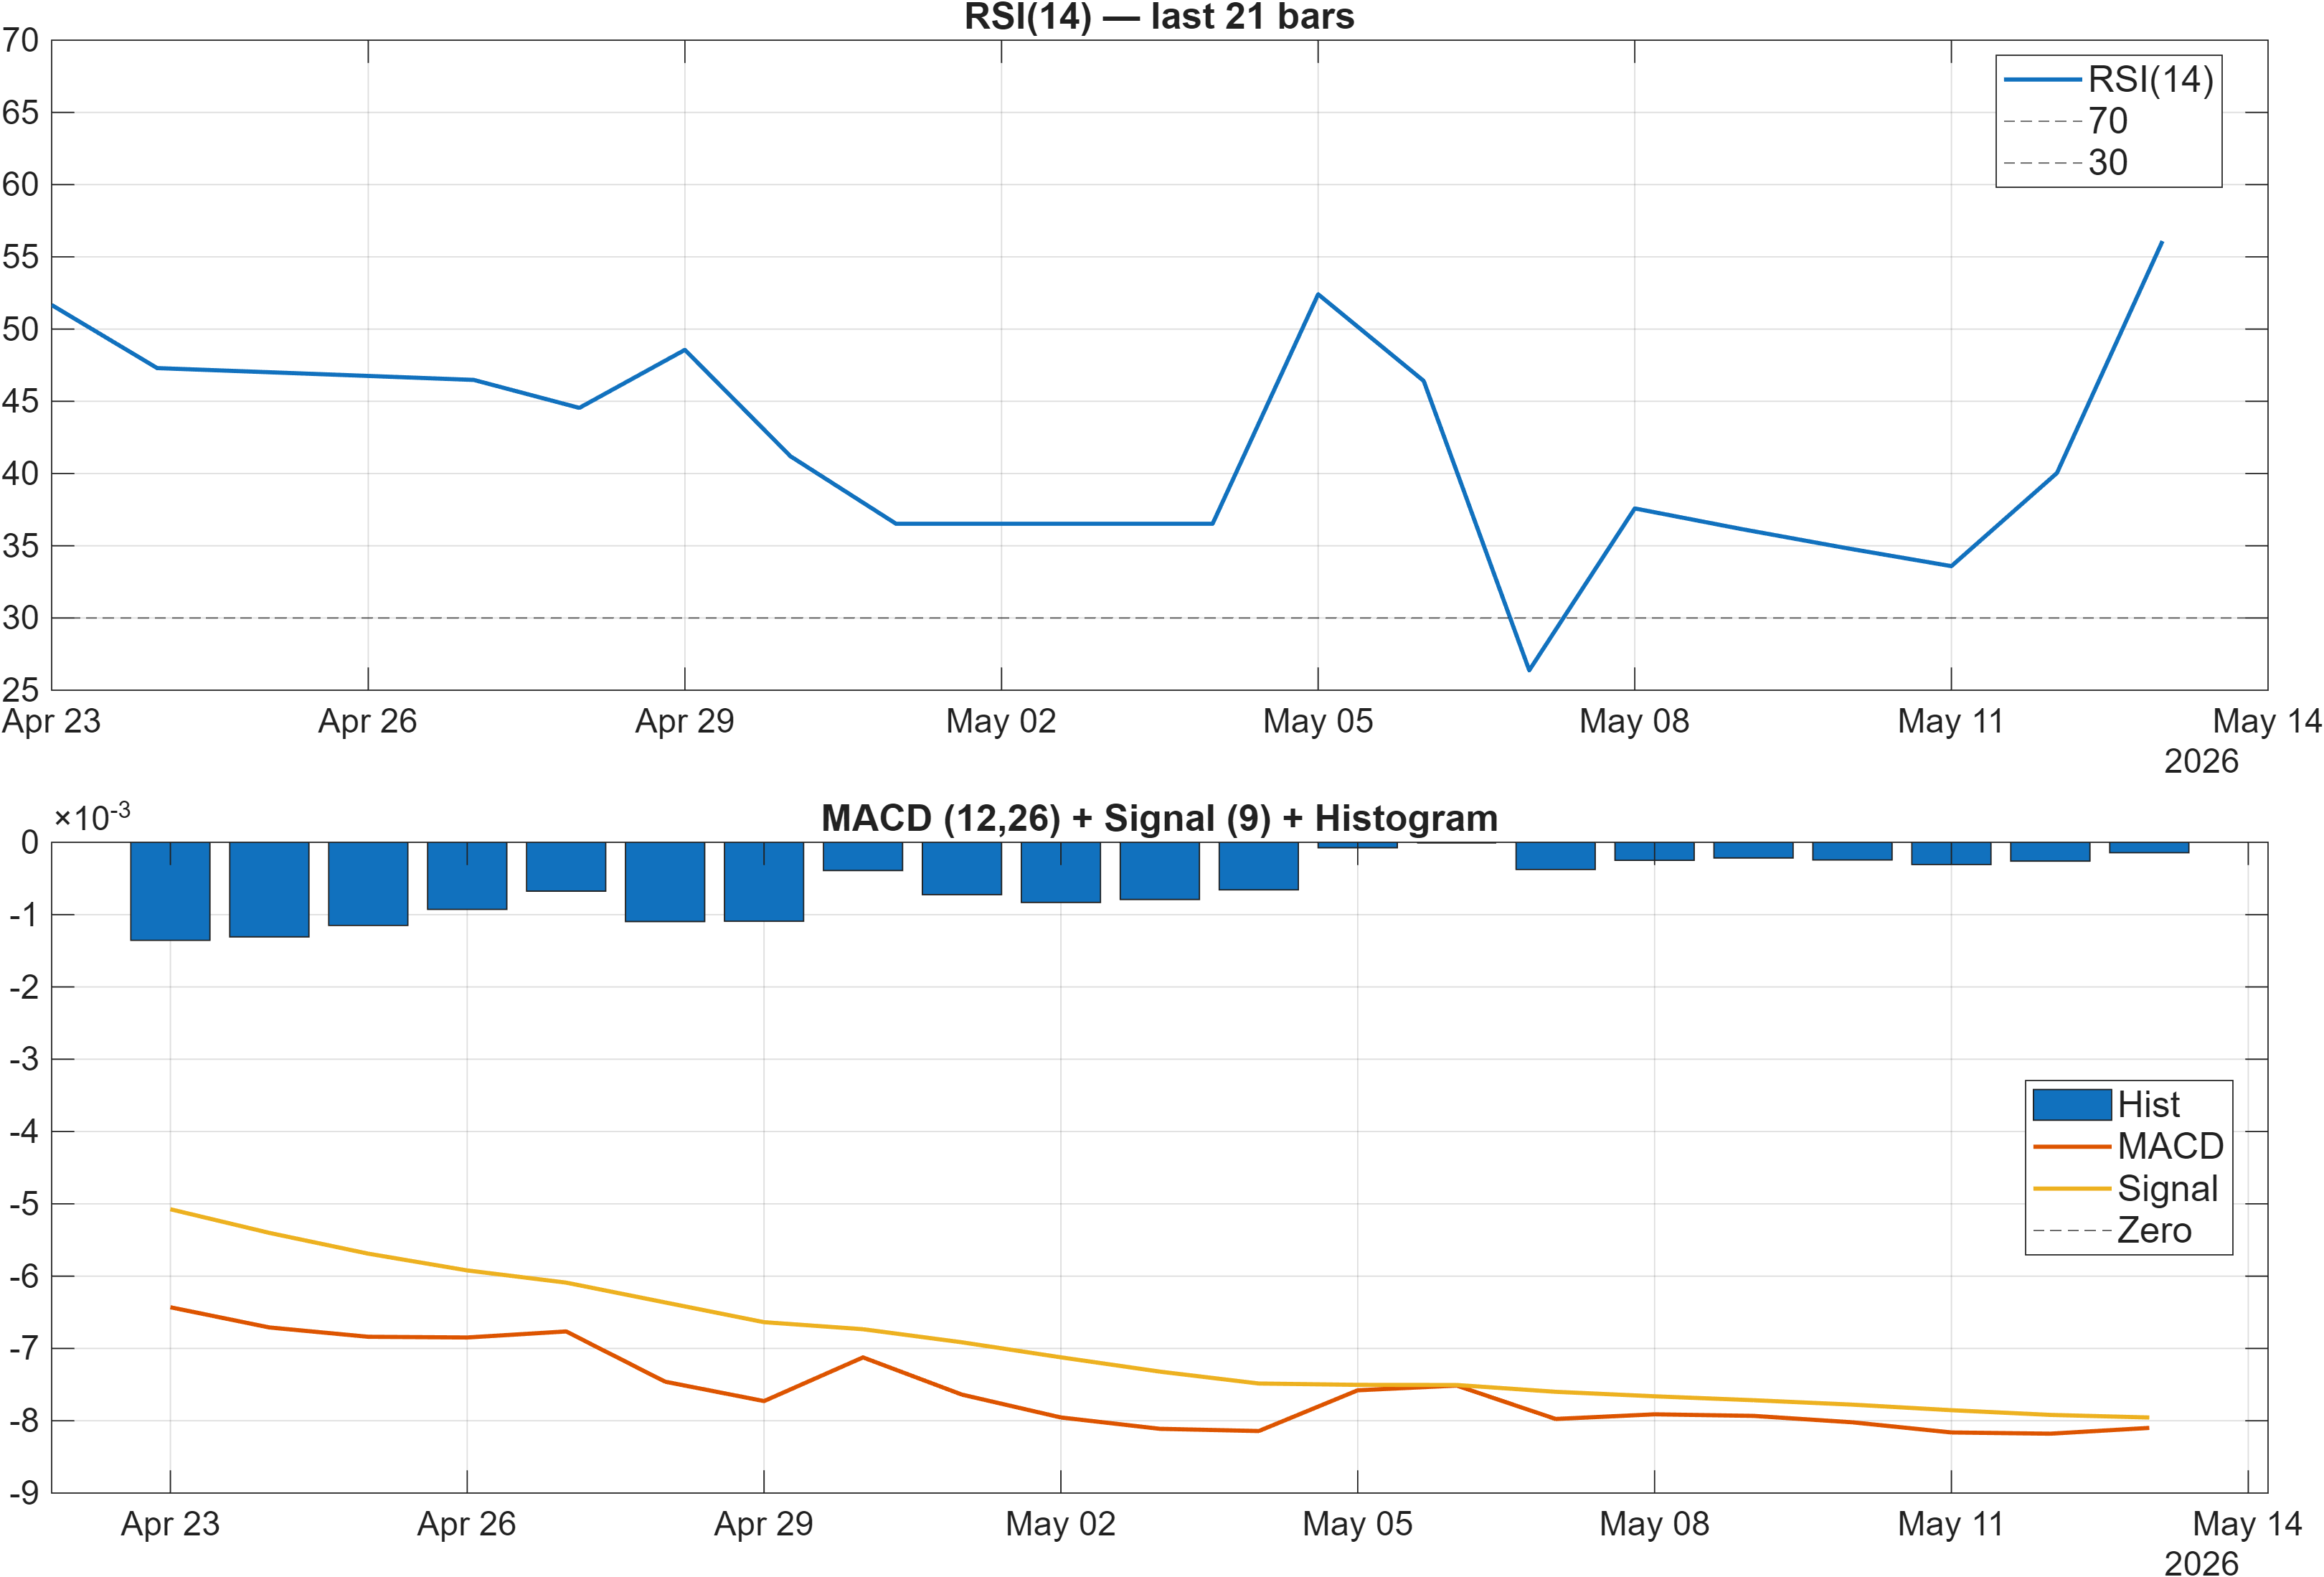
Momentum signals are presently more about balance versus impulse. The dashboard flags RSI bias = Neutral, yet the signal table simultaneously records RSI(14) at 56.09 as Bullish. That combination often occurs when RSI is constructive but not extended—supportive of stabilization rather than indicating late-stage momentum.
By contrast, the MACD histogram remains slightly negative (-0.0001 on the figure, and -0.0001439 in the table), which can be read as lingering drag in the rate of change. This “positive oscillator / negative MACD” mix typically points to a market that is improving but still needs additional confirmation (e.g., sustained closes above key resistance) to shift the medium-term posture.
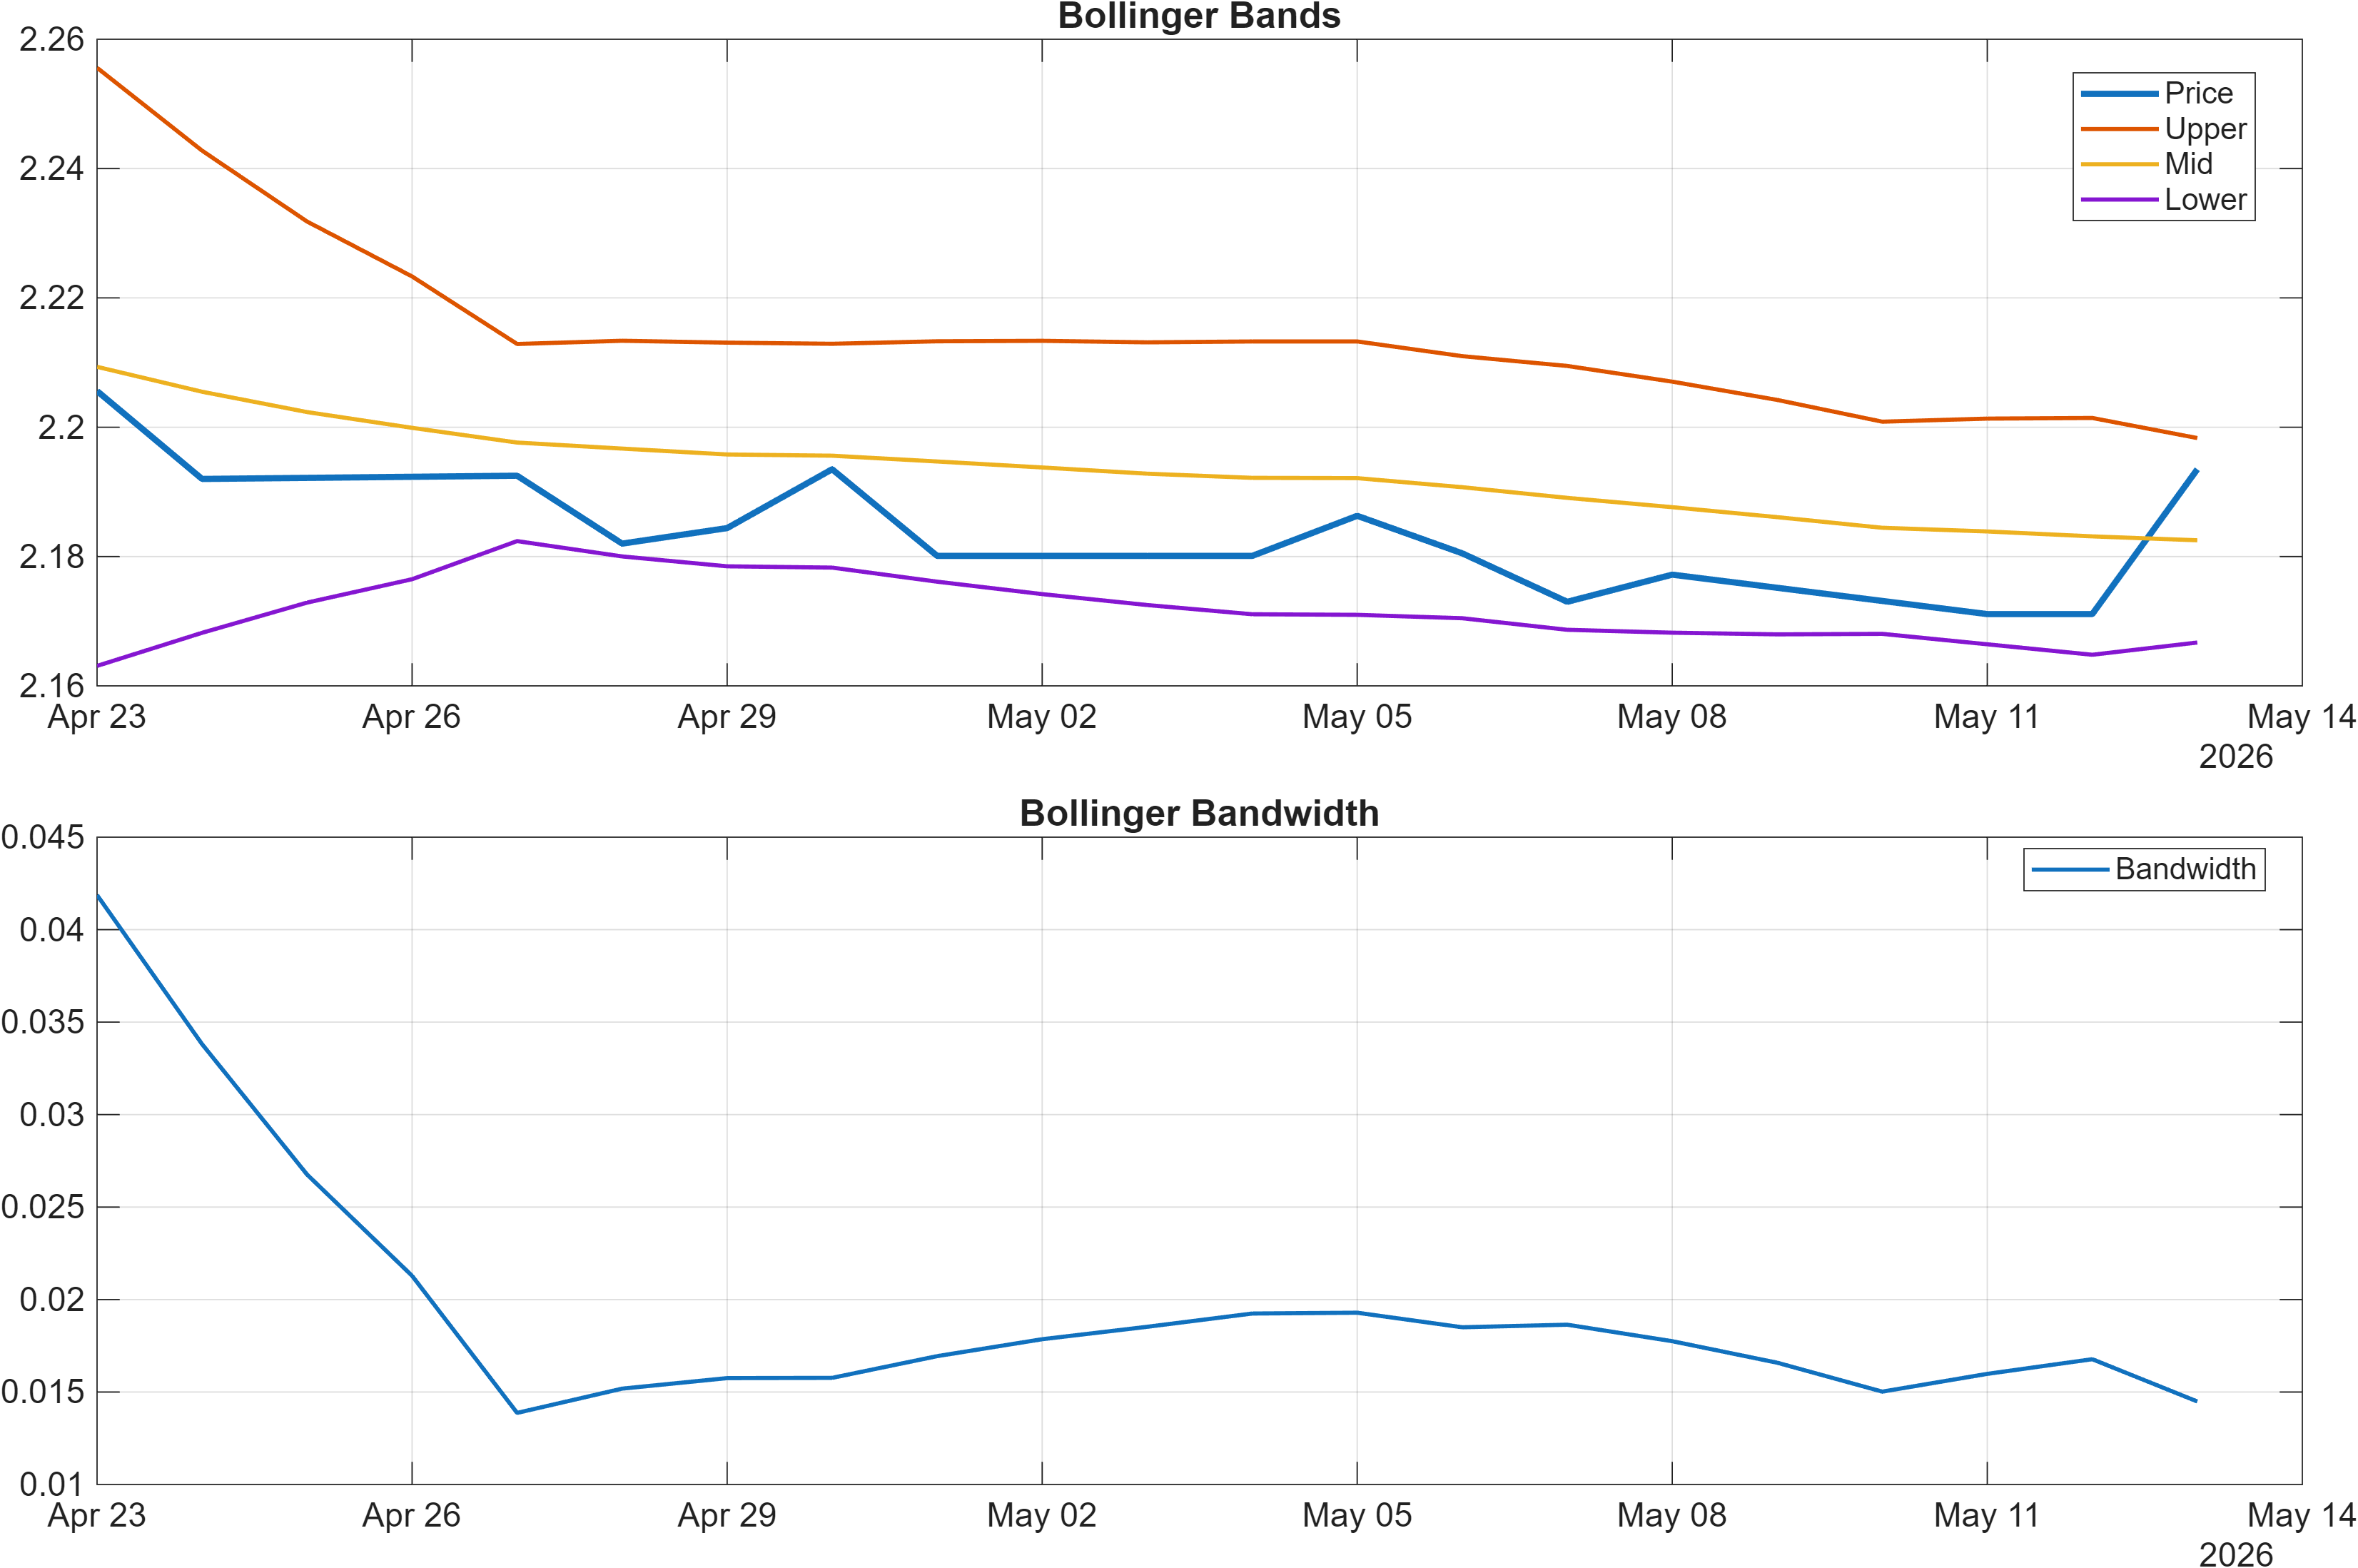
Volatility is comparatively contained: Bollinger Bandwidth at 0.0145 suggests a regime where price may oscillate inside well-defined boundaries unless a catalyst expands range. In such conditions, breakout validation often benefits from waiting for follow-through rather than responding to the first touch. The tension between a mildly constructive RSI and a negative MACD histogram fits this “compression with unresolved direction” framing, reinforcing the importance of the support/resistance corridor.
4) Support / Resistance zones
Support ~ 2.1711 | Resistance ~ 2.2447
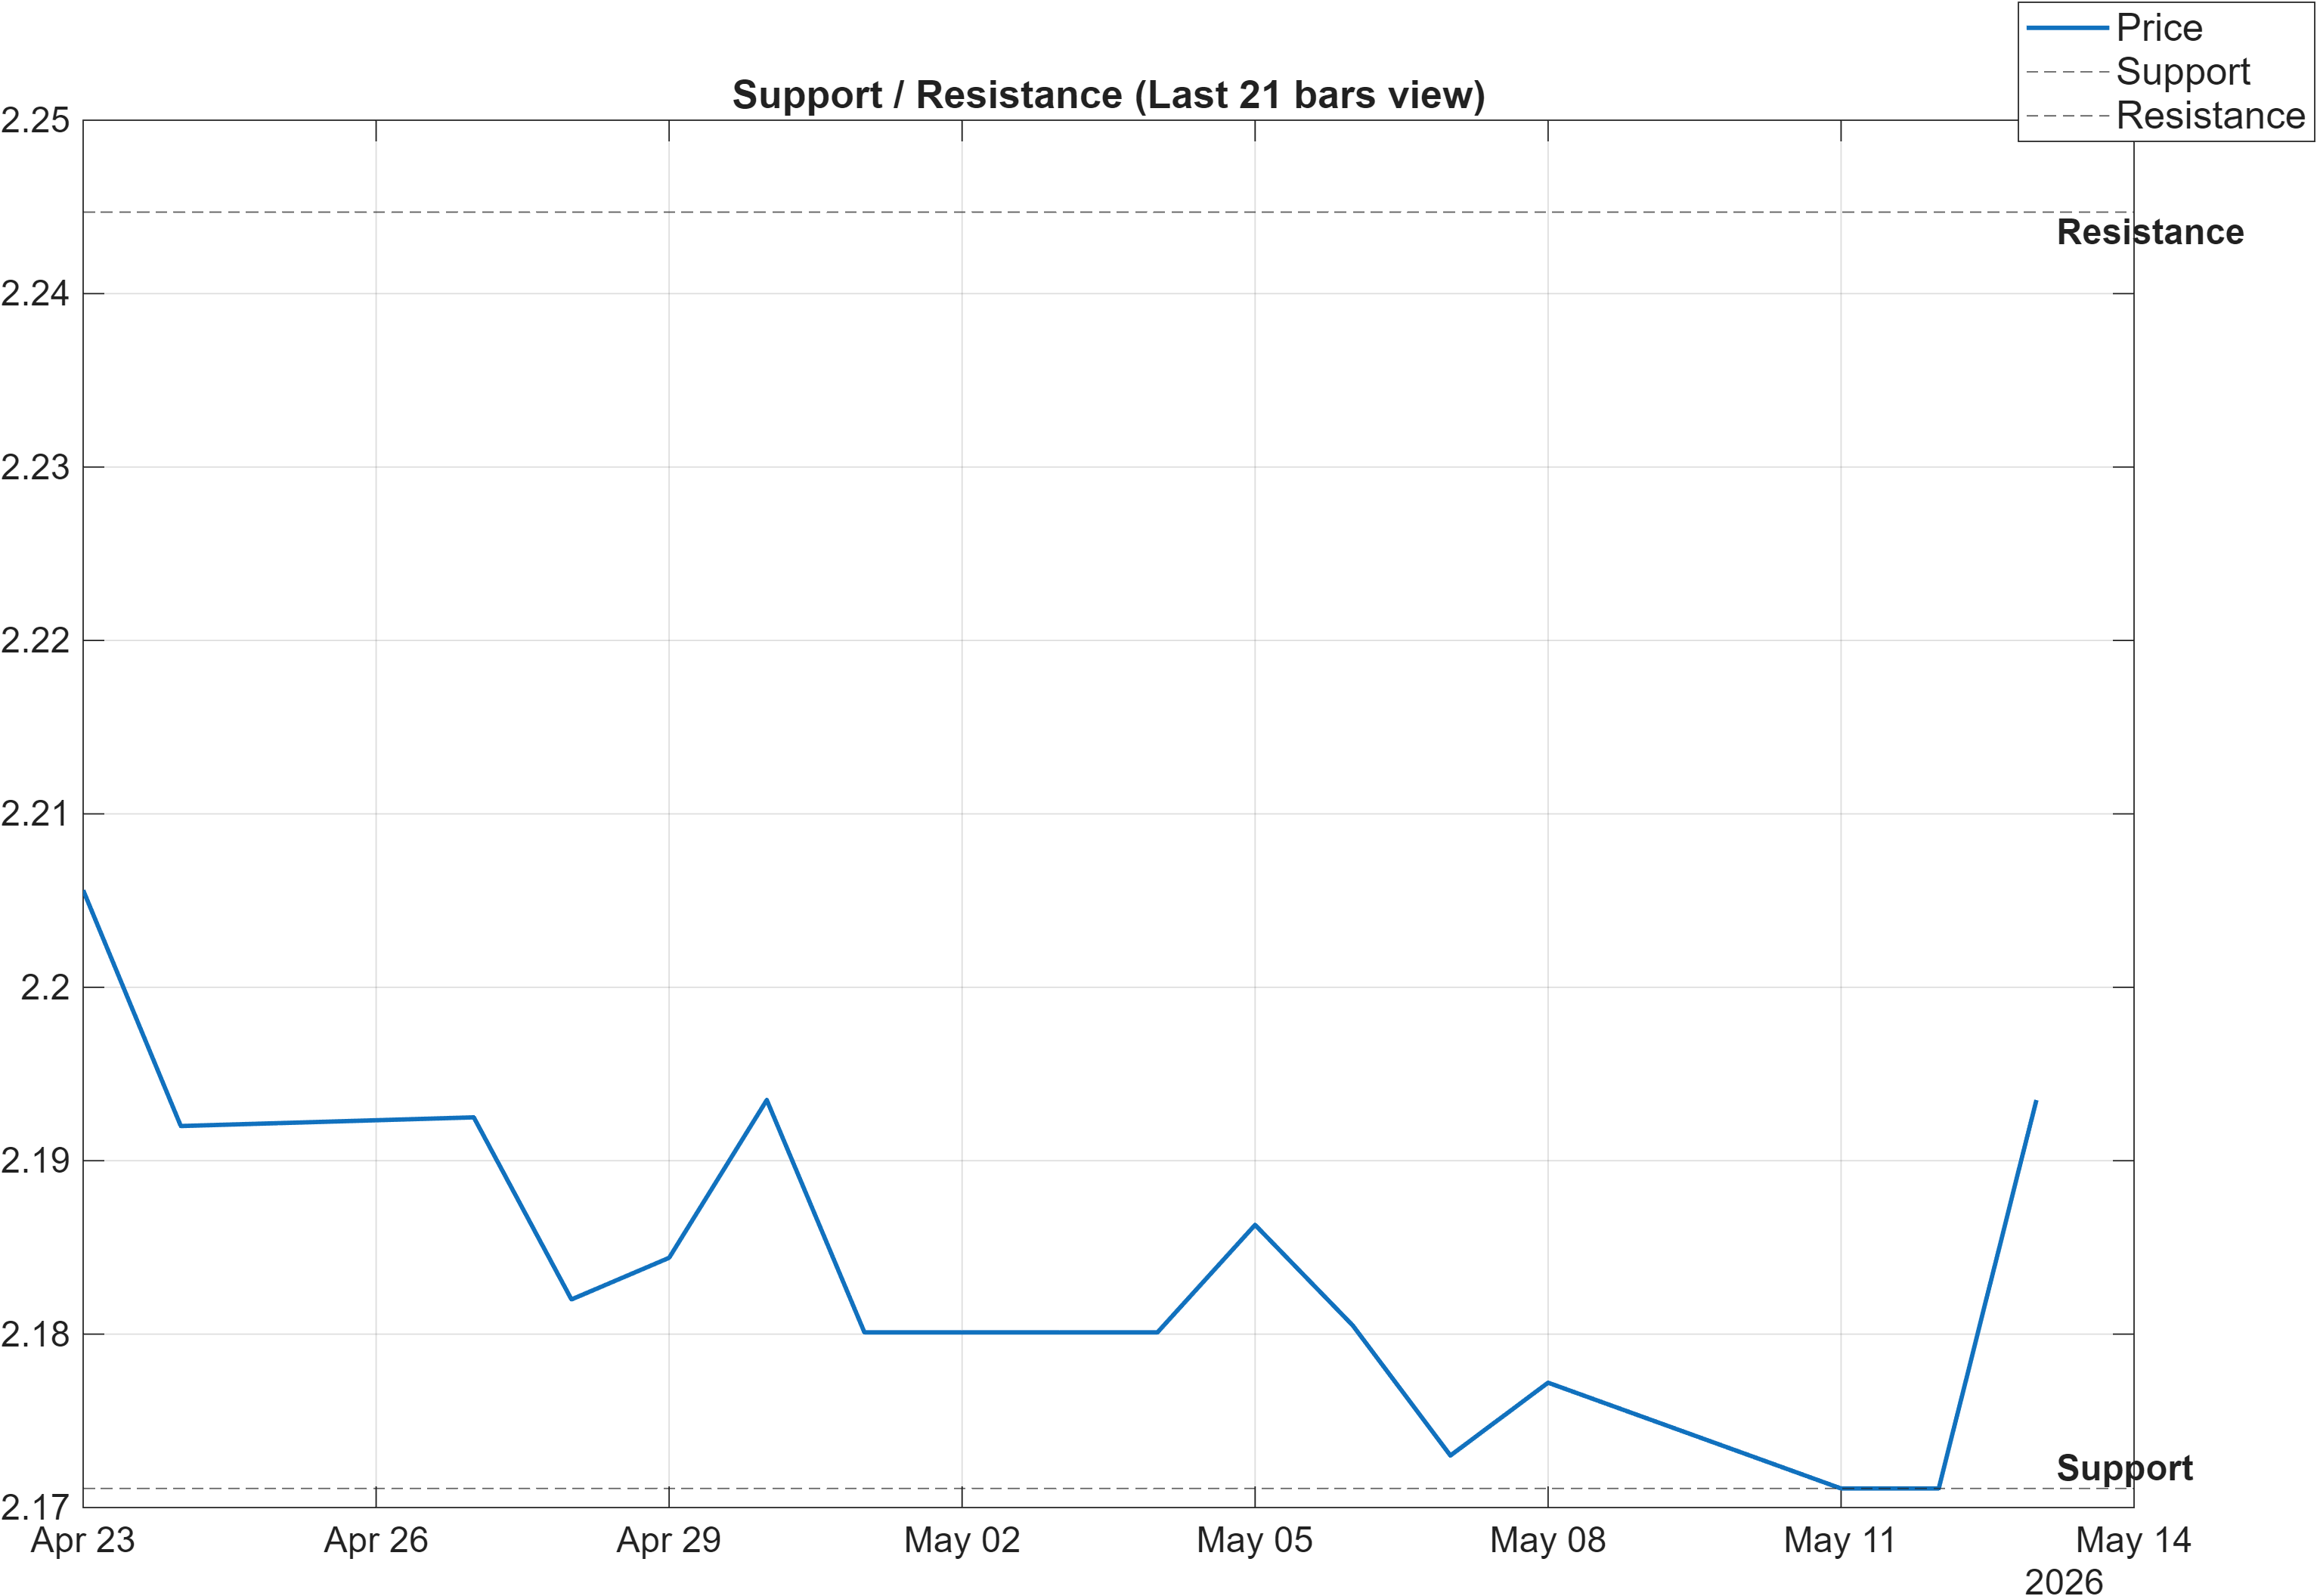
The current structure places USDFJD inside a defined decision band: 2.1711 acts as the primary support reference, while 2.2447 defines the near-term ceiling. With Bandwidth at 0.0145, this corridor matters because tighter volatility regimes tend to make level tests more frequent—and subsequent acceptance or rejection more informative for regime identification.
The scenario guidance is explicit: break above resistance with volume → continuation, while a close below support → signal deterioration risk. While volume is mentioned, instrument-specific volume detail is Not available in the provided data, so the practical read is to focus on confirmation via repeat closes and reduced mean reversion after the breakout attempt.
Importantly, the moving-average split from Section 2 (close above MA50 but MA50 below MA200) can produce false starts around resistance. That makes 2.2447 more than a mechanical line—it is a potential filter for whether the shorter-term improvement is evolving into a more durable trend phase. Conversely, 2.1711 functions as an integrity check on the constructive momentum readings (e.g., RSI(14) 56.09): holding above support keeps the “stabilization” thesis intact, whereas failure tends to re-open the long-horizon weakness implied by the 6-month rank (#896).
5) Quant Technical Dashboard (18 Signals)
KGNAI AI Technical Analysis Score (Deep Reinforcement Learning): Rank #163 out of 960 (Rank 1 represents the strongest technical positioning and a higher probability of favorable price behavior. As ranks increase toward the maximum, the probability of favorable outcomes weakens and bearish positioning becomes more dominant.) | Label: Bullish | Score: 0.660
18-Signal Technical Confluence Score: 0.167 (Neutral)
Overall Technical Score (18-signal confluence + DRL rank blend): 0.315 (Bullish)
Note: The blended score reflects signal strength weighted against broader AI technical ranking, which may temporarily diverge.
Blended technical score breakdown: 0.315 (Bullish | Bull 7 / Bear 4 / Neutral 7)
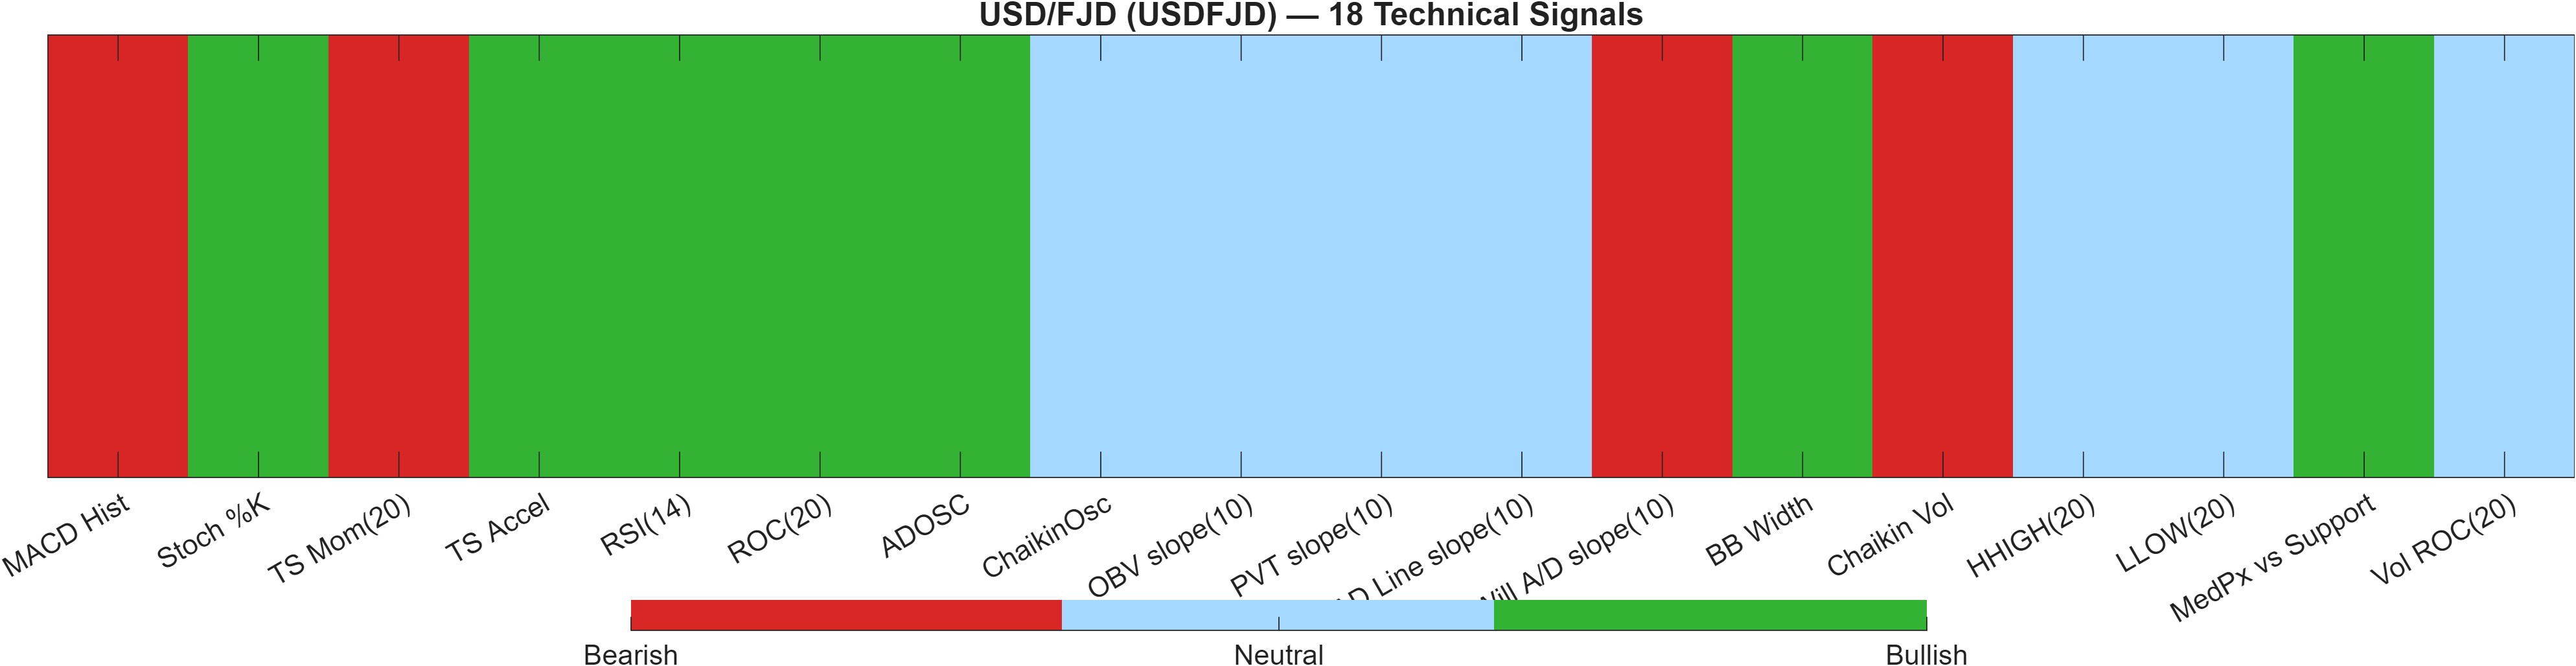
The dashboard highlights a confluence vs model-rank divergence. The 18-signal confluence score is 0.167 and labeled Neutral, indicating that the raw indicator stack does not overwhelmingly cluster in one direction. Yet the Deep Reinforcement Learning technical rank is #163 out of 960 with a 0.660 score and a Bullish label, pulling the blended “overall technical score” to 0.315 (labeled Bullish).
The breakdown—Bull 7 / Bear 4 / Neutral 7—supports the idea that the market is not in a high-conviction impulse phase; rather, it is in a state where incremental improvements can matter. Within the indicator table, examples of constructive inputs include RSI(14) 56.09 and Stoch %K 11.53 both flagged bullish, while bearish offsets include MACD Hist -0.0001439 and TS Mom(20) -0.0209. This composition aligns with a market attempting to turn without full confirmation from trend-following momentum.
In these circumstances, the blended score is best treated as a relative positioning signal rather than a directional guarantee. It suggests the model-based technical posture is improving faster than the indicator stack is converging. That makes level-based validation (notably around 2.2447 resistance and 2.1711 support) especially relevant for confirming whether the bullish blend can persist or whether neutrality reasserts.
Signal table (Bull/Bear/Neutral)
| Indicator | Value | Signal |
|---|---|---|
| MACD Hist | -0.0001439 | Bearish |
| Stoch %K | 11.53 | Bullish |
| TS Mom(20) | -0.0209 | Bearish |
| TS Accel | 0.04217 | Bullish |
| RSI(14) | 56.09 | Bullish |
| ROC(20) | 0.06843 | Bullish |
| ADOSC | 47.75 | Bullish |
| ChaikinOsc | 0 | Neutral |
| OBV slope(10) | 0 | Neutral |
| PVT slope(10) | 0 | Neutral |
| AD Line slope(10) | 0 | Neutral |
| Will A/D slope(10) | -0.0451 | Bearish |
| BB Width | 0.01449 | Bullish |
| Chaikin Vol | 112.5 | Bearish |
| HHIGH(20) | 2.205 | Neutral |
| LLOW(20) | 2.167 | Neutral |
| MedPx vs Support | 0.01 | Bullish |
| Vol ROC(20) | — | Neutral |
Indicator-level signals provide the base layer (mixed but slightly constructive), while the separate DRL technical rank strengthens the composite view. The key analytical point is whether the neutral confluence (0.167) begins to migrate toward stronger clustering, or whether the bullish blended label (0.315) proves sensitive to failure at nearby resistance.
6) News sentiment + extractive gist
Note: Instrument-specific news matches were not found, so the digest reflects broader macro/FX context within the provided feed.
Sentiment score (avg): 0.026 | Positive: 25% | Neutral: 63% | Negative: 12%
KGNAI AI News Sentiment Score (normalized -1 to +1): Not available (as of —) | Label: Not available | Overall news score: 0.03
Positive Developments
Recent coverage across major financial outlets indicates a moderately constructive backdrop in parts of the global macro mix, primarily via policy and trade-process messaging rather than a direct FX-specific catalyst. Commentary in the feed points to a measured stance on monetary policy in Japan and ongoing discussion around trade-rule reform and supply-chain resilience, themes that can reduce tail-risk perceptions when they signal continuity and dialogue. In parallel, some price-level commentary across other major pairs suggests markets are still engaging in incremental risk allocation rather than broad capitulation. For USDFJD specifically, this macro tone aligns with the report’s technical profile where certain oscillators lean constructive (for example, RSI(14) 56.09 is flagged bullish), while trend structure remains mixed. With the average sentiment reading at 0.026 and 25% of items classified as positive, the news layer is not acting as a strong directional driver, but it is also not uniformly restrictive. The net effect is a context where technical confirmation—rather than narrative momentum—remains the primary filter.
Neutral / Mixed Developments
The dominant tone in the provided feed is informational and macro-linked, reflected by the high 63% neutral share and the absence of instrument-specific headlines. Much of the discussion centers on broad USD conditions, rates, and general FX positioning, which can translate into range-bound trading when markets are calibrating rather than repricing. This fits the technical setup where volatility is contained (with Bollinger Bandwidth at 0.0145) and the confluence score is 0.167, labeled neutral—conditions that often coincide with mean reversion around established reference levels. In this environment, incremental changes in yields or cross-asset risk appetite can influence intraday behavior, but may not generate sustained follow-through unless the price structure resolves above 2.2447 or below 2.1711. As a result, the news layer functions more as a background regime descriptor than as an immediate catalyst within the provided dataset.
Negative / Risk Signals
Risk signals in the feed are concentrated around inflation persistence and the implied sensitivity of rate expectations. References to hotter inflation dynamics and higher yields matter for FX broadly because they can reinforce USD strength and tighten financial conditions, potentially increasing volatility even if the current realized volatility is contained (again, Bandwidth 0.0145). Within the sentiment mix, 12% of items are classified as negative, keeping the aggregate average near neutral (0.026) but still highlighting a risk backdrop that could shift quickly if macro releases surprise. For USDFJD, this matters because the rank structure includes a long-horizon weak tail (6-month rank #896), implying that adverse macro impulses may find an already-fragile longer-term structure. If negative macro tone intensifies, the more immediate technical concern becomes whether the market can continue to defend 2.1711 support; failure would be consistent with “signal deterioration risk” as described in the scenario guidance.
What to monitor next
- Whether USDFJD can sustain acceptance above 2.2447 as the primary structural confirmation point.
- Any volatility expansion beyond the current contained regime (Bandwidth 0.0145).
- Whether inflation/rates narratives materially shift the neutral sentiment mix (0.026 average) toward a persistent bias.
Sources referenced: Reuters, Bloomberg, Yahoo Finance, MarketWatch, Investing.com
Snapshot: AI Rank (Short–Mid–Long): Mixed (Neutral–Neutral–Bearish) · Technical Confluence: Neutral · Key Levels: Support ~2.17 | Resistance ~2.24 · News Sentiment: Neutral
7) Sources
- US Dollar: Stronger on hot inflation and yields – MUFG — https://www.fxstreet.com/news/us-dollar-stronger-on-hot-inflation-and-yields-mufg-202605130633
- GBP/USD Price Forecast: Holds modest upside while staying anchored above 100-day EMA support — https://www.fxstreet.com/news/gbp-usd-price-forecast-holds-modest-upside-while-staying-anchored-above-100-day-ema-support-202605130631
- Indian Rupee: Higher Oil prices keep pressure – Commerzbank — https://www.fxstreet.com/news/indian-rupee-higher-oil-prices-keep-pressure-commerzbank-202605130615
- ECB's Villeroy: Central bank must be ready to intervene on second-round effects — https://www.fxstreet.com/news/ecbs-villeroy-central-bank-must-be-ready-to-intervene-on-second-round-effects-202605130612
- Gold sticks to negative bias as USD draws support from Fed hike bets and Iran tensions — https://www.fxstreet.com/news/gold-remains-depressed-as-hot-us-cpi-lifts-fed-rate-hike-bets-and-supports-usd-202605130441
- AUD/USD Price Forecast: Holds steady below mid-0.7200s as bulls await Trump-Xi summit — https://www.fxstreet.com/news/aud-usd-price-forecast-holds-steady-below-mid-07200s-as-bulls-await-trump-xi-summit-202605130558
- Silver Price Forecast: XAG/USD holds onto gains around $87, ignoring hawkish Fed bets — https://www.fxstreet.com/news/silver-price-forecast-xag-usd-holds-onto-gains-around-87-ignoring-hawkish-fed-bets-202605130545
- Swiss Franc steadies above 0.7800 as traders brace for US PPI data, Trump-Xi summit — https://www.fxstreet.com/news/swiss-franc-steadies-above-07800-as-traders-brace-for-us-ppi-data-trump-xi-summit-202605130528
You may also like: How KGNAI AI ranks instruments across global markets
Disclaimer: KGNAI provides AI-generated analytics and educational market commentary only. This is not financial advice. Markets involve risk. Always do your own research.