
Gold Spot US Dollar (XAUUSD) — 17-May-2026 | Multi-horizon ranks bullish, near-term technical posture cautious
Gold Spot US Dollar (XAUUSD) enters this snapshot with a pronounced time-horizon split: short-term ranks sit deep in the weaker tail of the 970-instrument universe, while longer-horizon ranks remain firmly in the strongest cohort. That divergence matters because it often corresponds to a market transitioning between regimes—where longer-cycle positioning can remain constructive even as short-cycle signals compress and turnover. Technically, the moving-average structure reads bearish (close vs MA50 bearish; MA50 vs MA200 bearish), while the blended technical assessment stays Neutral (overall technical score -0.209). Momentum readings are mixed rather than directional: RSI bias is neutral, yet the MACD histogram is negative at -1.8560. Volatility conditions are moderate (Bollinger bandwidth 0.0563), reinforcing the importance of mapped decision zones at 4447.3996 support and 4852.4151 resistance. News sentiment is modestly constructive (normalized score 0.37), but remains contextual given the lack of instrument-specific matches.
Key Takeaways
- Rank stance: Short-term Bearish | Mid-term Bullish | Long-term Bullish
- Technical confluence label: Neutral (18-signal score 0.056; overall technical score -0.209)
- Key levels: Support 4447.3996 | Resistance 4852.4151
- News sentiment bias: Bullish (normalized 0.37; avg sentiment 0.091)
- Confirmation / invalidation: A sustained move above 4852.4151 supports continuation scenarios; a close below 4447.3996 increases deterioration risk.
What KGNAI Measures
KGNAI evaluates assets using large cross-sectional datasets built from millions of structured data points. Inputs incorporate fundamental metrics, technical structures, and systematically processed news sentiment. Statistical models, machine learning, and AI frameworks are used to assess relative positioning, signal alignment, and probabilistic behavior across broad universes.
How to Read This Report
- Ranks are comparative across the tracked universe, not absolute price targets.
- Confluence reflects alignment among independent signal groups.
- Support/resistance levels are probabilistic decision zones, not guarantees.
- Sentiment provides contextual bias within the broader analytical framework.
1) KGNAI AI Analysis
Region: FOREX
Total universe size: 970 ranked instruments
- Daily rank: #944 out of 970 — Bearish
- Weekly rank: #937 out of 970 — Bearish
- Monthly rank: #169 out of 970 — Bullish
- 3-Monthly rank: #94 out of 970 — Bullish
- 6-Monthly rank: #4 out of 970 — Bullish
- Yearly rank: #26 out of 970 — Bullish
The rank stack shows a classic short-term weakness versus longer-term strength configuration. On the shortest horizons, XAUUSD sits in the weakest slice of the universe (daily #944, weekly #937 out of 970), which aligns with a market that is not currently being rewarded on immediate trend-following characteristics. In contrast, the medium-to-long cycle is positioned in the stronger cohorts (monthly #169, 3-month #94), and the longer windows are notably strong (6-month #4, yearly #26).
Interpreting this as a regime map rather than a directional forecast: the long-horizon ranks suggest XAUUSD remains structurally well-positioned relative to the broader universe, while the short-horizon ranks flag tactical friction—often consistent with consolidation, pullback, or a volatility-driven shakeout inside a still-favorable longer trend context.
The stated term view mirrors this split: Short-term Bearish, Mid-term Bullish, Long-term Bullish. The key analytical implication is that confirmation for the longer-horizon thesis typically requires evidence that short-horizon pressure is easing—something later sections frame via momentum (MACD hist -1.8560) and level behavior around 4447.3996 and 4852.4151.
KGNAI ranks each instrument across large universes using multiple proprietary AI tests and statistical models (millions of data points). Lower ranks generally indicate stronger probability of favorable performance behavior, while higher ranks indicate weaker probability and more bearish positioning.
Term view: Short-term: Bearish. Mid-term: Bullish. Long-term: Bullish.
Want the full universe and complete rank tables? Unlock full access on KGNAI: https://www.kgnai.com/pricing
2) Price & trend overview
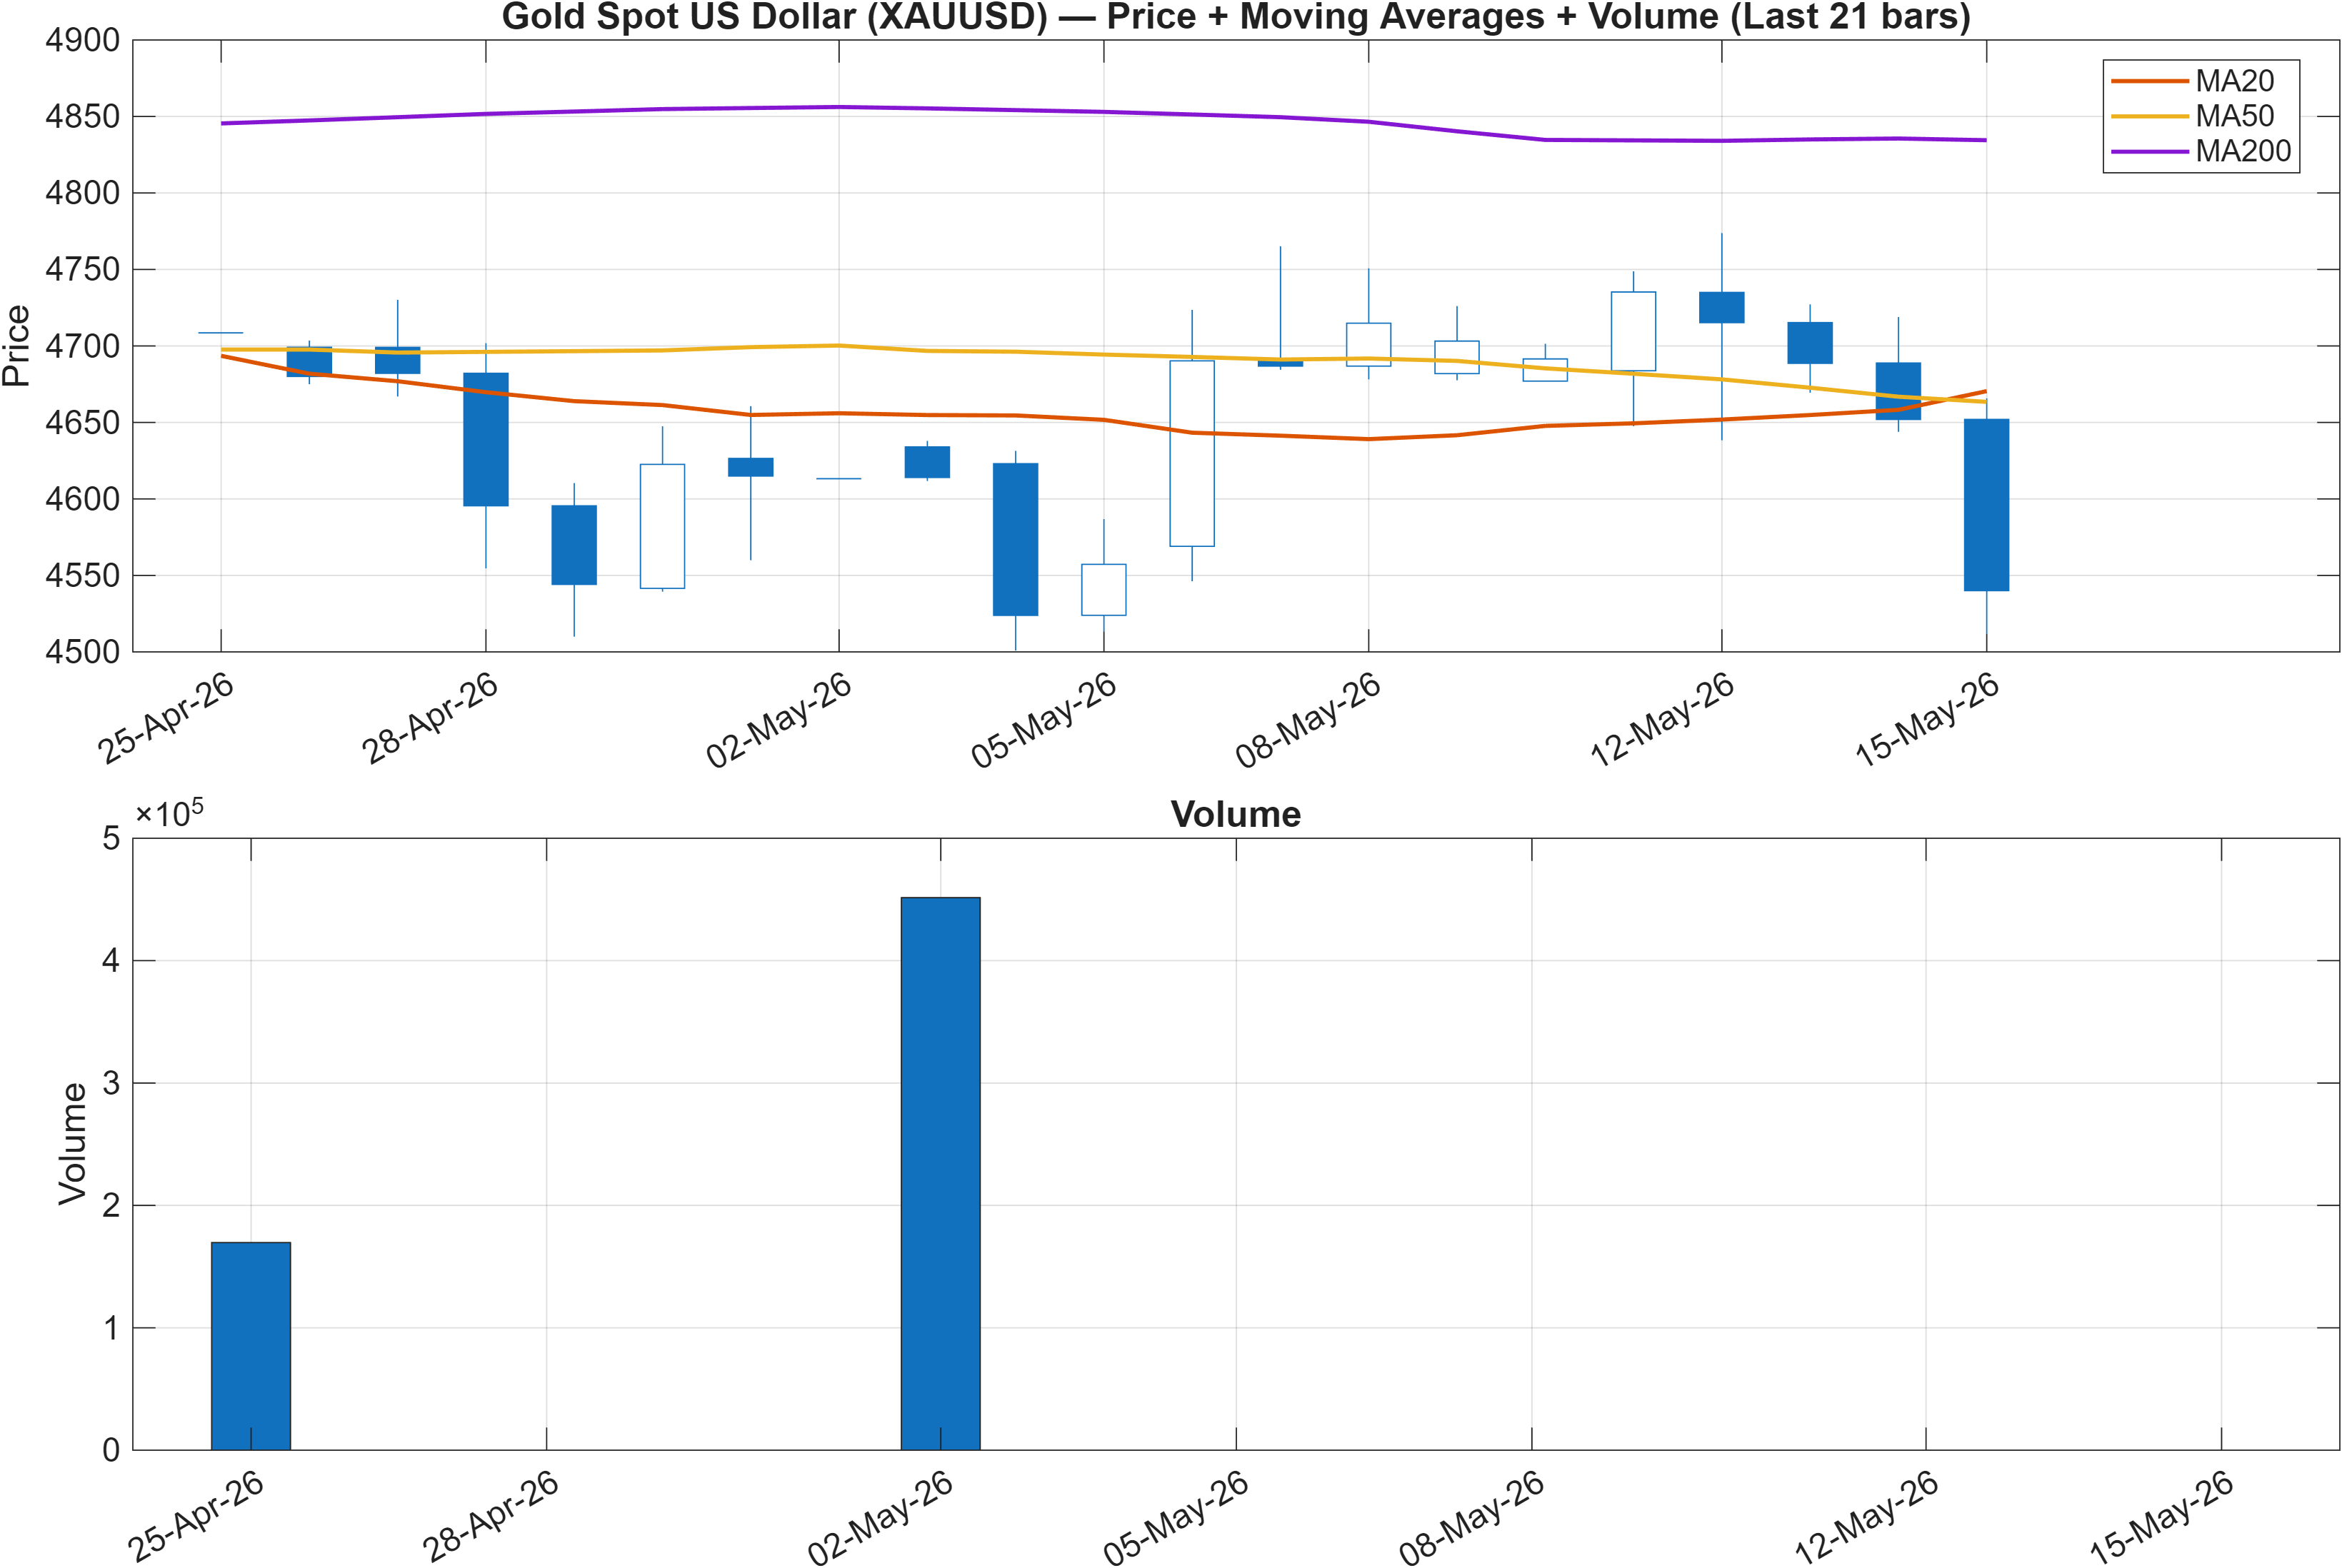
Trend structure is currently characterized by a bearish moving-average stack: the close is below the MA50 (bearish) and MA50 is below MA200 (bearish). This configuration generally implies that recent price action has not yet reclaimed intermediate trend control, even if longer-horizon ranks remain strong (notably the 6-month rank #4 and yearly rank #26). That tension—strong long-horizon placement but bearish MA alignment—often coincides with a market that is mean-reverting within a broader up-cycle rather than cleanly trending in the short run.
In this context, the most useful interpretation is not to treat the MA signals as a standalone directional verdict, but as a measure of trend persistence versus recovery. When the MA50/MA200 relationship is bearish, rallies can be more sensitive to supply until evidence accumulates that the intermediate trend is reasserting. That is consistent with short-horizon ranks being weak (daily #944, weekly #937), where the cross-sectional model is effectively stating that XAUUSD is not currently displaying the strongest short-cycle behavior relative to peers.
The practical read-through for the rest of this report is that level behavior becomes more decisive than broad trend labels. A market can remain structurally constructive on longer windows while still needing to resolve a bearish intermediate structure. The nearby decision framework is reinforced by the mapped zones: support at 4447.3996 and resistance at 4852.4151. How price behaves around those levels will tend to determine whether the current MA configuration transitions toward repair or persists as a headwind.
Interpretation: Close vs MA50 = Bearish, MA50 vs MA200 = Bearish.
3) Momentum & volatility dashboard
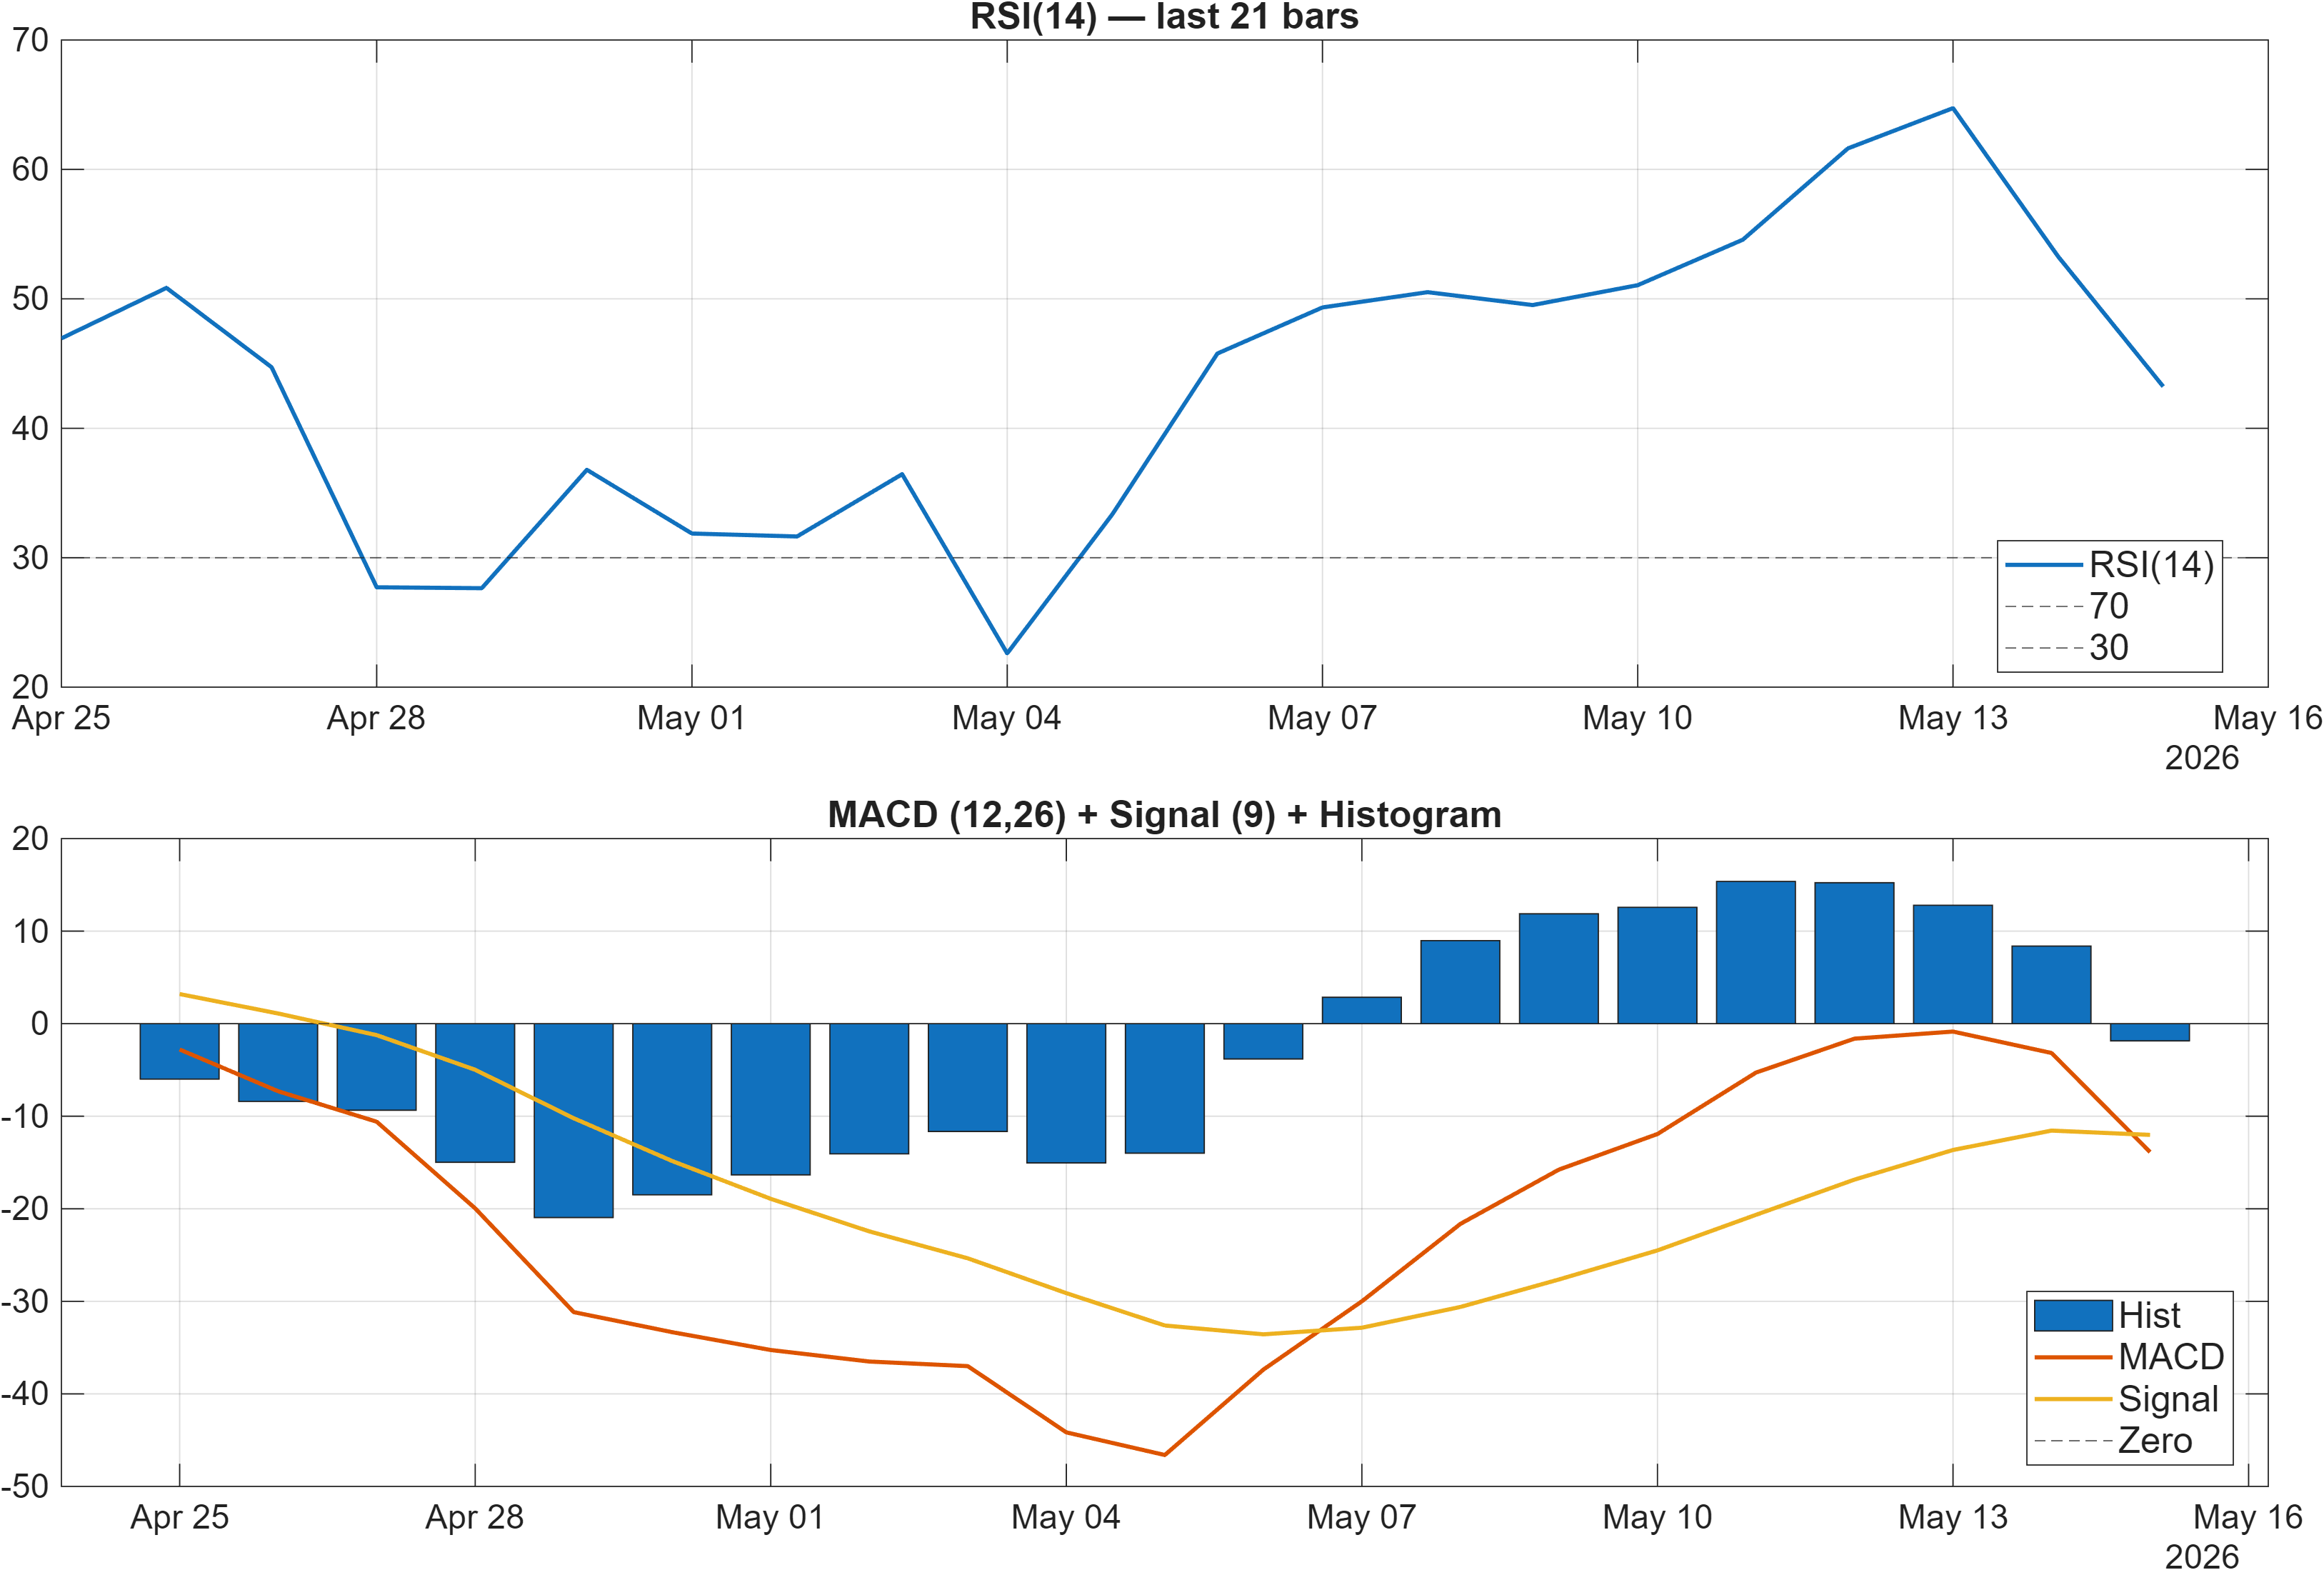
Interpretation: RSI bias = Neutral, MACD hist = -1.8560.
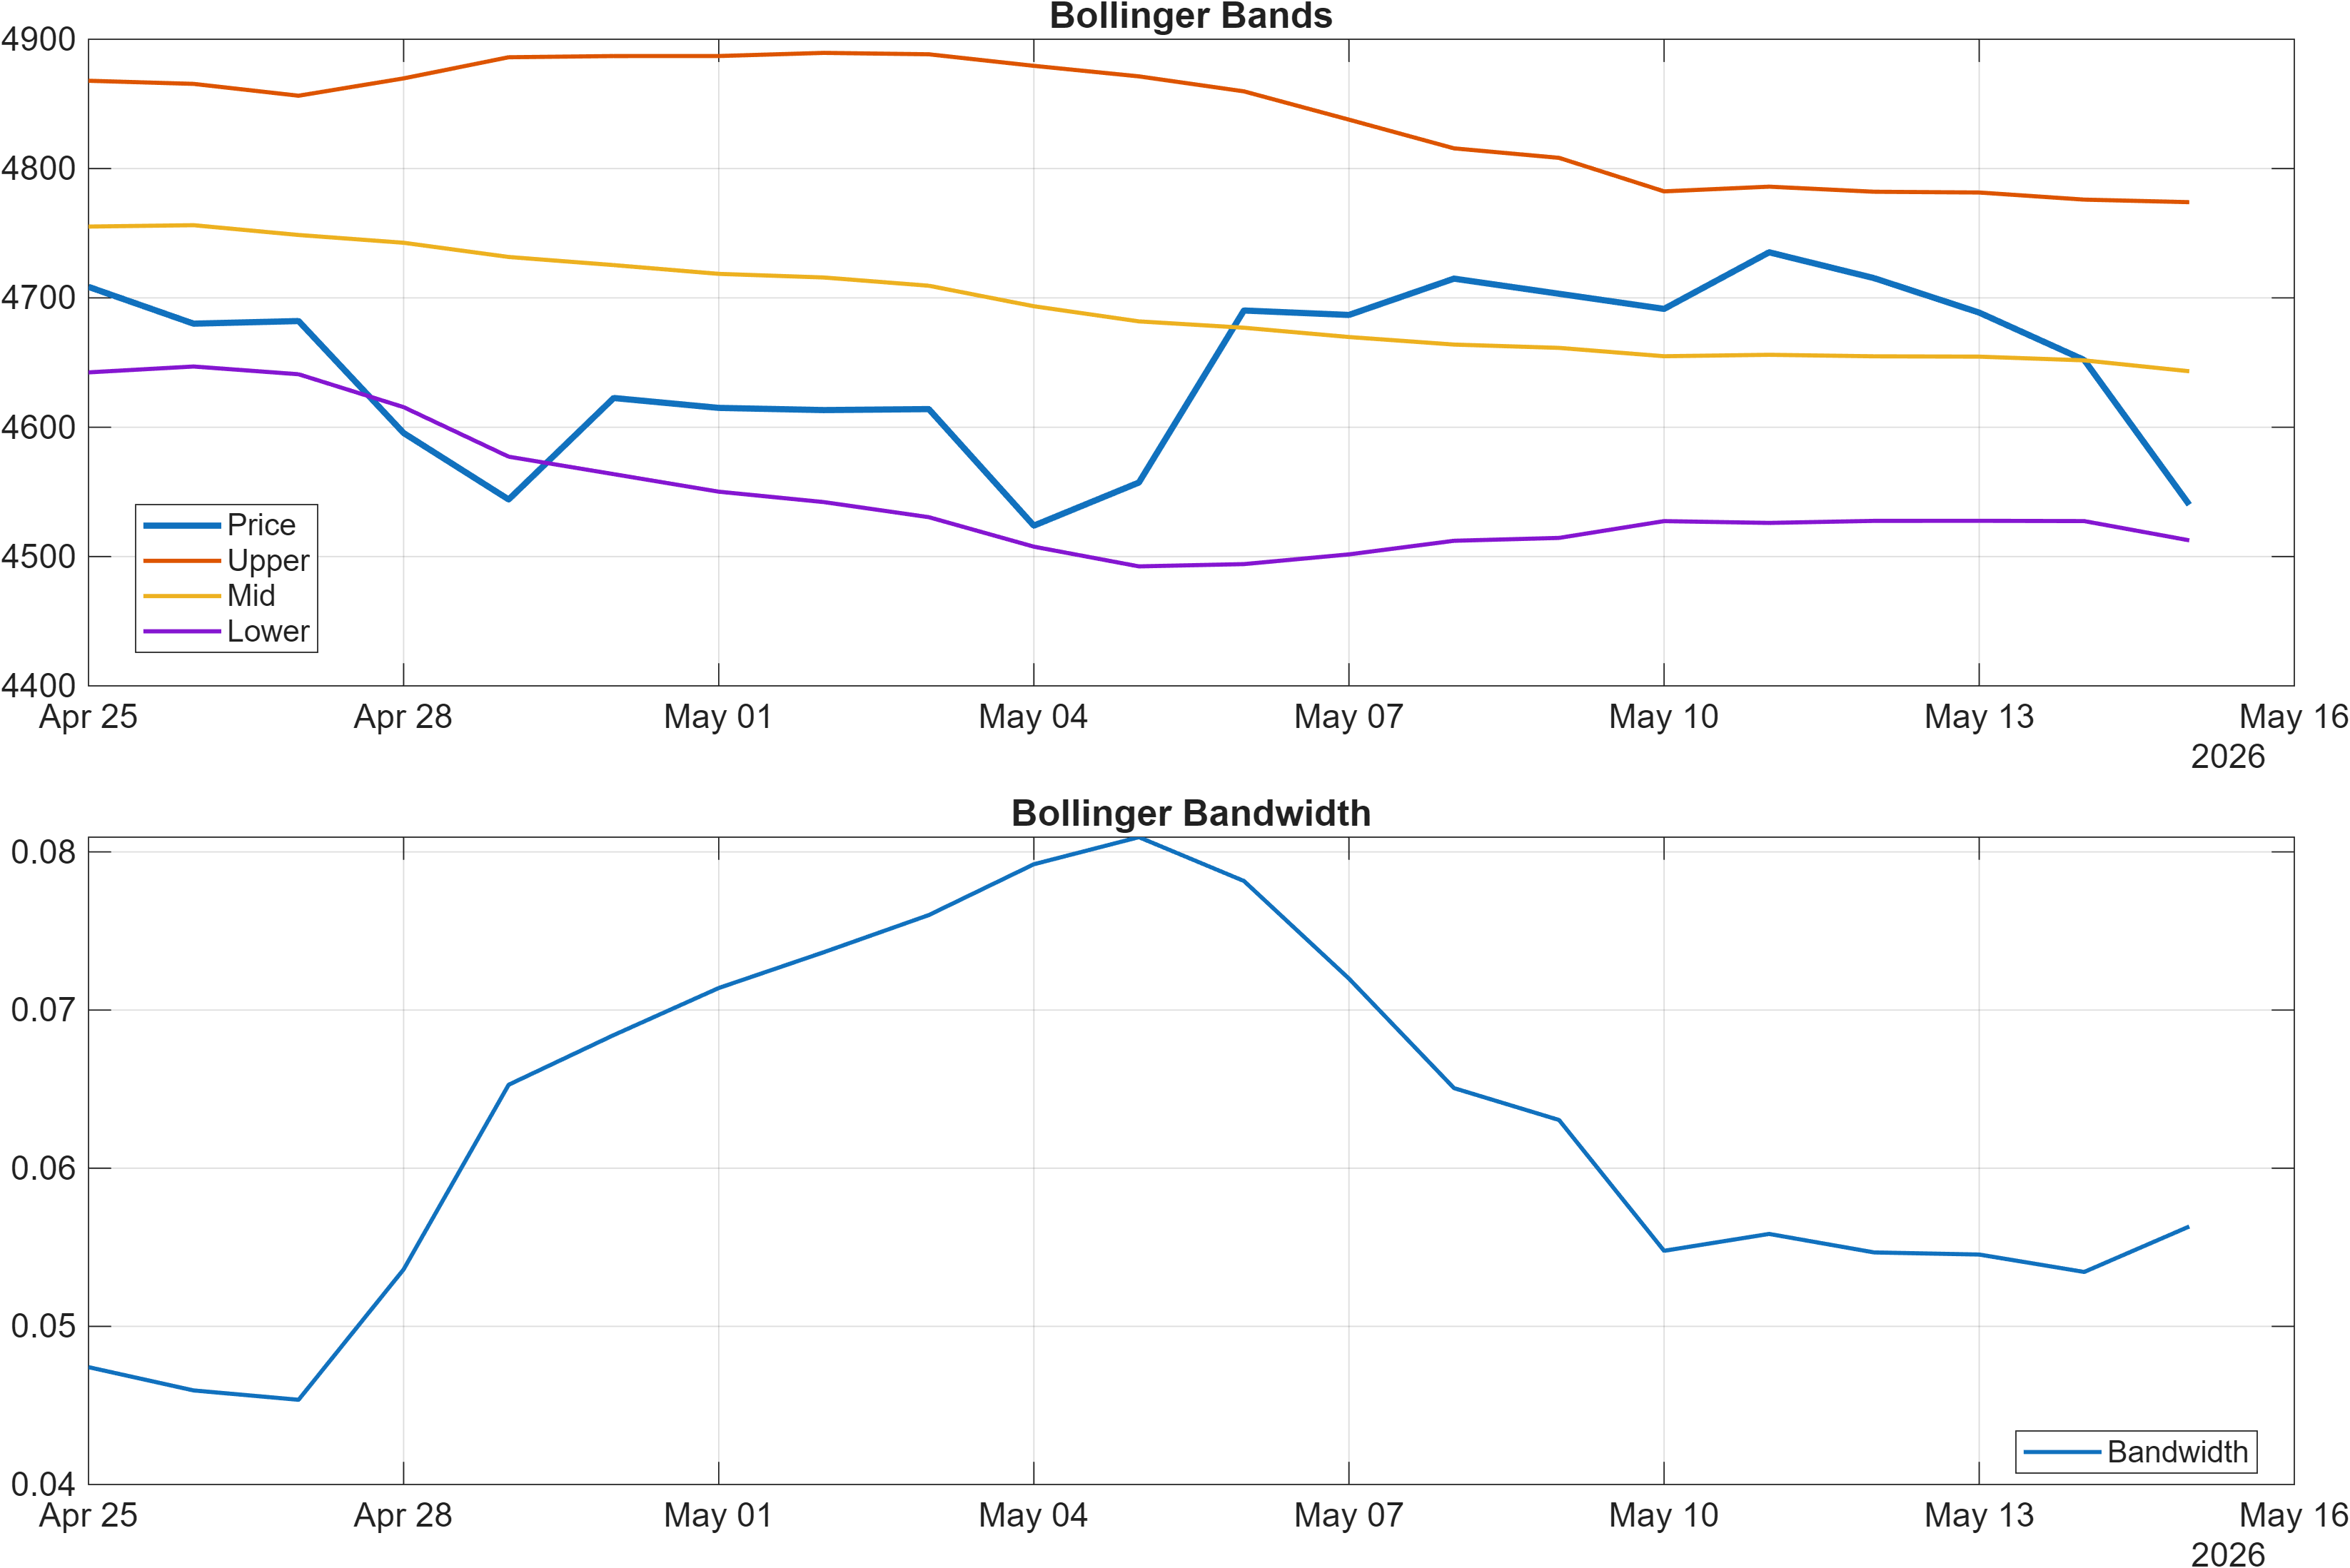
Interpretation: Bandwidth (volatility regime) latest = 0.0563.
Momentum is best described as mixed with a negative tilt, rather than decisively oversold or overbought. RSI bias is flagged neutral at the dashboard level, while the MACD histogram is negative at -1.8560, indicating that downside momentum remains present relative to its signal baseline. This combination often appears when price is stabilizing after weakness but has not yet produced the positive acceleration needed for a clean trend resumption—consistent with the short-term ranks deep in the weaker tail (daily #944, weekly #937).
Volatility conditions add an important constraint. The latest Bollinger bandwidth is 0.0563, which points to a moderate regime rather than an extreme expansion. When bandwidth is not materially elevated, breakouts and breakdowns can be more prone to stop-run behavior unless confirmed by follow-through. That is relevant to the scenario framing around key zones: the market can probe resistance or support, but without an accompanying volatility expansion, the probability of reversion remains non-trivial.
Internally, the 18-signal layer later shows both risk-on and risk-off elements (for example, MACD histogram bearish alongside other constructive inputs), which reinforces a theme of signal compression. Under compressed conditions, traders and allocators often prioritize (1) whether momentum can turn from negative to improving and (2) whether volatility begins to expand in the direction of travel. In this report’s framework, those checks are naturally anchored to the support at 4447.3996 and resistance at 4852.4151.
4) Support / Resistance zones
Support ~ 4447.3996 | Resistance ~ 4852.4151
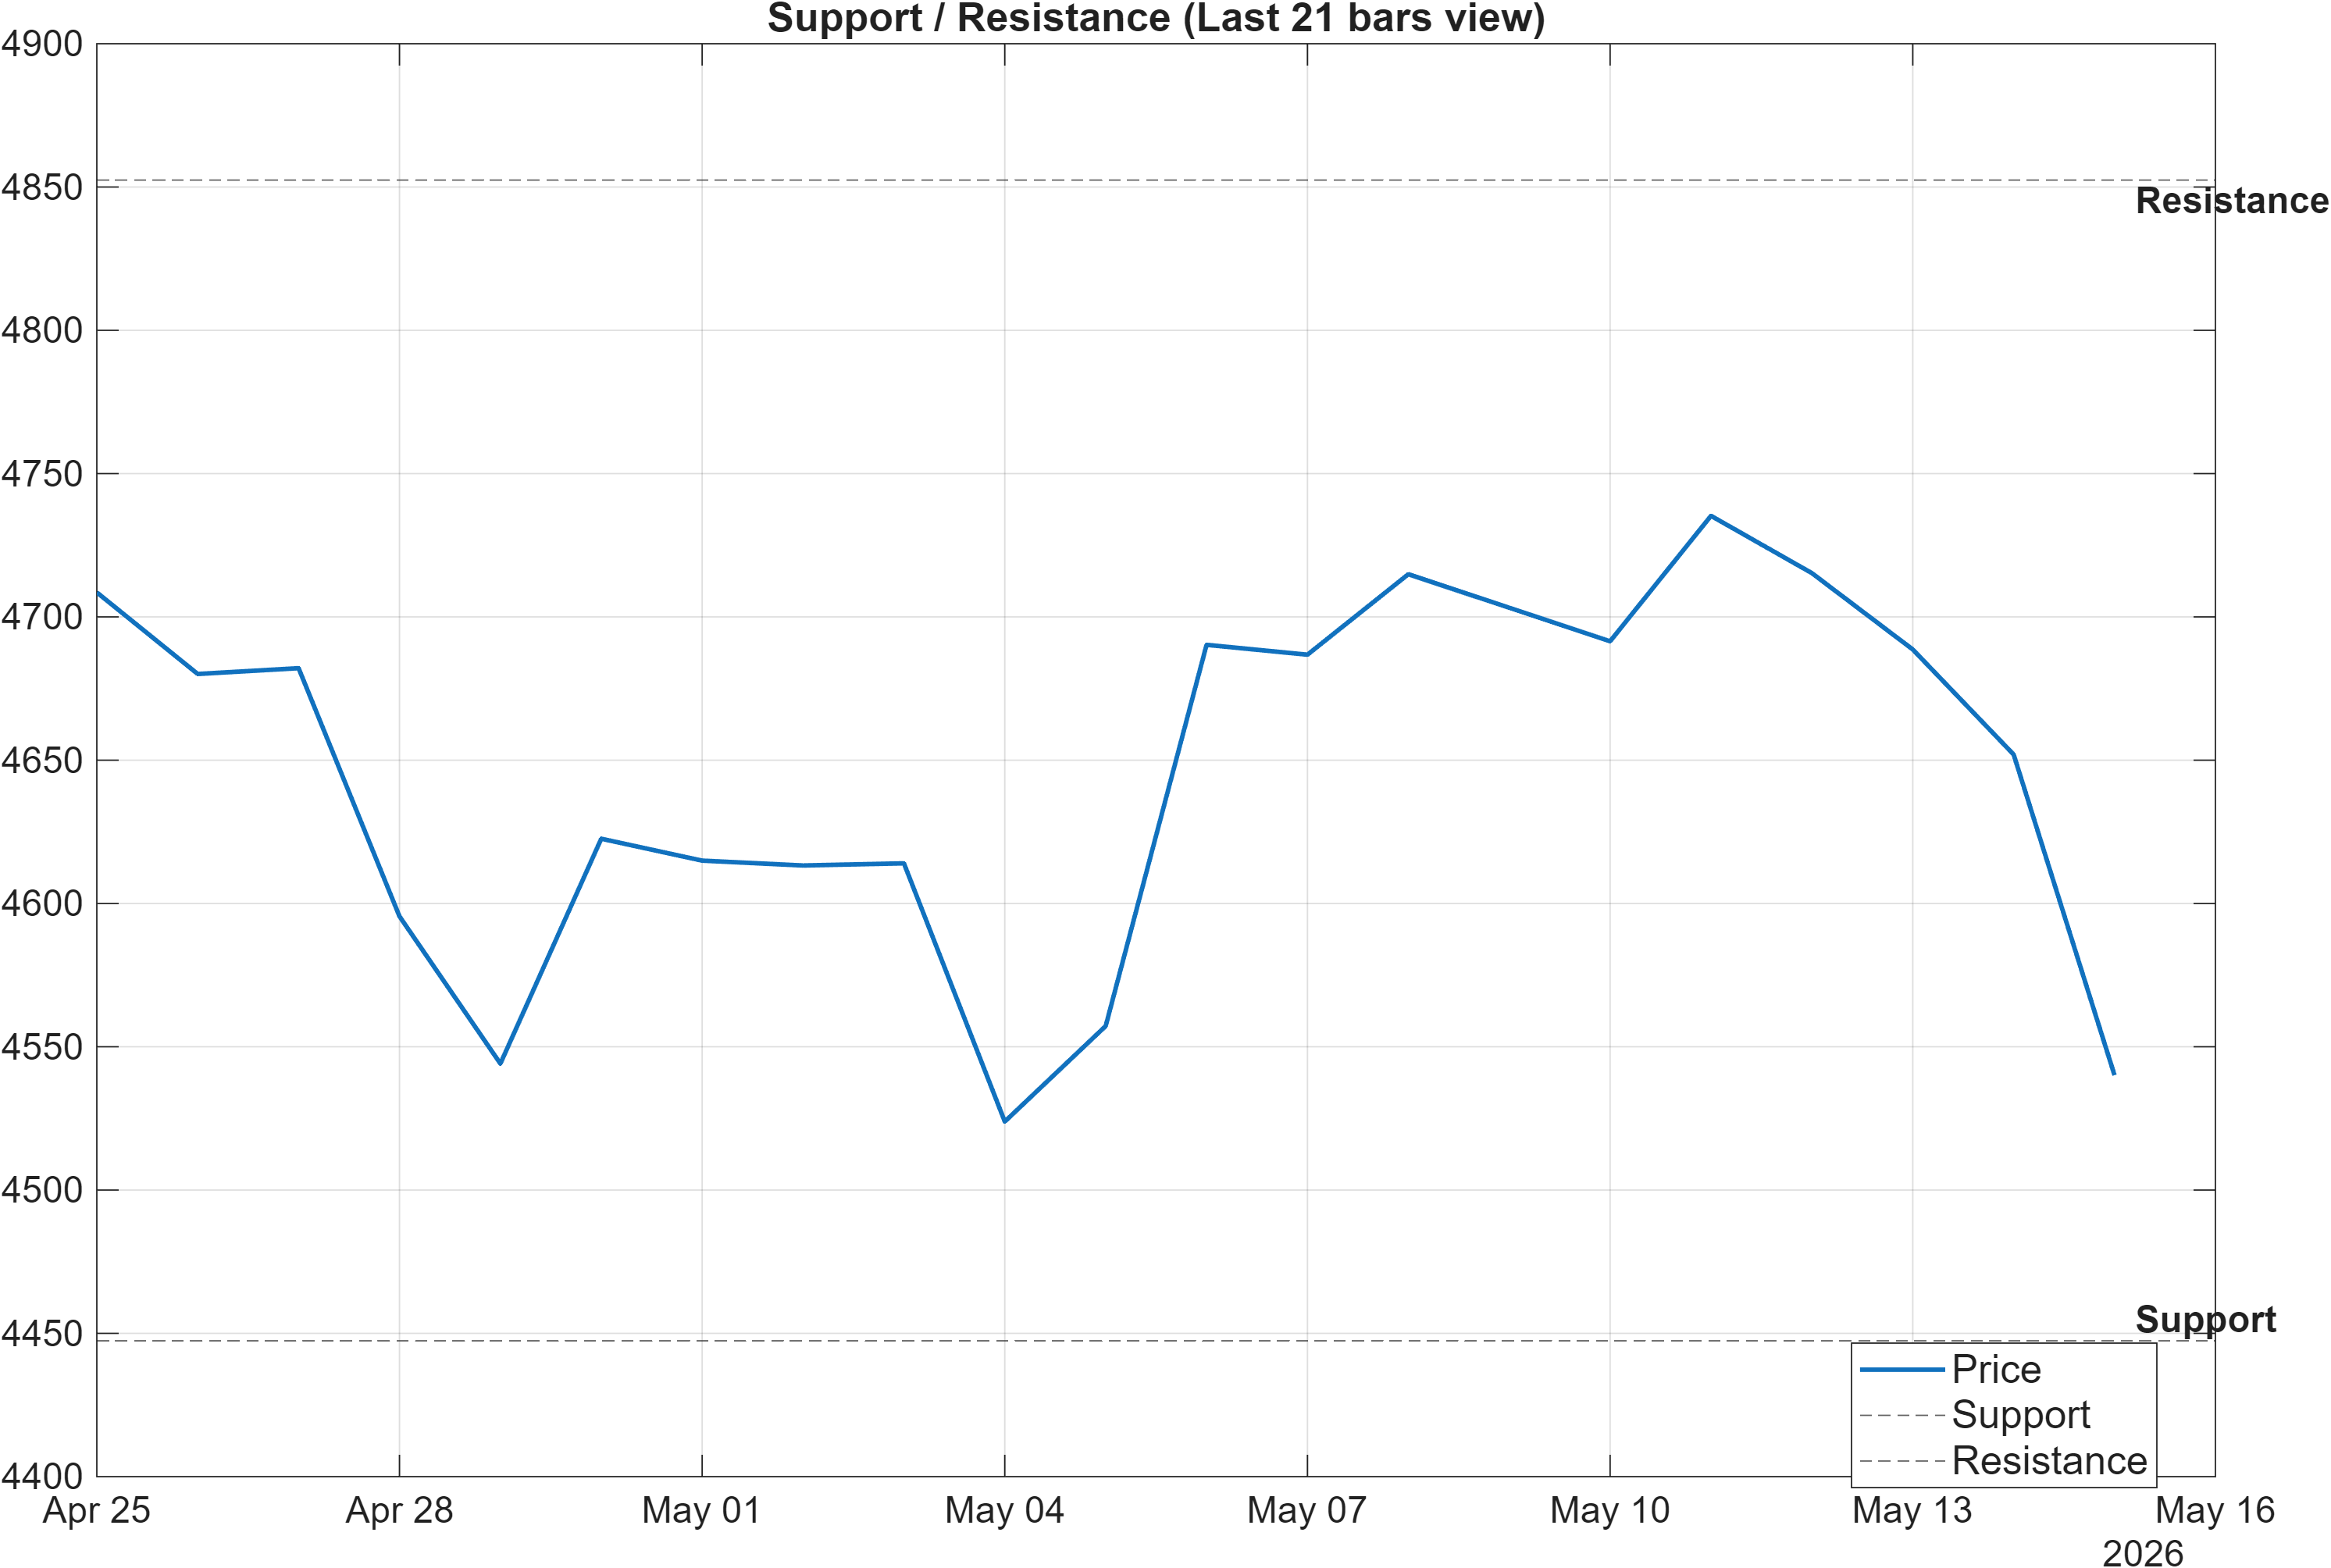
With intermediate trend structure still bearish (close vs MA50 bearish; MA50 vs MA200 bearish), the support/resistance map becomes the central decision framework. The model identifies support near 4447.3996 and resistance near 4852.4151. These levels should be treated as probabilistic zones where order flow often becomes more two-sided, particularly in a moderate volatility regime (bandwidth 0.0563).
The scenario language embedded in the snapshot is appropriately conditional: a break above resistance with volume is treated as continuation-supportive, while a close below support increases deterioration risk. This is consistent with the rank split: longer horizons remain constructive (6-month #4, yearly #26), but short horizons are weak (daily #944, weekly #937), so the market is effectively being asked to “prove” itself at key zones before the longer-horizon strength can be expressed without near-term drag.
A useful way to frame the levels alongside momentum is to look for agreement between (a) level interaction and (b) momentum confirmation. With MACD histogram at -1.8560, upside attempts that fail near resistance can fit the existing short-term bearish profile. Conversely, sustained trade above 4852.4151 that coincides with improving momentum would represent a measurable reduction in the current short-term headwind.
On the downside, 4447.3996 is the key line for risk containment within this model’s structure. A close below it would align with the weaker short-horizon ranks and would be harder to reconcile with the strongly bullish long-horizon placement without additional stabilization signals emerging later.
Scenario view: Break above resistance with volume → continuation. Close below support → signal deterioration risk.
5) Quant Technical Dashboard (18 Signals)
KGNAI AI Technical Analysis Score (Deep Reinforcement Learning): Rank #885 out of 970 (Rank 1 represents the strongest technical positioning and a higher probability of favorable price behavior. As ranks increase toward the maximum, the probability of favorable outcomes weakens and bearish positioning becomes more dominant.) | Label: Bearish | Score: -0.825
18-Signal Technical Confluence Score: 0.056 (Neutral)
Overall Technical Score (18-signal confluence + DRL rank blend): -0.209 (Neutral)
Note: The blended score reflects signal strength weighted against broader AI technical ranking, which may temporarily diverge.
Blended technical score breakdown: -0.209 (Neutral | Bull 6 / Bear 5 / Neutral 7)
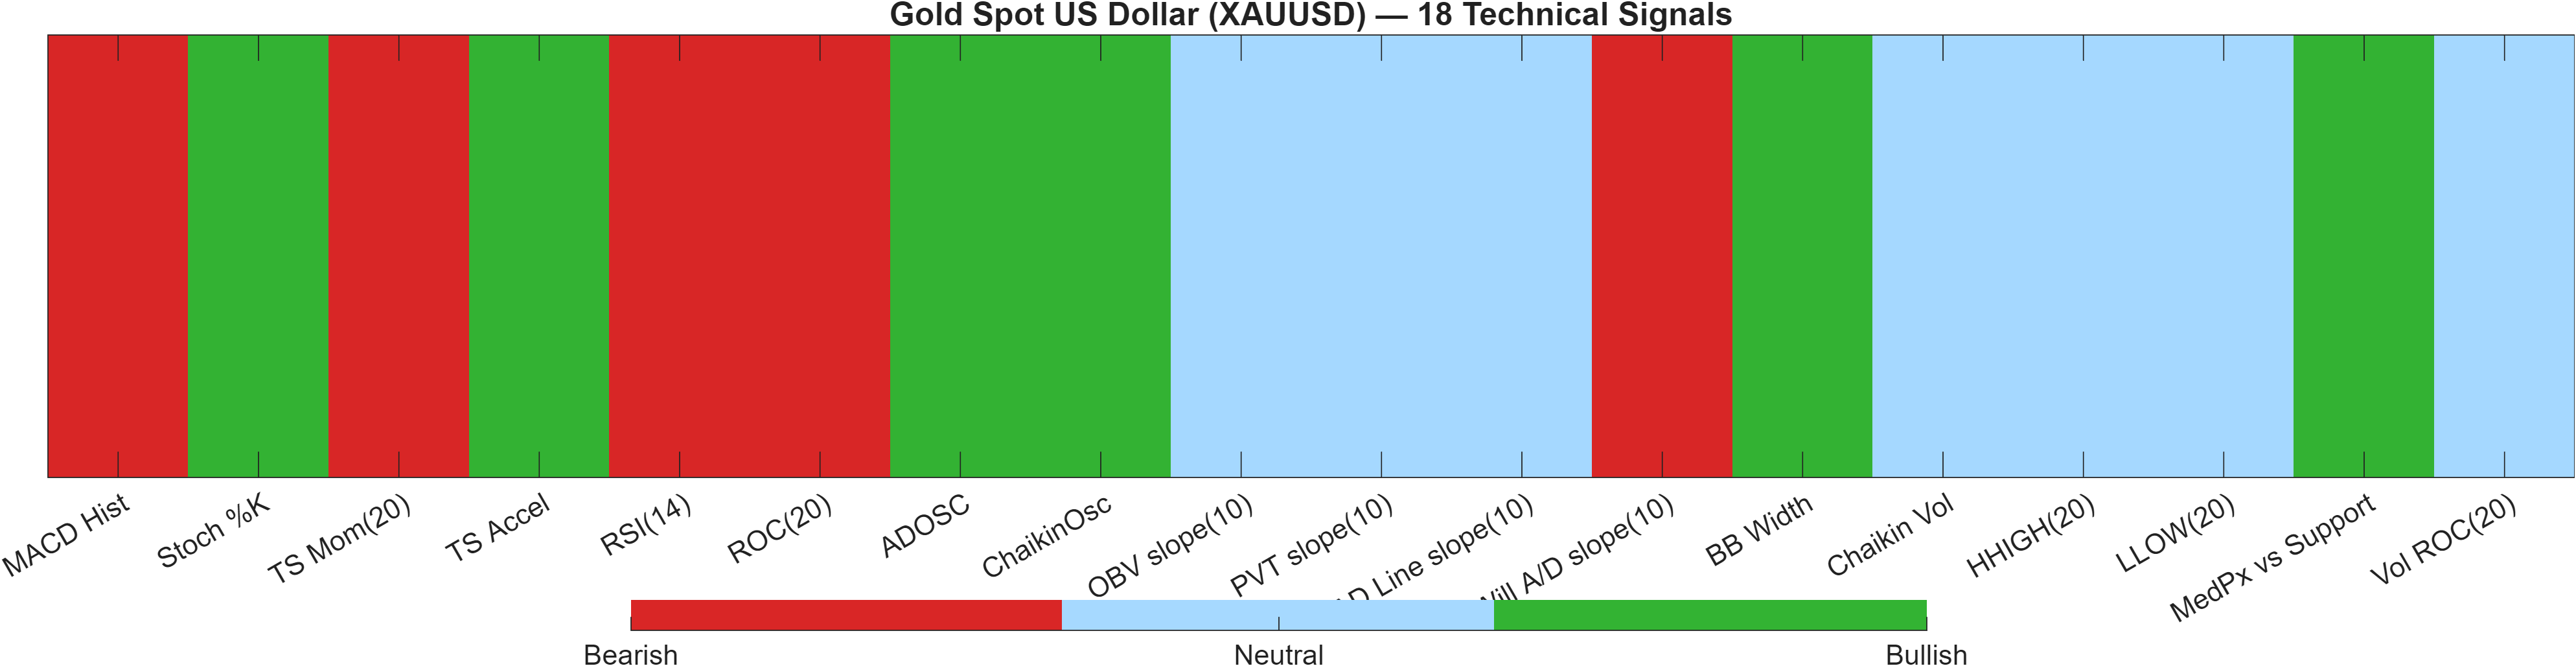
Signal table (Bull/Bear/Neutral)
| Indicator | Value | Signal |
|---|---|---|
| MACD Hist | -1.856 | Bearish |
| Stoch %K | 10.85 | Bullish |
| TS Mom(20) | -140 | Bearish |
| TS Accel | 13.43 | Bullish |
| RSI(14) | 43.23 | Bearish |
| ROC(20) | -2.992 | Bearish |
| ADOSC | 13.69 | Bullish |
| ChaikinOsc | 1.863e+04 | Bullish |
| OBV slope(10) | 0 | Neutral |
| PVT slope(10) | 0 | Neutral |
| AD Line slope(10) | 0 | Neutral |
| Will A/D slope(10) | -134.3 | Bearish |
| BB Width | 0.05631 | Bullish |
| Chaikin Vol | -0.9406 | Neutral |
| HHIGH(20) | 4774 | Neutral |
| LLOW(20) | 4501 | Neutral |
| MedPx vs Support | 141.3 | Bullish |
| Vol ROC(20) | — | Neutral |
The technical layer is a study in aggregation versus model penalty. The 18-signal confluence score is 0.056 (Neutral), and the blended overall technical score is -0.209 (Neutral). However, the separate DRL technical rank is weak at #885 out of 970 with a score of -0.825, pulling the blended interpretation toward caution even though the raw signal mix is relatively balanced (Bull 6 / Bear 5 / Neutral 7).
Within the indicator set, there are clear internal cross-currents. MACD histogram is bearish (-1.856), consistent with the earlier momentum read-through, while Stoch %K is bullish at 10.85, a configuration that can occur during late-stage pullbacks where short-cycle oscillators begin to recover before trend measures do. RSI(14) sits at 43.23 with a bearish classification in the table, indicating momentum is still below the typical midline threshold used by many systematic frameworks.
Volatility and range measures are not signaling an extreme: BB Width is flagged bullish with 0.05631, consistent with the moderate bandwidth regime described earlier. Range markers (HHIGH(20) 4774, LLOW(20) 4501) reinforce that the market is operating within a defined recent band, making the external zones (4447.3996 support; 4852.4151 resistance) particularly relevant for regime confirmation.
Interpretation: Indicator-level signals form the base confluence, which is then adjusted using a separate AI-driven technical ranking model. The final technical score summarizes this combined view.
6) News sentiment + extractive gist
Note: Instrument-specific news matches were not found, so the digest includes broader market/sector headlines. Links are provided for verification.
Sentiment score (avg): 0.091 | Positive: 31% | Neutral: 56% | Negative: 12%
KGNAI AI News Sentiment Score (normalized -1 to +1): 0.37 (as of 2026-05-14) | Label: Bullish | Overall news score: 0.32
Positive Developments
Recent coverage across major financial outlets indicates a mildly constructive macro tone in parts of Asia, centered on resilient technology-linked export demand and incremental improvement in cross-border trade expectations. This backdrop can matter for gold via the rates-and-risk channel: stronger growth narratives can lift yields and the US dollar at the margin, but they can also reduce tail-risk hedging demand. In the aggregate, KGNAI’s normalized news sentiment remains 0.37 (Bullish) with an average sentiment score of 0.091 and a distribution skewed toward 31% positive versus 12% negative. The balance suggests that the news flow is not strongly risk-off, but it is constructive enough to avoid compounding the model’s short-term bearish price/rank signals. For positioning, this reads as a supportive context rather than a primary driver; price validation still concentrates around 4852.4151 resistance and momentum repair from a negative MACD histogram (-1.8560).
Neutral / Mixed Developments
The dominant neutral thread in the digest is the market’s attention shifting toward scheduled macro catalysts (such as PMI cycles and central-bank related events) and broad US dollar dynamics rather than commodity-specific microstructure. That matches the sentiment mix where 56% of items are classified neutral. In a setup where technical signals are already compressed (18-signal confluence 0.056, overall technical score -0.209), neutral macro coverage can translate into range-bound trade unless volatility expands beyond the recent Bollinger bandwidth regime (0.0563). This reinforces an interpretation of XAUUSD as currently more sensitive to incremental shifts in rates/FX expectations than to idiosyncratic gold-specific headlines—consistent with the note that instrument-specific matches were not found in the provided data.
Negative / Risk Signals
Recent coverage across major financial outlets also highlights risk signals that can tighten financial conditions—particularly narratives around rising yields, inflation concerns, and policy uncertainty. For gold, the sign of these developments is not one-directional: higher real rates can be a headwind, while heightened geopolitical or policy uncertainty can support hedging demand. In the current snapshot, the negative bucket remains smaller (12%) than neutral or positive, but the market impact can be asymmetric if rate volatility rises. This risk framing aligns with the model’s near-term caution: short-horizon ranks are weak (daily #944, weekly #937) and MACD histogram remains negative (-1.8560). In that environment, downside level integrity at 4447.3996 is a key risk delimiter; a close below that zone would be consistent with risk narratives overwhelming the otherwise mildly constructive sentiment bias.
- Whether price can sustain above 4852.4151 while momentum improves from MACD hist -1.8560.
- Whether a test of 4447.3996 holds without a volatility expansion beyond bandwidth 0.0563.
- Whether the short-horizon rank pressure (daily #944, weekly #937) begins to converge toward the stronger longer-horizon ranks.
Sources referenced: Reuters, Bloomberg, Yahoo Finance, MarketWatch, Investing.com
Snapshot: AI Rank (Short–Mid–Long): Mixed (Bullish tilt) (Bearish–Bullish–Bullish) · Technical Confluence: Neutral · Key Levels: Support ~4447.40 | Resistance ~4852.42 · News Sentiment: Neutral
7) Sources
Source links were provided in the original draft; per publication format, this section is presented without reproducing external URLs.
You may also like: How KGNAI AI ranks instruments across global markets
Disclaimer: KGNAI provides AI-generated analytics and educational market commentary only. This is not financial advice. Markets involve risk. Always do your own research.