
USDARS (US Dollar/Argentine Peso FX Spot Rate) — 01-Mar-2026 Technicals Neutral Near Key Levels, Long-Horizon Ranks Remain Bullish
USDARS sits in a structurally strong long-horizon rank profile while its nearer-term technical posture remains constrained by trend and moving-average structure. Within a 961-instrument FX universe, the short and mid windows are Neutral (Daily #235, Weekly #544, Monthly #487), yet the longer horizons are distinctly stronger (6-Monthly #8, Yearly #9). This creates a measurable timeframe divergence: long-run positioning is favorable relative to peers, but the current tape is not displaying broad confirmation across trend-following signals. Technically, the close vs MA50 and MA50 vs MA200 are both Bearish, while momentum indicators are mixed with an RSI bias marked Neutral and a positive MACD histogram reading (3.2129). Volatility remains contained, with Bollinger bandwidth at 0.0337, keeping emphasis on how price behaves around the decision zones at 1379.5000 (support) and 1470.2500 (resistance).
Key Takeaways
- Rank stance: Short-term Neutral · Mid-term Neutral · Long-term Bullish (6-Monthly #8, Yearly #9)
- Technical confluence label: Neutral (18-signal confluence 0.000; blended overall technical score -0.244)
- Key levels: Support 1379.5000 · Resistance 1470.2500
- News sentiment bias: Bullish (avg sentiment 0.186; normalized score 0.89)
- Confirmation / invalidation condition: A break and hold above 1470.2500 supports continuation bias; a close below 1379.5000 increases deterioration risk.
What KGNAI Measures
KGNAI evaluates assets using large cross-sectional datasets built from millions of structured data points. Inputs incorporate fundamental metrics, technical structures, and systematically processed news sentiment. Statistical models, machine learning, and AI frameworks are used to assess relative positioning, signal alignment, and probabilistic behavior across broad universes.
How to Read This Report
- Ranks are comparative across the tracked universe, not absolute price targets.
- Confluence reflects alignment among independent signal groups.
- Support/resistance levels are probabilistic decision zones, not guarantees.
- Sentiment provides contextual bias within the broader analytical framework.
1) KGNAI AI Analysis
Region: FOREX
Total universe size: 961 ranked instruments
- Daily rank: #235 out of 961 — Neutral
- Weekly rank: #544 out of 961 — Neutral
- Monthly rank: #487 out of 961 — Neutral
- 3-Monthly rank: #100 out of 961 — Bullish
- 6-Monthly rank: #8 out of 961 — Bullish
- Yearly rank: #9 out of 961 — Bullish
USDARS presents a clean horizon split in KGNAI ranks: the near-term windows cluster around Neutral (Daily #235, Weekly #544, Monthly #487), while the longer windows shift decisively into outperformance territory (6-Monthly #8, Yearly #9). In cross-sectional terms, those long-horizon readings place USDARS in the top decile of the tracked universe, even though the short and mid horizons do not.
This configuration commonly corresponds to a market that is still retaining longer-cycle strength versus peers, but is experiencing timing friction at shorter intervals—often showing up as range conditions, mean reversion, or trend pauses. The intermediate bridge is partially supportive: the 3-Monthly rank at #100 is also Bullish, implying that the longer-run advantage is not purely a legacy effect.
The stated term view—Short-term Neutral, Mid-term Neutral, Long-term Bullish—should be read as an alignment map rather than a direction forecast. Practically, it flags that strategy selection matters: momentum-style entries may require tighter confirmation, while position-style frameworks can place more weight on the persistent strength embedded in the #8 and #9 long-horizon ranks.
Want the full universe and complete rank tables? Unlock full access on KGNAI: https://www.kgnai.com/pricing
2) Price & trend overview
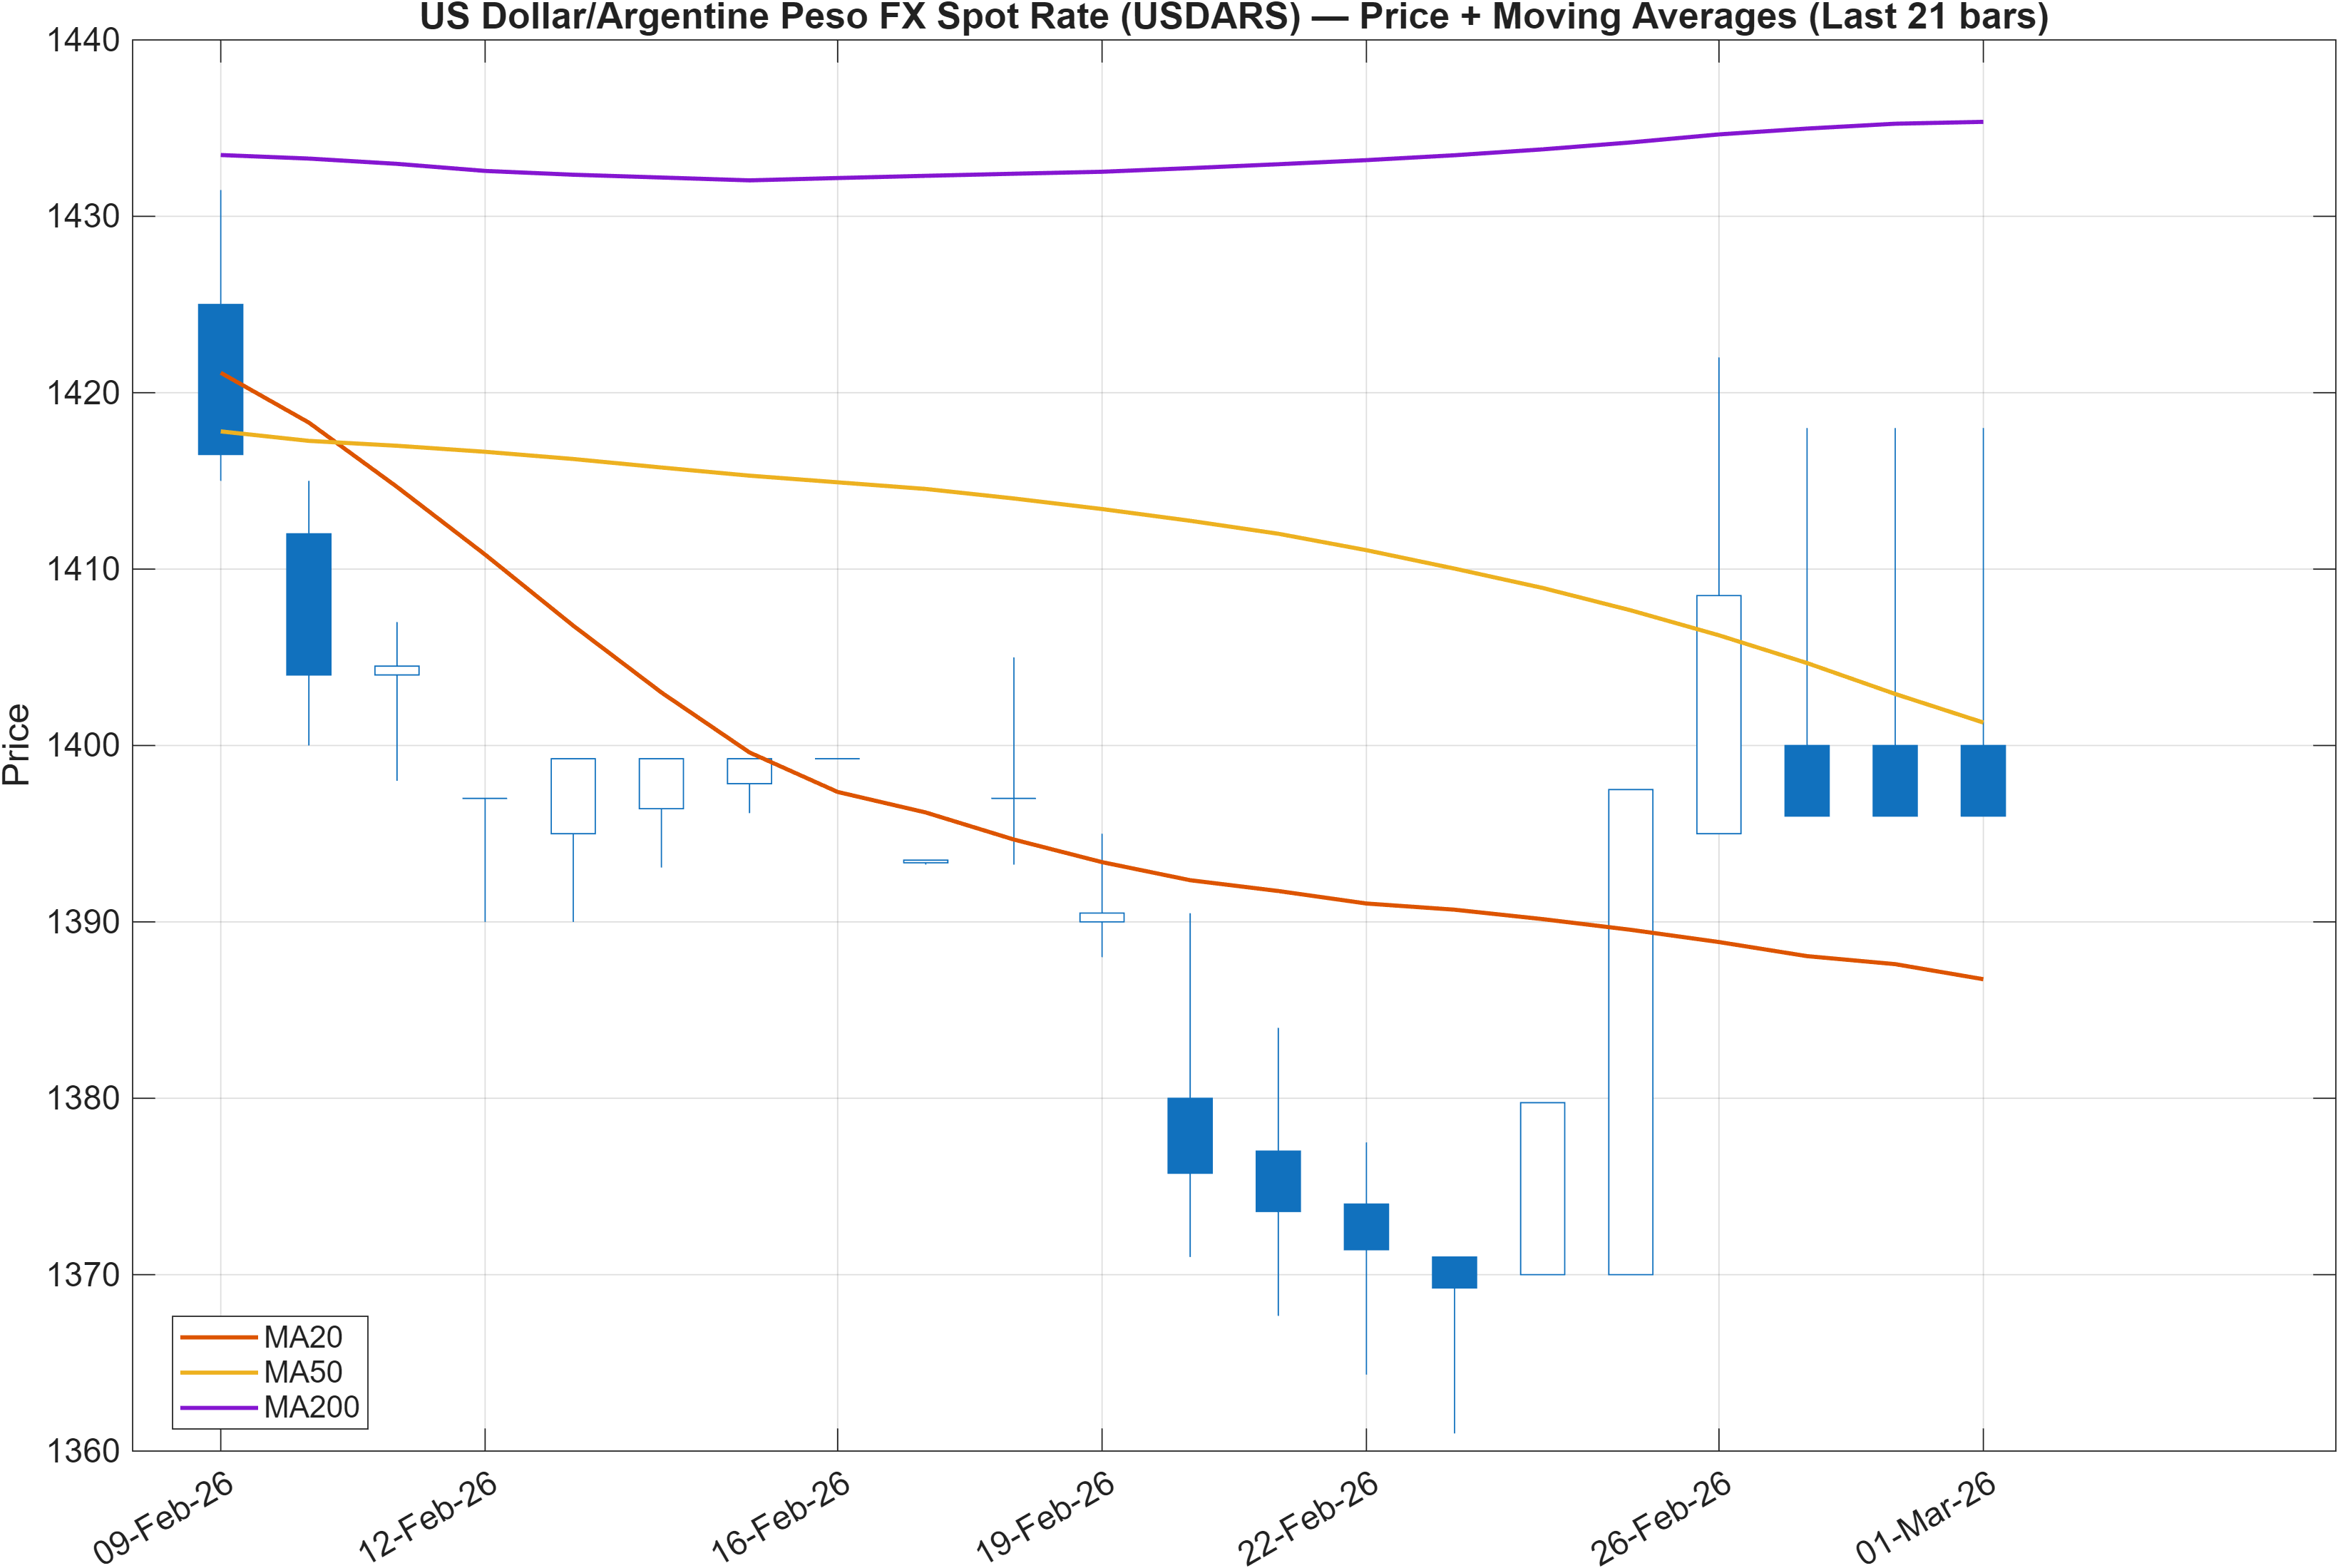
Trend condition: both moving-average tests are currently Bearish (Close vs MA50 = Bearish; MA50 vs MA200 = Bearish). This combination typically characterizes a market where the shorter moving average remains below the longer moving average and price is not consistently reclaiming the medium-term reference line—conditions that can suppress trend-following conviction even when longer-horizon ranks remain strong.
Alignment vs divergence across horizons
The key analytical tension is between structural rank strength (6-Monthly #8, Yearly #9) and trend-following softness in the moving-average stack. When these disagree, the market often behaves as a sequence of attempted advances that require confirmation at nearby decision zones rather than a smooth continuation. In that context, the predefined levels—support 1379.5000 and resistance 1470.2500—become more informative than the moving averages alone, because they anchor where the tape is more likely to switch from “range acceptance” to “breakout acceptance.”
What would improve the trend read
With volatility contained (Bollinger bandwidth later noted at 0.0337), the moving-average regime often changes only after either (a) a sustained reclaim that flips Close vs MA50, or (b) a stronger re-rating impulse that begins to compress and then reverse MA50 vs MA200. Until then, the trend layer is best treated as cautious even while other components (momentum and sentiment) show selective support.
3) Momentum & volatility dashboard
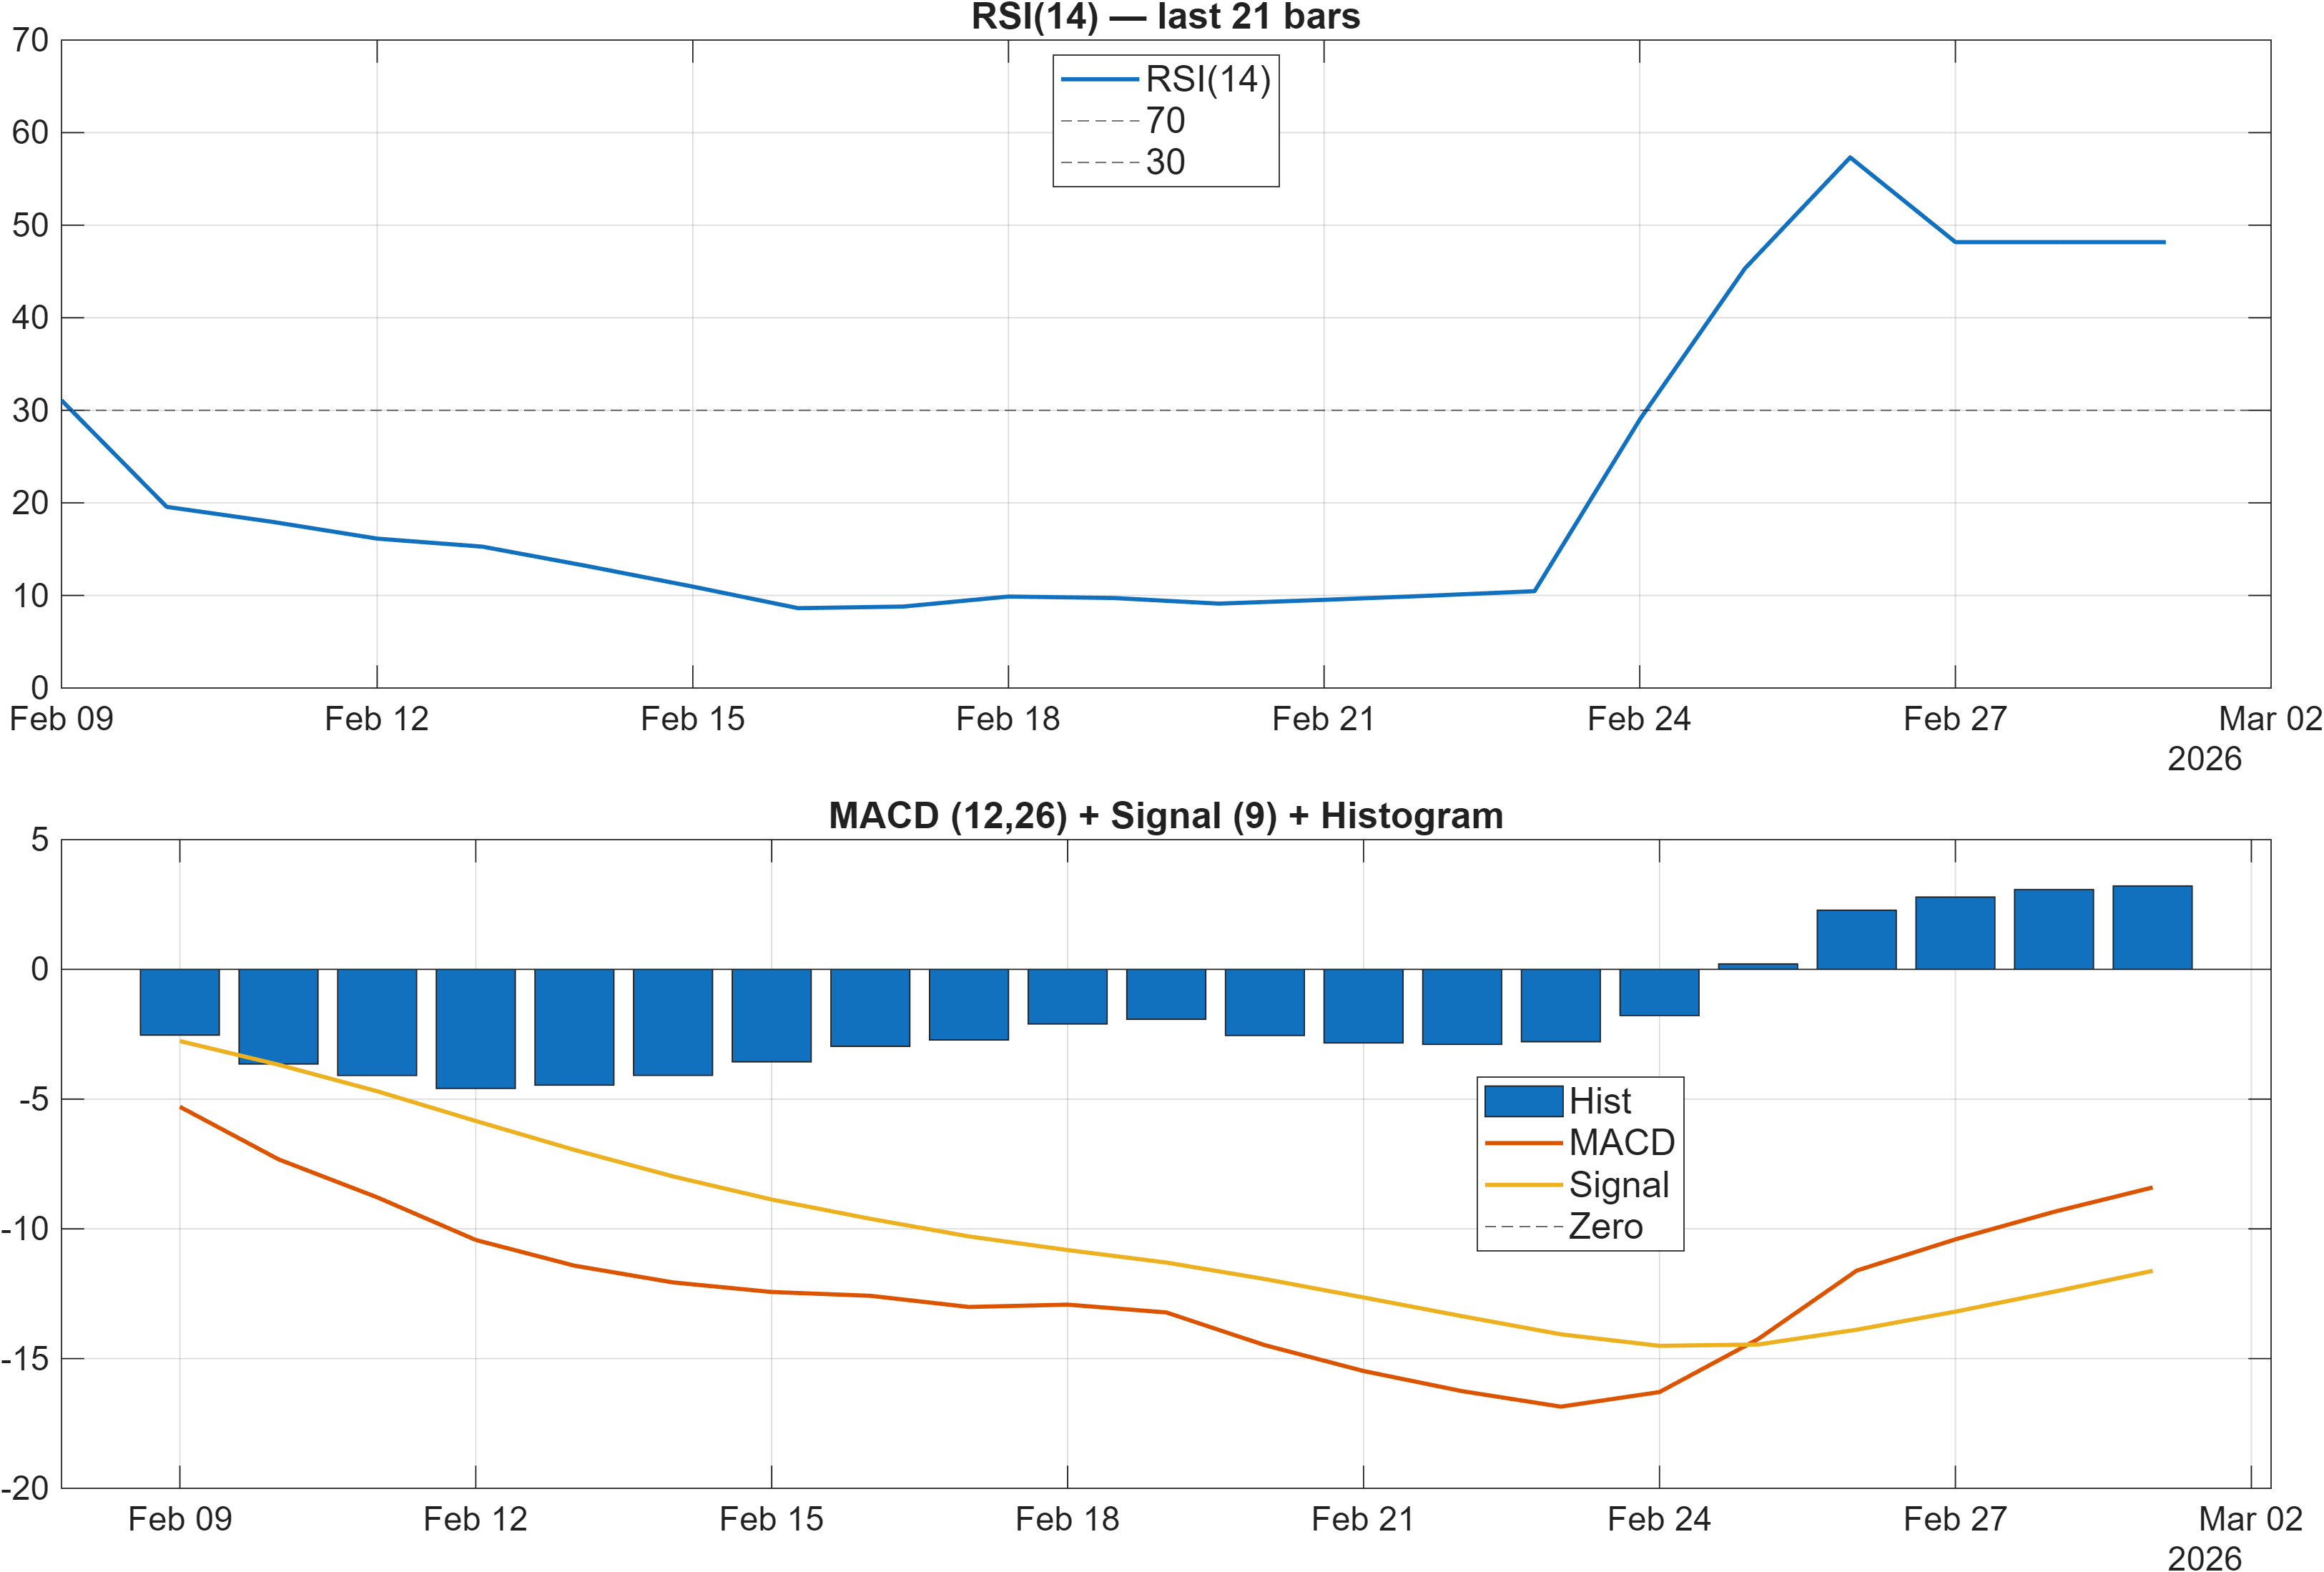
Momentum is best described as selectively constructive but not dominant. RSI bias is labeled Neutral, consistent with the RSI(14) reading of 48.17, which sits near the midline rather than in an overbought/oversold regime. At the same time, the MACD histogram is positive (3.2129), and the signal table also tags MACD Hist (3.213) as Bullish. This is a common “early-turn” configuration: directional momentum is trying to improve, but breadth across oscillators has not followed through.
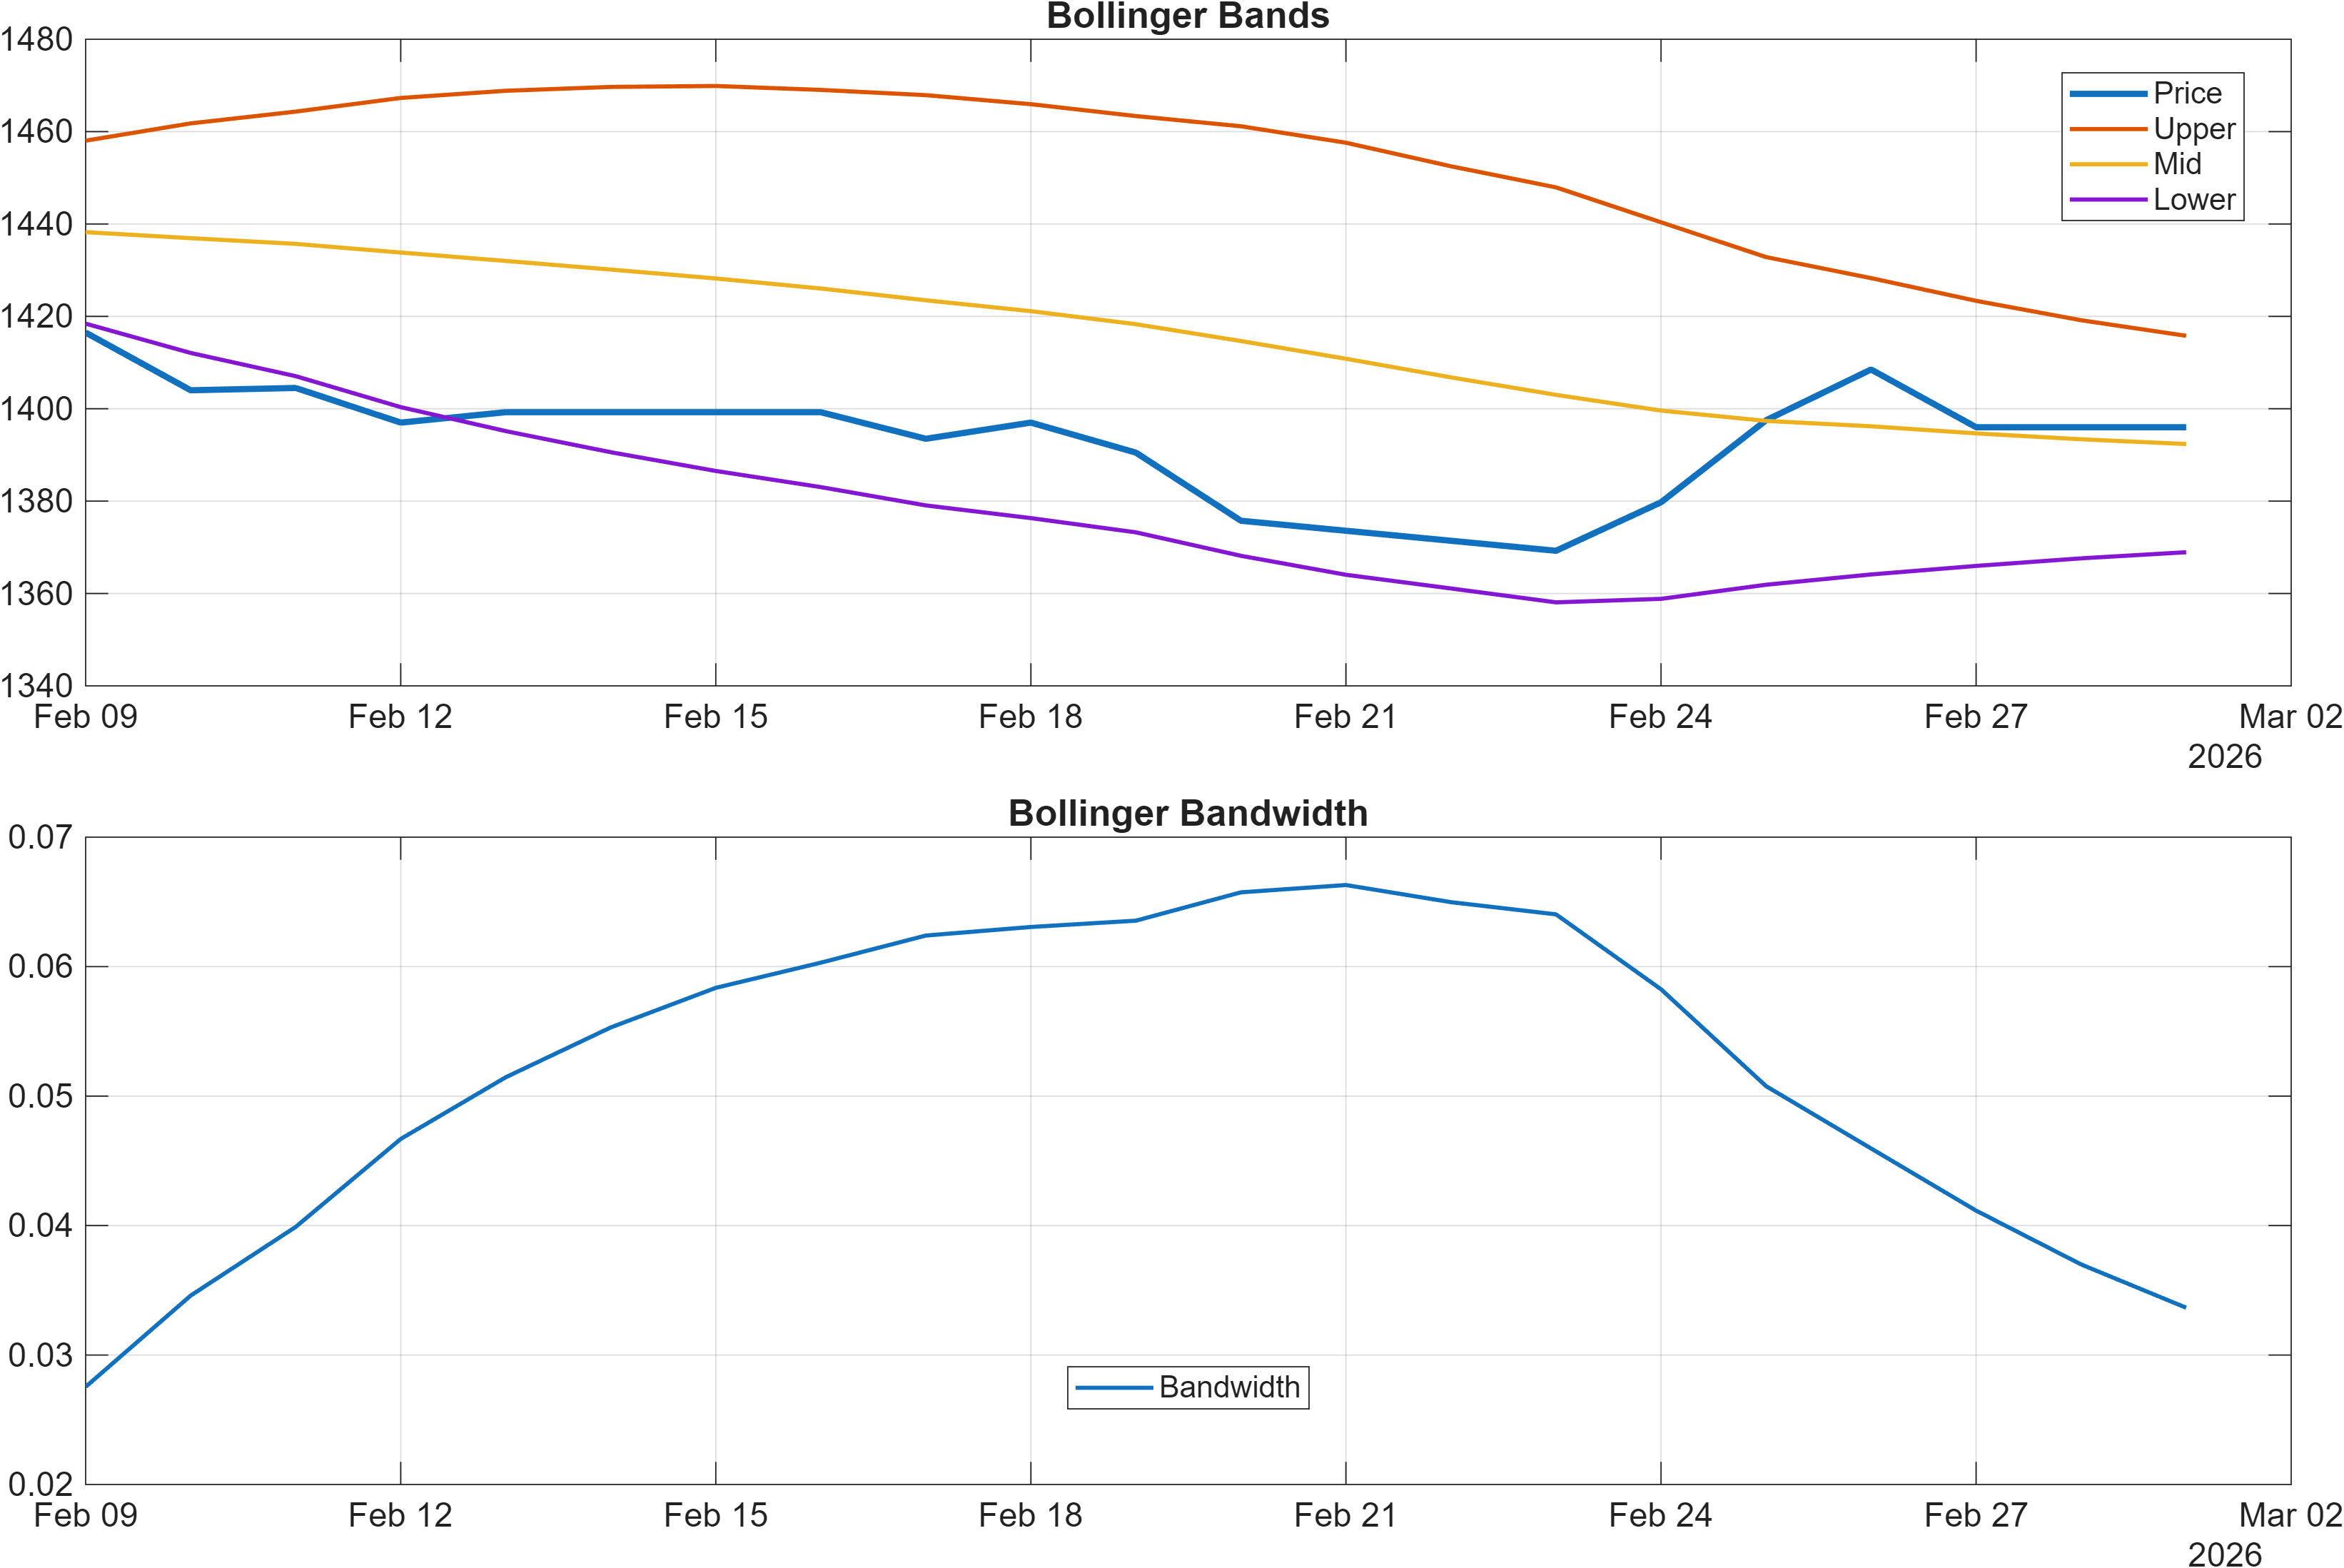
Volatility regime: compression signals, not expansion
Bollinger bandwidth at 0.0337 (and BB Width 0.03365 in the signal table, marked Neutral) indicates a lower-volatility regime relative to periods of expansion. In FX, compressed bandwidth often shifts the analytical focus toward level interaction: markets can oscillate within a defined range until a catalyst or positioning imbalance triggers a break. Importantly, low bandwidth does not specify direction; it primarily affects timing risk and the likelihood that moves begin as incremental rather than impulsive.
Momentum cross-check: mixed internal evidence
Additional momentum inputs reinforce the mixed profile: TS Mom(20) is -8 (Bearish) and ROC(20) is -0.5698 (Bearish), while TS Accel is 17.25 (Bullish). The combination is consistent with decelerated weakness attempting to stabilize, rather than an established upside impulse. For confirmation, a positive MACD histogram typically benefits from price holding above nearby support—here, 1379.5000.
4) Support / Resistance zones
Support ~ 1379.5000 | Resistance ~ 1470.2500
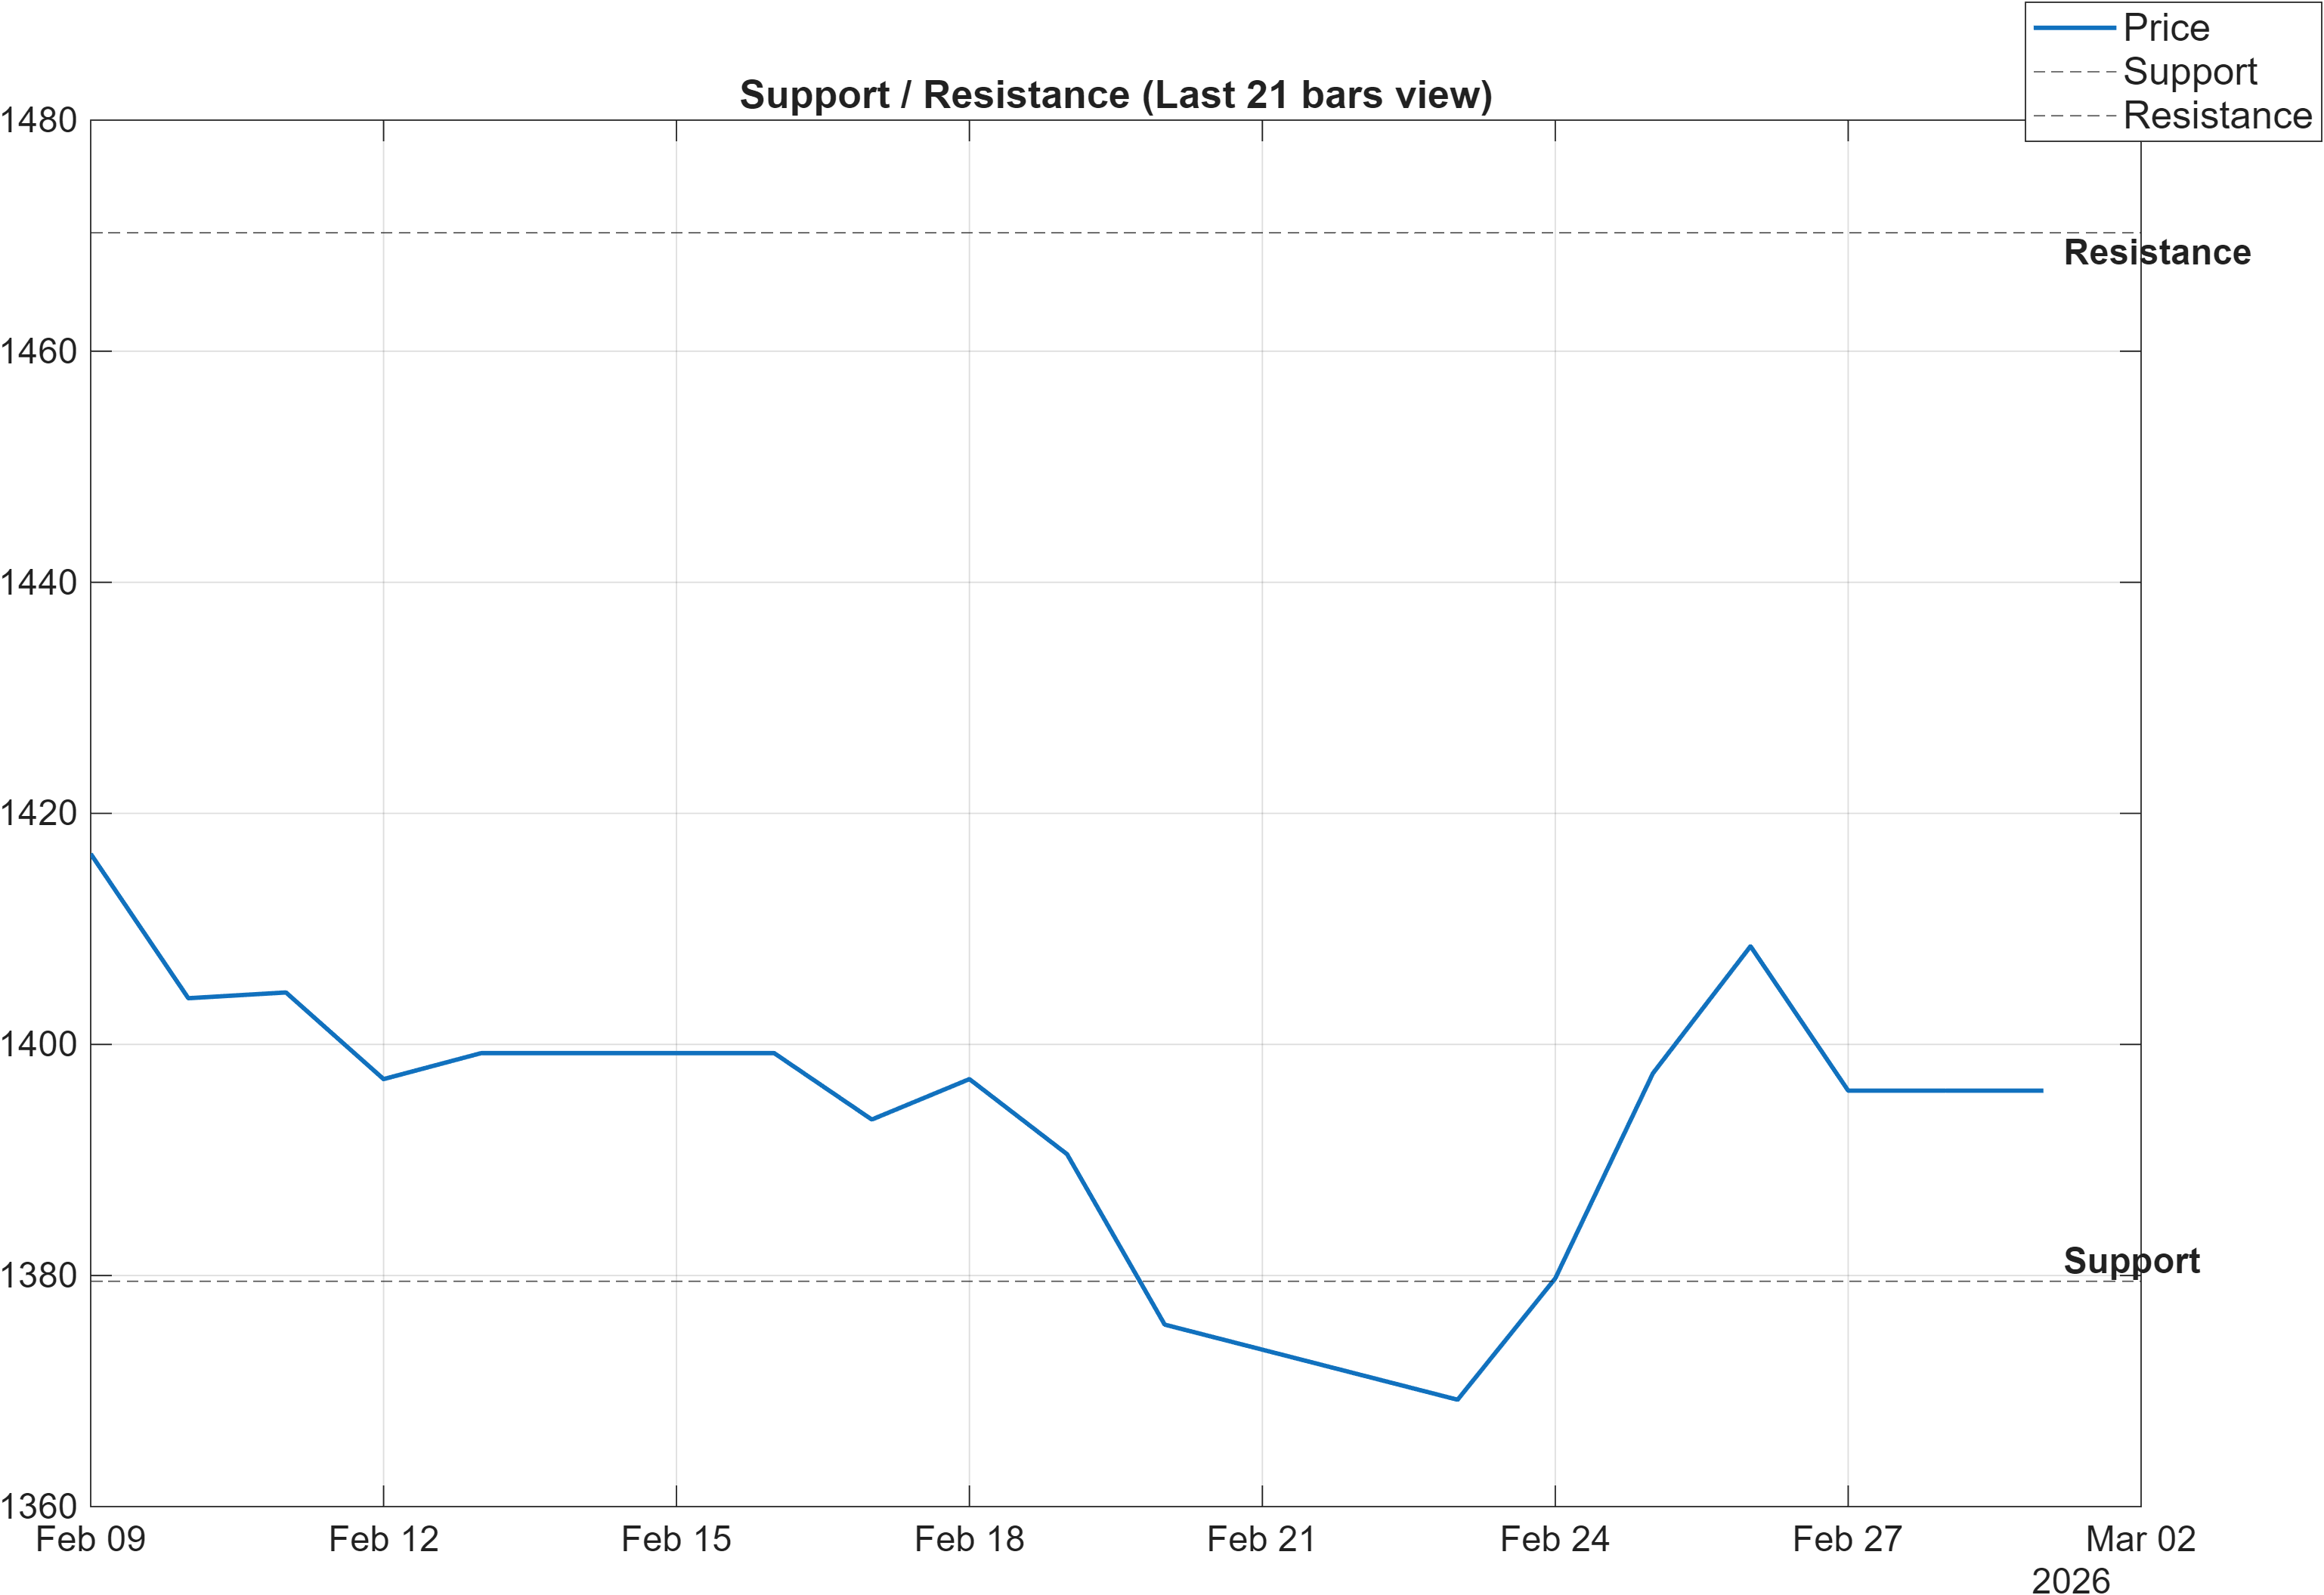
With trend signals currently bearish on the moving-average tests but long-horizon ranks strongly bullish, the support/resistance map becomes the primary decision framework. The market is effectively being asked to prove direction at 1470.2500 (resistance) or fail at 1379.5000 (support). This is a classic environment where regime transition risk rises: either the longer-horizon strength reasserts itself via a clean breakout, or the weaker trend layer pulls the market into deterioration below a key floor.
Continuation vs deterioration: conditions are explicit
The scenario framing remains straightforward and should be interpreted probabilistically. A break above 1470.2500 with volume is treated as continuation evidence, aligning with the longer-horizon ranks (6-Monthly #8, Yearly #9) and potentially validating the constructive momentum component (MACD histogram 3.2129). Conversely, a close below 1379.5000 signals deterioration risk—particularly relevant given the bearish moving-average configuration.
Range geometry and nearby reference points
The signal table provides additional context around recent extremes: HHIGH(20) is 1422 and LLOW(20) is 1361, both Neutral. Those sit inside the broader decision band bounded by 1379.5000 and 1470.2500, suggesting a market that has been operating in a contained distribution rather than trending. In such conditions, break attempts can be frequent; follow-through is the differentiator.
5) Quant Technical Dashboard (18 Signals)
KGNAI AI Technical Analysis Score (Deep Reinforcement Learning): Rank #868 out of 958 (Rank 1 represents the strongest technical positioning and a higher probability of favorable price behavior. As ranks increase toward the maximum, the probability of favorable outcomes weakens and bearish positioning becomes more dominant.) | Label: Bearish | Score: -0.812
18-Signal Technical Confluence Score: 0.000 (Neutral)
Overall Technical Score (18-signal confluence + DRL rank blend): -0.244 (Neutral)
Note: The blended score reflects signal strength weighted against broader AI technical ranking, which may temporarily diverge.
Blended technical score breakdown: -0.244 (Neutral | Bull 4 / Bear 4 / Neutral 10)
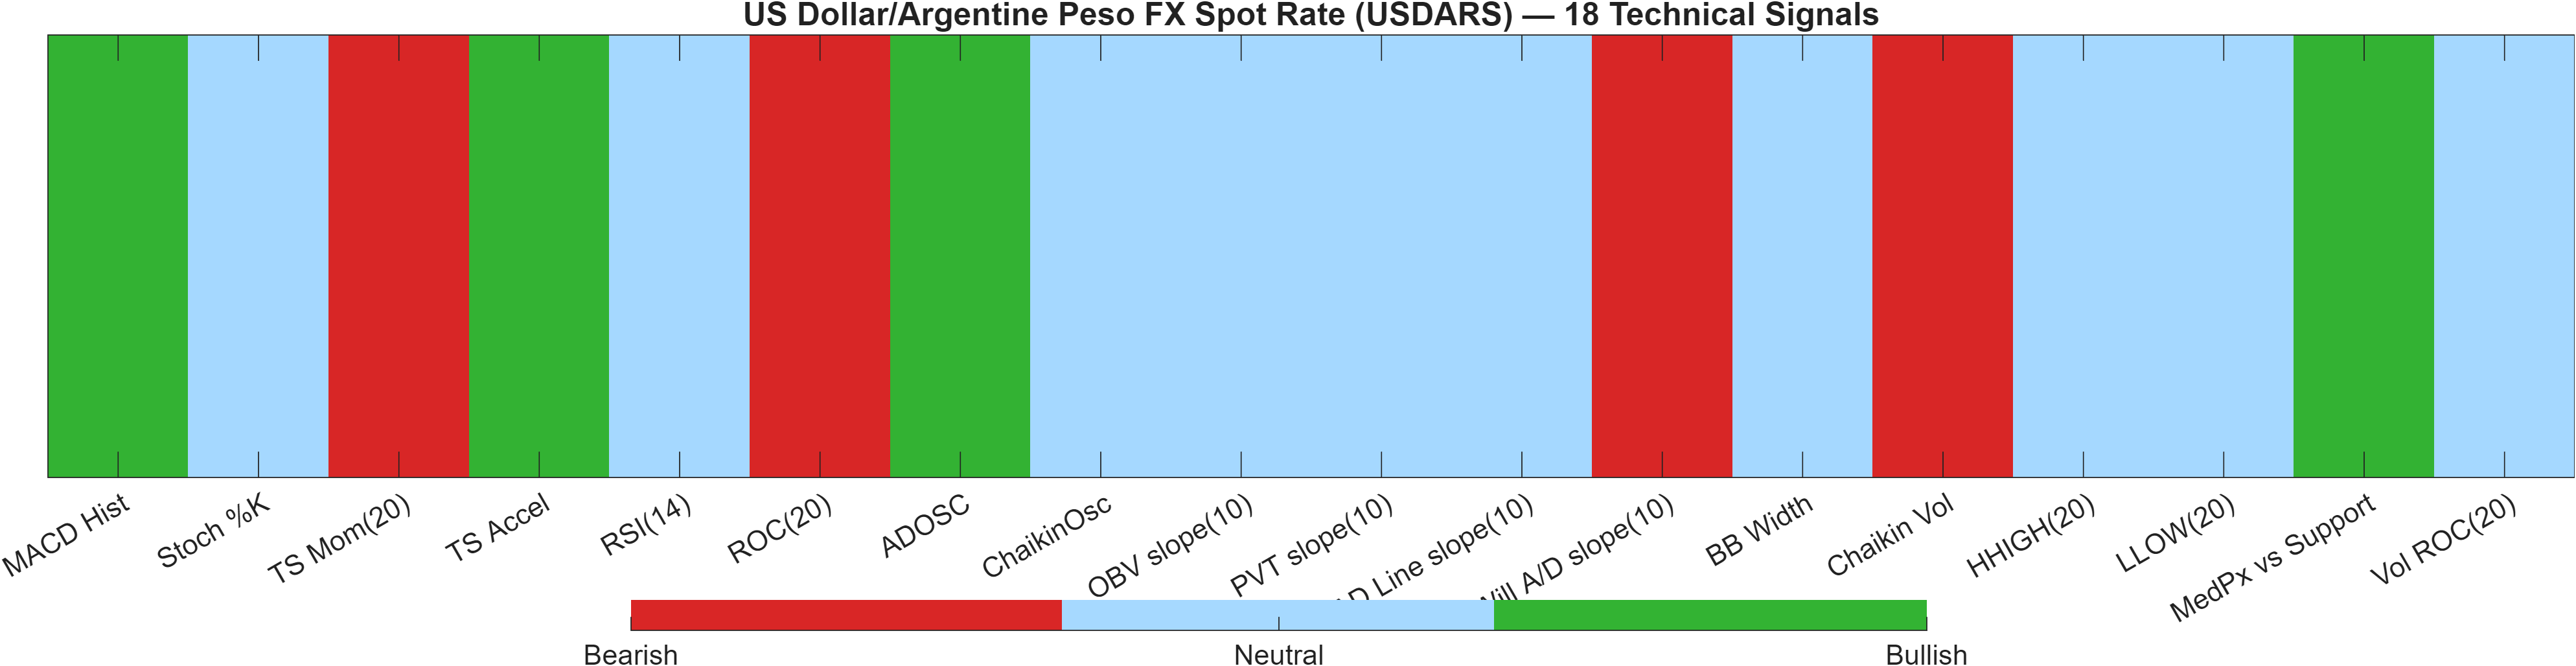
Signal balance: neutral confluence with a bearish model overlay
The 18-signal layer resolves to Neutral (confluence score 0.000), reflecting that signals are broadly distributed rather than clustered. The breakdown—Bull 4 / Bear 4 / Neutral 10—supports a “low-conviction” read where the market is not presenting a dominant technical narrative across independent inputs (momentum, volatility, breadth, and level-based measures).
Where the interpretation becomes more nuanced is the reinforcement-learning technical rank: #868 out of 958, labeled Bearish with a score of -0.812. That rank sits deep in the weaker portion of its universe and can be read as an anti-confirmation to the longer-horizon KGNAI ranks. The blended outcome—overall technical score -0.244 (Neutral)—essentially states that the multi-indicator snapshot is not sufficiently negative to confirm the bearish model rank, but also not sufficiently positive to override it.
Indicator highlights that shape the blend
| Indicator | Value | Signal |
|---|---|---|
| MACD Hist | 3.213 | Bullish |
| Stoch %K | 57.38 | Neutral |
| TS Mom(20) | -8 | Bearish |
| TS Accel | 17.25 | Bullish |
| RSI(14) | 48.17 | Neutral |
| ROC(20) | -0.5698 | Bearish |
| ADOSC | 40.91 | Bullish |
| ChaikinOsc | 0 | Neutral |
| OBV slope(10) | 0 | Neutral |
| PVT slope(10) | 0 | Neutral |
| AD Line slope(10) | 0 | Neutral |
| Will A/D slope(10) | -3.907 | Bearish |
| BB Width | 0.03365 | Neutral |
| Chaikin Vol | 103 | Bearish |
| HHIGH(20) | 1422 | Neutral |
| LLOW(20) | 1361 | Neutral |
| MedPx vs Support | 27.5 | Bullish |
| Vol ROC(20) | — | Neutral |
A few elements are doing the most work in shaping the neutral blend: RSI(14) at 48.17 (Neutral) points to a market without a strong overbought/oversold skew; MACD Hist at 3.213 (Bullish) provides constructive momentum; and Chaikin Vol at 103 (Bearish) alongside ROC(20) at -0.5698 (Bearish) restrains the upside case. The result is signal dispersion, which is consistent with level-dependent trading around the defined support and resistance bands.
6) News sentiment + extractive gist
Note: Instrument-specific news matches were not found, so the digest includes broader market/sector headlines. Links are provided for verification.
Sentiment score (avg): 0.186 | Positive: 44% | Neutral: 56% | Negative: 0%
KGNAI AI News Sentiment Score (normalized -1 to +1): 0.89 (as of 2025-08-03) | Label: Bullish | Overall news score: 0.67
Positive Developments
Recent coverage across major financial outlets indicates the prevailing tone is constructive on balance for broader markets, even as performance dispersion remains notable. The sentiment distribution shows 44% positive and 0% negative, with an average sentiment reading of 0.186, reinforcing that negative narratives are not dominating the current digest. In parallel, the normalized sentiment score of 0.89 (Bullish) suggests that, within KGNAI’s processing framework, language and framing skew toward risk stabilization rather than escalation. For USDARS specifically, this constructive bias matters most when paired with technical “trigger points”: a supportive news tone can coincide with successful tests of resistance and reduce the chance of immediate rejection, particularly in a low-volatility regime (bandwidth 0.0337) where incremental shifts in positioning can meaningfully affect follow-through. Overall, the news layer is not providing headwinds that would independently contradict the longer-horizon rank strength (6-Monthly #8, Yearly #9).
Neutral / Mixed Developments
The neutral share is the majority at 56%, which typically corresponds to a market environment where the information set is headline-active but directionally ambiguous. In this state, sentiment can remain bullish in aggregate while still failing to produce a clean price response—consistent with the current technical picture where the 18-signal confluence is 0.000 (Neutral) and the blended technical score is -0.244 (Neutral). For USDARS, that mix argues for prioritizing observable confirmation over narrative interpretation: whether price behavior respects 1379.5000 support, and whether it can sustain trade above 1470.2500 resistance. Neutral-heavy coverage also tends to coincide with tighter realized ranges, aligning with the subdued volatility signal (bandwidth 0.0337) and the absence of a strong RSI skew (RSI(14) 48.17).
Negative / Risk Signals
Even with 0% negative in the provided sentiment split, risk narratives are present at the thematic level and can still affect FX behavior through episodic volatility bursts. The key risk is event-driven regime change: geopolitical escalation, shifting risk appetite, or rapid re-pricing across rates and commodities can force transitions from compressed volatility (bandwidth 0.0337) into expansion, often without much warning. In those circumstances, the bearish moving-average structure (Close vs MA50 = Bearish; MA50 vs MA200 = Bearish) becomes more consequential because it can amplify downside persistence if support fails. From a monitoring standpoint, the technical invalidation condition remains clear: a close below 1379.5000 would increase the probability that negative catalysts are being expressed through price rather than remaining background noise. Until then, risk signals should be treated as contextual rather than determinative.
- What to monitor next: Reaction quality at 1470.2500 (acceptance vs rejection).
- What to monitor next: Whether volatility shifts from compression (bandwidth 0.0337) into expansion.
- What to monitor next: Any deterioration signal via a close below 1379.5000.
Sources referenced: Reuters, Bloomberg, Yahoo Finance, MarketWatch, Investing.com
Snapshot: AI Rank (Short–Mid–Long): Mixed (Neutral–Neutral–Bullish) · Technical Confluence: Neutral · Key Levels: Support ~1379.50 | Resistance ~1470.25 · News Sentiment: Positive
7) Sources
- Breaking: US and Israel attack Iran, risk aversion to sweep global markets — https://www.fxstreet.com/news/breaking-us-and-israel-attack-iran-risk-aversion-to-sweep-global-markets-202602280856
- Gold hits $5,260 as war jitters, trade tension rattle markets — https://www.fxstreet.com/news/gold-hits-5-260-as-war-jitters-trade-tension-rattle-markets-202602272103
- Week Ahead: US Dollar slips on trade uncertainty as NFP, Eurozone HICP loom — https://www.fxstreet.com/news/week-ahead-us-dollar-slips-on-trade-uncertainty-as-nfp-eurozone-hicp-loom-202602272051
- Taiwan: Data to confirm strong upswing – DBS — https://www.fxstreet.com/news/taiwan-data-to-confirm-strong-upswing-dbs-202602272004
- DXY slips as hot PPI stokes stagflation fears — https://www.fxstreet.com/news/dxy-slips-as-hot-ppi-stokes-stagflation-fears-202602271924
- India: Weak growth impulse and fiscal risks – Societe Generale — https://www.fxstreet.com/news/india-weak-growth-impulse-and-fiscal-risks-societe-generale-202602271852
- GBP/USD slips as US PPI lifts US Dollar, Middle East risks rise — https://www.fxstreet.com/news/gbp-usd-slips-as-us-ppi-lifts-usd-mid-east-risks-rise-202602271845
- AUD/USD holds firm as US Dollar retreats despite firm PPI — https://www.fxstreet.com/news/aud-usd-holds-firm-as-us-dollar-retreats-despite-firm-ppi-202602271828
You may also like: How KGNAI AI ranks instruments across global markets
Disclaimer: KGNAI provides AI-generated analytics and educational market commentary only. This is not financial advice. Markets involve risk. Always do your own research.