
GBPCNY (UK Pound Sterling/Chinese Renminbi) — 20-Mar-2026 Neutral stance with mixed technical alignment
GBPCNY currently sits in a neutral, cross-signal regime: short-horizon ranking strength contrasts with softer multi-horizon positioning, while price/MA structure and momentum indicators do not fully agree on direction. Within KGNAI’s 957-instrument FX universe, the daily rank (#74) is relatively constructive versus the more mid-to-long horizon ranks that remain neutral and less differentiated. On the technical side, the 18-signal confluence reads 0.167 (Neutral), yet the Deep Reinforcement Learning technical rank is #914 (Bearish), creating a measurable divergence between indicator-level conditions and broader technical positioning. Momentum is not extended (RSI(14) 52.14), MACD histogram is marginally positive (0.0003), and Bollinger Bandwidth remains compressed (0.0175), a backdrop that often demands confirmation from a clean break of key levels. Support and resistance are defined near 9.1233 and 9.5576, respectively, framing the near-term decision zone.
Key Takeaways
- Rank stance (Short/Mid/Long): Neutral / Neutral / Neutral (daily rank strength vs neutral longer-horizon ranks).
- Technical confluence label: Neutral (18-signal confluence 0.167; blended score -0.156 remains Neutral).
- Key levels: Support ~ 9.1233 | Resistance ~ 9.5576.
- News sentiment bias: Neutral (avg 0.114; 37% positive, 63% neutral, 0% negative).
- Confirmation / invalidation: A sustained hold above resistance supports continuation framing; a close below support increases deterioration risk per the stated scenario logic.
What KGNAI Measures
KGNAI evaluates assets using large cross-sectional datasets built from millions of structured data points. Inputs incorporate fundamental metrics, technical structures, and systematically processed news sentiment. Statistical models, machine learning, and AI frameworks are used to assess relative positioning, signal alignment, and probabilistic behavior across broad universes.
How to Read This Report
- Ranks are comparative across the tracked universe, not absolute price targets.
- Confluence reflects alignment among independent signal groups.
- Support/resistance levels are probabilistic decision zones, not guarantees.
- Sentiment provides contextual bias within the broader analytical framework.
1) KGNAI AI Analysis
- Daily rank: #74 out of 957 — Bullish
- Weekly rank: #336 out of 957 — Neutral
- Monthly rank: #735 out of 957 — Neutral
- 3-Monthly rank: #395 out of 957 — Neutral
- 6-Monthly rank: #565 out of 957 — Neutral
- Yearly rank: #404 out of 957 — Neutral
Cross-horizon alignment: short-term lift, longer-horizon neutrality
The rank profile is asymmetric across time. The daily rank (#74) places GBPCNY in the upper slice of the universe (constructive near-term behavior), while the monthly rank (#735) sits in the lower third, signaling that longer-window behavior has not confirmed persistent strength. The weekly and yearly ranks (#336 and #404) remain neutral, reinforcing a “range-to-transition” read rather than a clean trend designation. This configuration typically corresponds to either (a) an early-stage improvement that still requires follow-through, or (b) short-term mean reversion inside a broader neutral structure.
KGNAI’s stated term view remains Neutral across short-, mid-, and long-term horizons, which is consistent with a market where relative positioning is improving at the margin without broad confirmation. When daily rank strength appears alongside neutral-to-weaker longer horizons, the practical implication is that signal persistence becomes the key variable: the daily impulse must translate into weekly/monthly improvement to reduce uncertainty.
Interpretive takeaway: the model is not expressing a one-directional consensus. Instead, it is highlighting a timing mismatch between near-term rank strength and longer-horizon neutrality that often coincides with tighter decision levels and higher dependence on confirmation from price structure and volatility expansion.
2) Price & trend overview
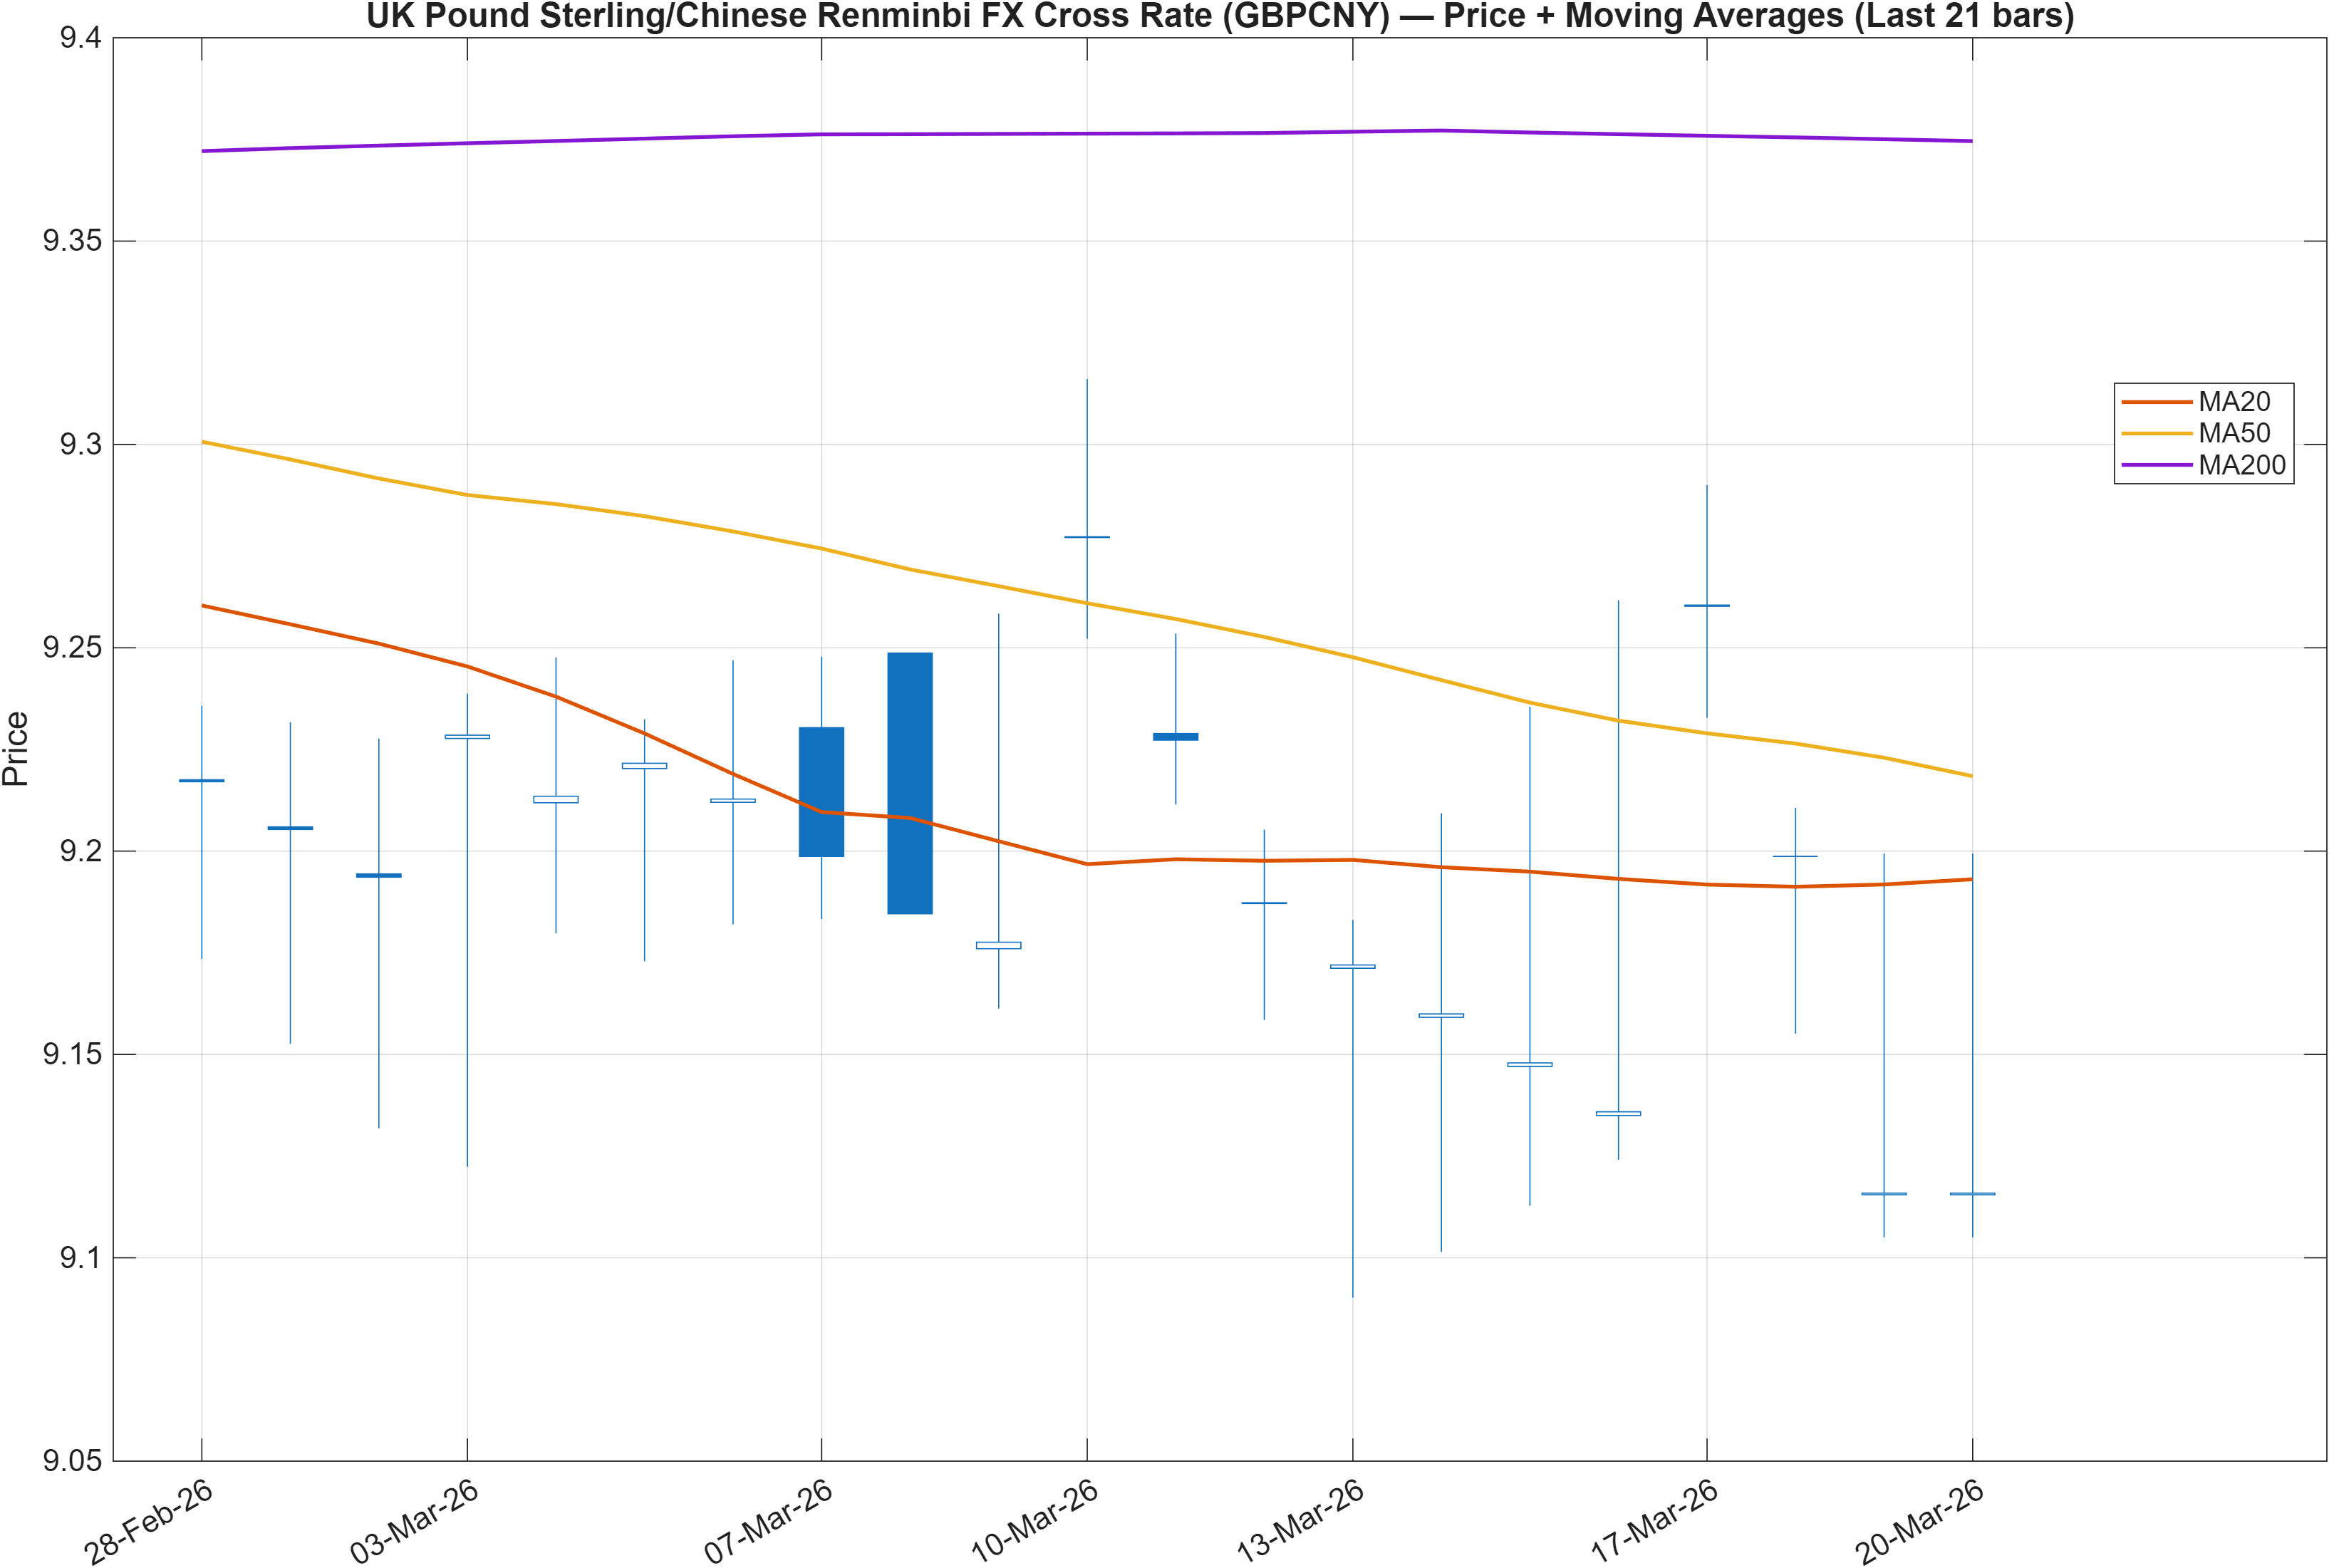
Interpretation: Close vs MA50 = Bullish, MA50 vs MA200 = Bearish.
Regime read: near-term improvement inside a less supportive long trend filter
The moving-average logic embedded in the chart interpretation is split: the close is bullish versus the MA50, but the MA50 remains bearish versus the MA200. This configuration often describes a market where shorter-term recovery is present while the longer-term trend filter has not flipped—an environment that can support tactical rebounds but is more prone to stall near resistance if follow-through is limited.
This split aligns with the rank horizon mismatch: the daily rank (#74) can improve quickly alongside a close reclaiming a faster average, while longer horizons (for example, the monthly rank #735) may lag until the underlying structure matures. From a market-structure perspective, the key question is whether the price can continue to hold above the faster average while volatility and participation measures (seen in the dashboard) begin to confirm.
The trend filter also matters for risk symmetry. When MA50 is still below MA200 (bearish cross-condition), upside attempts can require cleaner momentum confirmation (e.g., sustained positive MACD histogram) and a decisive break above the defined resistance. Conversely, failure to maintain the bullish close-versus-MA50 relationship can quickly revert the setup back into a neutral-to-soft range.
Interpretive takeaway: GBPCNY is behaving like a market in transition rather than trend dominance, where breakouts tend to be more reliable only after the longer trend filter begins to converge.
3) Momentum & volatility dashboard
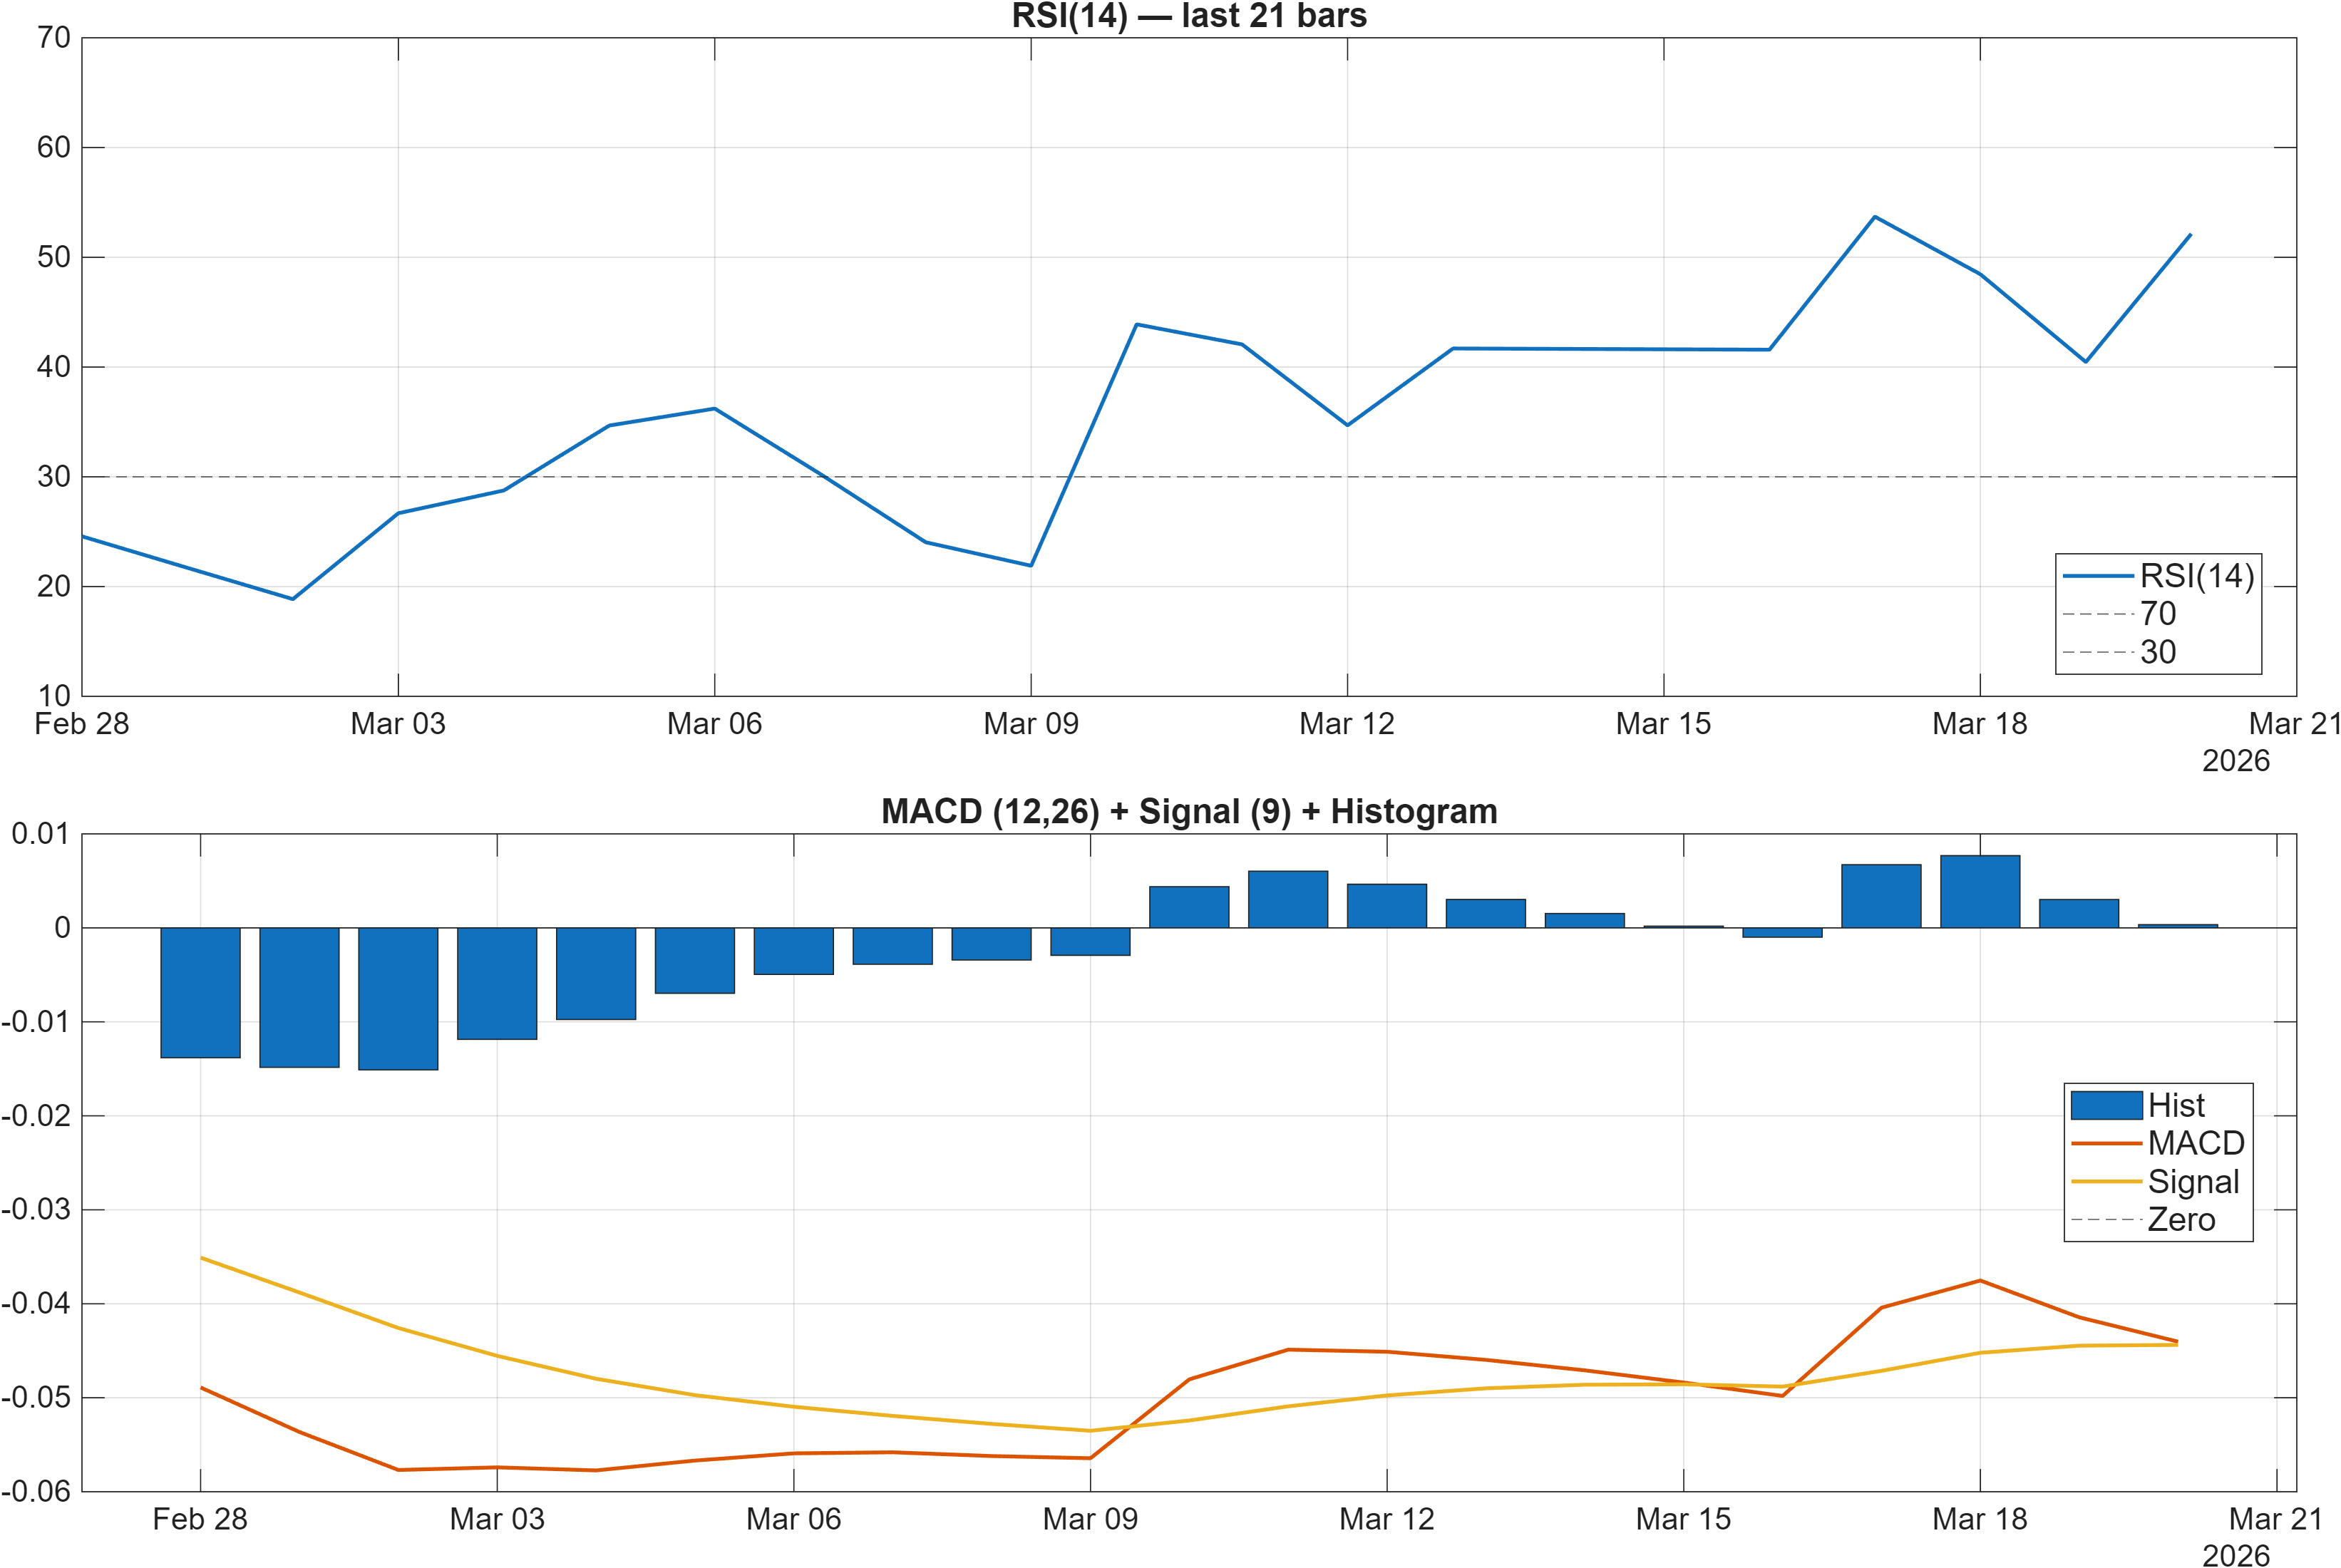
Interpretation: RSI bias = Neutral, MACD hist = 0.0003.
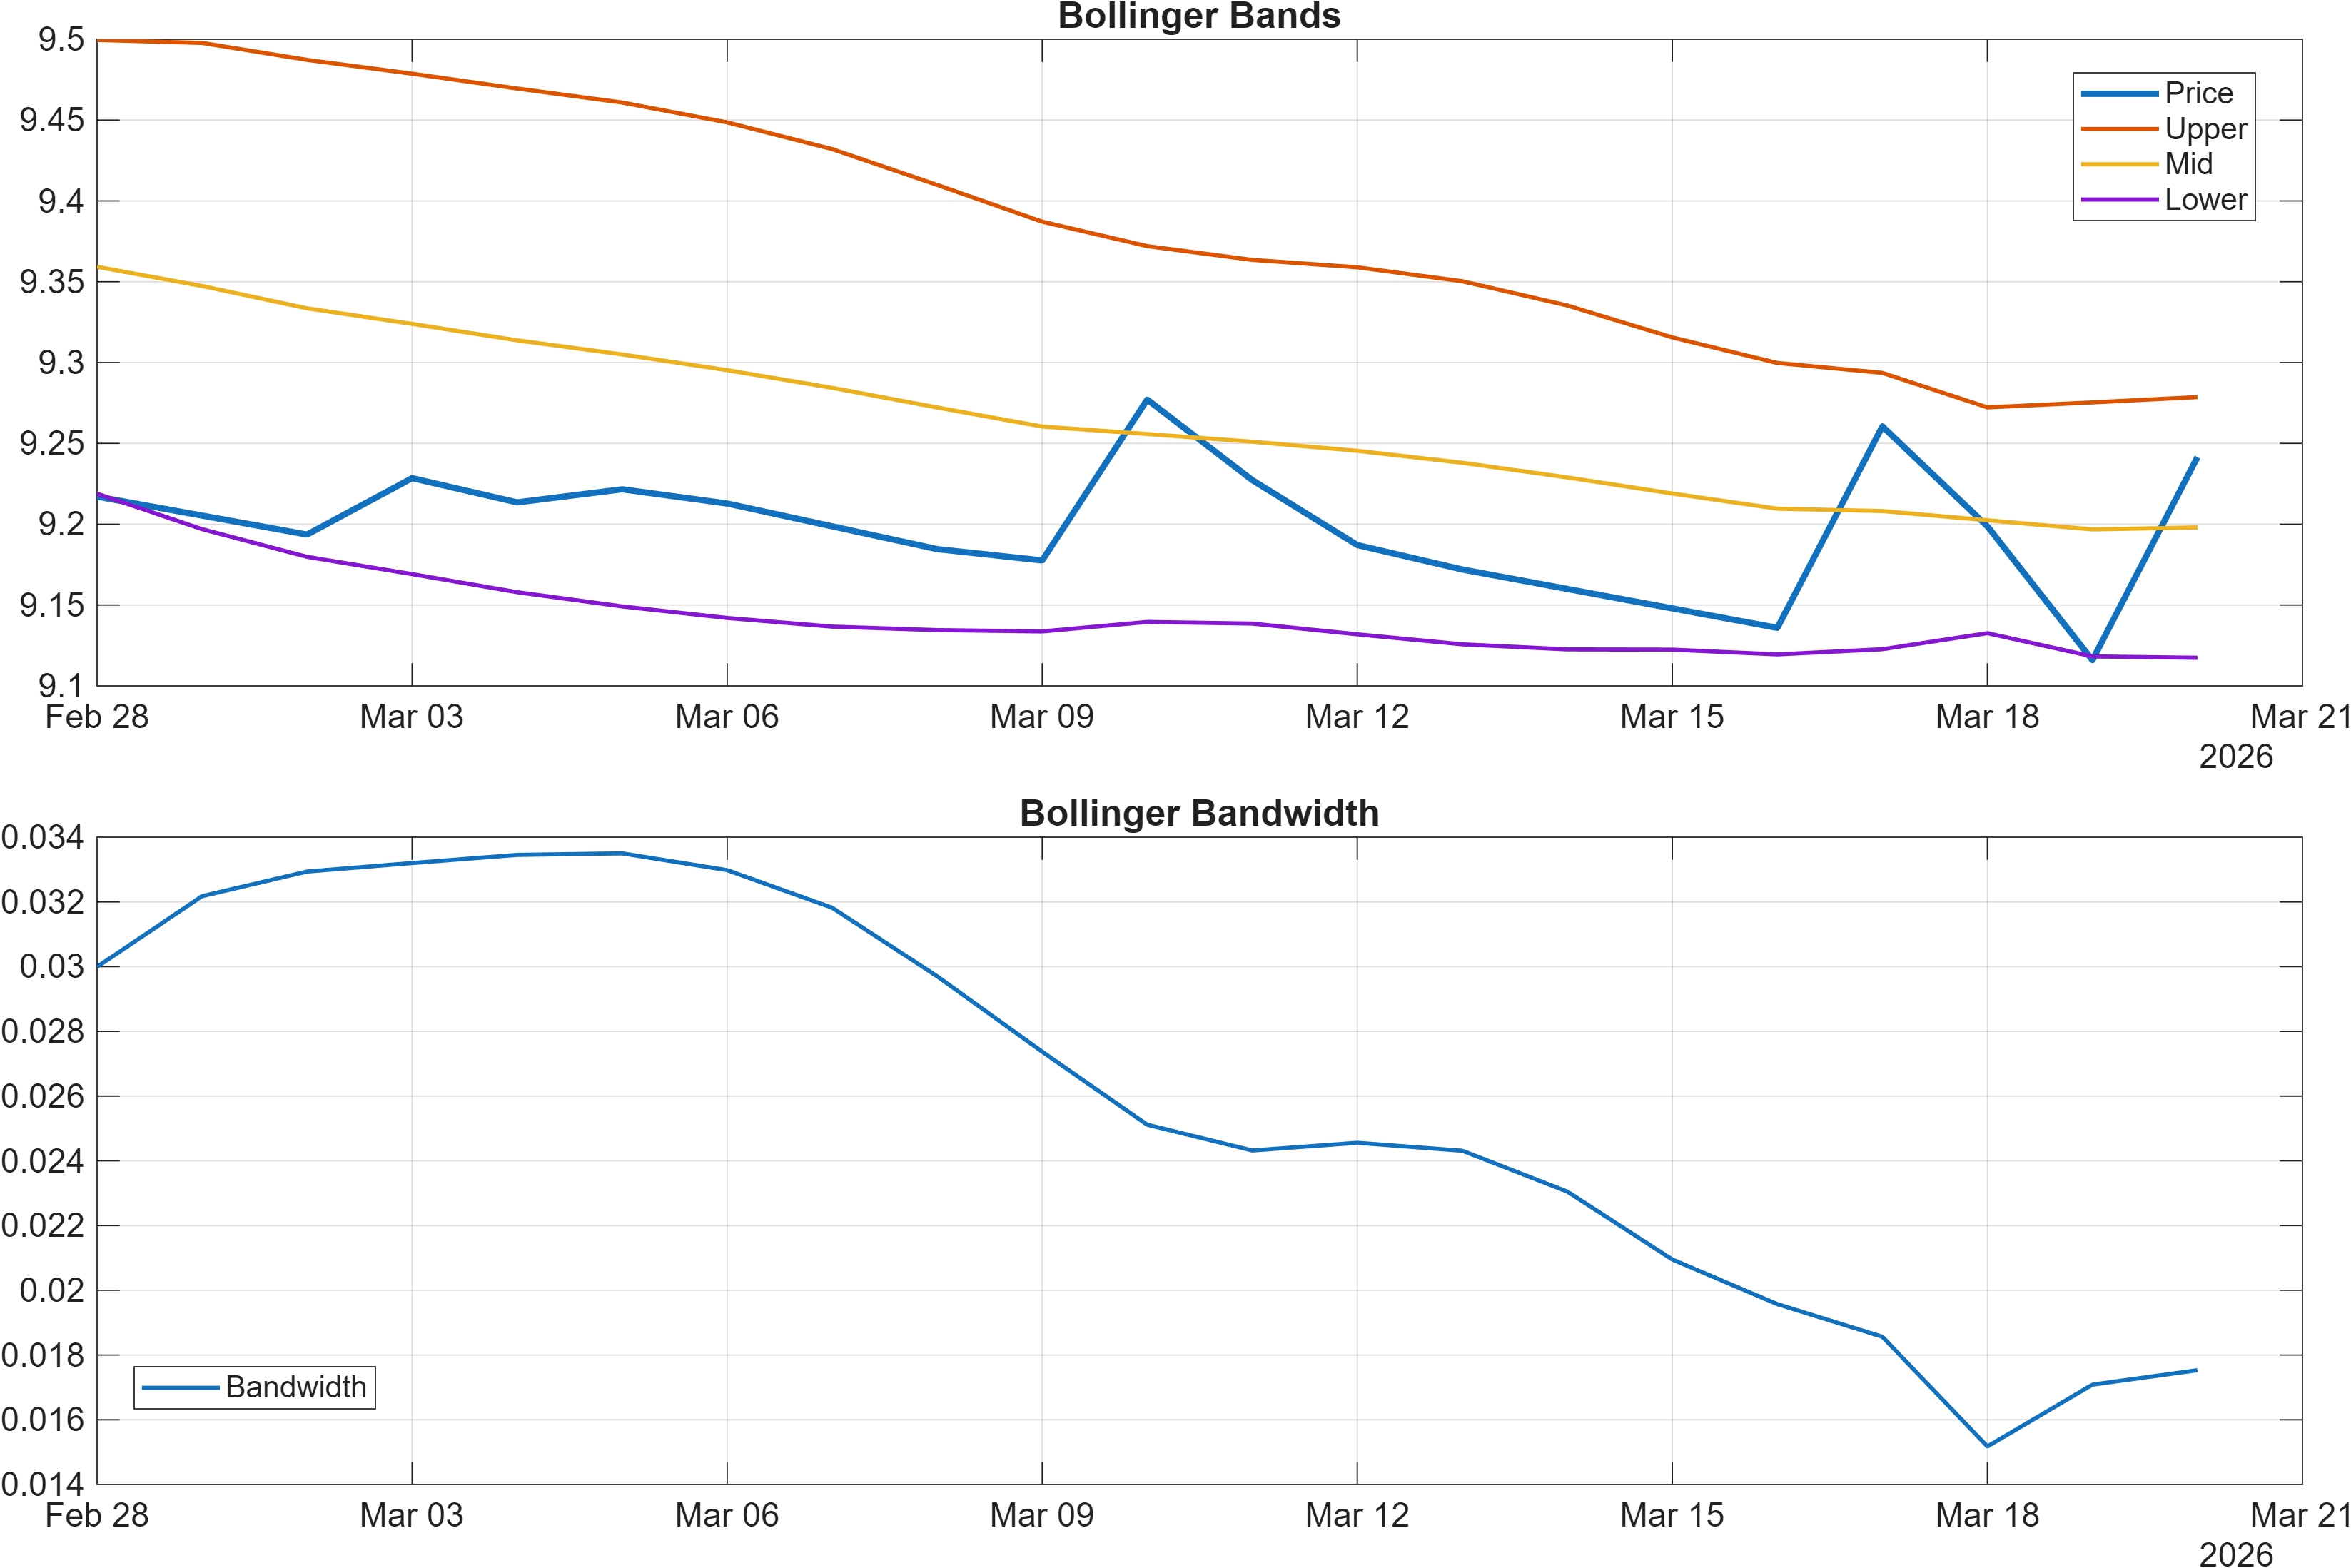
Interpretation: Bandwidth (volatility regime) latest = 0.0175.
Momentum neutrality with early positive impulses
Momentum indicators cluster near neutral, which reduces the probability that the market is currently extended. RSI(14) at 52.14 sits close to the midline, consistent with balance rather than trend pressure. At the same time, the MACD histogram shows a small positive reading (0.0003), suggesting modest incremental improvement rather than a fully developed momentum regime.
In the broader 18-signal set, the Stoch %K at 12.86 is tagged bullish, which can occur when price begins to lift off a lower band/oversold region; however, that signal is counterweighted by TS Mom(20) at -0.08943 (bearish), reflecting that the medium lookback momentum measure has not fully turned. This combination is typical of a market attempting to rotate upward while still carrying residual drag from prior price behavior.
Volatility compression: information is “stored,” direction is not
Bollinger Bandwidth at 0.0175 indicates a relatively compressed volatility state. Compression can precede expansion, but it does not specify direction; the operational consequence is that level-based confirmation (support/resistance and trend filters) becomes more important than interpreting any single oscillator in isolation.
4) Support / Resistance zones
Support ~ 9.1233 | Resistance ~ 9.5576
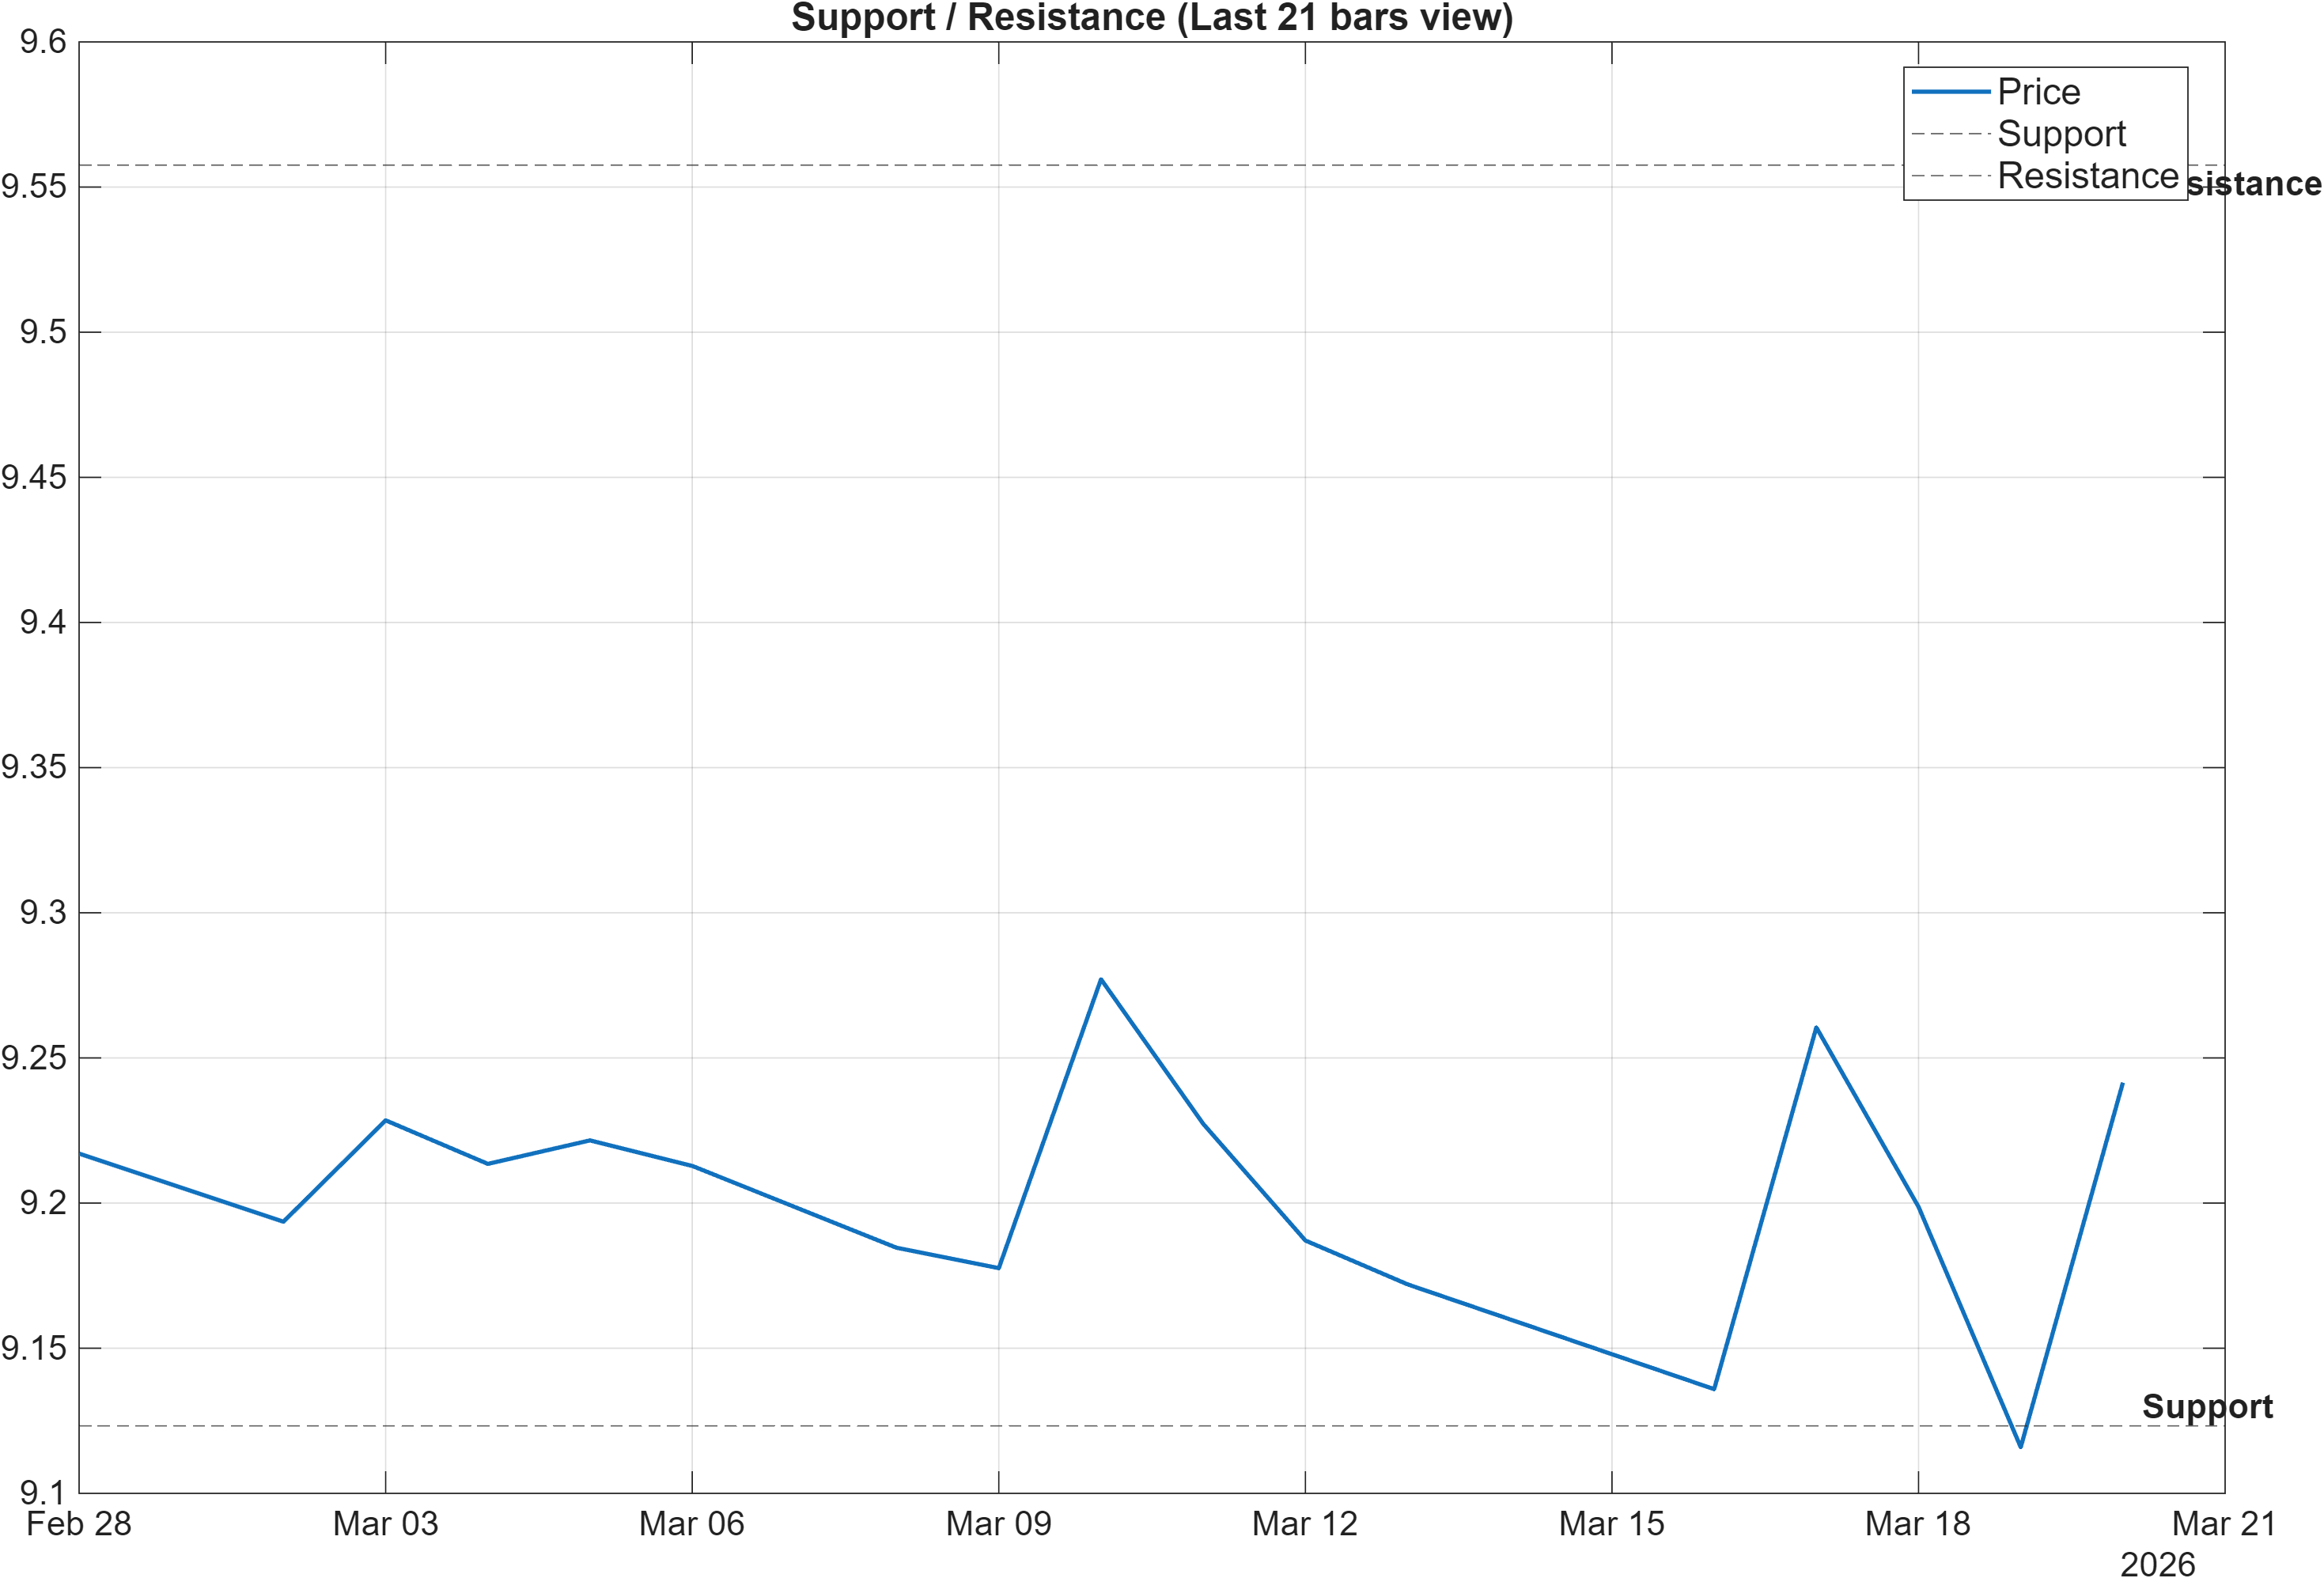
Scenario view: Break above resistance with volume → continuation. Close below support → signal deterioration risk.
Decision geometry: level discipline in a compressed regime
With volatility compressed (Bandwidth 0.0175) and momentum near equilibrium (RSI(14) 52.14), the 9.1233–9.5576 band effectively defines the active decision space. In such regimes, price can oscillate repeatedly without producing durable trend signals; therefore, the reliability of technical interpretation often increases only when price behavior separates from the range.
A constructive read requires more than touching resistance: the stated scenario emphasizes a break above 9.5576 with volume as the continuation condition. While volume specifics are not quantified here, the framework implies that a breakout should be accompanied by measurable participation to reduce false-break probability—especially relevant given the bearish longer-term trend filter (MA50 vs MA200 = bearish).
On the downside, a close below 9.1233 is treated as deterioration risk. This matters because several participation/flow proxies inside the 18-signal dashboard are neutral at present (multiple “0” slope readings), which can coincide with fragile break attempts if conviction remains muted. In other words, support is not just a price level; it is a regime boundary that separates “range stability” from “structure damage.”
Interpretive takeaway: given neutral confluence and compressed volatility, the highest-quality information is likely to come from how price behaves at (and beyond) 9.5576 and 9.1233 rather than from incremental oscillator fluctuations.
5) Quant Technical Dashboard (18 Signals)
KGNAI AI Technical Analysis Score (Deep Reinforcement Learning): Rank #914 out of 957 (Rank 1 represents the strongest technical positioning and a higher probability of favorable price behavior. As ranks increase toward the maximum, the probability of favorable outcomes weakens and bearish positioning becomes more dominant.) | Label: Bearish | Score: -0.910
18-Signal Technical Confluence Score: 0.167 (Neutral)
Overall Technical Score (18-signal confluence + DRL rank blend): -0.156 (Neutral)
Note: The blended score reflects signal strength weighted against broader AI technical ranking, which may temporarily diverge.
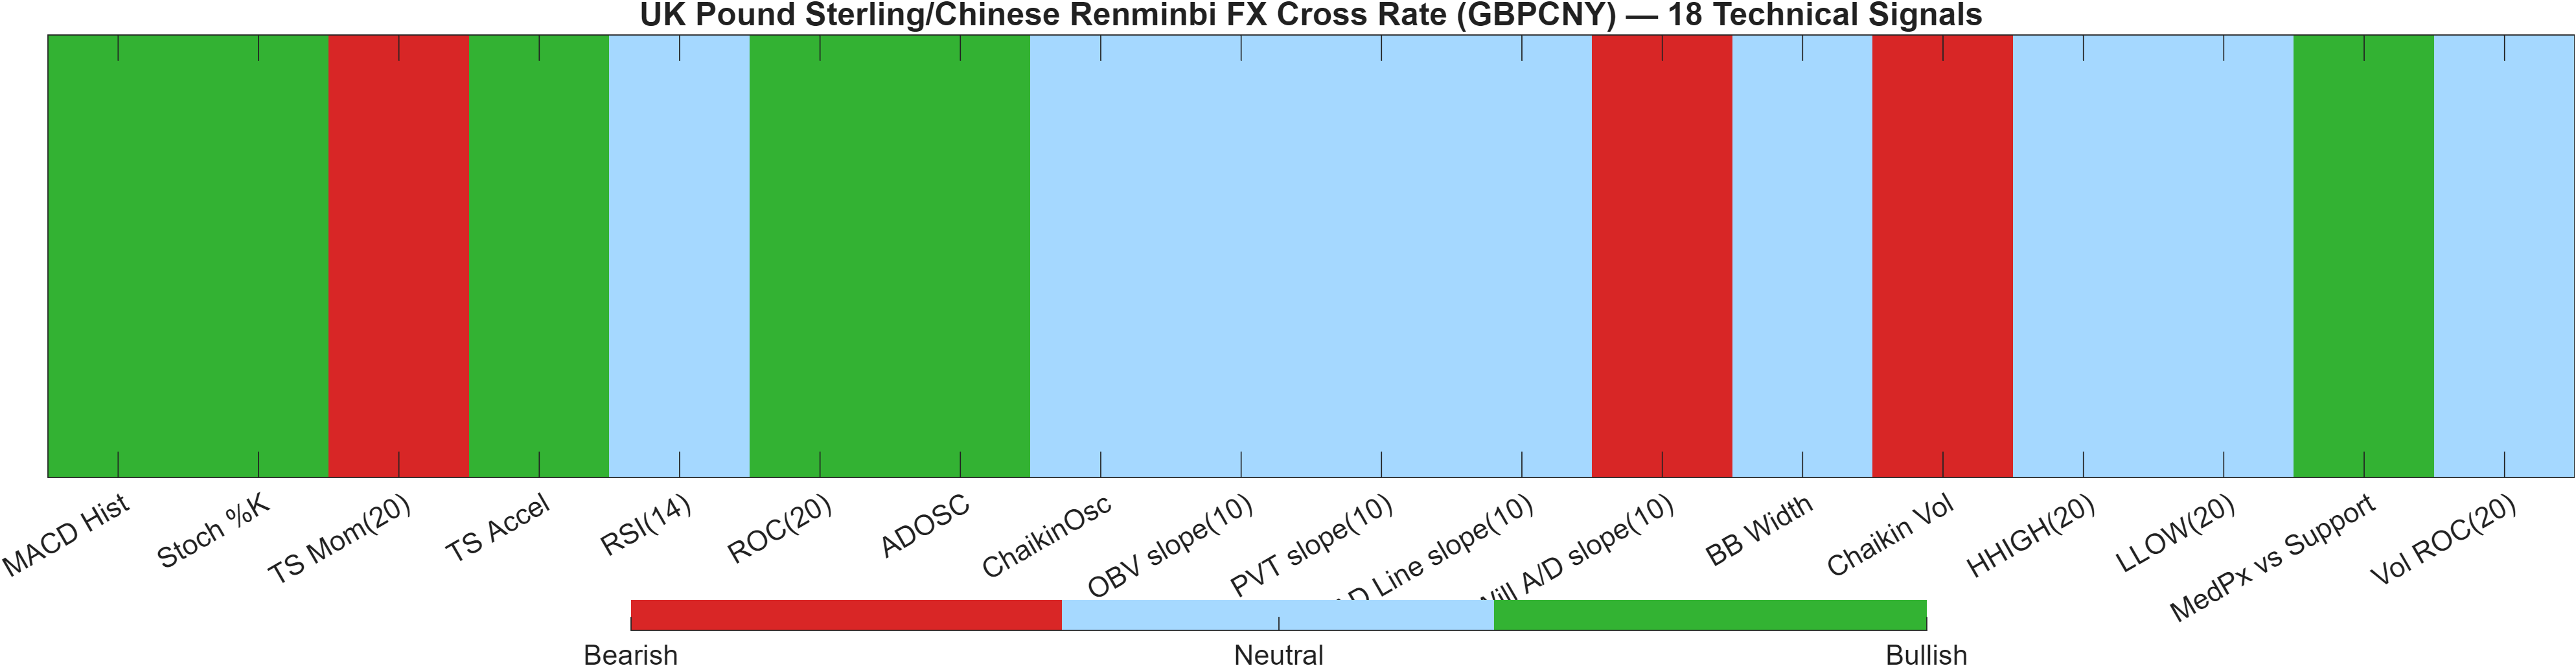
Blended technical score breakdown: -0.156 (Neutral | Bull 6 / Bear 3 / Neutral 9)
Confluence vs AI technical rank: a structured divergence
The dashboard highlights a meaningful internal tension: the 18-signal confluence is Neutral (0.167), yet the AI technical rank is #914 with a Bearish label and score -0.910. When these disagree, the typical interpretation is not “one is wrong,” but that the higher-order model is detecting pattern risk not fully captured by the indicator vote—often associated with regime dependence, trend persistence filters, or feature interactions across timeframes.
Within the indicator set, there are credible constructive elements—MACD histogram is 0.0003387 (bullish) and Stoch %K at 12.86 is also bullish—yet there are counterweights such as TS Mom(20) at -0.08943 (bearish) and a bearish reading in Chaikin Vol at 29.83. The blend result (-0.156) remains neutral because the signal mix is still dominated by neutrality (Neutral 9) despite Bull 6.
Participation signals: neutrality can be a risk factor in break attempts
A notable feature is the clustering of “flat” participation slopes (several entries at 0 flagged neutral), which tends to coincide with lower conviction conditions. In practice, this can increase sensitivity to the defined support/resistance boundaries (support 9.1233, resistance 9.5576), because breakouts without participation confirmation have a higher propensity to revert.
Signal table (Bull/Bear/Neutral)
| Indicator | Value | Signal |
|---|---|---|
| MACD Hist | 0.0003387 | Bullish |
| Stoch %K | 12.86 | Bullish |
| TS Mom(20) | -0.08943 | Bearish |
| TS Accel | 0.1751 | Bullish |
| RSI(14) | 52.14 | Neutral |
| ROC(20) | 0.3929 | Bullish |
| ADOSC | 50.21 | Bullish |
| ChaikinOsc | 0 | Neutral |
| OBV slope(10) | 0 | Neutral |
| PVT slope(10) | 0 | Neutral |
| AD Line slope(10) | 0 | Neutral |
| Will A/D slope(10) | -0.3885 | Bearish |
| BB Width | 0.01753 | Neutral |
| Chaikin Vol | 29.83 | Bearish |
| HHIGH(20) | 9.316 | Neutral |
| LLOW(20) | 9.09 | Neutral |
| MedPx vs Support | 0.02895 | Bullish |
| Vol ROC(20) | — | Neutral |
Interpretation: Indicator-level signals form the base confluence, which is then adjusted using a separate AI-driven technical ranking model. The final technical score summarizes this combined view.
6) News sentiment + extractive gist
Positive Developments
Recent coverage across major financial outlets indicates a modestly constructive backdrop for GBP-related FX pricing where central-bank signaling remains a primary driver. Commentary included a policy tone interpreted as more restrictive than expected, which can support near-term GBP stability in crosses even when broader risk conditions are mixed. In the provided sentiment breakdown, positive items represent 37% of the set and the average sentiment score is 0.114, which aligns with a mild positive skew rather than a strongly directional macro impulse. There is also a recurring theme that structural investment cycles (referenced in broader trade and technology discussion) can partially offset growth headwinds, helping keep risk appetite from collapsing outright. For GBPCNY specifically, this type of environment often translates into range persistence until a clearer volatility expansion arrives, consistent with the neutral technical confluence and compressed Bollinger regime shown elsewhere in the report.
Neutral / Mixed Developments
A second set of themes was primarily informational and meeting-driven, emphasizing that major central banks are not committing to deterministic rate paths and remain data-dependent. This is typically “neutral” for directional FX trades because it can keep front-end rate expectations fluid without creating a decisive trend catalyst. That aligns with the provided distribution showing 63% neutral items and no explicit negative share in the sentiment tally. For a cross like GBPCNY, mixed messaging can keep realized volatility contained—consistent with the Bandwidth reading of 0.0175—while price reacts more to tactical repricing than to a sustained narrative shift. In such conditions, support/resistance behavior tends to dominate: markets often oscillate within defined zones until policy clarity forces positioning to reprice.
Negative / Risk Signals
Although the provided sentiment table reports 0% negative items, risk signals are still present in the gist through uncertainty-related framing—particularly around geopolitical and energy-disruption narratives and the associated potential for tighter financial conditions. These themes may not register as “negative” in a simple classification sense, but they can still contribute to episodic risk-off reactions that matter for FX crosses. For GBPCNY, the practical risk is that a compressed-volatility market can reprice quickly if a shock lifts implied volatility; that is where the technical levels (support 9.1233) become critical. If risk events translate into broader USD/CNH sensitivity or liquidity tightening, FX crosses can experience sharper intraday swings even without an extended trend.
- Whether sentiment remains mildly positive (avg 0.114) or shifts toward a more asymmetric distribution.
- Any volatility pickup that breaks the compressed regime (Bandwidth 0.0175) alongside a move through 9.5576 or 9.1233.
- Policy communication that meaningfully changes rate-path expectations and reduces the current “meeting-by-meeting” ambiguity.
Sources referenced: Reuters, Bloomberg, Yahoo Finance, MarketWatch, Investing.com
7) Sources
Not available in the provided data.
Snapshot: AI Rank (Short–Mid–Long): Neutral (Neutral–Neutral–Neutral) · Technical Confluence: Neutral · Key Levels: Support ~9.12 | Resistance ~9.56 · News Sentiment: Neutral
You may also like: How KGNAI AI ranks instruments across global markets
Disclaimer: KGNAI provides AI-generated analytics and educational market commentary only. This is not financial advice. Markets involve risk. Always do your own research.