
USDEGP — US Dollar/Egyptian Pound FX Spot Rate (USDEGP) on 22-Mar-2026: Mid-term strength within a flat near-term structure
USDEGP is currently characterized by a mixed horizon profile: short-term ranks sit closer to the middle of the tracked universe while multiple mid-term windows remain in the upper tier of KGNAI’s cross-sectional ranking system. Price structure is supported by a moving-average configuration flagged as bullish, yet momentum confirmation is incomplete, with RSI(14) near 50.53 and a negative MACD histogram (-0.1062). Volatility is also contained, with Bollinger Bandwidth at 0.0853, a regime that often coincides with range persistence until a catalyst forces expansion. Key decision zones remain well-defined: support ~46.6995 and resistance ~52.4450. News analytics lean slightly constructive by model label, but overall distribution remains dominated by neutral coverage, suggesting sentiment is more contextual than directional for this pair at present.
- Rank stance: Short-term Neutral | Mid-term Bullish | Long-term Neutral
- Technical confluence: Neutral (18-signal confluence 0.278; blended overall 0.158)
- Key levels: Support ~46.6995 | Resistance ~52.4450
- News sentiment bias: Slightly constructive by label (0.19, Bullish) with largely neutral coverage (Neutral 69%)
- Confirmation / invalidation: A sustained break above 52.4450 supports continuation risk-on positioning; a close below 46.6995 increases deterioration risk per the scenario framework.
KGNAI evaluates assets using large cross-sectional datasets built from millions of structured data points. Inputs incorporate fundamental metrics, technical structures, and systematically processed news sentiment. Statistical models, machine learning, and AI frameworks are used to assess relative positioning, signal alignment, and probabilistic behavior across broad universes.
- Ranks are comparative across the tracked universe, not absolute price targets.
- Confluence reflects alignment among independent signal groups.
- Support/resistance levels are probabilistic decision zones, not guarantees.
- Sentiment provides contextual bias within the broader analytical framework.
1) KGNAI AI Analysis
Region: FOREX
Total universe size: 964 ranked instruments
- Daily rank: #313 out of 964 — Neutral
- Weekly rank: #18 out of 964 — Bullish
- Monthly rank: #23 out of 964 — Bullish
- 3-Monthly rank: #89 out of 964 — Bullish
- 6-Monthly rank: #13 out of 964 — Bullish
- Yearly rank: #297 out of 964 — Neutral
Cross-horizon positioning: mid-term leadership vs short-term neutrality
USDEGP’s rank stack is notable for its timeframe asymmetry. The weekly rank (#18) and monthly rank (#23) place the pair in the upper tier of the 964-instrument universe, reinforced further by a 6-month rank (#13). That cluster typically indicates favorable statistical behavior relative to peers over intermediate windows, even if the spot market appears quiet.
In contrast, the daily rank (#313) and yearly rank (#297) sit closer to the middle of the distribution, aligning with a more Neutral short/long lens. The result is a profile consistent with range containment or slow drift: mid-term signals are constructive, but the near-term tape is not delivering clean trend acceleration.
This is also reflected in the explicit term view: Short-term Neutral, Mid-term Bullish, Long-term Neutral. For institutional readers, that combination often behaves like a “carry/structure-first” environment where confirmation is sought from volatility expansion and decisive level breaks rather than from ranks alone.
Want the full universe and complete rank tables?
2) Price & trend overview
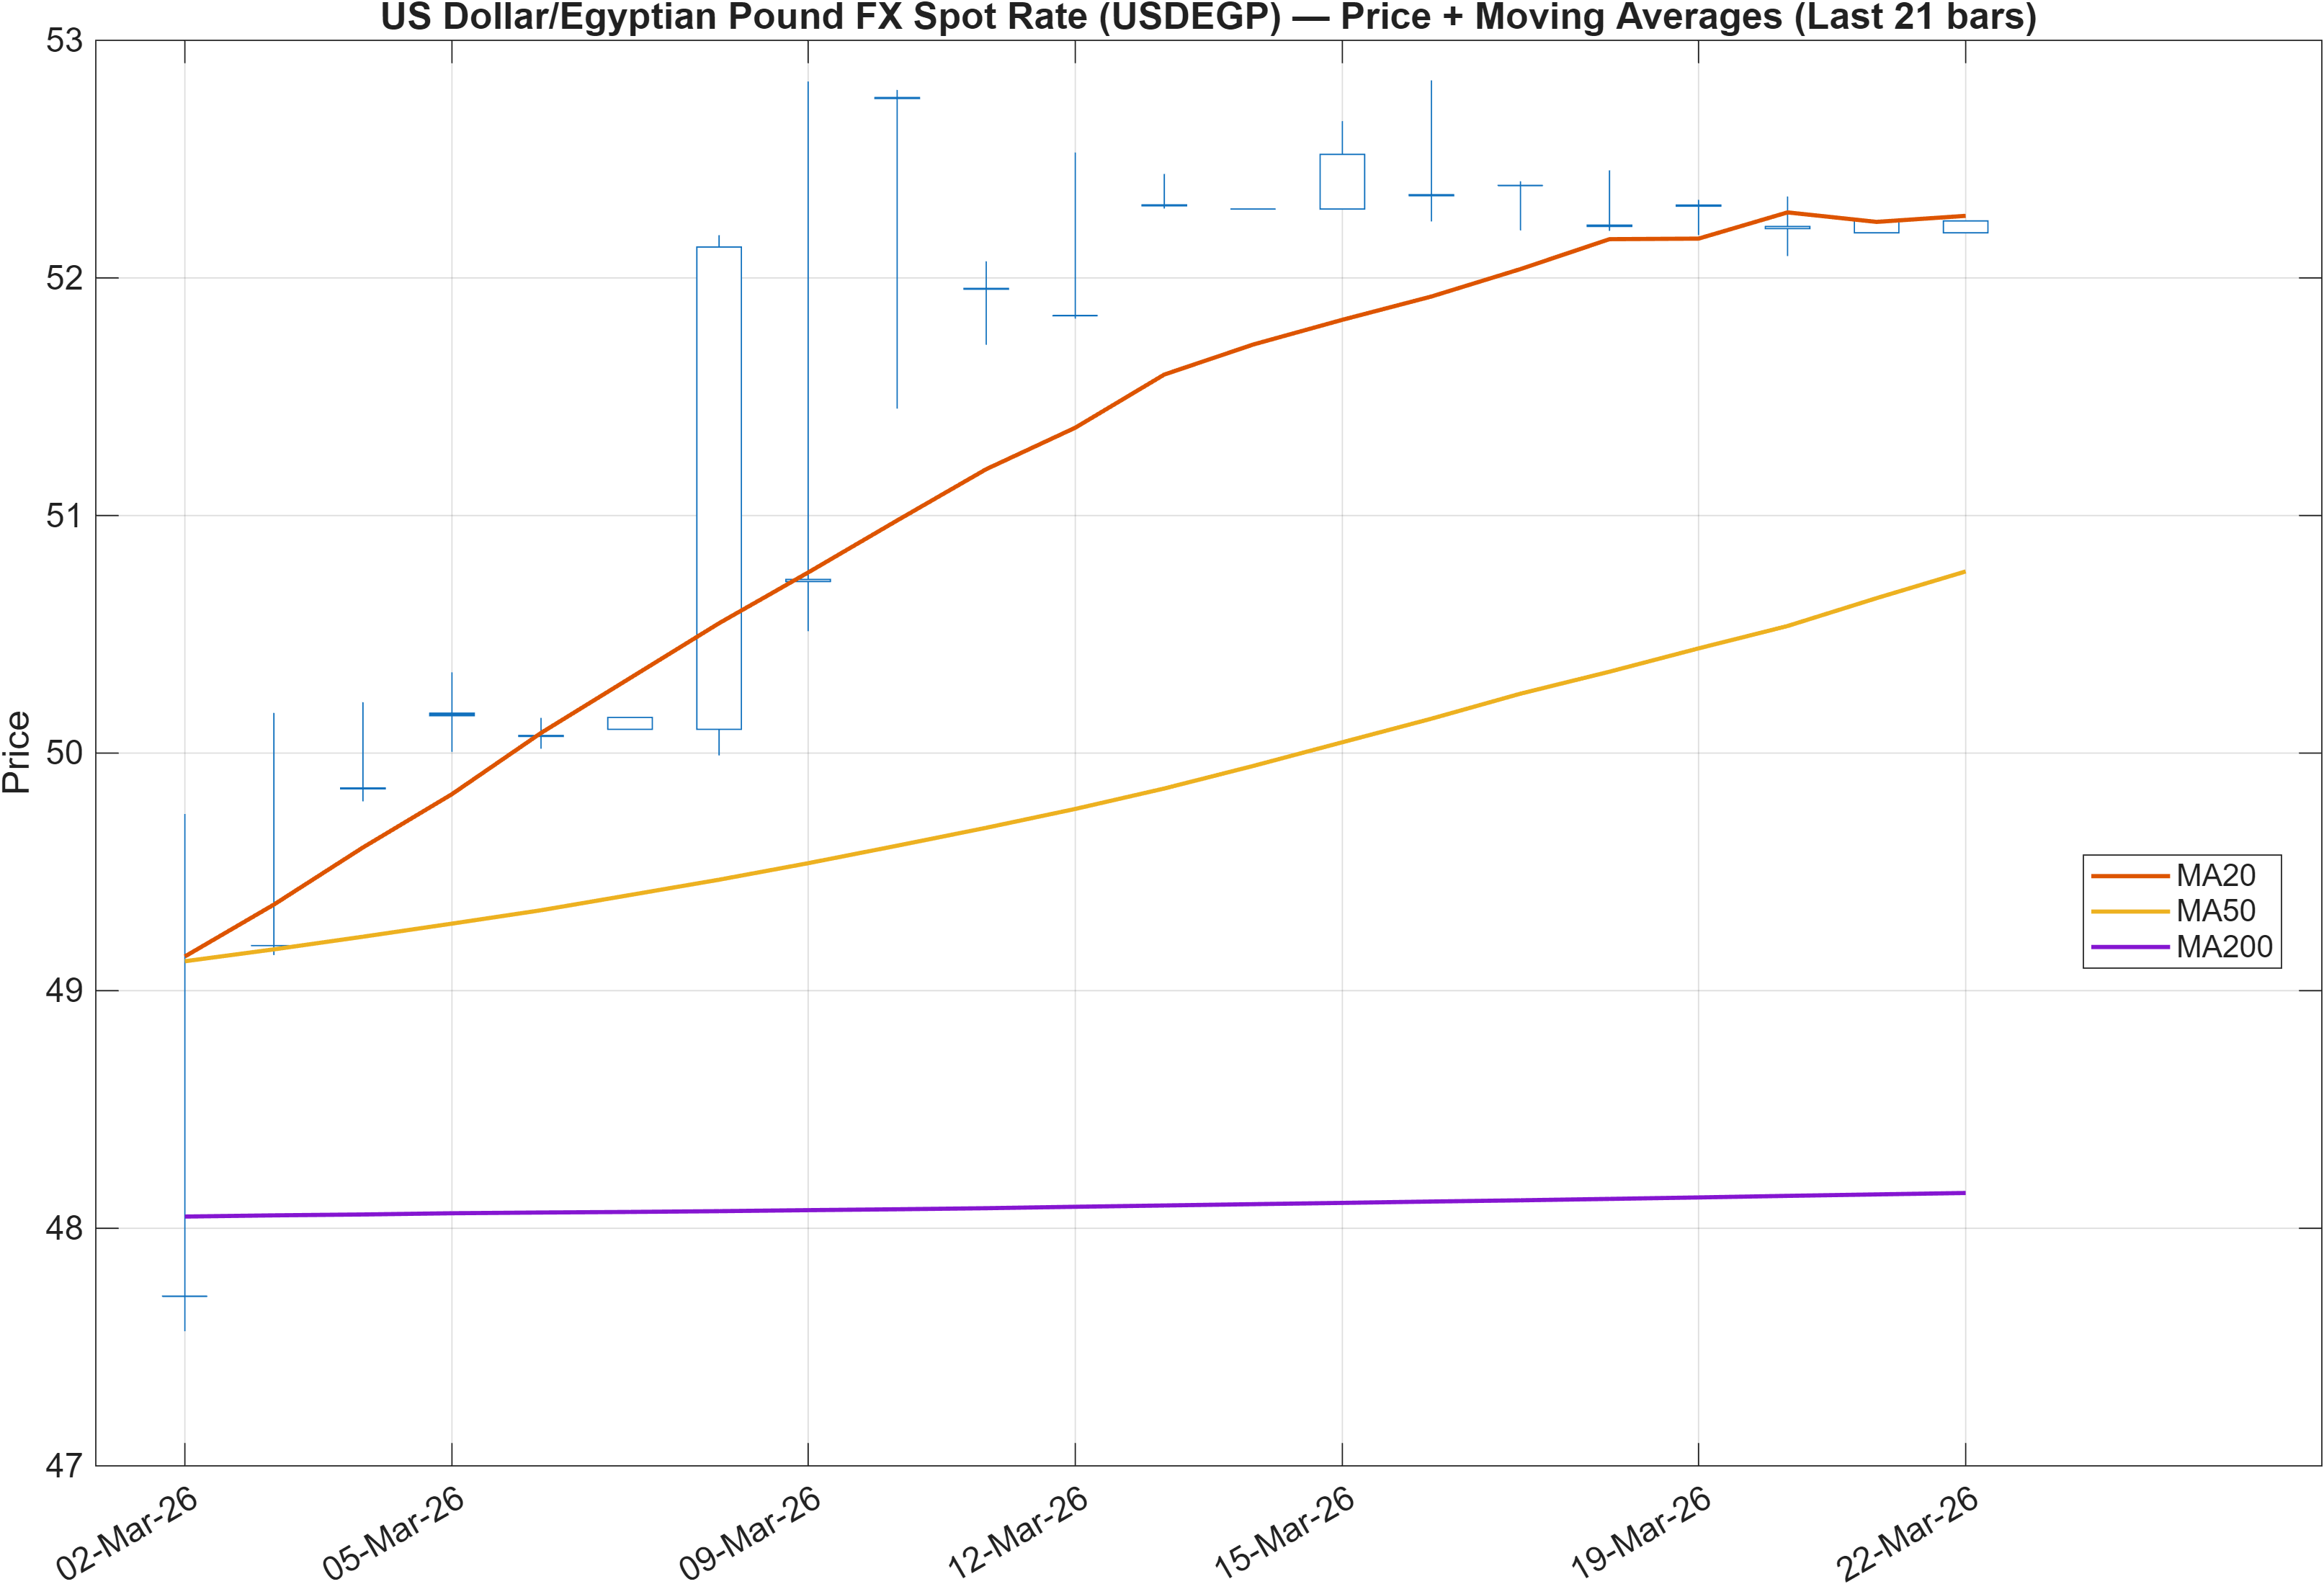
Trend structure: supportive averages, but price still needs follow-through
The moving-average read is constructive: Close vs MA50 = Bullish and MA50 vs MA200 = Bullish. This configuration typically implies the market has maintained an underlying upward bias over the recent trend window, and that pullbacks may be more likely to resolve as mean-reverting pauses rather than full reversals—provided momentum and volatility corroborate.
However, a bullish MA stack can coexist with flat realized movement when volatility compresses and participation becomes selective. That matters here because volatility metrics (see Section 3) indicate a contained regime. In practice, this tends to shift emphasis from “trend identification” toward trend validation: whether price can separate from congestion and stay separated.
With resistance mapped at 52.4450 and support at 46.6995, the MA bullishness should be viewed as a favorable backdrop, not a standalone trigger. If price fails to sustain progress toward the upper bound and instead rotates within the range, the MA signal can remain bullish while the tradable opportunity set narrows.
The cleanest institutional framing is to treat the trend state as constructive but conditional: the market has structure consistent with an up-bias, yet it is still operating inside a level-defined environment where confirmation is most credible when it is accompanied by momentum improvement (RSI/MACD) and volatility expansion (Bollinger bandwidth).
3) Momentum & volatility dashboard
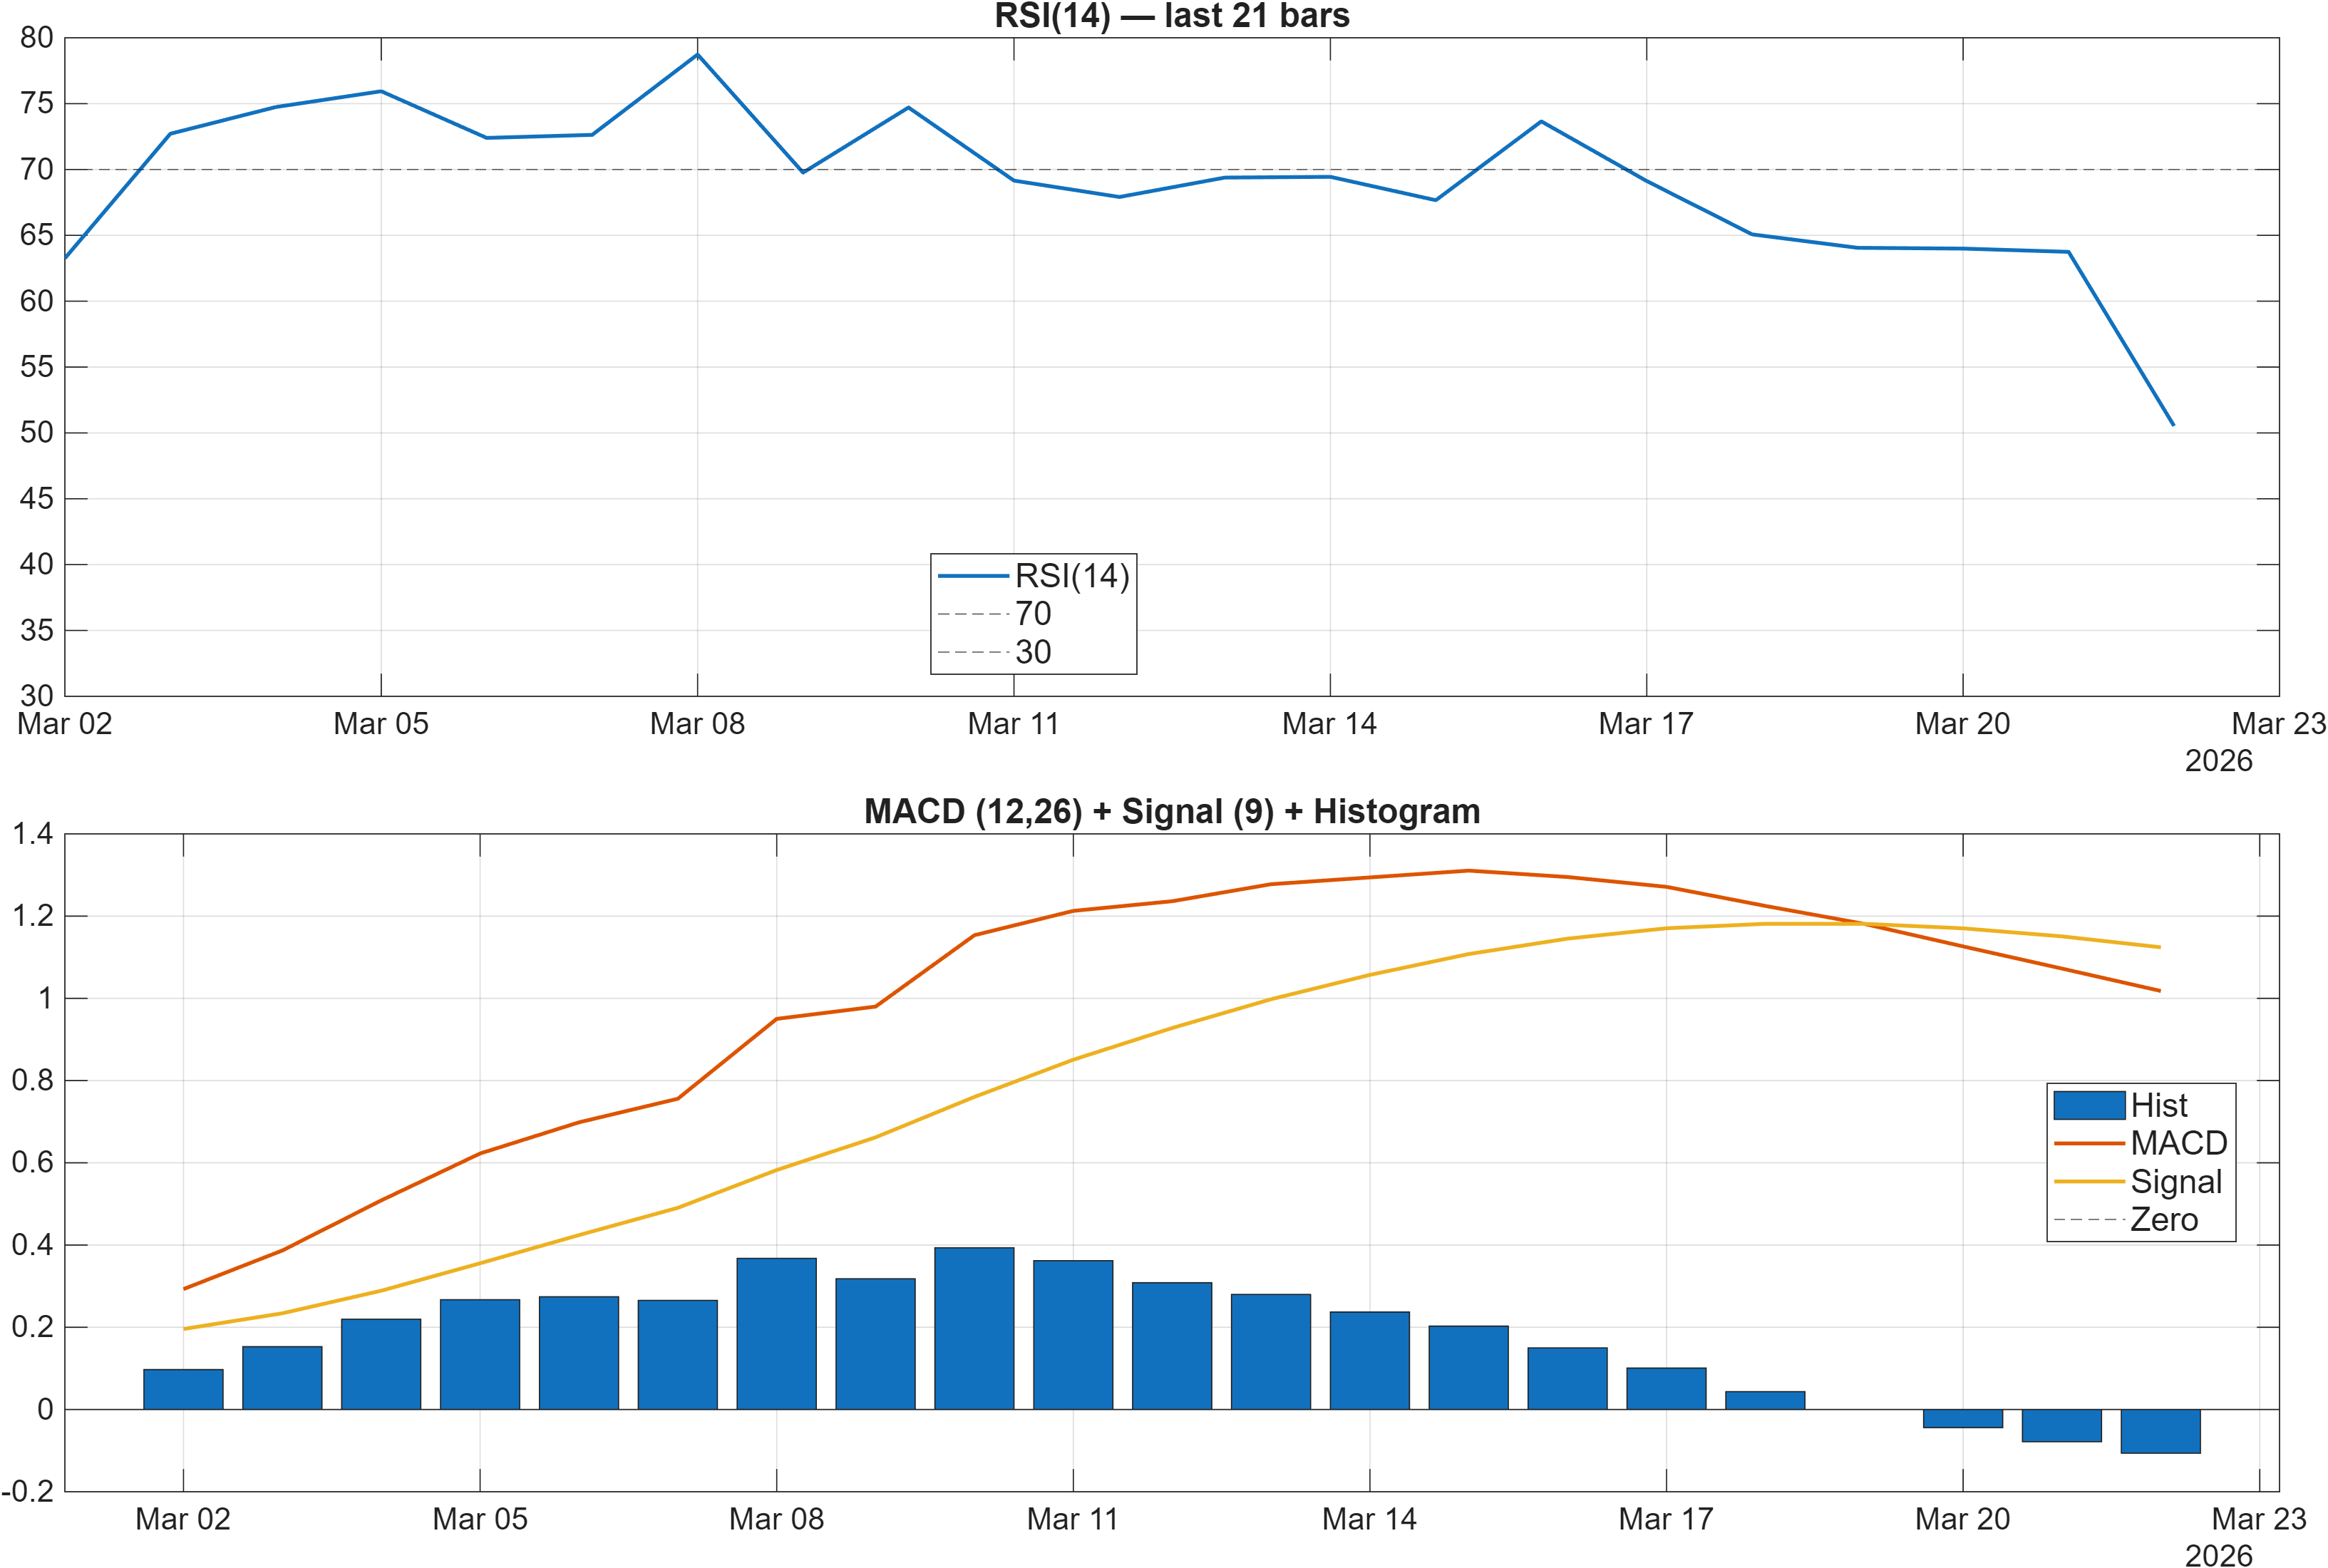
Interpretation: RSI bias = Neutral, MACD hist = -0.1062.
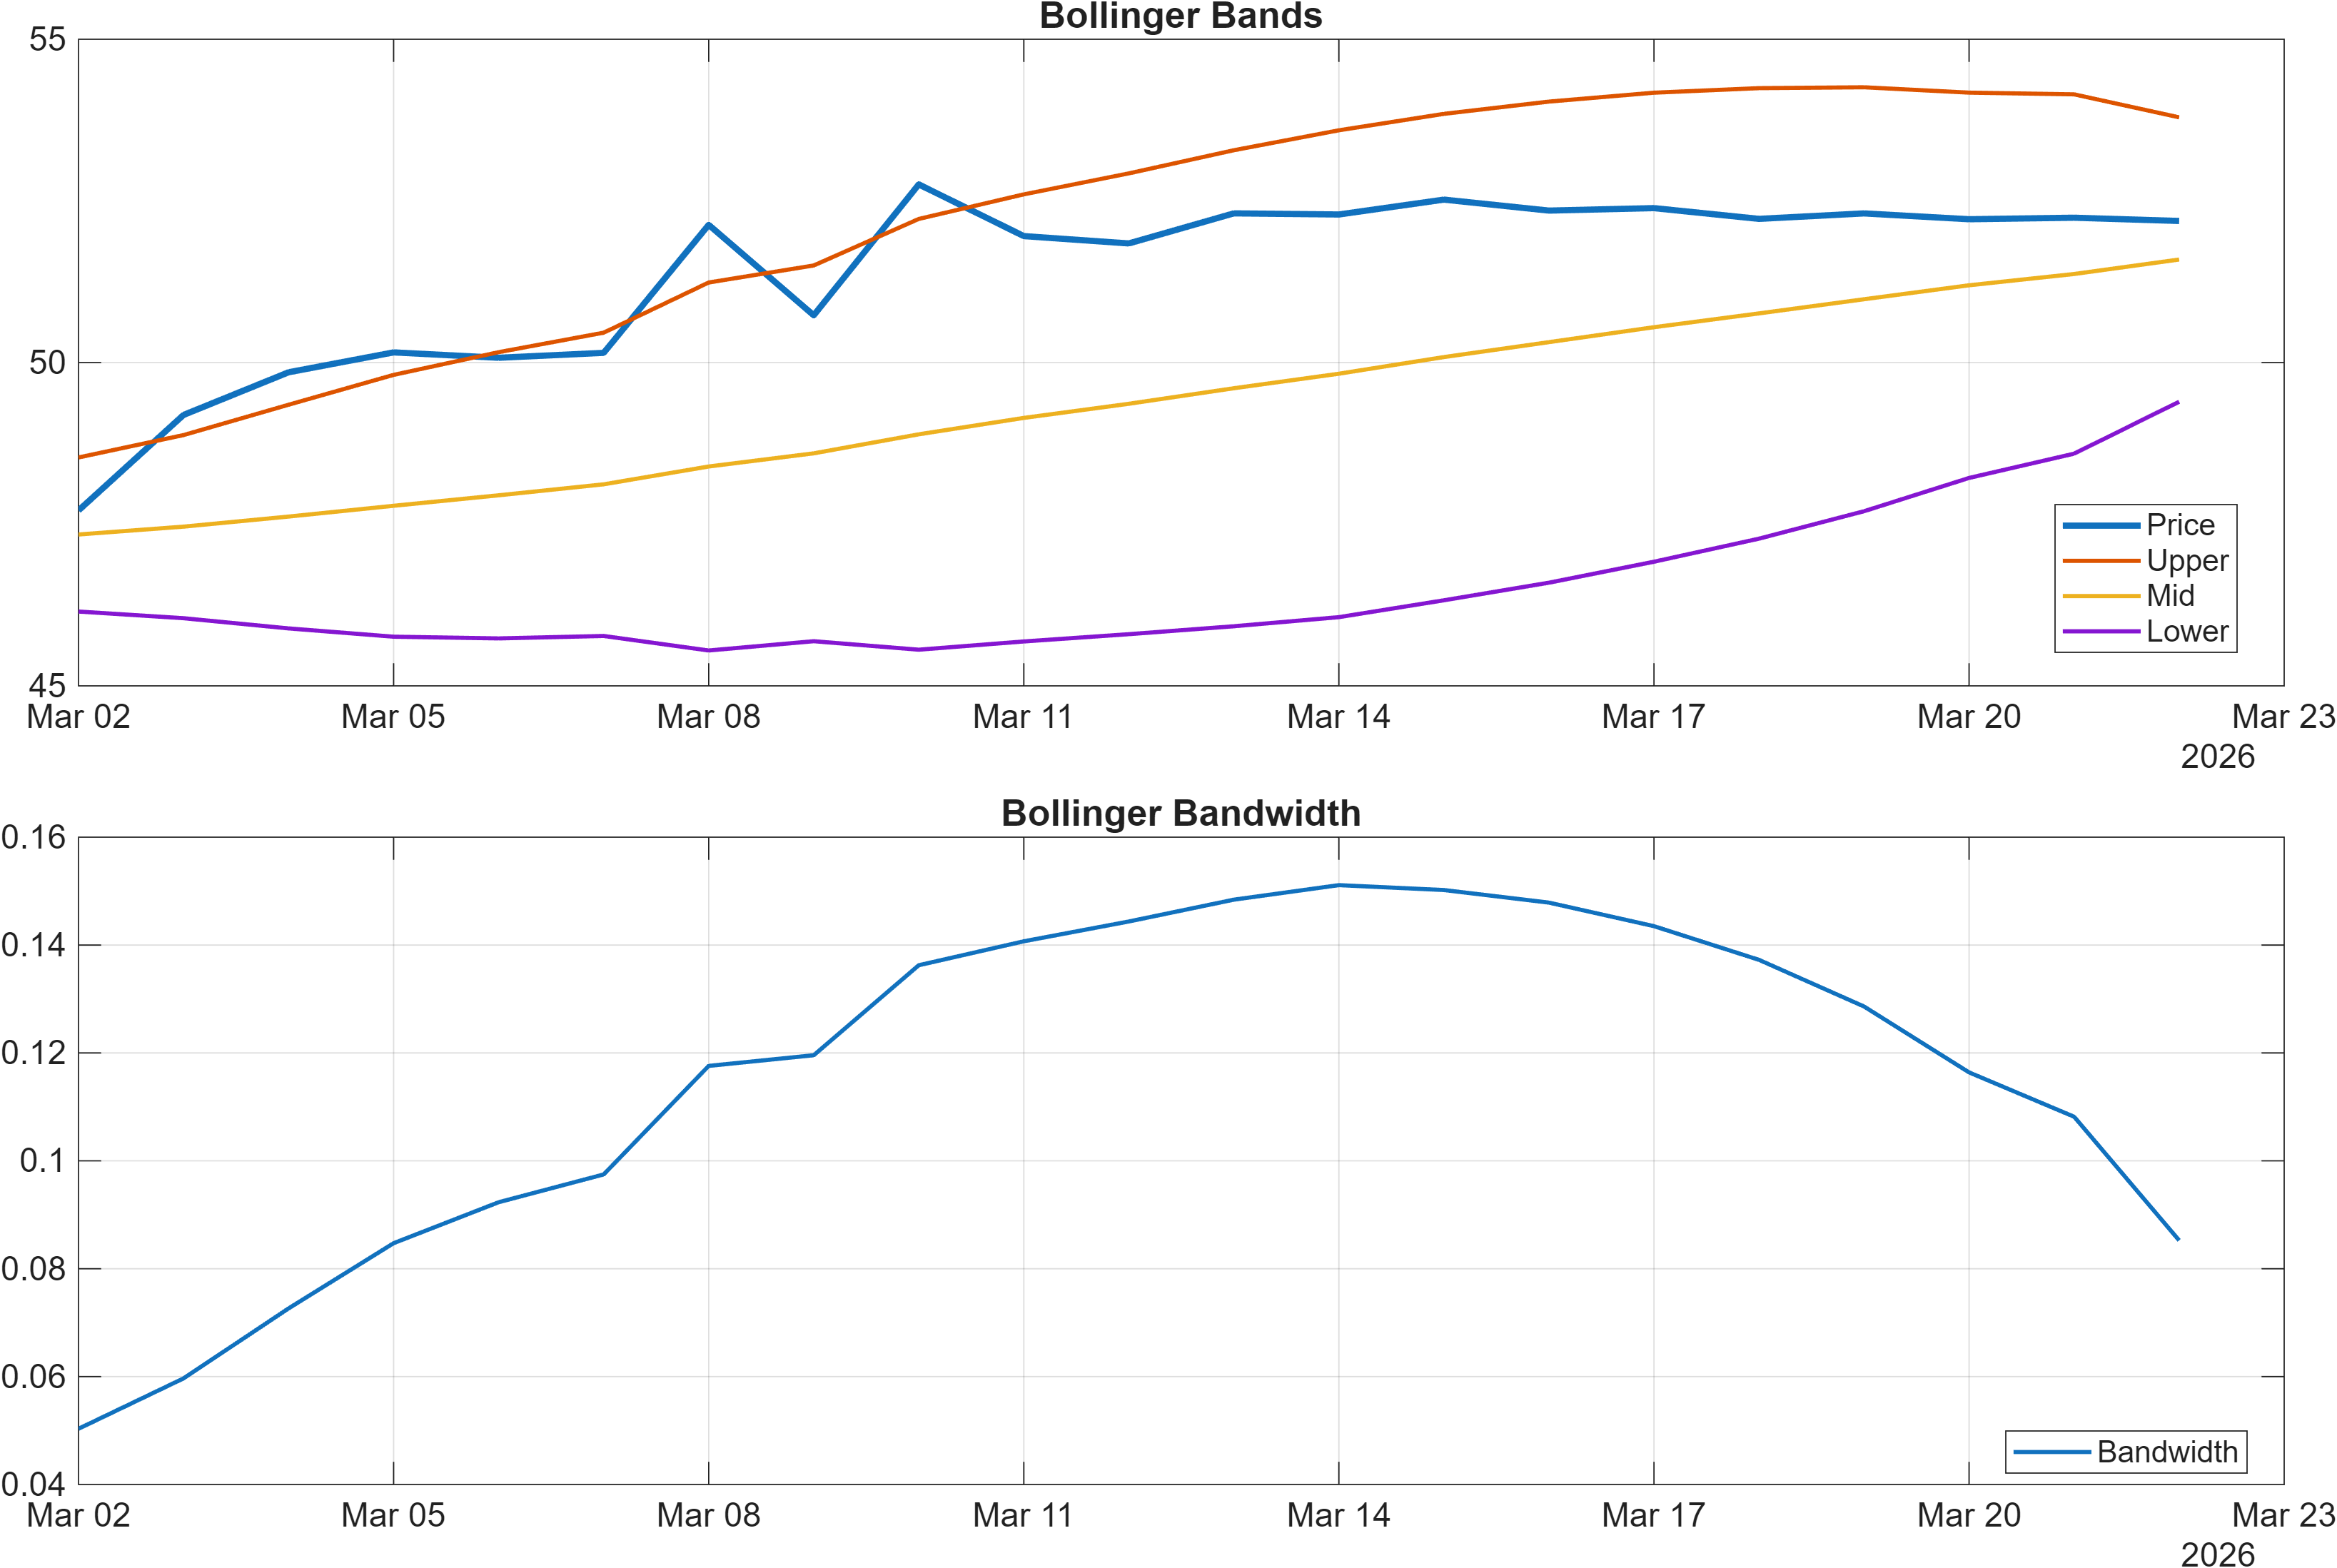
Interpretation: Bandwidth (volatility regime) latest = 0.0853.
Momentum/volatility mix: neutral impulse inside a compressed regime
Momentum indicators describe a market that is not stretched, but also not decisively re-accelerating. RSI(14) at 50.53 sits near the midpoint—consistent with balance rather than directional pressure—while the MACD histogram at -0.1062 keeps the immediate impulse modestly negative. This is a common combination when price is trending on a higher timeframe but digesting on the daily/near-term frame.
Volatility provides the second leg of the interpretation. Bollinger Bandwidth at 0.0853 indicates a relatively contained regime. Compression states tend to reduce the signal quality of many momentum oscillators: RSI can hover around 50 and MACD can oscillate around the zero-line without producing sustained follow-through. In those conditions, the first move out of compression is often less important than whether the move is maintained across multiple closes.
For USDEGP specifically, this suggests the market is in a decision phase. The bullish MA structure (Section 2) supplies a supportive backdrop, but the momentum dashboard implies the market has not yet transitioned into a higher-energy leg. A shift would typically be expressed as improving MACD histogram behavior alongside a volatility pickup from the current bandwidth regime.
Until that occurs, risk is two-sided: the pair can remain stable and range-bound despite favorable intermediate ranks (Section 1), or it can break directionally once compression resolves. The most robust read comes from integrating the momentum state with the predefined support/resistance zones.
4) Support / Resistance zones
Support ~ 46.6995 | Resistance ~ 52.4450
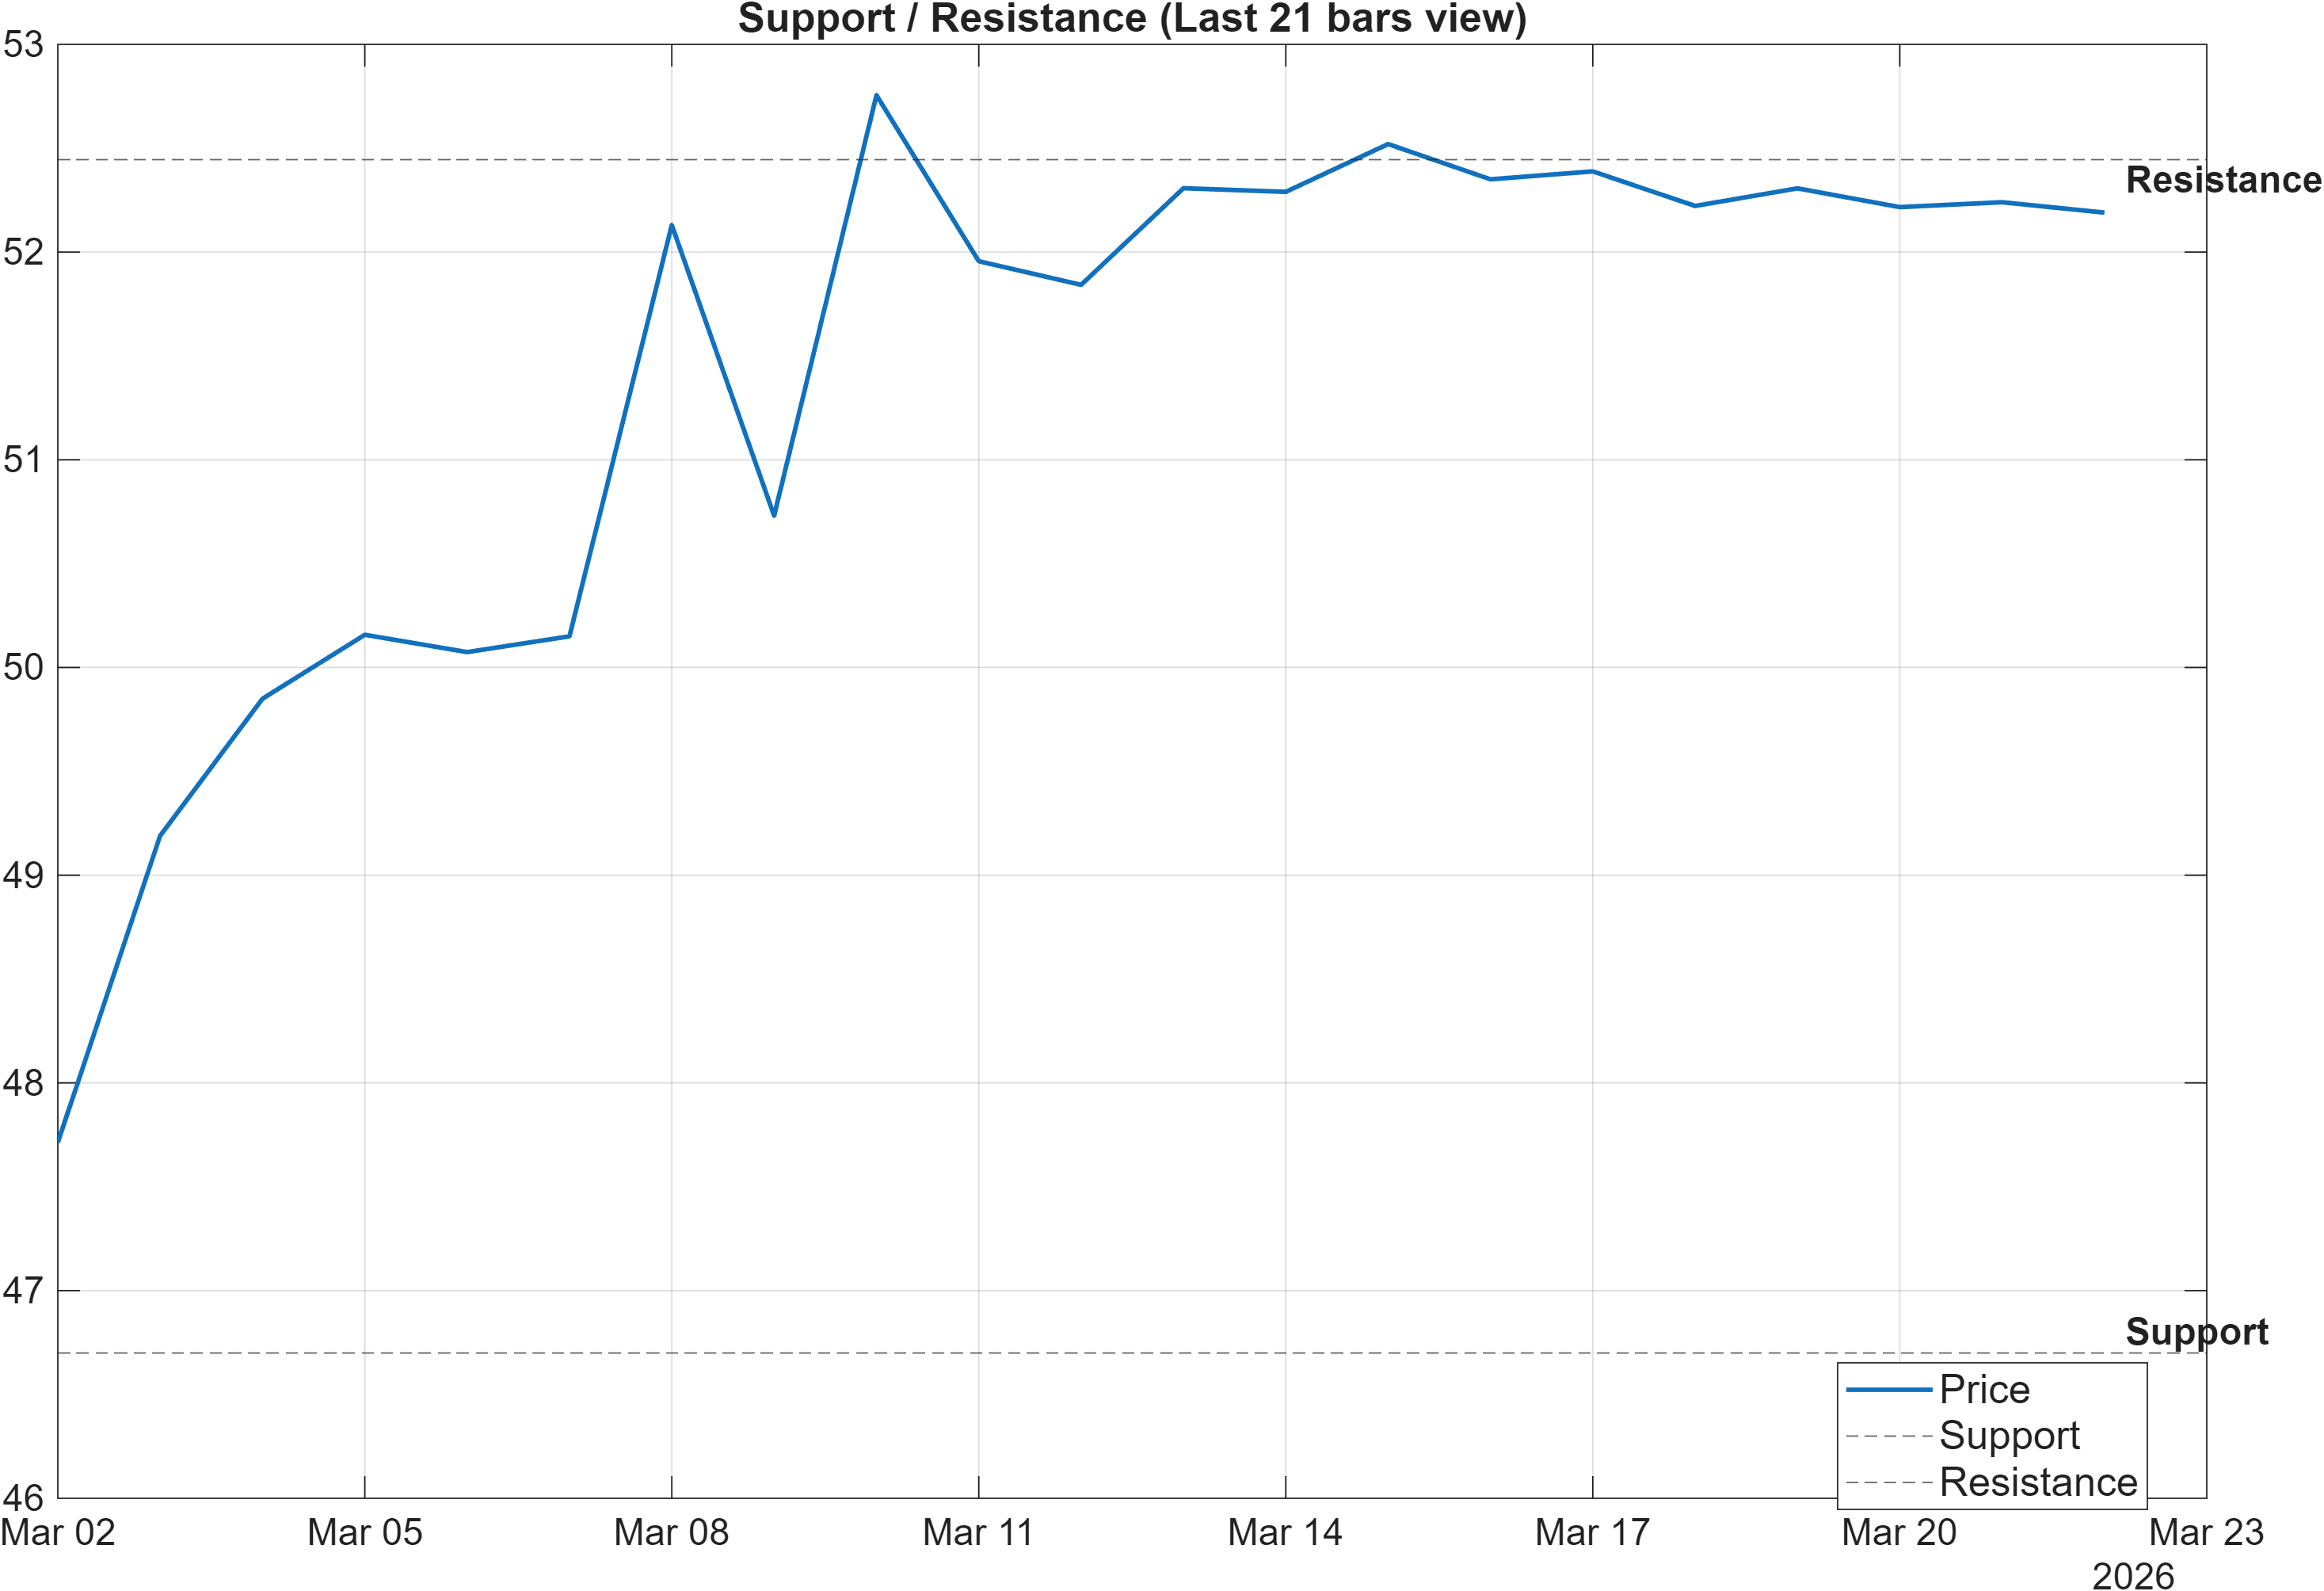
Decision zones: define risk first, then look for expansion
The current map is clean: 46.6995 acts as the primary downside reference and 52.4450 as the overhead boundary. In a compressed volatility regime (bandwidth 0.0853), these levels tend to do more analytical work than many oscillators because they reflect where the market has historically accepted vs rejected price.
The scenario framing embedded in the report is explicit: break above resistance with volume favors continuation, while a close below support signals deterioration risk. Even without instrument-specific volume metrics in the provided data, the logic remains applicable: a resistance break is more credible when it is accompanied by a simultaneous improvement in internal measures—such as a stabilizing MACD histogram (currently -0.1062) and a shift away from RSI equilibrium (currently 50.53).
A key nuance is that the support/resistance span is relatively wide. That tends to reward patience and disciplined confirmation: range trading can dominate when price oscillates inside the band, while breakout trading requires accepting that false breaks are more common during compression.
From a market-structure lens, the best use of these zones is to separate signal from noise. Any price action that remains well within 46.6995–52.4450 is more consistent with consolidation than with regime change; the probability of a new directional phase increases when the market pushes through a boundary and then holds outside it.
5) Quant Technical Dashboard (18 Signals)
KGNAI AI Technical Analysis Score (Deep Reinforcement Learning): Rank #540 out of 964 (Rank 1 represents the strongest technical positioning and a higher probability of favorable price behavior. As ranks increase toward the maximum, the probability of favorable outcomes weakens and bearish positioning becomes more dominant.) | Label: Neutral | Score: -0.120
18-Signal Technical Confluence Score: 0.278 (Neutral)
Overall Technical Score (18-signal confluence + DRL rank blend): 0.158 (Neutral)
Note: The blended score reflects signal strength weighted against broader AI technical ranking, which may temporarily diverge.
Blended technical score breakdown: 0.158 (Neutral | Bull 6 / Bear 1 / Neutral 11)
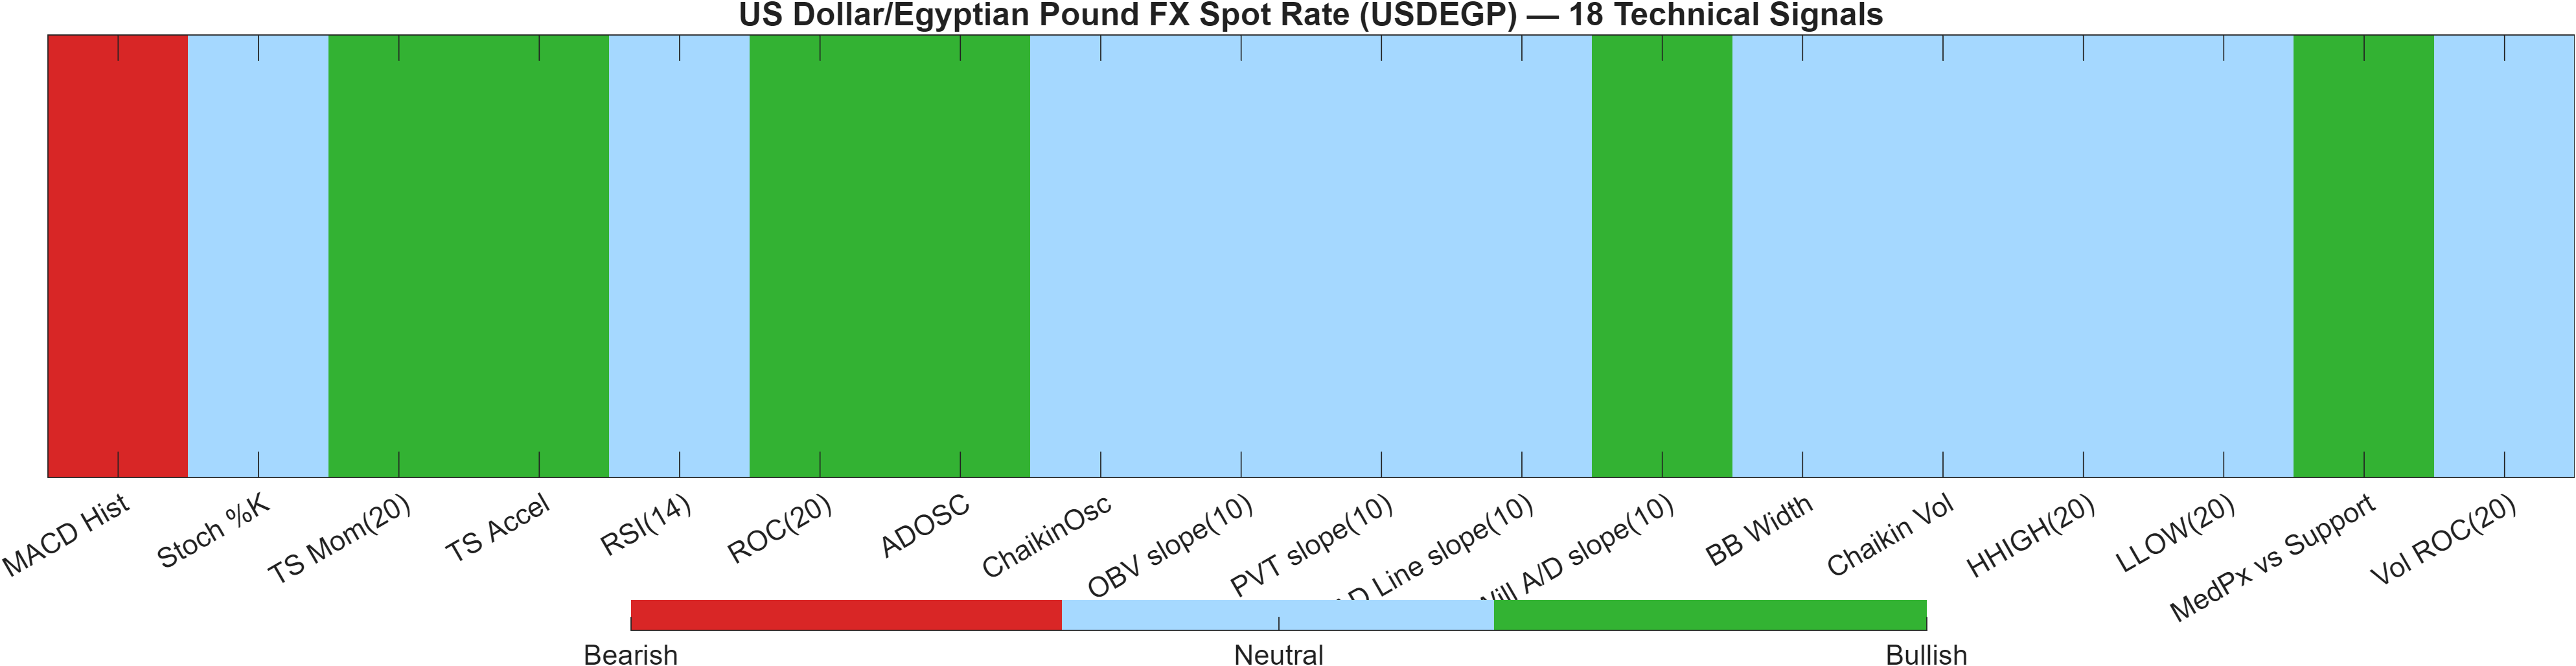
Confluence vs model rank: a neutral blend with selective bullish pockets
The dashboard shows a Neutral technical state despite several supportive sub-signals. The 18-signal confluence score (0.278) and the overall blended score (0.158) both land neutral, which is consistent with a market that is structurally constructive but not yet expressing broad, synchronized momentum.
The blended composition is informative: Bull 6 / Bear 1 / Neutral 11. That distribution indicates limited bearish evidence, but also a lack of widespread bullish confirmation. The DRL technical rank (#540 of 964, score -0.120) reinforces the idea that, in cross-sectional terms, the technical setup is not currently “leadership” despite the constructive mid-term KGNAI ranks in Section 1.
At the indicator level, the single explicit bearish reading is the MACD histogram (-0.1062), aligning with the momentum panel. Meanwhile, select trend/momentum components (for example, RSI(14) at 50.53 being neutral) reinforce equilibrium rather than thrust. This combination often appears when the market is waiting for volatility to return; Bollinger width around 0.08525 also registers neutral in the signal table.
Practically, a neutral blend is not the absence of information—it is a message about signal dispersion. For USDEGP, the dispersion argues for prioritizing level-based validation (46.6995/52.4450) and watching whether momentum indicators rotate out of neutrality in tandem with bandwidth expansion.
Signal table (Bull/Bear/Neutral)
| Indicator | Value | Signal |
|---|---|---|
| MACD Hist | -0.1062 | Bearish |
| Stoch %K | 20.02 | Neutral |
| TS Mom(20) | 3.05 | Bullish |
| TS Accel | 0.5957 | Bullish |
| RSI(14) | 50.53 | Neutral |
| ROC(20) | 6.099 | Bullish |
| ADOSC | 100 | Bullish |
| ChaikinOsc | 0 | Neutral |
| OBV slope(10) | 0 | Neutral |
| PVT slope(10) | 0 | Neutral |
| AD Line slope(10) | 0 | Neutral |
| Will A/D slope(10) | 0.204 | Bullish |
| BB Width | 0.08525 | Neutral |
| Chaikin Vol | -64.84 | Neutral |
| HHIGH(20) | 52.83 | Neutral |
| LLOW(20) | 49.15 | Neutral |
| MedPx vs Support | 5.516 | Bullish |
| Vol ROC(20) | — | Neutral |
Interpretation: Indicator-level signals form the base confluence, which is then adjusted using a separate AI-driven technical ranking model. The final technical score summarizes this combined view.
6) News sentiment + extractive gist
Note: Instrument-specific news matches were not found, so the digest includes broader market/sector headlines.
Sentiment score (avg): -0.004 | Positive: 12% | Neutral: 69% | Negative: 19%
KGNAI AI News Sentiment Score (normalized -1 to +1): 0.19 (as of 2025-07-11) | Label: Bullish | Overall news score: 0.27
Positive Developments
Recent coverage across major financial outlets indicates a slightly constructive bias in the way broad USD-linked and rates-sensitive narratives are being framed. While the average sentiment score is close to flat (-0.004), the model’s normalized news signal remains 0.19 with a Bullish label, implying that the language context is marginally supportive even when direction is not explicit. The mix is also consistent with markets that are processing policy expectations and cross-asset interactions (yields, commodities, and risk appetite) rather than focusing on a single currency-pair driver. For USDEGP, this matters because the technical state is neutral-to-constructive (overall technical score 0.158), and incremental improvements in macro tone can be sufficient to keep price leaning toward the upper part of the defined range, provided resistance (52.4450) is eventually tested with follow-through.
Neutral / Mixed Developments
The dominant feature of the news distribution is neutrality: 69% of items are classified as neutral, with only 12% positive and 19% negative. That skew implies information flow is largely observational and cross-market in nature, which aligns with the technical picture of compression (bandwidth 0.0853) and equilibrium momentum (RSI 50.53). In practical terms, the digest should be treated as context rather than as a catalyst. When the information set is mostly neutral, prices often remain responsive to level-based triggers and short-term liquidity conditions. Accordingly, the most useful takeaway is that sentiment is not providing a strong push against the existing structure; it is compatible with continued consolidation between 46.6995 and 52.4450 until a clearer driver emerges.
Negative / Risk Signals
The negative component (19%) reflects risk framing around macro uncertainty and cross-asset volatility, which can translate into episodic USD demand and abrupt repricing in related markets. Even when USDEGP itself remains stable, these narratives can increase the probability of short, sharp volatility bursts—particularly relevant when technical conditions are compressed and the market is near decision zones. With MACD histogram at -0.1062, downside momentum is not aggressive, but it is present enough that a risk-off news pulse can coincide with a loss of near-term traction. In that environment, the key risk is not “bad news” alone; it is the interaction between a negative headline cycle and a technical backdrop that has not yet re-accelerated. The closest structural invalidation level remains the 46.6995 support zone.
- Whether the volatility regime (bandwidth 0.0853) begins expanding as price approaches 52.4450 or 46.6995.
- Whether RSI moves decisively away from ~50.53 while MACD histogram improves from -0.1062.
- Whether the neutral-heavy news mix (69%) shifts toward more directional language alongside any level break.
Sources referenced: Reuters, Bloomberg, Yahoo Finance, MarketWatch, Investing.com
Snapshot: AI Rank (Short–Mid–Long): Mixed (Neutral–Bullish–Neutral) · Technical Confluence: Neutral · Key Levels: Support ~46.70 | Resistance ~52.45 · News Sentiment: Neutral
7) Sources
- Silver Price Forecast: XAG/USD plunges, clearing key levels below $70 — https://www.fxstreet.com/news/silver-price-forecast-xag-usd-plunges-clearing-key-levels-below-70-202603202204
- Banxico seen holding rates at 7% amid war-driven inflation risks — https://www.fxstreet.com/news/banxico-seen-holding-rates-at-7-amid-war-driven-inflation-risks-202603201928
- Forecasting the upcoming week: Hawkish Fed meets escalating Iran war — https://www.fxstreet.com/news/forecasting-the-upcoming-week-hawkish-fed-meets-escalating-iran-war-202603202012
- Gold slips near $4,500 as Oil rally and US yields weigh on bullion — https://www.fxstreet.com/news/gold-slips-near-4-500-as-oil-rally-and-us-yields-weigh-on-bullion-202603201928
- USD/CHF flat as Fed outlook and Oil-driven USD demand limit downside — https://www.fxstreet.com/news/usd-chf-flat-as-fed-outlook-and-oil-driven-usd-demand-limit-downside-202603201832
- Gold set for third weekly loss as 'higher-for-longer' interest rate outlook weigh — https://www.fxstreet.com/news/gold-remains-under-pressure-as-global-interest-rate-outlook-weighs-on-demand-202603201219
- Dow Jones Industrial Average slides as Iran war, hawkish Fed drive fourth losing week — https://www.fxstreet.com/news/dow-jones-industrial-average-slides-as-iran-war-hawkish-fed-drive-fourth-losing-week-202603201633
- EUR/USD Price Forecast: Pair struggles below 1.1600 as sellers maintain control — https://www.fxstreet.com/news/eur-usd-price-forecast-struggles-below-11600-as-sellers-maintain-control-202603201611
You may also like: How KGNAI AI ranks instruments across global markets
Disclaimer: KGNAI provides AI-generated analytics and educational market commentary only. This is not financial advice. Markets involve risk. Always do your own research.