
GBPTND (GBP/TND) — 08-May-2026 Technical Alignment Update: Improving Ranks, Neutral Confluence
GBPTND (GBP/TND) currently presents a mixed alignment profile: cross-horizon KGNAI ranks lean constructive on mid-to-long horizons while near-term technical state remains largely neutral. Within a 965-instrument FX universe, the pair sits #193 daily (Bullish) and #552 weekly (Neutral), with stronger placement on longer windows including #102 yearly (Bullish). Technical conditioning is not fully confirming the rank strength: the 18-signal confluence score is 0.167 (Neutral) and the blended technical score is -0.019 (Neutral), with momentum indicators showing pockets of downside bias (e.g., RSI(14) 37.53, Bearish) alongside selective stabilization cues. Volatility remains contained with Bollinger bandwidth 0.0163, making the nearby support ~3.8704 and resistance ~3.9341 particularly relevant as decision zones rather than deterministic triggers.
- Rank stance: Short-term Neutral; Mid-term Bullish; Long-term Bullish (within a 965-instrument universe; daily #193, weekly #552, yearly #102).
- Technical confluence label: Neutral (18-signal confluence 0.167; blended -0.019).
- Key levels: Support ~3.8704 and Resistance ~3.9341.
- News sentiment bias: Neutral (avg sentiment 0.007; 19% positive / 56% neutral / 25% negative).
- Confirmation / invalidation: A sustained push above 3.9341 favors continuation conditions; a close below 3.8704 increases deterioration risk per the scenario framing.
KGNAI evaluates assets using large cross-sectional datasets built from millions of structured data points. Inputs incorporate fundamental metrics, technical structures, and systematically processed news sentiment. Statistical models, machine learning, and AI frameworks are used to assess relative positioning, signal alignment, and probabilistic behavior across broad universes.
- Ranks are comparative across the tracked universe, not absolute price targets.
- Confluence reflects alignment among independent signal groups.
- Support/resistance levels are probabilistic decision zones, not guarantees.
- Sentiment provides contextual bias within the broader analytical framework.
1) KGNAI AI Analysis
Region: FOREX
Total universe size: 965 ranked instruments
- Daily rank: #193 out of 965 — Bullish
- Weekly rank: #552 out of 965 — Neutral
- Monthly rank: #115 out of 965 — Bullish
- 3-Monthly rank: #123 out of 965 — Bullish
- 6-Monthly rank: #182 out of 965 — Bullish
- Yearly rank: #102 out of 965 — Bullish
The rank stack is best read as cross-horizon consistency with one notable exception: the weekly window is neutral (#552, placing it in the weaker half of the universe), while daily and longer windows show materially stronger placement (e.g., daily #193 and yearly #102). This pattern often appears when the broader regime is supportive, but the most recent week has not yet re-accelerated in a way that lifts the shorter aggregation.
The monthly and 3-month ranks (#115 and #123) sit in the upper portion of the universe and align with the mid-term stance noted in the snapshot. Meanwhile, the 6-month reading (#182) remains constructive, suggesting that the neutral weekly print is currently the outlier rather than the dominant message across horizons.
From an alignment perspective, the key tension is timeframe divergence: the model sees relatively favorable behavior probabilistically on longer windows while acknowledging that near-term participation is not fully synchronized. That tension is consistent with a market that may be improving structurally without a clean, uninterrupted short-term trend. The term view remains: Short-term: Neutral; Mid-term: Bullish; Long-term: Bullish.
Want the full universe and complete rank tables? Unlock full access on KGNAI: https://www.kgnai.com/pricing
2) Price & trend overview
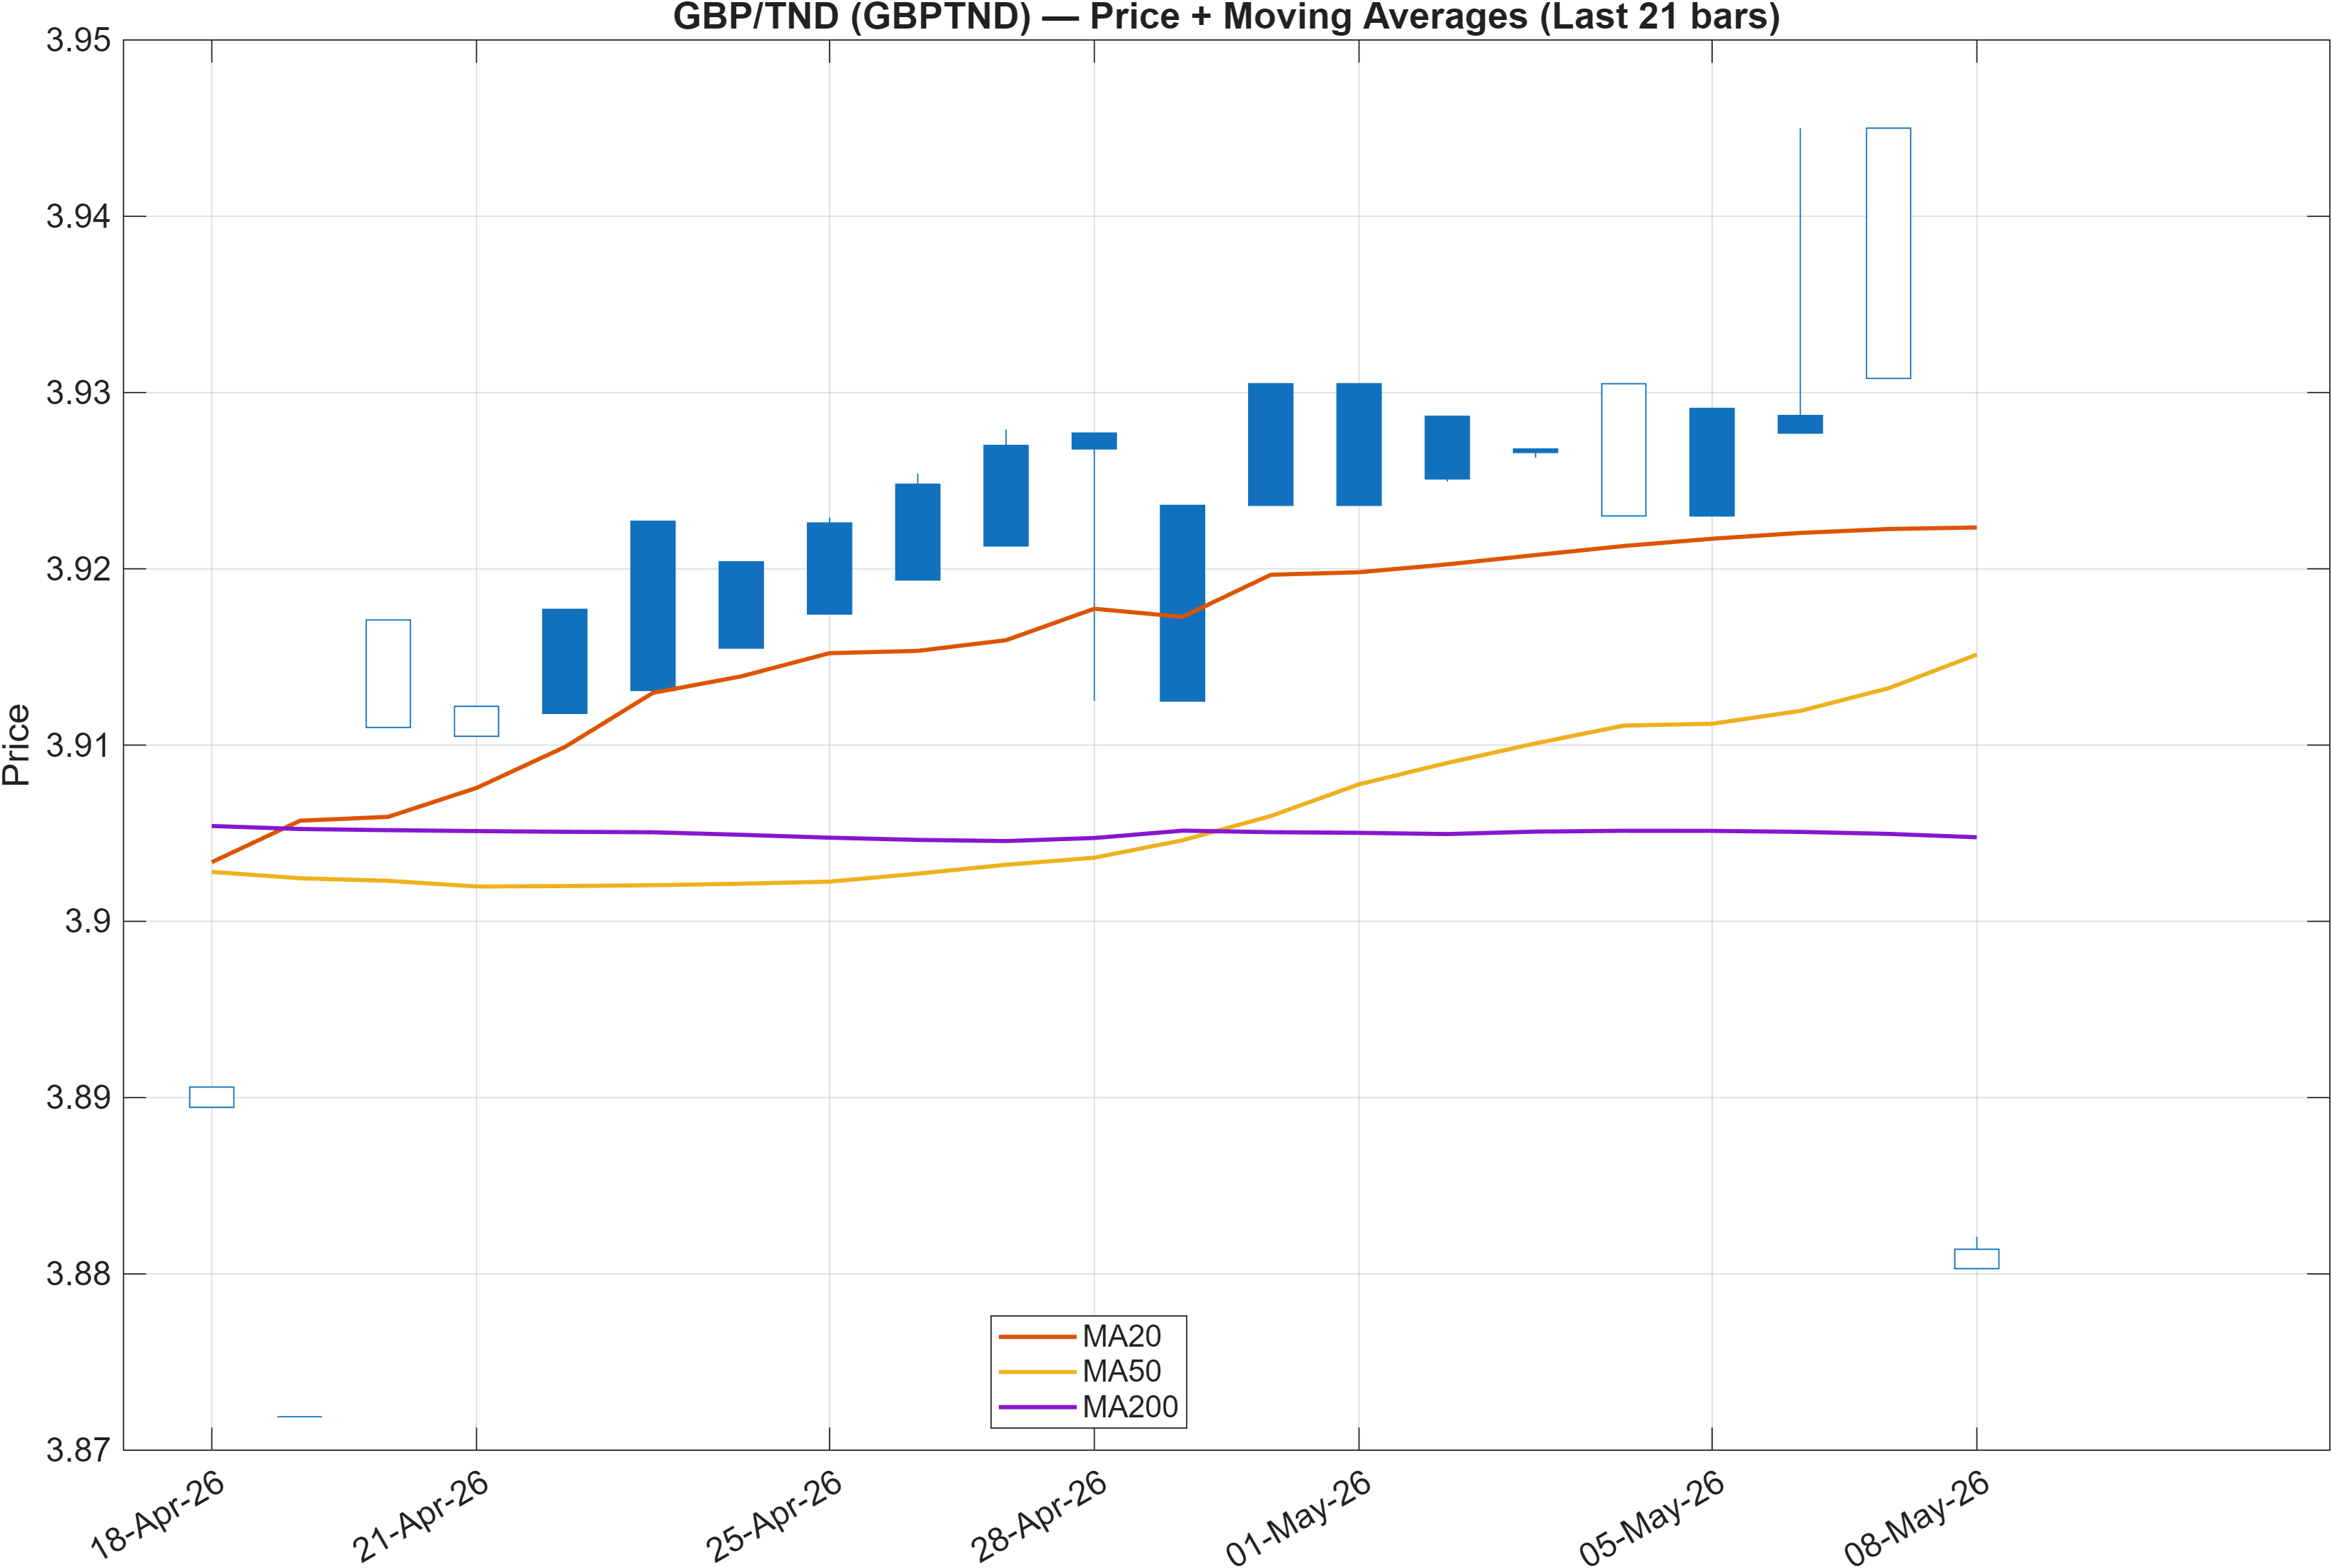
Interpretation: Close vs MA50 = Bearish, MA50 vs MA200 = Bullish.
The moving-average configuration highlights a regime split. With MA50 vs MA200 = Bullish, the medium-to-long trend structure is still framed as constructive (a common proxy for trend persistence). However, the close sitting below MA50 (Bearish) indicates the market is not currently trading with clean short-term trend support, consistent with the report’s short-term Neutral stance and the weekly rank sitting at #552.
In practical market-structure terms, this combination can behave like a pullback within an up-structure rather than a fully reversed regime, but the evidence here remains conditional: the longer-window ranks (e.g., yearly #102, monthly #115) are aligned with the bullish MA50/MA200 slope relationship, while the immediate price relationship to MA50 is not confirming.
That divergence matters because it tends to concentrate decision-making around nearby levels rather than trend-chasing. The report’s mapped levels—support ~3.8704 and resistance ~3.9341—become more influential when price is below MA50 while the longer averages remain supportive. A re-acceptance above short-term trend proxies would be the cleaner reconciliation of the structure, while continued trading below MA50 keeps the tape in a recovering-but-unresolved state.
Overall, Section 2 reads as a continuation regime trying to reassert, not a synchronized trend. The key is whether price behavior can graduate from “below MA50” into sustained strength without invalidating the longer structural support implied by the MA50/MA200 relationship.
3) Momentum & volatility dashboard
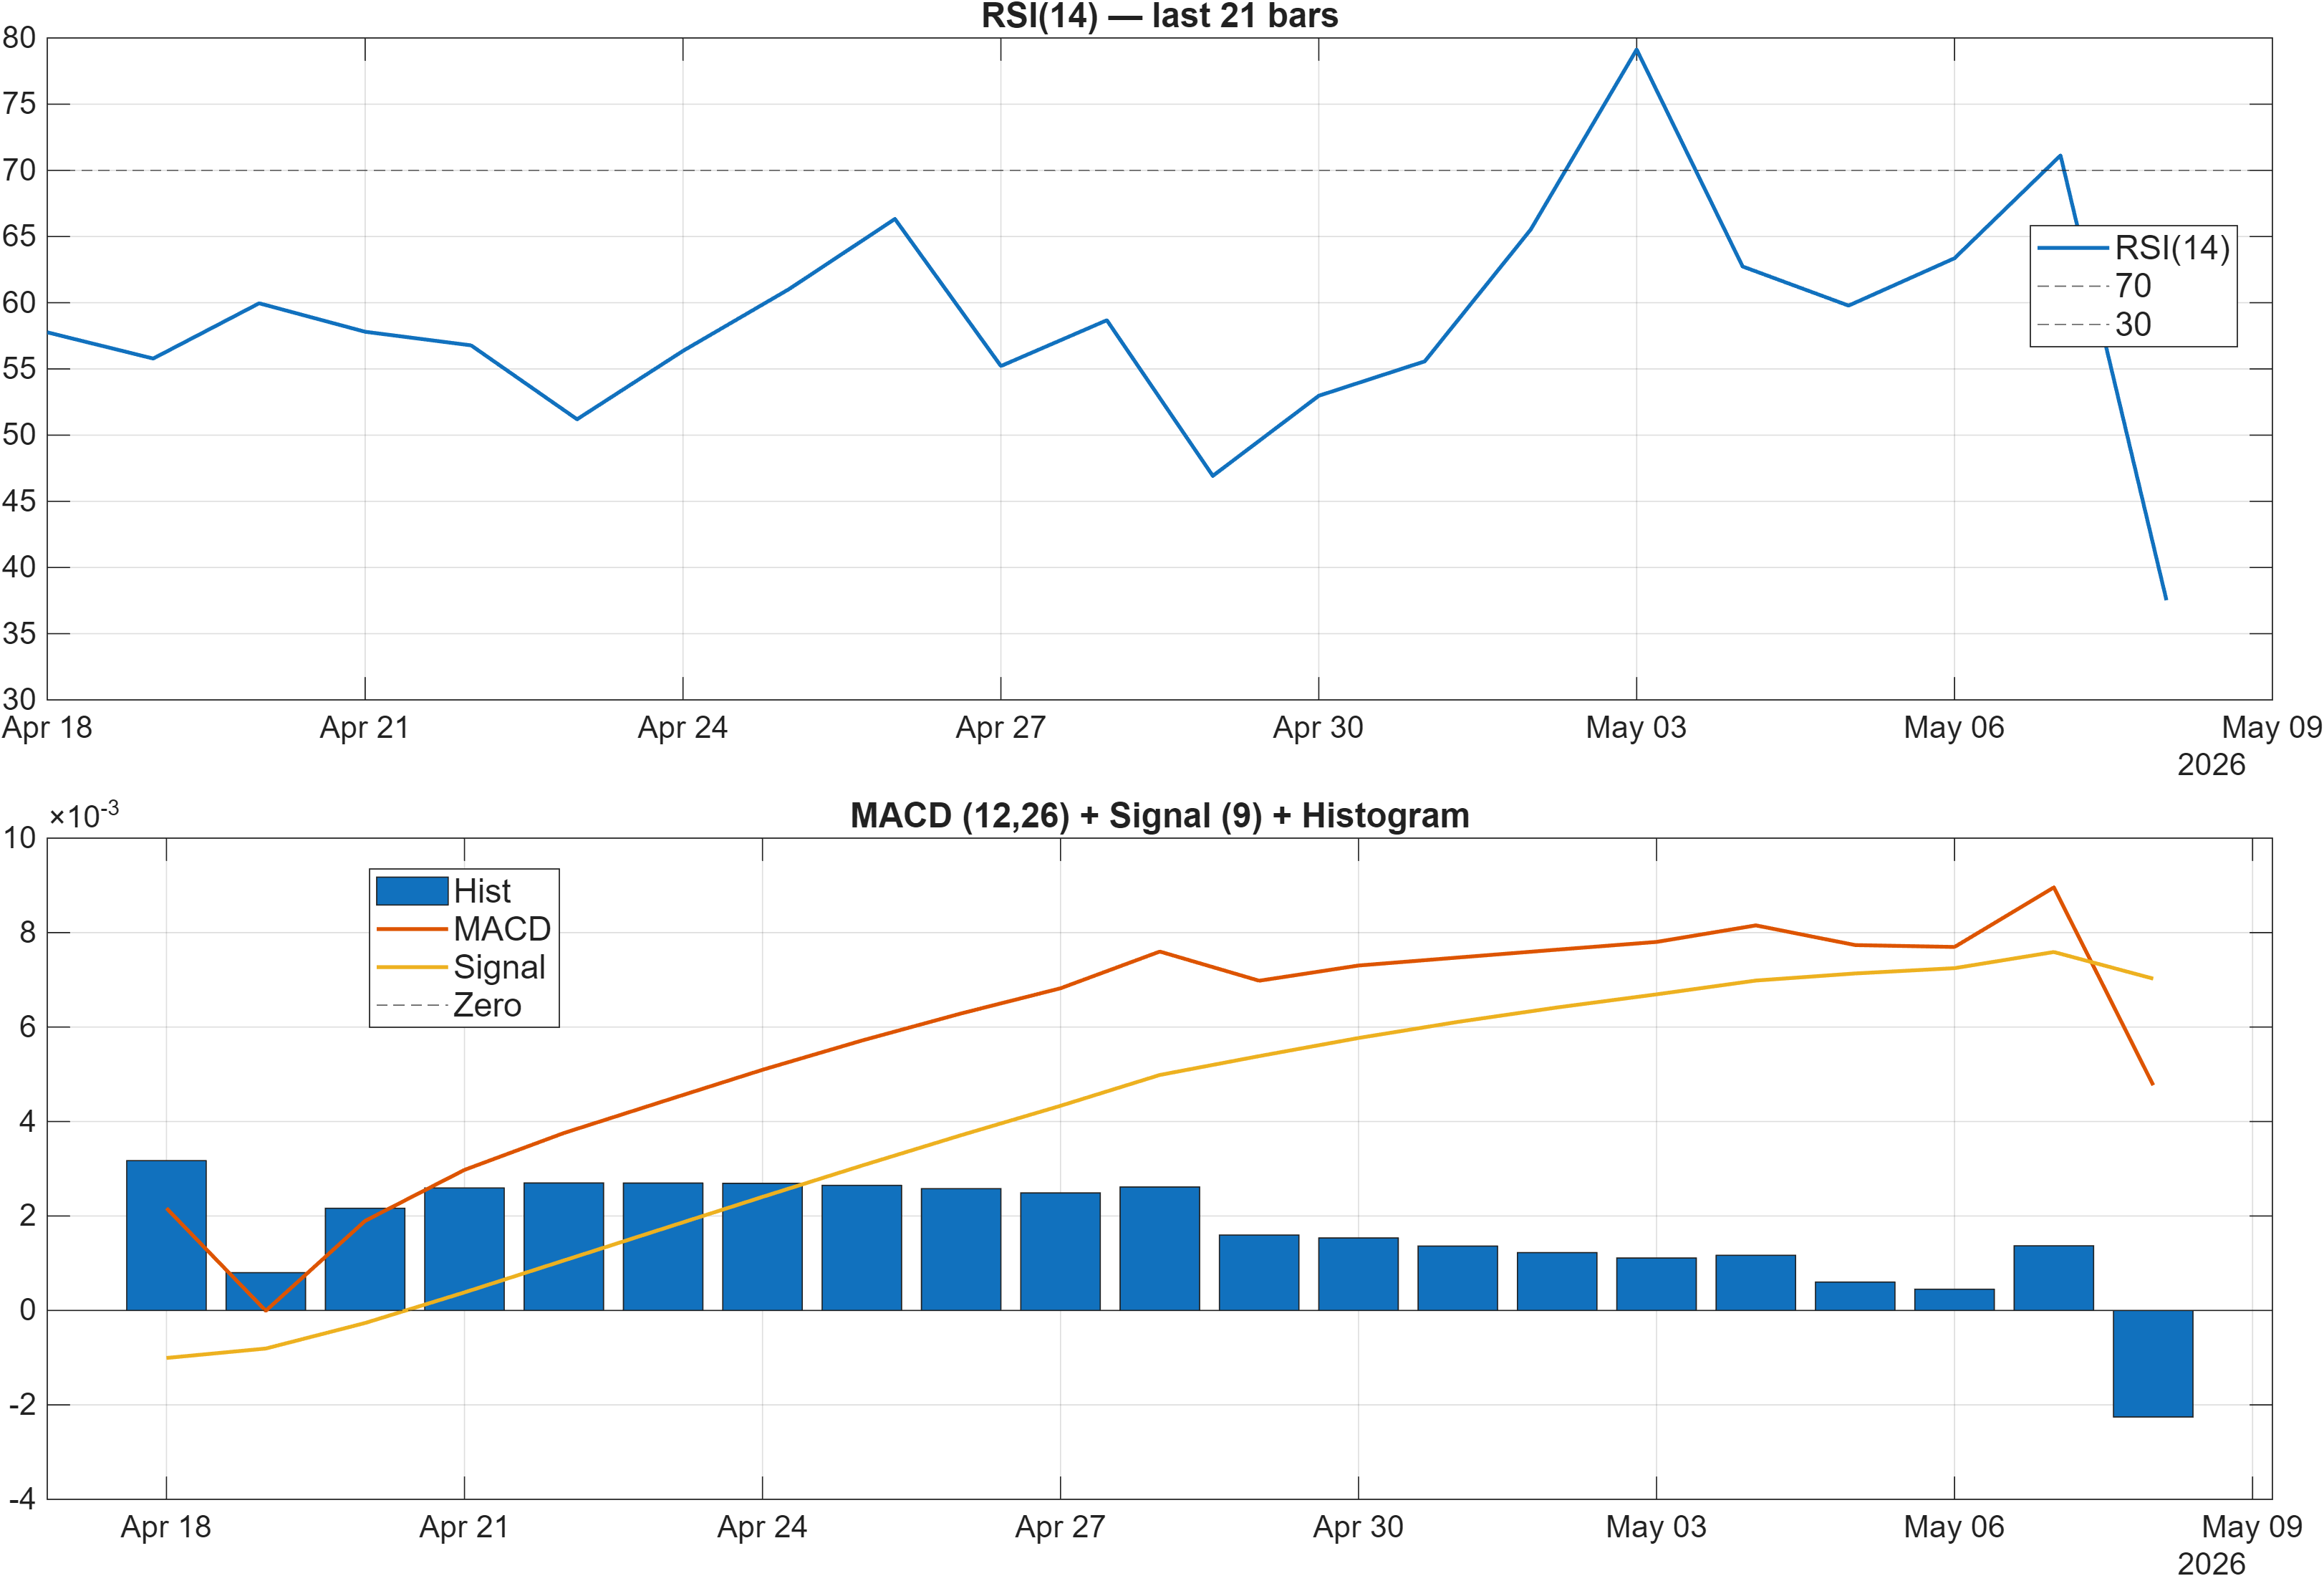
Interpretation: RSI bias = Bearish, MACD hist = -0.0023.
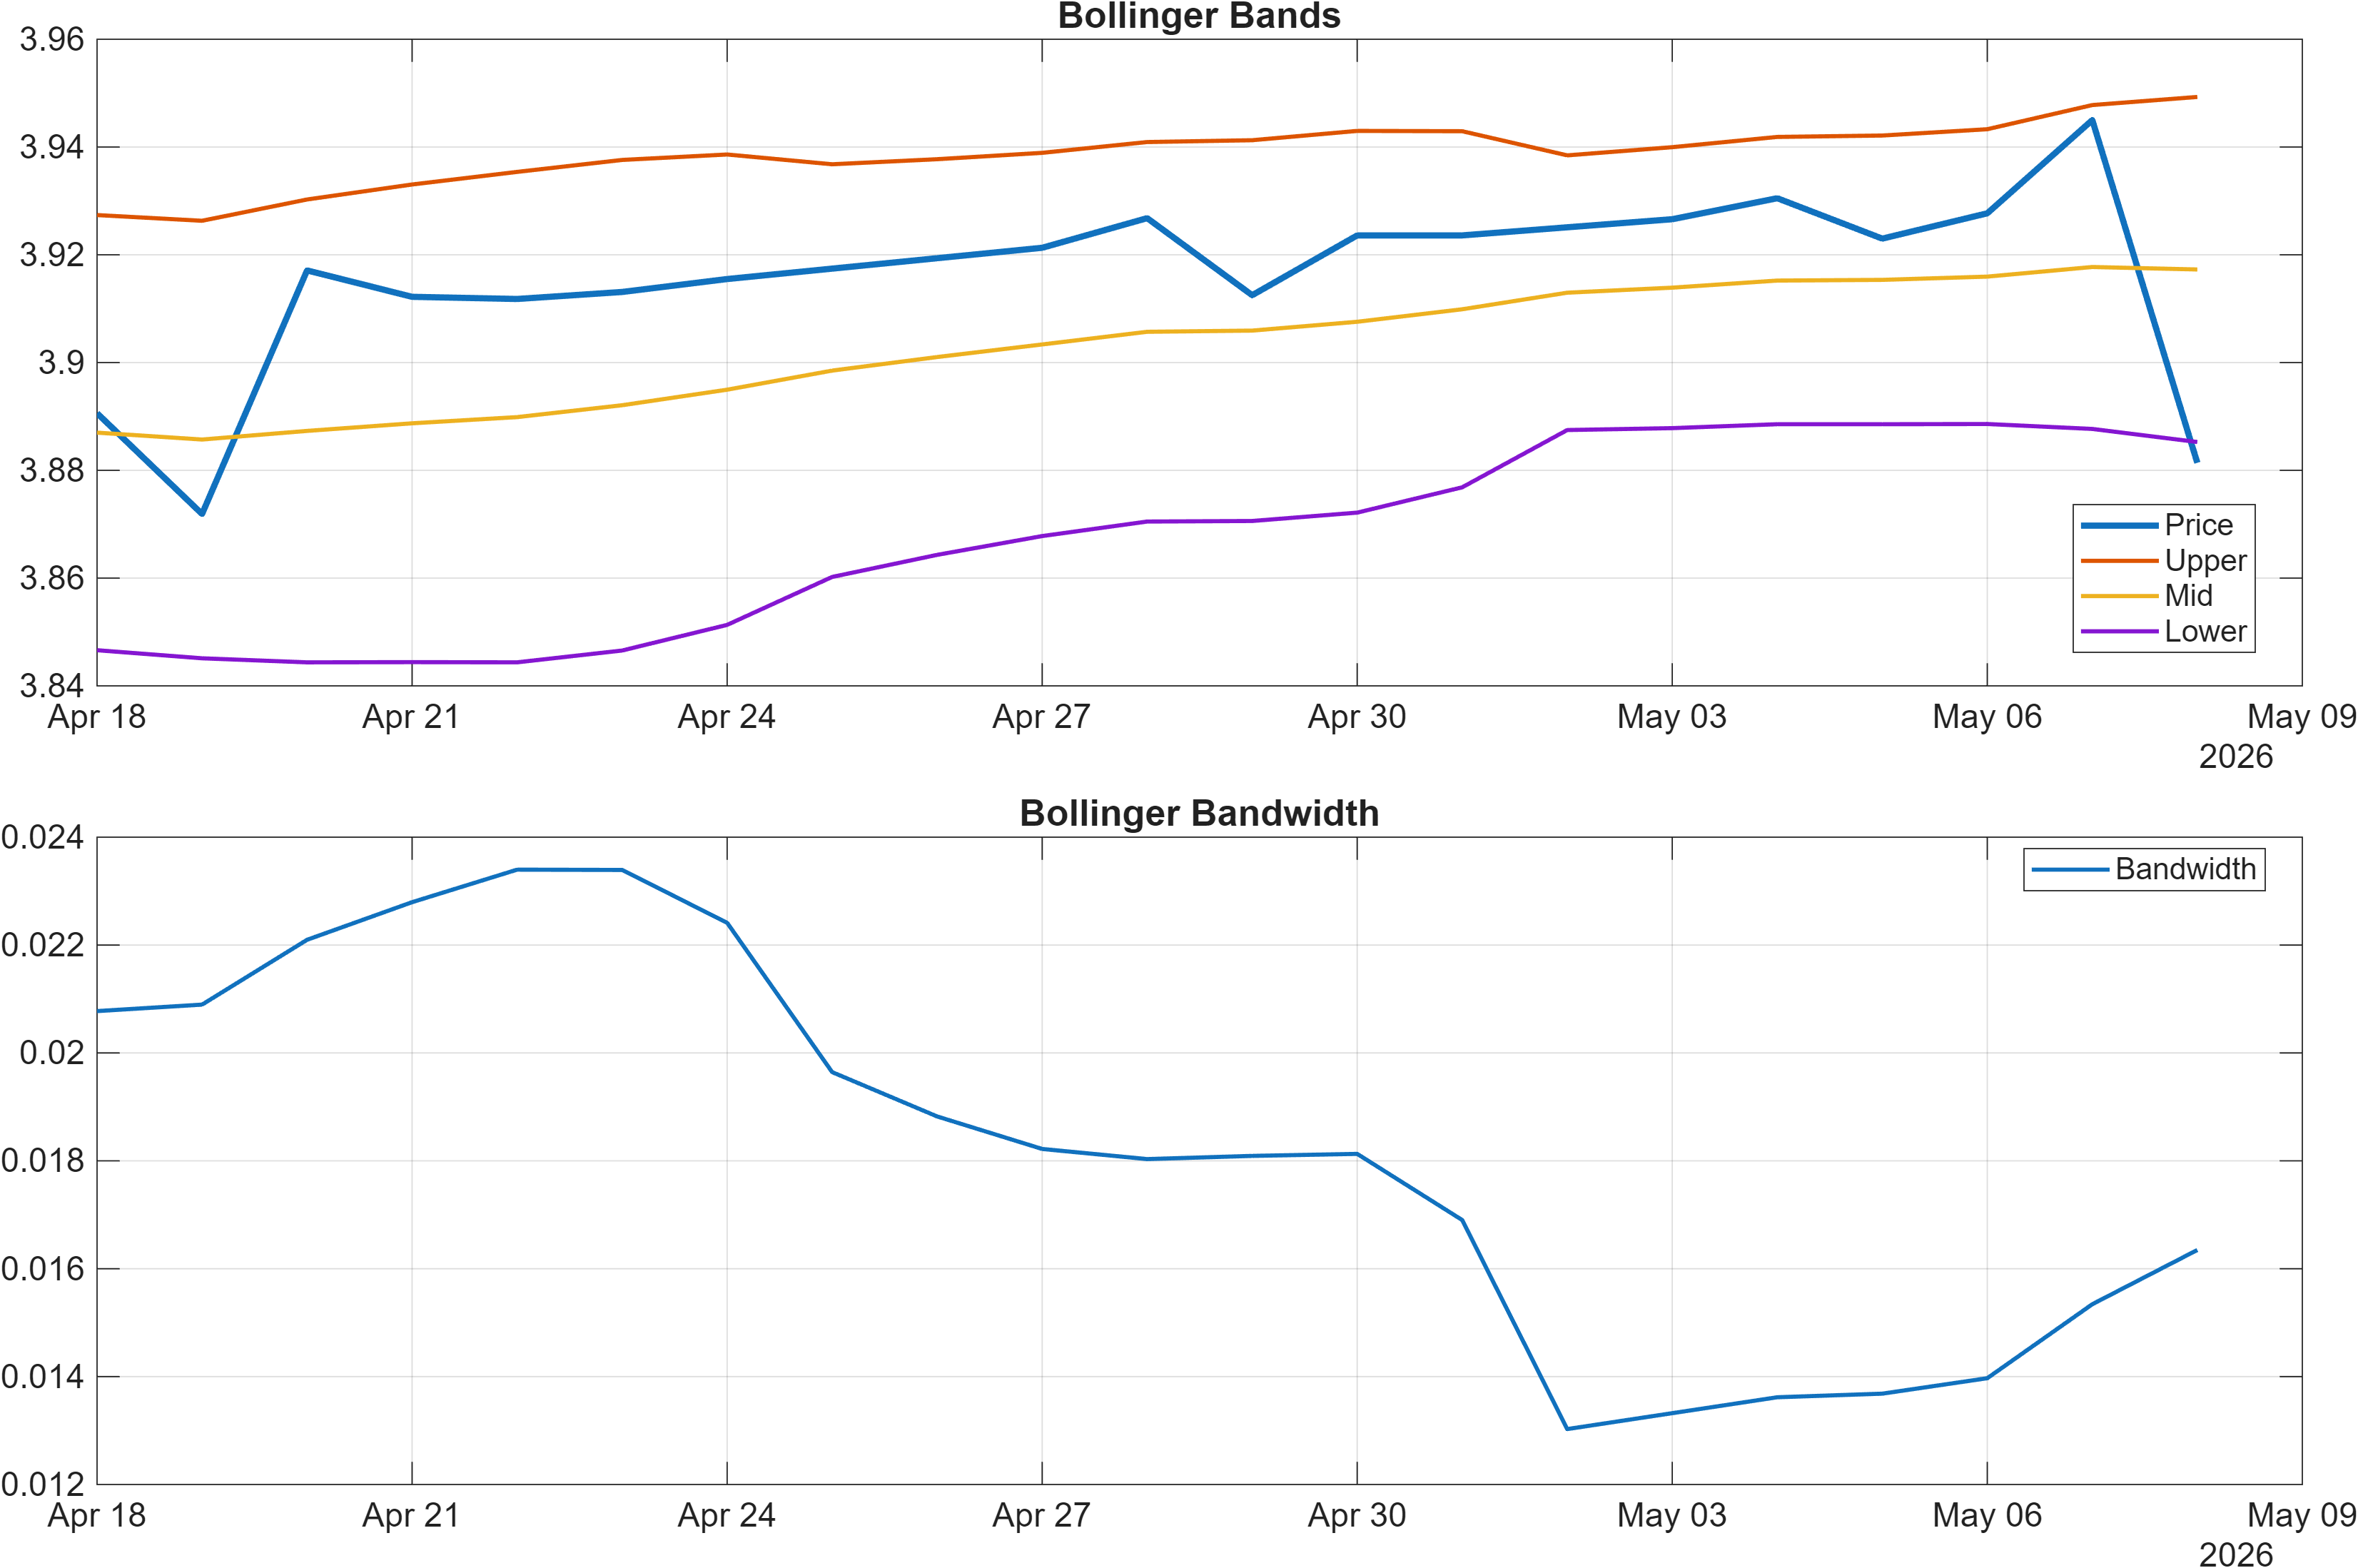
Interpretation: Bandwidth (volatility regime) latest = 0.0163.
Momentum inputs point to a market that is not yet in an expansionary impulse. RSI is explicitly described as bearish, with RSI(14) at 37.53, and the MACD histogram remains slightly negative at -0.0023 (with the signal table showing MACD Hist -0.002256, Bearish). These readings align with the “close vs MA50 = Bearish” message: short-term pressure or incomplete recovery persists.
At the same time, the dashboard does not characterize conditions as broadly risk-on or strongly directional. Volatility is relatively compressed: Bollinger bandwidth 0.0163 (and BB Width 0.01635 in the signal table) suggests a contained regime where price can oscillate around nearby levels without delivering decisive follow-through. In such regimes, indicators often swing quickly and can generate signal churn, which helps explain why the overall technical state later resolves to neutral rather than directional.
A useful nuance is the coexistence of bearish momentum markers with selective stabilization cues elsewhere in the signal set (for example, Stoch %K 1.7 is Bullish, while trend-stat measures like TS Mom(20) 0.0095 and TS Accel 0.0227 are Bullish). This is a classic alignment vs divergence setup: momentum oscillators are still heavy, but some measures are already registering improvement. Until volatility expands beyond the current bandwidth regime, the higher-quality read tends to come from level interaction (support/resistance) rather than expecting a clean momentum breakout.
4) Support / Resistance zones
Support ~ 3.8704 | Resistance ~ 3.9341
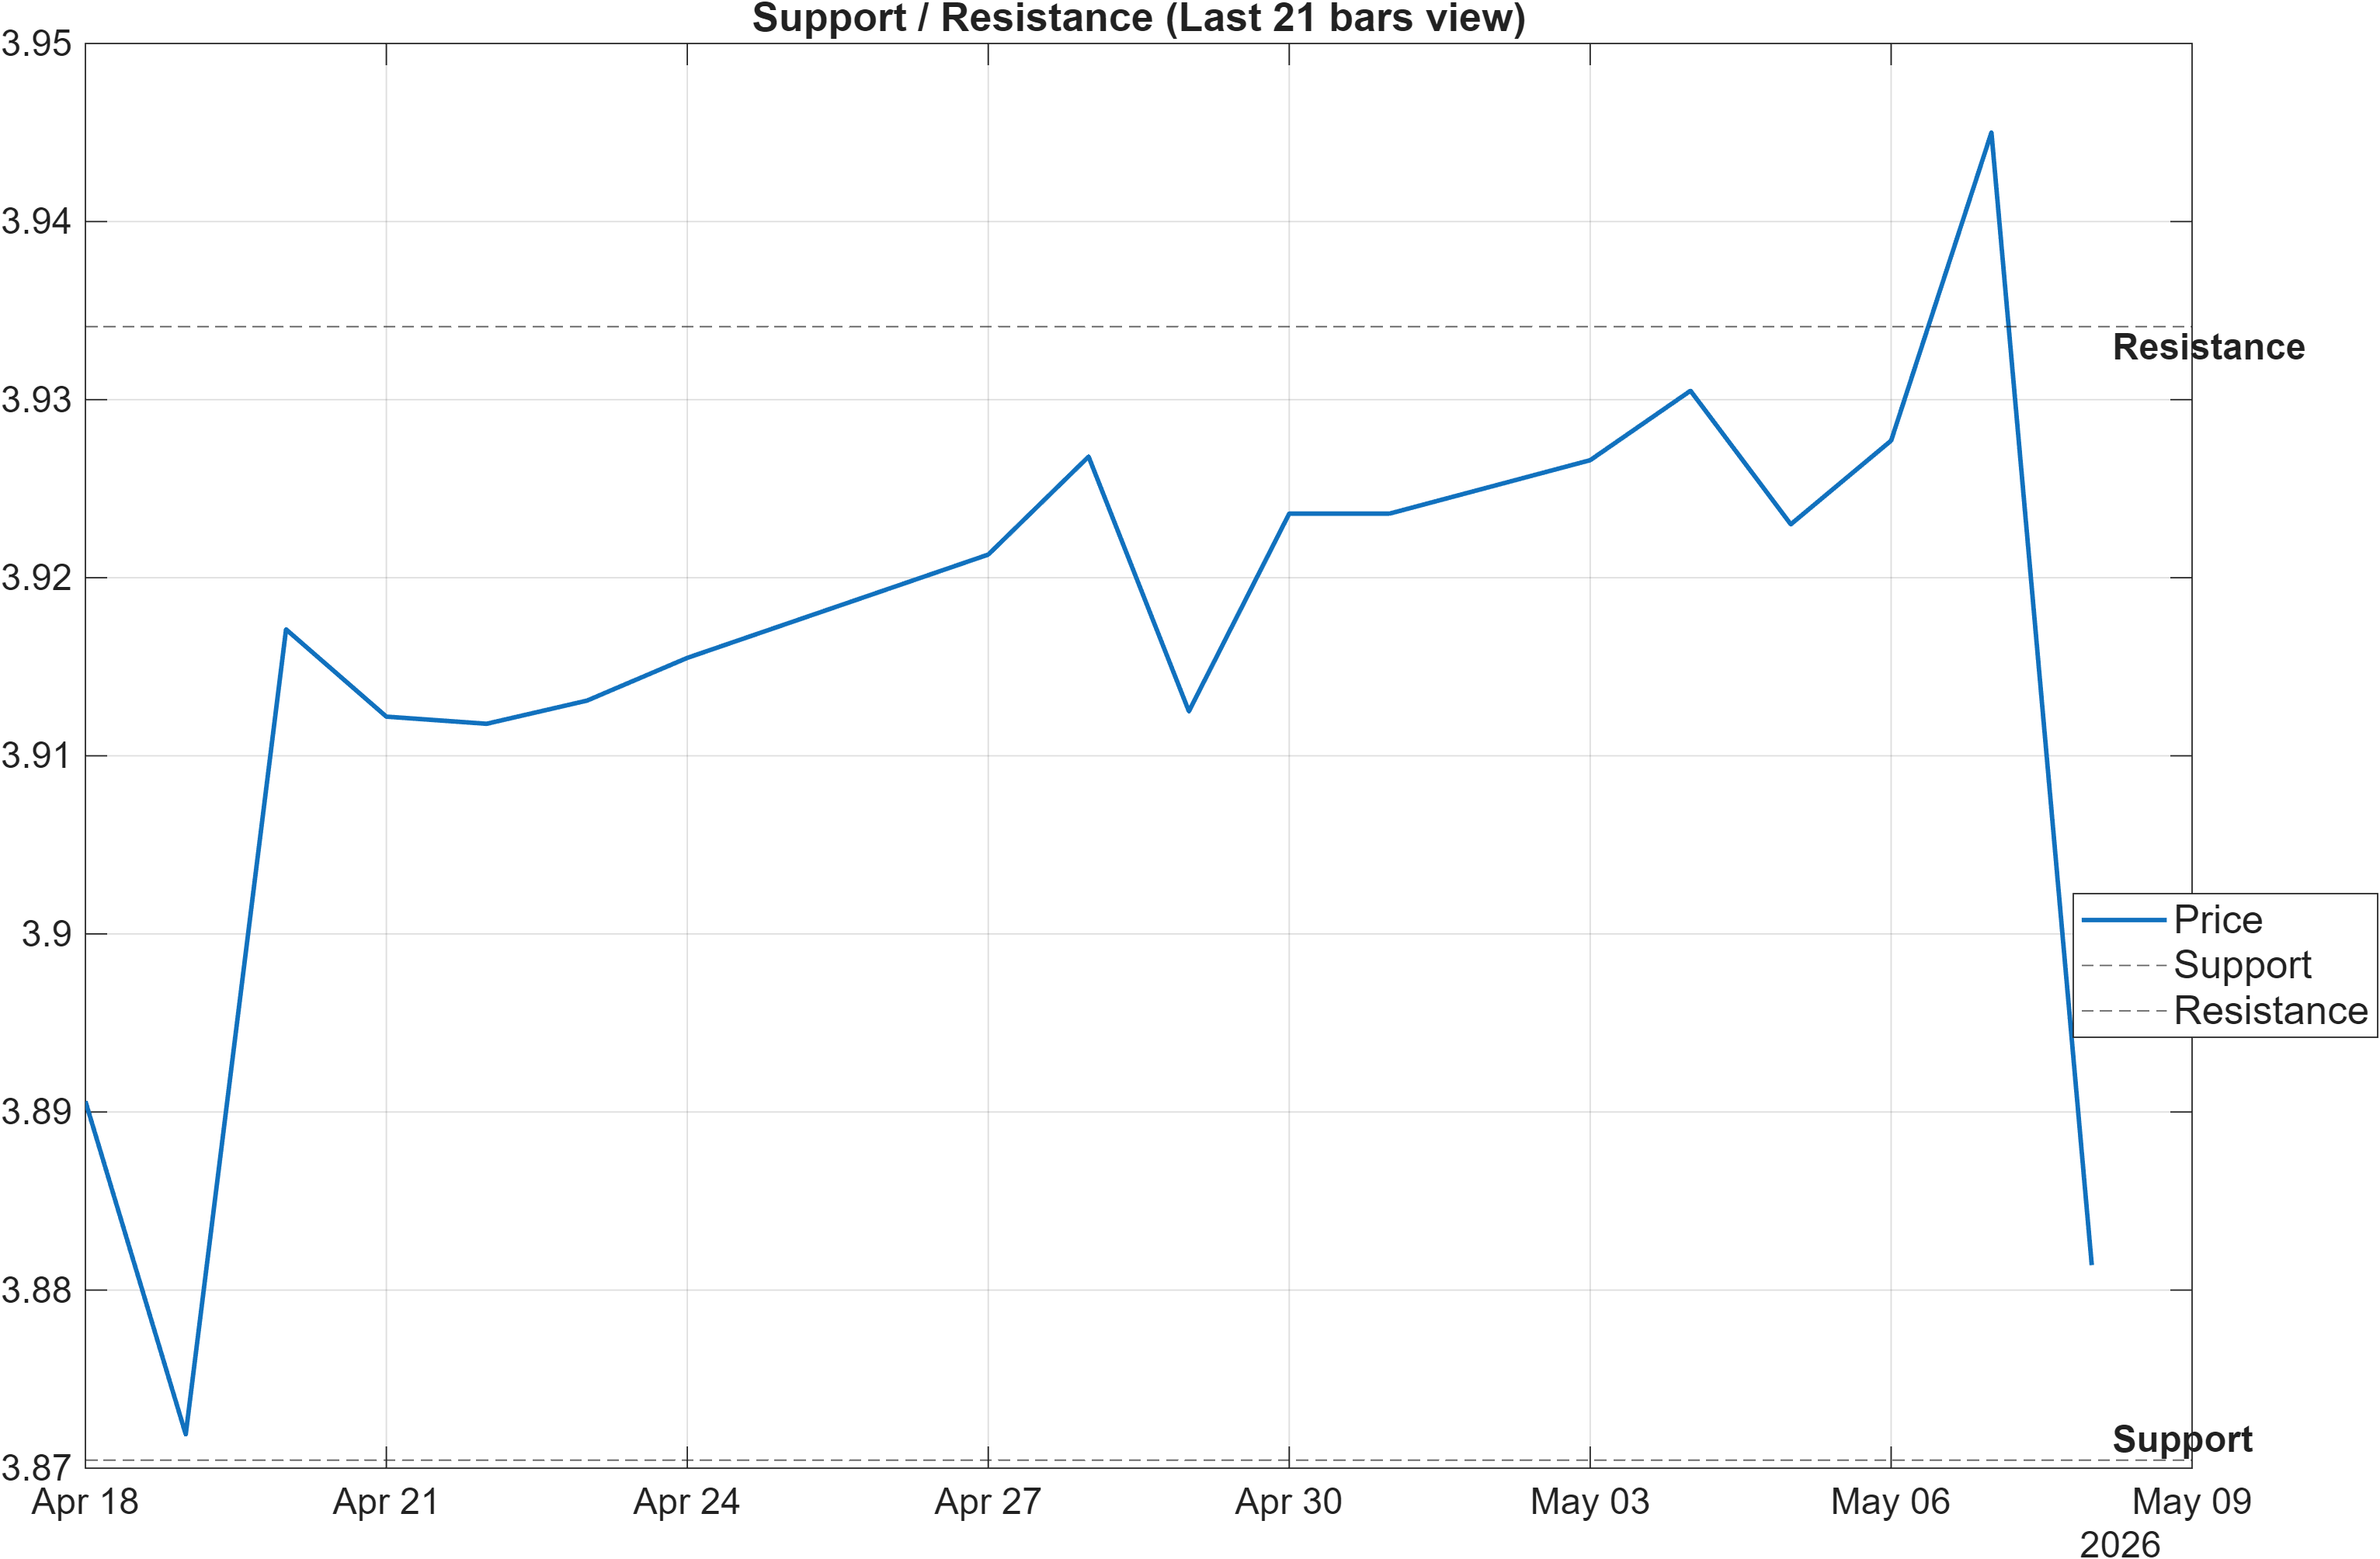
Scenario view: Break above resistance with volume → continuation. Close below support → signal deterioration risk.
With volatility contained (bandwidth 0.0163) and the blended technical score neutral (-0.019), the 3.8704–3.9341 band functions as the primary decision framework. The support at ~3.8704 is close to the 20-period low reference in the signal table (LLOW(20) 3.872), a structural detail that can strengthen the level’s relevance as a near-term risk boundary.
On the upside, resistance at ~3.9341 sits just below the 20-period high reference (HHIGH(20) 3.945), suggesting the market is operating in a relatively tight local range. In this context, a break above resistance is less about a single tick-through and more about acceptance beyond a zone that has recently defined the upper distribution of price. Conversely, a close below support would represent a failure to hold the recent lower bound, which is consistent with the report’s “deterioration risk” framing.
Importantly, the broader rank profile remains constructive on longer windows (e.g., monthly #115, yearly #102), which can bias the interpretation of support tests: if support holds, it tends to preserve the longer-window alignment even if short-term indicators remain mixed. If support fails, the weekly neutrality (#552) and bearish momentum cues (RSI 37.53, MACD hist -0.0023) become more likely to dominate the next update cycle.
5) Quant Technical Dashboard (18 Signals)
KGNAI AI Technical Analysis Score (Deep Reinforcement Learning): Rank #700 out of 965 (Rank 1 represents the strongest technical positioning and a higher probability of favorable price behavior. As ranks increase toward the maximum, the probability of favorable outcomes weakens and bearish positioning becomes more dominant.) | Label: Neutral | Score: -0.451
18-Signal Technical Confluence Score: 0.167 (Neutral)
Overall Technical Score (18-signal confluence + DRL rank blend): -0.019 (Neutral)
Note: The blended score reflects signal strength weighted against broader AI technical ranking, which may temporarily diverge.
Blended technical score breakdown: -0.019 (Neutral | Bull 6 / Bear 3 / Neutral 9)
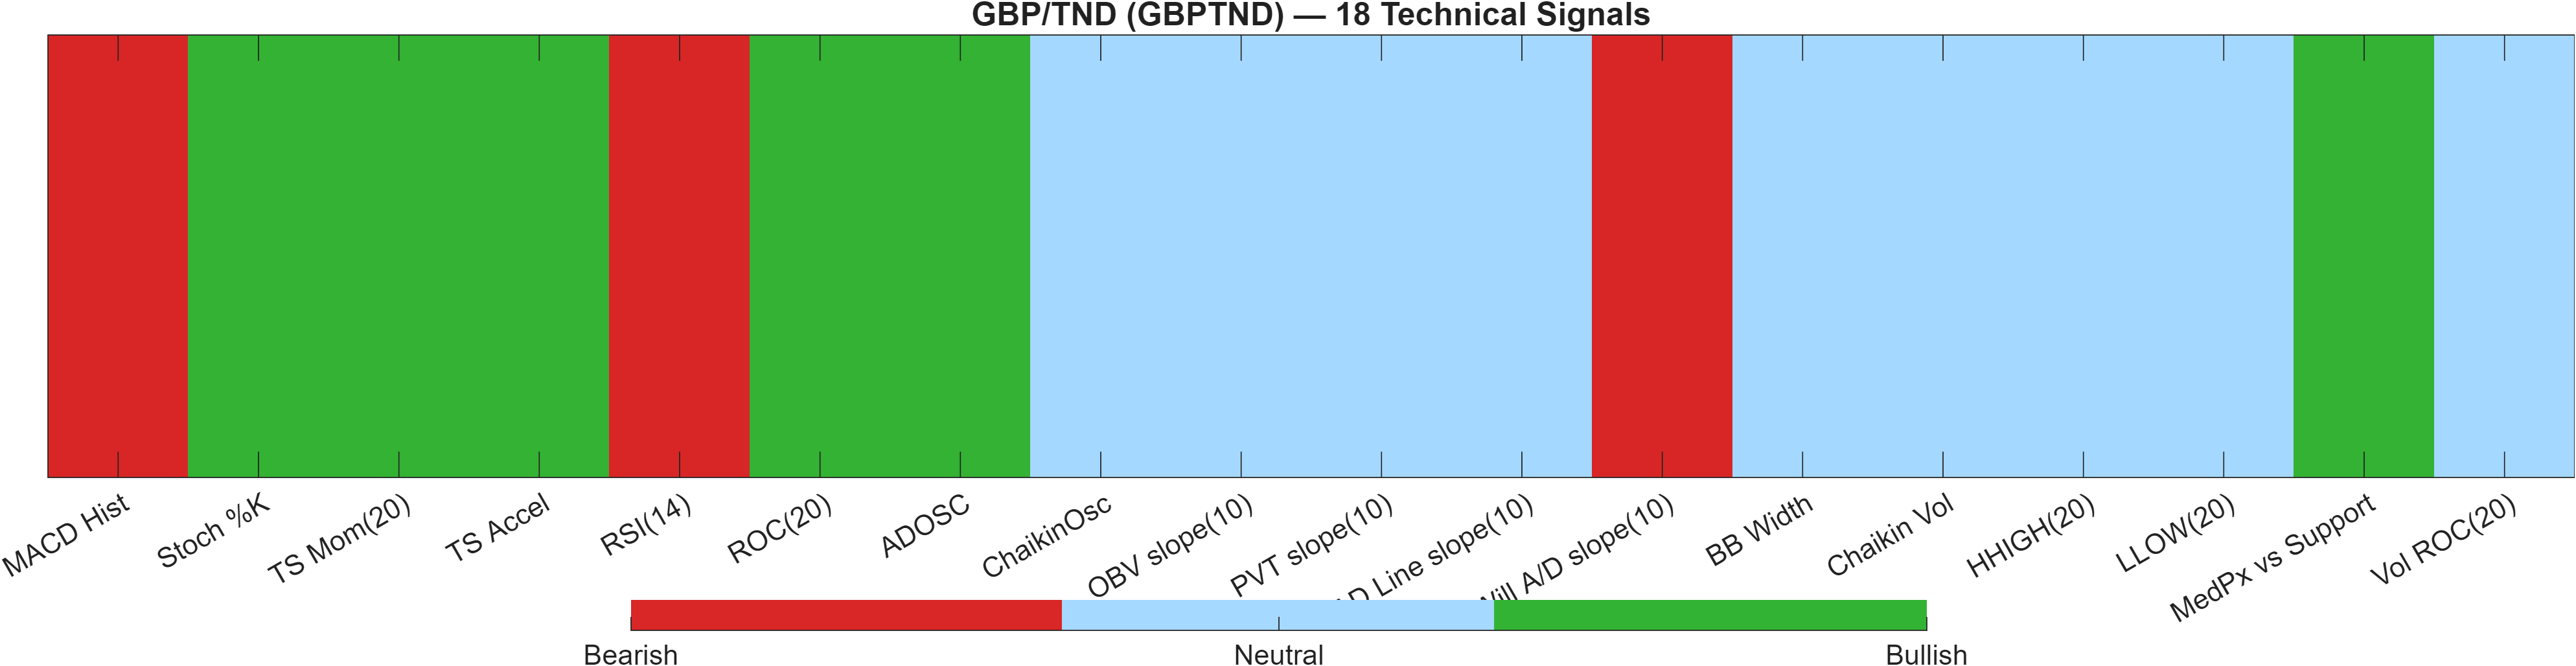
Signal-level alignment: neutral center with selective momentum skew
The technical dashboard is notable for neutral clustering rather than strong one-sided agreement. The 18-signal confluence score of 0.167 is neutral, and the blended score remains effectively flat at -0.019. The breakdown (Bull 6 / Bear 3 / Neutral 9) supports the view that the market is not presenting broad confirmation across independent signal families.
The second layer—the DRL technical rank—adds a more cautious overlay: rank #700 out of 965 with a score of -0.451 (Neutral label). That placement sits in the weaker portion of the universe and helps explain why a modestly positive confluence score can still resolve into an overall neutral stance. In other words, signal agreement exists, but the broader technical context is not yet strong enough to convert that agreement into a more constructive blended read.
Within the indicator mix, the main friction is momentum vs stabilization. Bearish flags include RSI(14) 37.53 and MACD Hist -0.002256, while bullish components include TS Mom(20) 0.0095, TS Accel 0.0227, and ROC(20) 0.2454. This is consistent with a market attempting to turn without yet achieving decisive trend confirmation—an outcome also consistent with “close vs MA50 = Bearish” while “MA50 vs MA200 = Bullish.”
Signal table (Bull/Bear/Neutral)
| Indicator | Value | Signal |
|---|---|---|
| MACD Hist | -0.002256 | Bearish |
| Stoch %K | 1.7 | Bullish |
| TS Mom(20) | 0.0095 | Bullish |
| TS Accel | 0.0227 | Bullish |
| RSI(14) | 37.53 | Bearish |
| ROC(20) | 0.2454 | Bullish |
| ADOSC | 80.56 | Bullish |
| ChaikinOsc | 0 | Neutral |
| OBV slope(10) | 0 | Neutral |
| PVT slope(10) | 0 | Neutral |
| AD Line slope(10) | 0 | Neutral |
| Will A/D slope(10) | -0.0418 | Bearish |
| BB Width | 0.01635 | Neutral |
| Chaikin Vol | -3.845 | Neutral |
| HHIGH(20) | 3.945 | Neutral |
| LLOW(20) | 3.872 | Neutral |
| MedPx vs Support | 0.01075 | Bullish |
| Vol ROC(20) | — | Neutral |
Interpretation: Indicator-level signals form the base confluence, which is then adjusted using a separate AI-driven technical ranking model. The final technical score summarizes this combined view.
6) News sentiment + extractive gist
Note: Instrument-specific news matches were not found, so the digest includes broader market/sector headlines. Links are provided for verification.
Sentiment score (avg): 0.007 | Positive: 19% | Neutral: 56% | Negative: 25%
KGNAI AI News Sentiment Score (normalized -1 to +1): Not available (as of —) | Label: Not available | Overall news score: 0.01
Positive Developments
Recent coverage across major financial outlets indicates a modestly constructive backdrop for risk markets at the margin, shaped less by GBPTND-specific drivers and more by broader FX and macro narratives. Reports highlighting intermittent de-escalation expectations in geopolitical tensions and pockets of resilience in global activity data can reduce immediate risk aversion and keep cross-asset volatility from accelerating. In that environment, price action in FX pairs often becomes more sensitive to local technical levels—consistent with GBPTND’s current neutral technical blend (-0.019) and relatively contained volatility regime (Bollinger bandwidth 0.0163). While the sentiment distribution remains mostly neutral (56%), the positive share (19%) suggests supportive headlines are present, even if not dominant. The result is a news tape that can support stabilization without necessarily generating a sustained directional impulse on its own.
Neutral / Mixed Developments
The dominant news character is informational rather than catalytic, reflected in the neutral majority (56%) and a near-flat average sentiment (0.007). Market attention appears to be rotating around scheduled macro releases and cross-asset positioning, which tends to produce episodic volatility rather than persistent trend. For GBPTND, that nuance matters because the technical picture is already mixed: bearish near-term momentum cues (e.g., RSI(14) 37.53) sit alongside longer-horizon rank strength (e.g., yearly #102). When the news flow is mixed, technical acceptance around support ~3.8704 and resistance ~3.9341 often becomes the practical arbiter of whether short-term neutrality resolves into continuation or renewed drift.
Negative / Risk Signals
Risk coverage continues to emphasize uncertainty around geopolitical developments, inflation sensitivity via energy channels, and the policy reaction function across major central banks. Even if not GBPTND-specific, these themes can elevate FX correlation and increase the probability of sharp, short-duration moves—particularly when volatility starts from a compressed base such as 0.0163 bandwidth. The negative share of sentiment (25%) is large enough to keep a persistent risk premium embedded in the tape, which aligns with the dashboard’s cautious elements: MACD hist -0.0023 and the DRL technical rank at #700 (Neutral) suggest the technical context is not yet robust. Under a risk-off pulse, the report’s downside scenario—a close below 3.8704—becomes the key deterioration condition.
- Whether price can sustain trade above 3.9341 or repeatedly rejects that zone.
- Whether a downside move produces a close below 3.8704 (deterioration condition) or stabilizes above it.
- Whether volatility shifts from compression (bandwidth 0.0163) toward expansion alongside improved momentum (RSI and MACD behavior).
Sources referenced: Reuters, Bloomberg, Yahoo Finance, MarketWatch, Investing.com
Snapshot: AI Rank (Short–Mid–Long): Mixed (Bullish tilt) (Neutral–Bullish–Bullish) · Technical Confluence: Neutral · Key Levels: Support ~3.87 | Resistance ~3.93 · News Sentiment: Neutral
7) Sources
- Gold holds above $4,700, close to two-week top as USD bulls seem hesitant ahead of US NFP — https://www.fxstreet.com/news/gold-holds-above-4-700-close-to-two-week-top-as-usd-bulls-seem-hesitant-ahead-of-us-nfp-202605080431
- AUD/JPY Price Forecast: Advances on improved risk sentiment, holds bullish bias above 100-day EMA — https://www.fxstreet.com/news/aud-jpy-price-forecast-advances-on-improved-risk-sentiment-holds-bullish-bias-above-100-day-ema-202605080427
- US Nonfarm Payrolls expected to rise by 62K in April — https://www.fxstreet.com/news/us-nonfarm-payrolls-expected-to-rise-by-62k-in-april-202605080400
- Asian stock markets slump on renewed uncertainty over Middle East conflicts — https://www.fxstreet.com/news/asian-stock-markets-slump-on-renewed-uncertainty-over-middle-east-conflicts-202605080352
- EUR/JPY Price Forecast: Hovers around 184.00 as near-term bearish bias maintains — https://www.fxstreet.com/news/eur-jpy-price-forecast-hovers-around-18400-as-near-term-bearish-bias-maintains-202605080338
- Japanese Yen gathers strength on reports of FX intervention during May holidays — https://www.fxstreet.com/news/japanese-yen-gathers-strength-as-japan-intervened-in-fx-market-again-202605080334
- Japan intervened in FX market again during May holidays – Reuters — https://www.fxstreet.com/news/japan-intervened-in-fx-market-again-during-may-holidays-reuters-202605080319
- US Dollar Index slips to near 98.00 as renewed US-Iran tensions de-escalate — https://www.fxstreet.com/news/us-dollar-index-slips-to-near-9800-as-renewed-us-iran-tensions-de-escalate-202605080224
You may also like: How KGNAI AI ranks instruments across global markets
Disclaimer: KGNAI provides AI-generated analytics and educational market commentary only. This is not financial advice. Markets involve risk. Always do your own research.