
HKDPKR (Hong Kong Dollar/Pakistani Rupee) — 19-Apr-2026 Technical & Rank Read: Range-Bound Price With Bearish Technical Tilt
HKDPKR is currently presenting a split profile across horizons: short- and mid-term ranks remain Neutral, while longer-horizon ranks lean Bullish (including a Yearly rank of #4 in a 963-instrument universe). That long-term relative strength is not yet mirrored by the near-term technical stack, where moving-average structure is flagged as Bearish and the blended technical read is also Bearish despite a Neutral 18-signal confluence. Momentum is not decisively directional—RSI(14) 52.26 is neutral—yet the MACD histogram at -0.0036 indicates mild downside pressure. Volatility remains compressed with Bollinger bandwidth at 0.0076, reinforcing a “wait for confirmation” regime. The most actionable framework is therefore level-driven: the market is boxed between support ~35.5431 and resistance ~35.8580, where breaks or failed tests carry higher informational value than incremental oscillations inside the band.
Key Takeaways
- Rank stance: Short-term Neutral | Mid-term Neutral | Long-term Bullish (Yearly #4; 6-Monthly #17)
- Technical confluence: 18-signal score -0.111 Neutral; blended overall -0.319 Bearish
- Key levels: Support 35.5431 | Resistance 35.8580
- News sentiment bias: Neutral (avg 0.040; 19% positive, 81% neutral, 0% negative)
- Confirmation / invalidation: A sustained move above 35.8580 supports continuation conditions; a close below 35.5431 increases deterioration risk.
What KGNAI Measures
KGNAI evaluates assets using large cross-sectional datasets built from millions of structured data points. Inputs incorporate fundamental metrics, technical structures, and systematically processed news sentiment. Statistical models, machine learning, and AI frameworks are used to assess relative positioning, signal alignment, and probabilistic behavior across broad universes.
How to Read This Report
- Ranks are comparative across the tracked universe, not absolute price targets.
- Confluence reflects alignment among independent signal groups.
- Support/resistance levels are probabilistic decision zones, not guarantees.
- Sentiment provides contextual bias within the broader analytical framework.
1) KGNAI AI Analysis
Region: FOREX
Total universe size: 963 ranked instruments
- Daily rank: #219 out of 963 — Neutral
- Weekly rank: #552 out of 963 — Neutral
- Monthly rank: #266 out of 963 — Neutral
- 3-Monthly rank: #79 out of 963 — Bullish
- 6-Monthly rank: #17 out of 963 — Bullish
- Yearly rank: #4 out of 963 — Bullish
Cross-horizon rank structure: long-duration strength vs near-term neutrality
The rank term-structure is the key feature of this profile. Near-term readings remain non-committal: the Daily rank (#219), Weekly rank (#552), and Monthly rank (#266) all sit in Neutral territory, implying HKDPKR is not currently displaying standout short-cycle behavior versus its 963-instrument peer set. By contrast, the longer horizons are decisively stronger: 3-Monthly (#79) shifts into bullish relative positioning, the 6-Monthly (#17) pushes into the top-tier cohort, and the Yearly (#4) places it at the extreme front of the universe.
This configuration is commonly associated with a market that has demonstrated favorable longer-run behavior but is now in a digestion phase—where short-cycle signals may oscillate without translating into sustained trend extension. Practically, it raises the bar for short-term signal-chasing: when short ranks are neutral while long ranks are strong, the higher-quality setups often come from confirmation at decision levels rather than from incremental momentum readings inside a range.
The stated term view (Short-term: Neutral, Mid-term: Neutral, Long-term: Bullish) is consistent with this interpretation: the long-run relative context remains constructive, but the near-term evidence does not yet demand a directional stance.
KGNAI ranks each instrument across large universes using multiple proprietary AI tests and statistical models (millions of data points). Lower ranks generally indicate stronger probability of favorable performance behavior, while higher ranks indicate weaker probability and more bearish positioning.
Term view: Short-term: Neutral. Mid-term: Neutral. Long-term: Bullish.
Want the full universe and complete rank tables? Unlock full access on KGNAI: https://www.kgnai.com/pricing
2) Price & trend overview
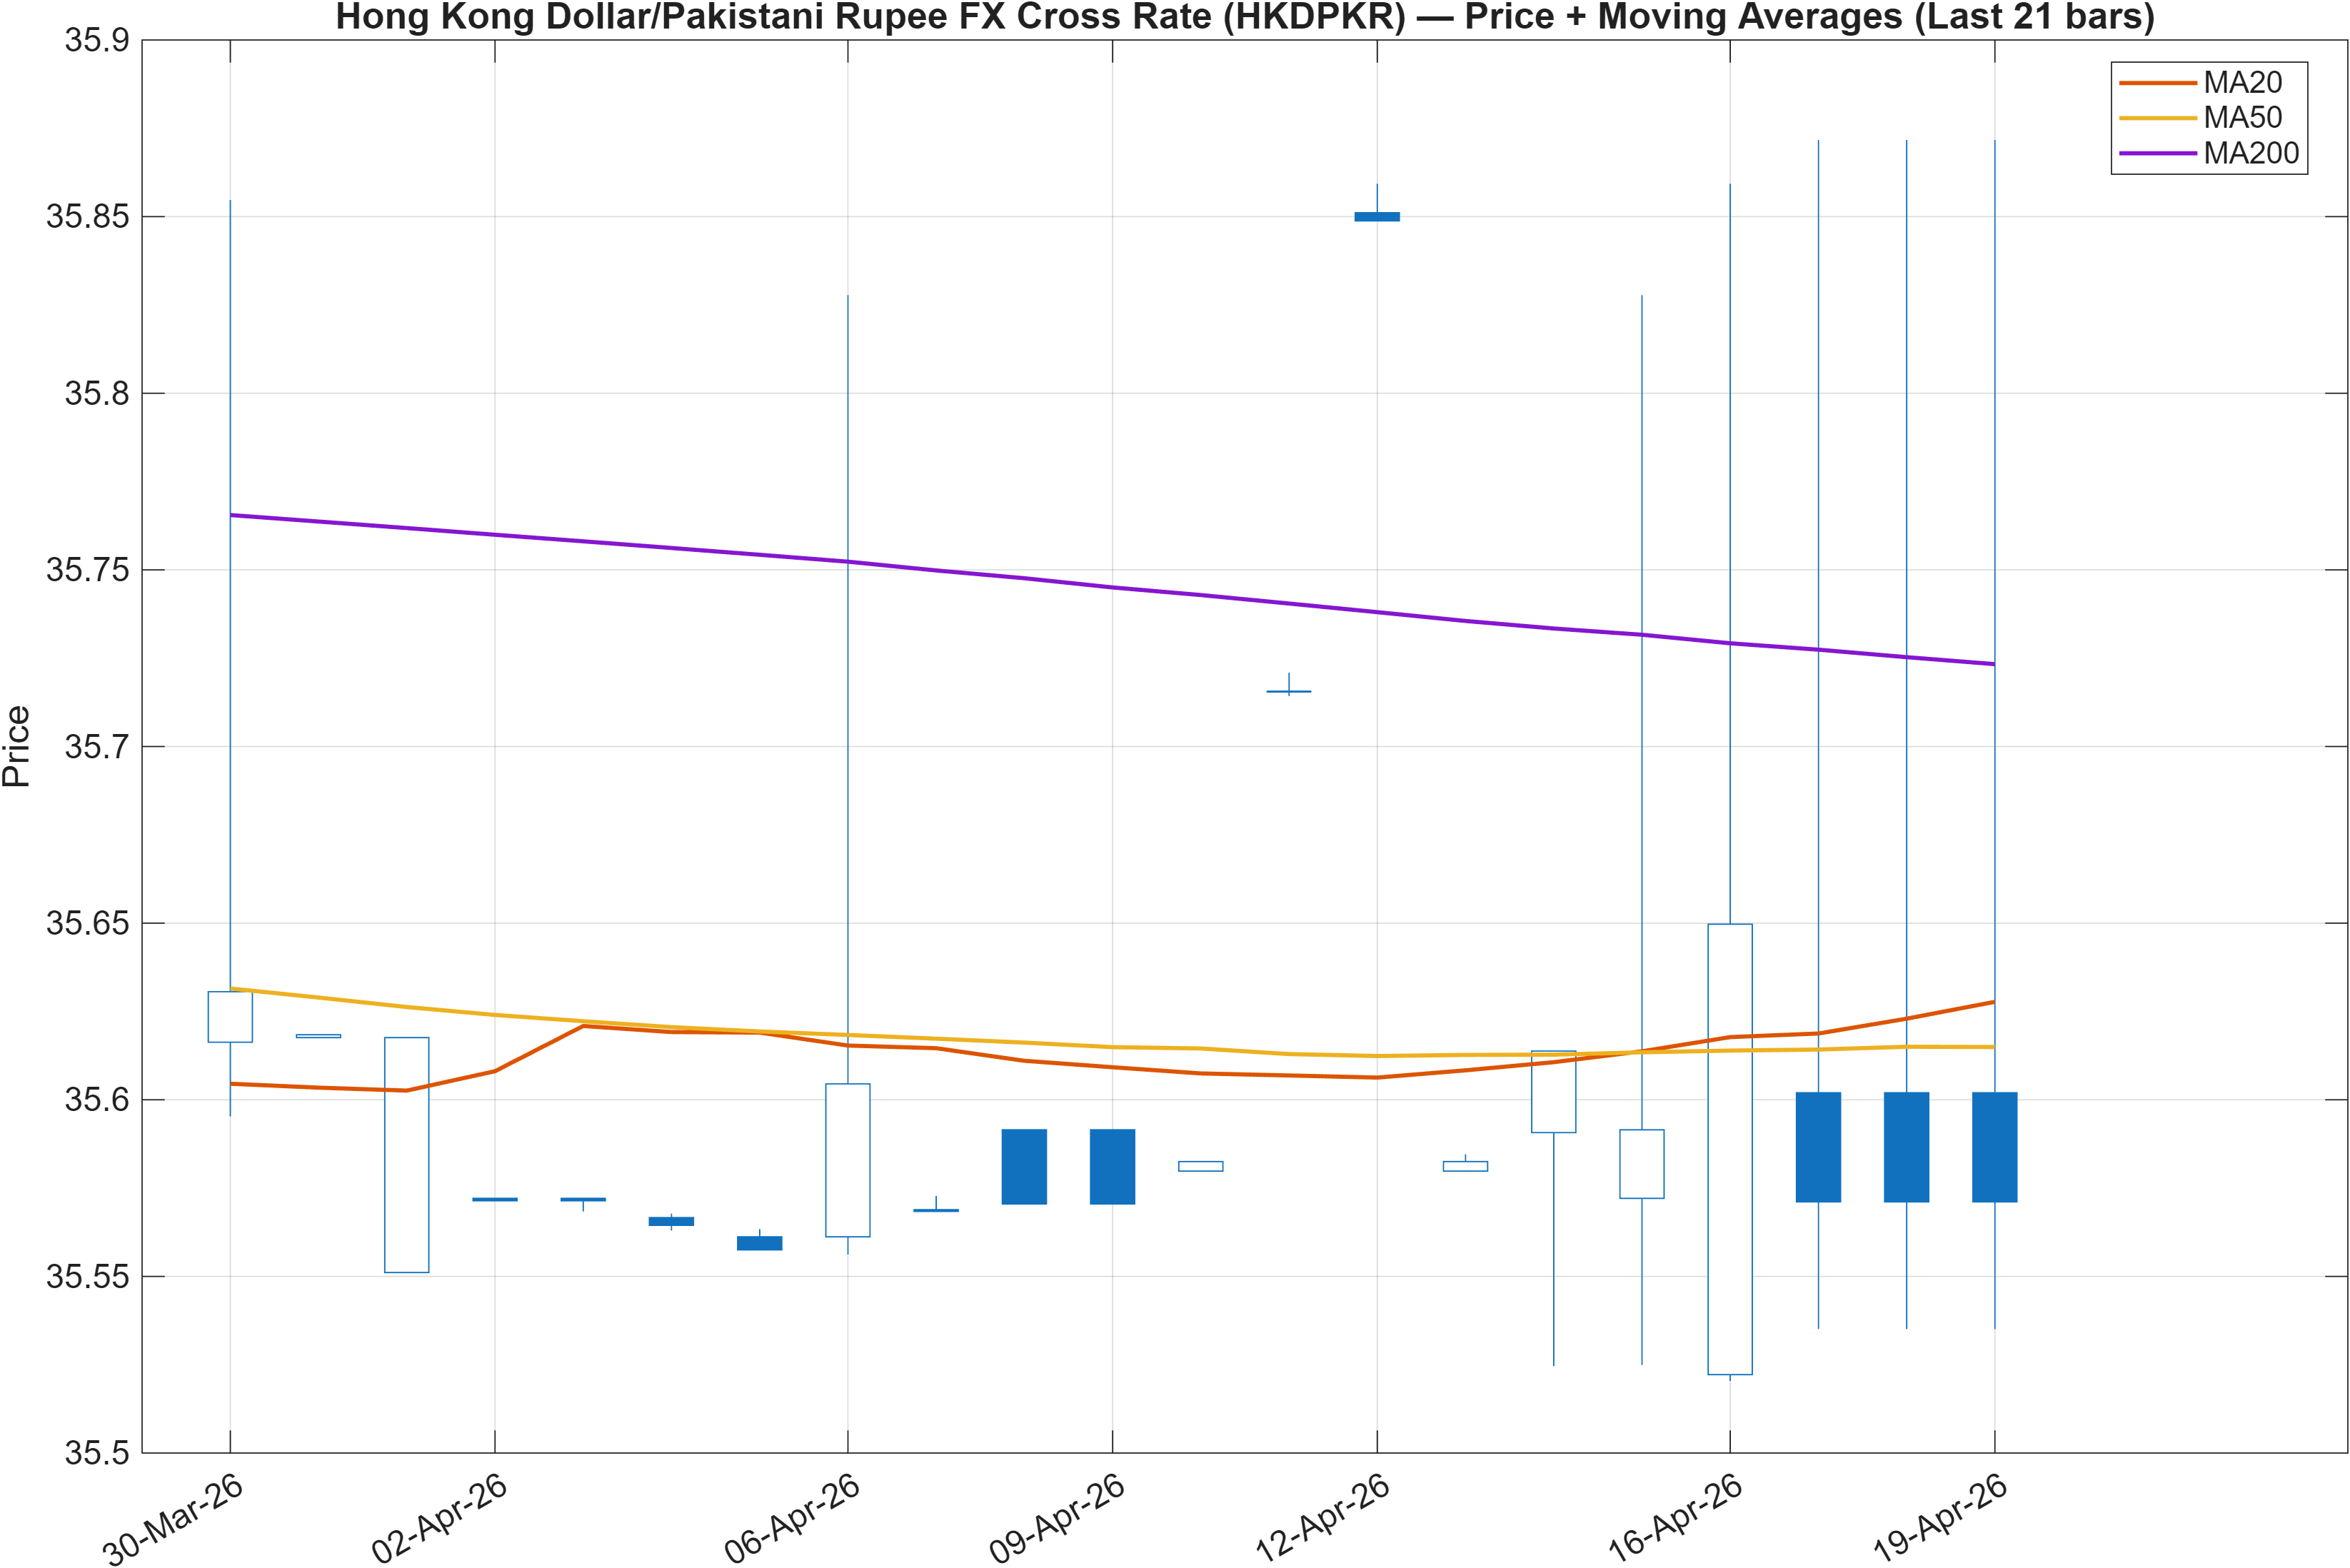
Trend filter: moving-average structure conflicts with long-horizon ranks
The trend filter is currently the main source of caution. Price positioning is flagged as Close vs MA50 = Bearish, and the longer trend relationship is also negative with MA50 vs MA200 = Bearish. In other words, even if the broader cross-sectional ranks are strong on a 6–12 month basis (notably #17 and #4), the moving-average stack is not confirming a clean, persistent uptrend in the present window.
For a sideways regime, this combination often indicates that rallies may be more vulnerable to mean reversion unless a catalyst pushes price back above the intermediate trend proxy (MA50) and keeps it there. It also helps explain why short-term ranks remain neutral: when MA relationships are bearish, short-cycle bursts can struggle to translate into sustained trend continuation, particularly if volatility stays compressed (as corroborated later by Bollinger bandwidth 0.0076).
The practical implication is that HKDPKR is better approached through regime identification: treat the market as range-first until either (a) trend filters repair, or (b) price breaks key resistance with follow-through. Until then, directional conviction is mostly a function of how price behaves around the predefined zones (35.5431 and 35.8580) rather than a function of trend extrapolation.
Interpretation: Close vs MA50 = Bearish, MA50 vs MA200 = Bearish.
3) Momentum & volatility dashboard
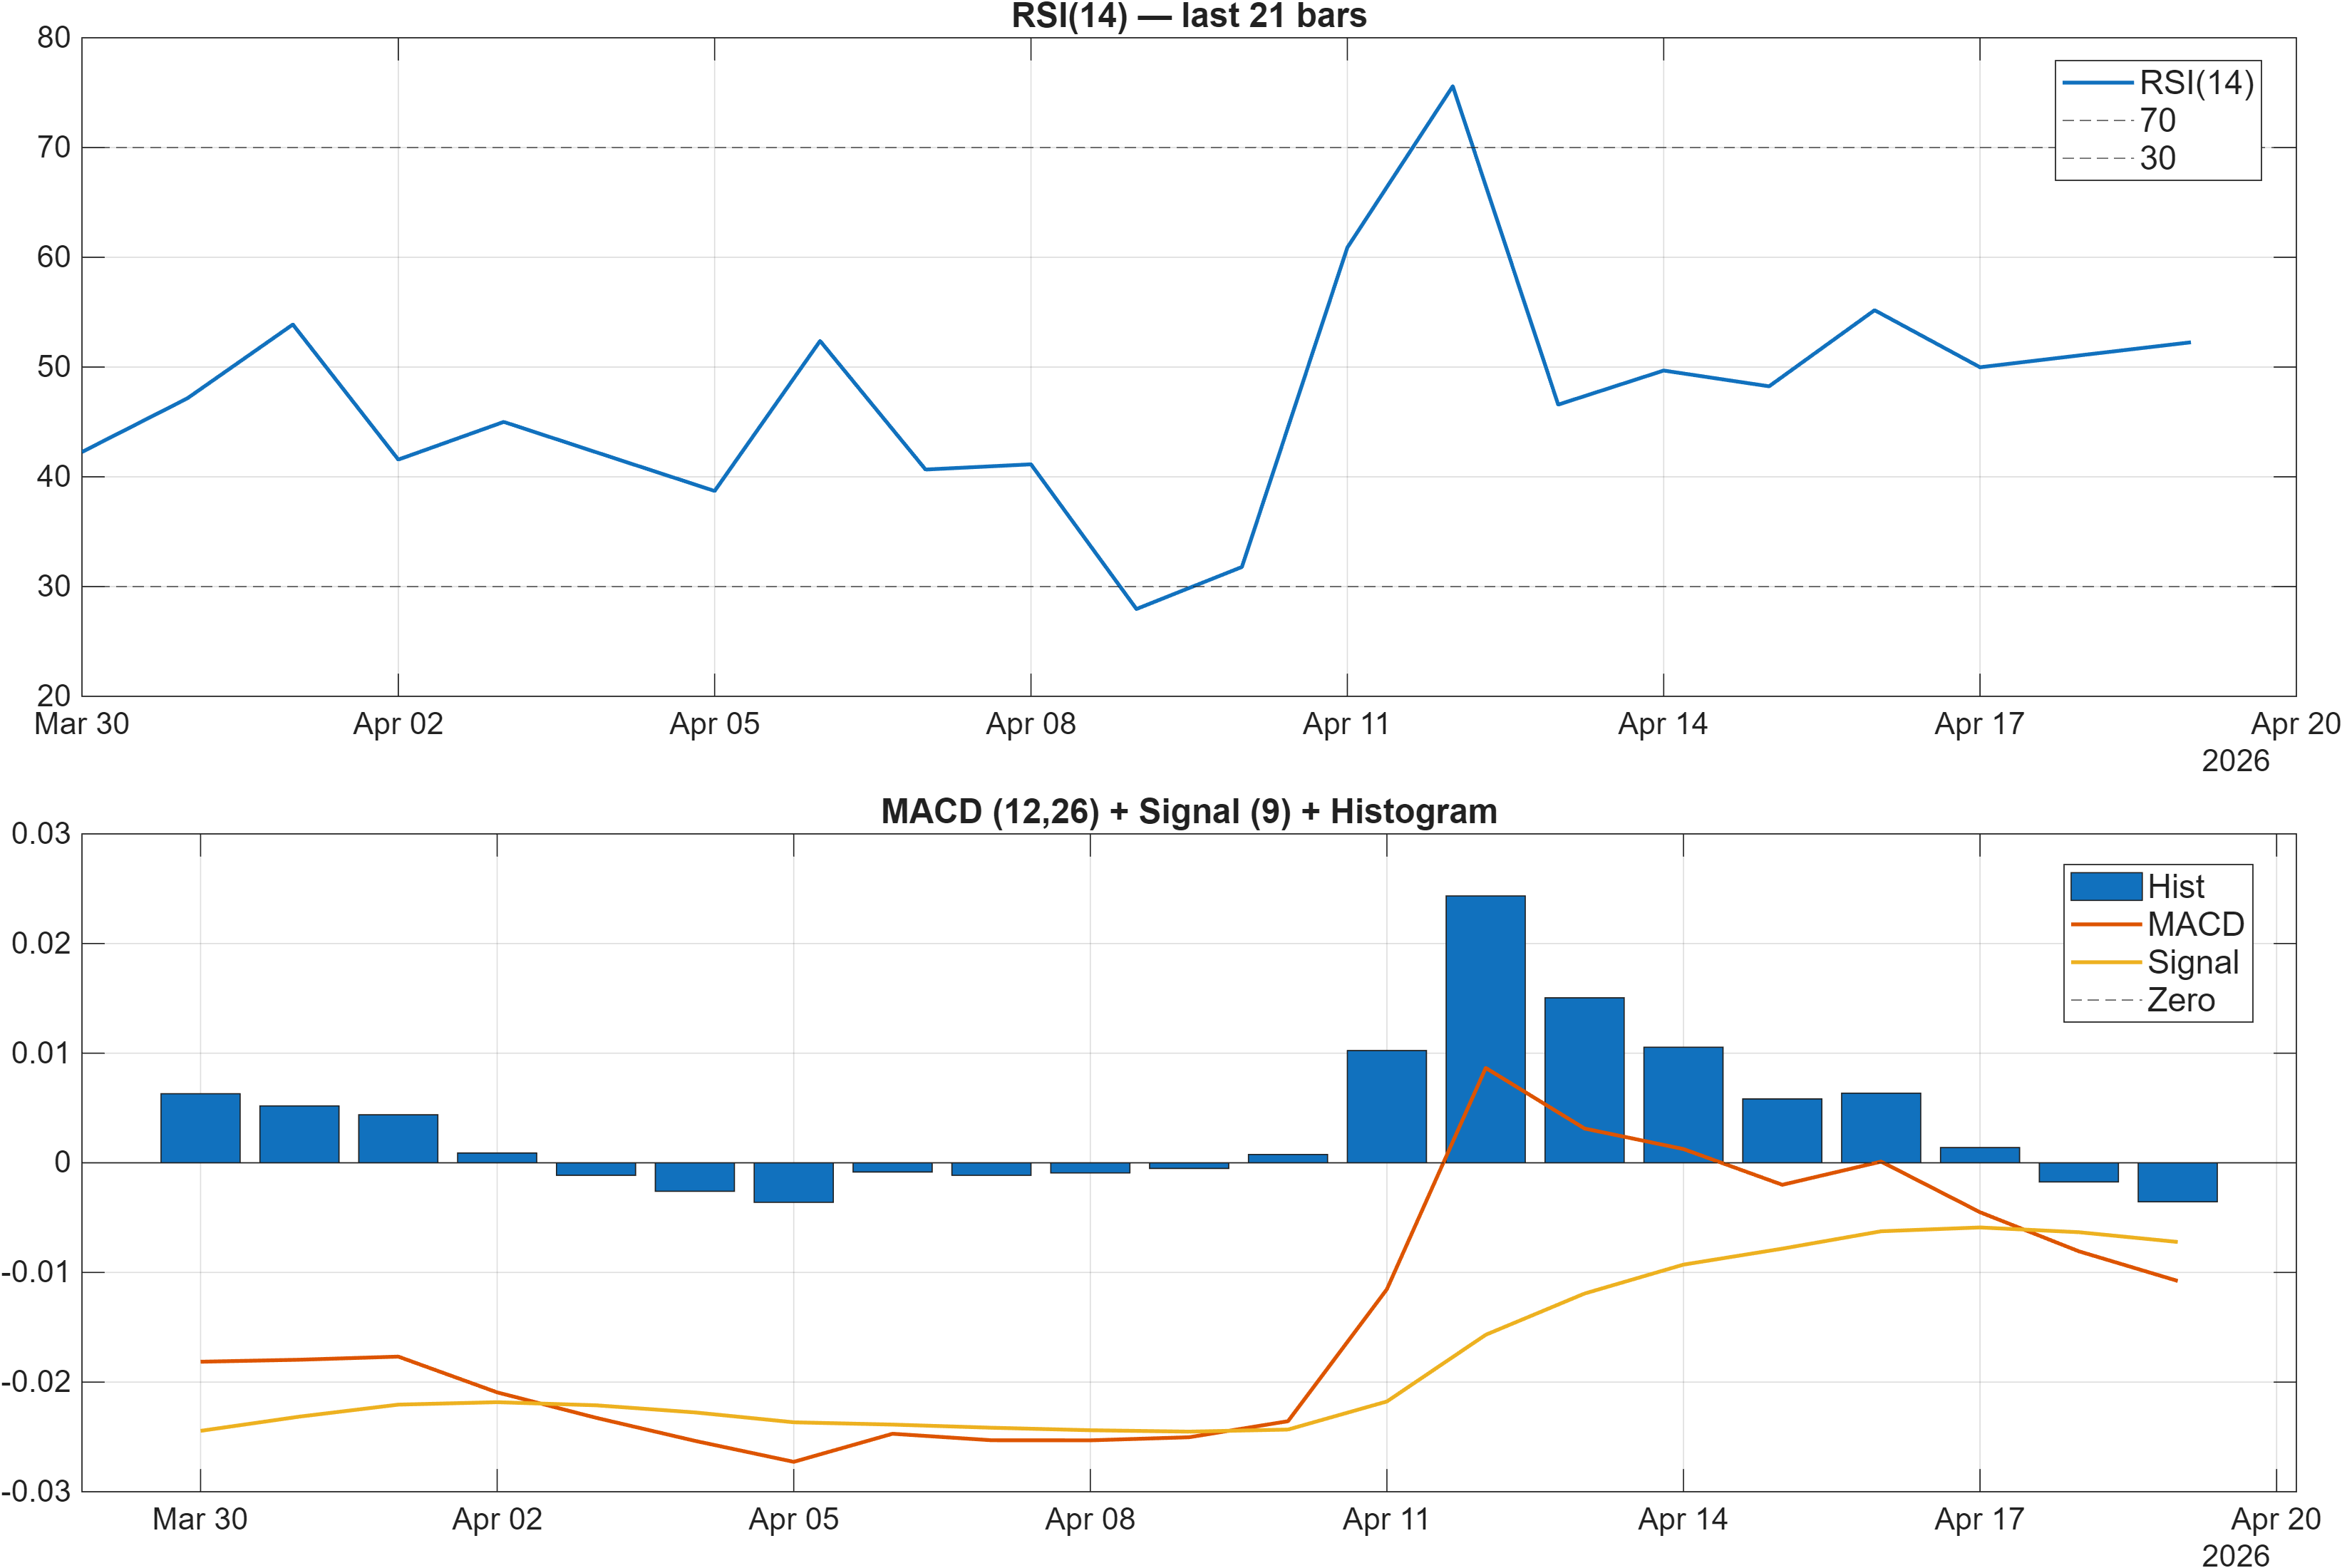
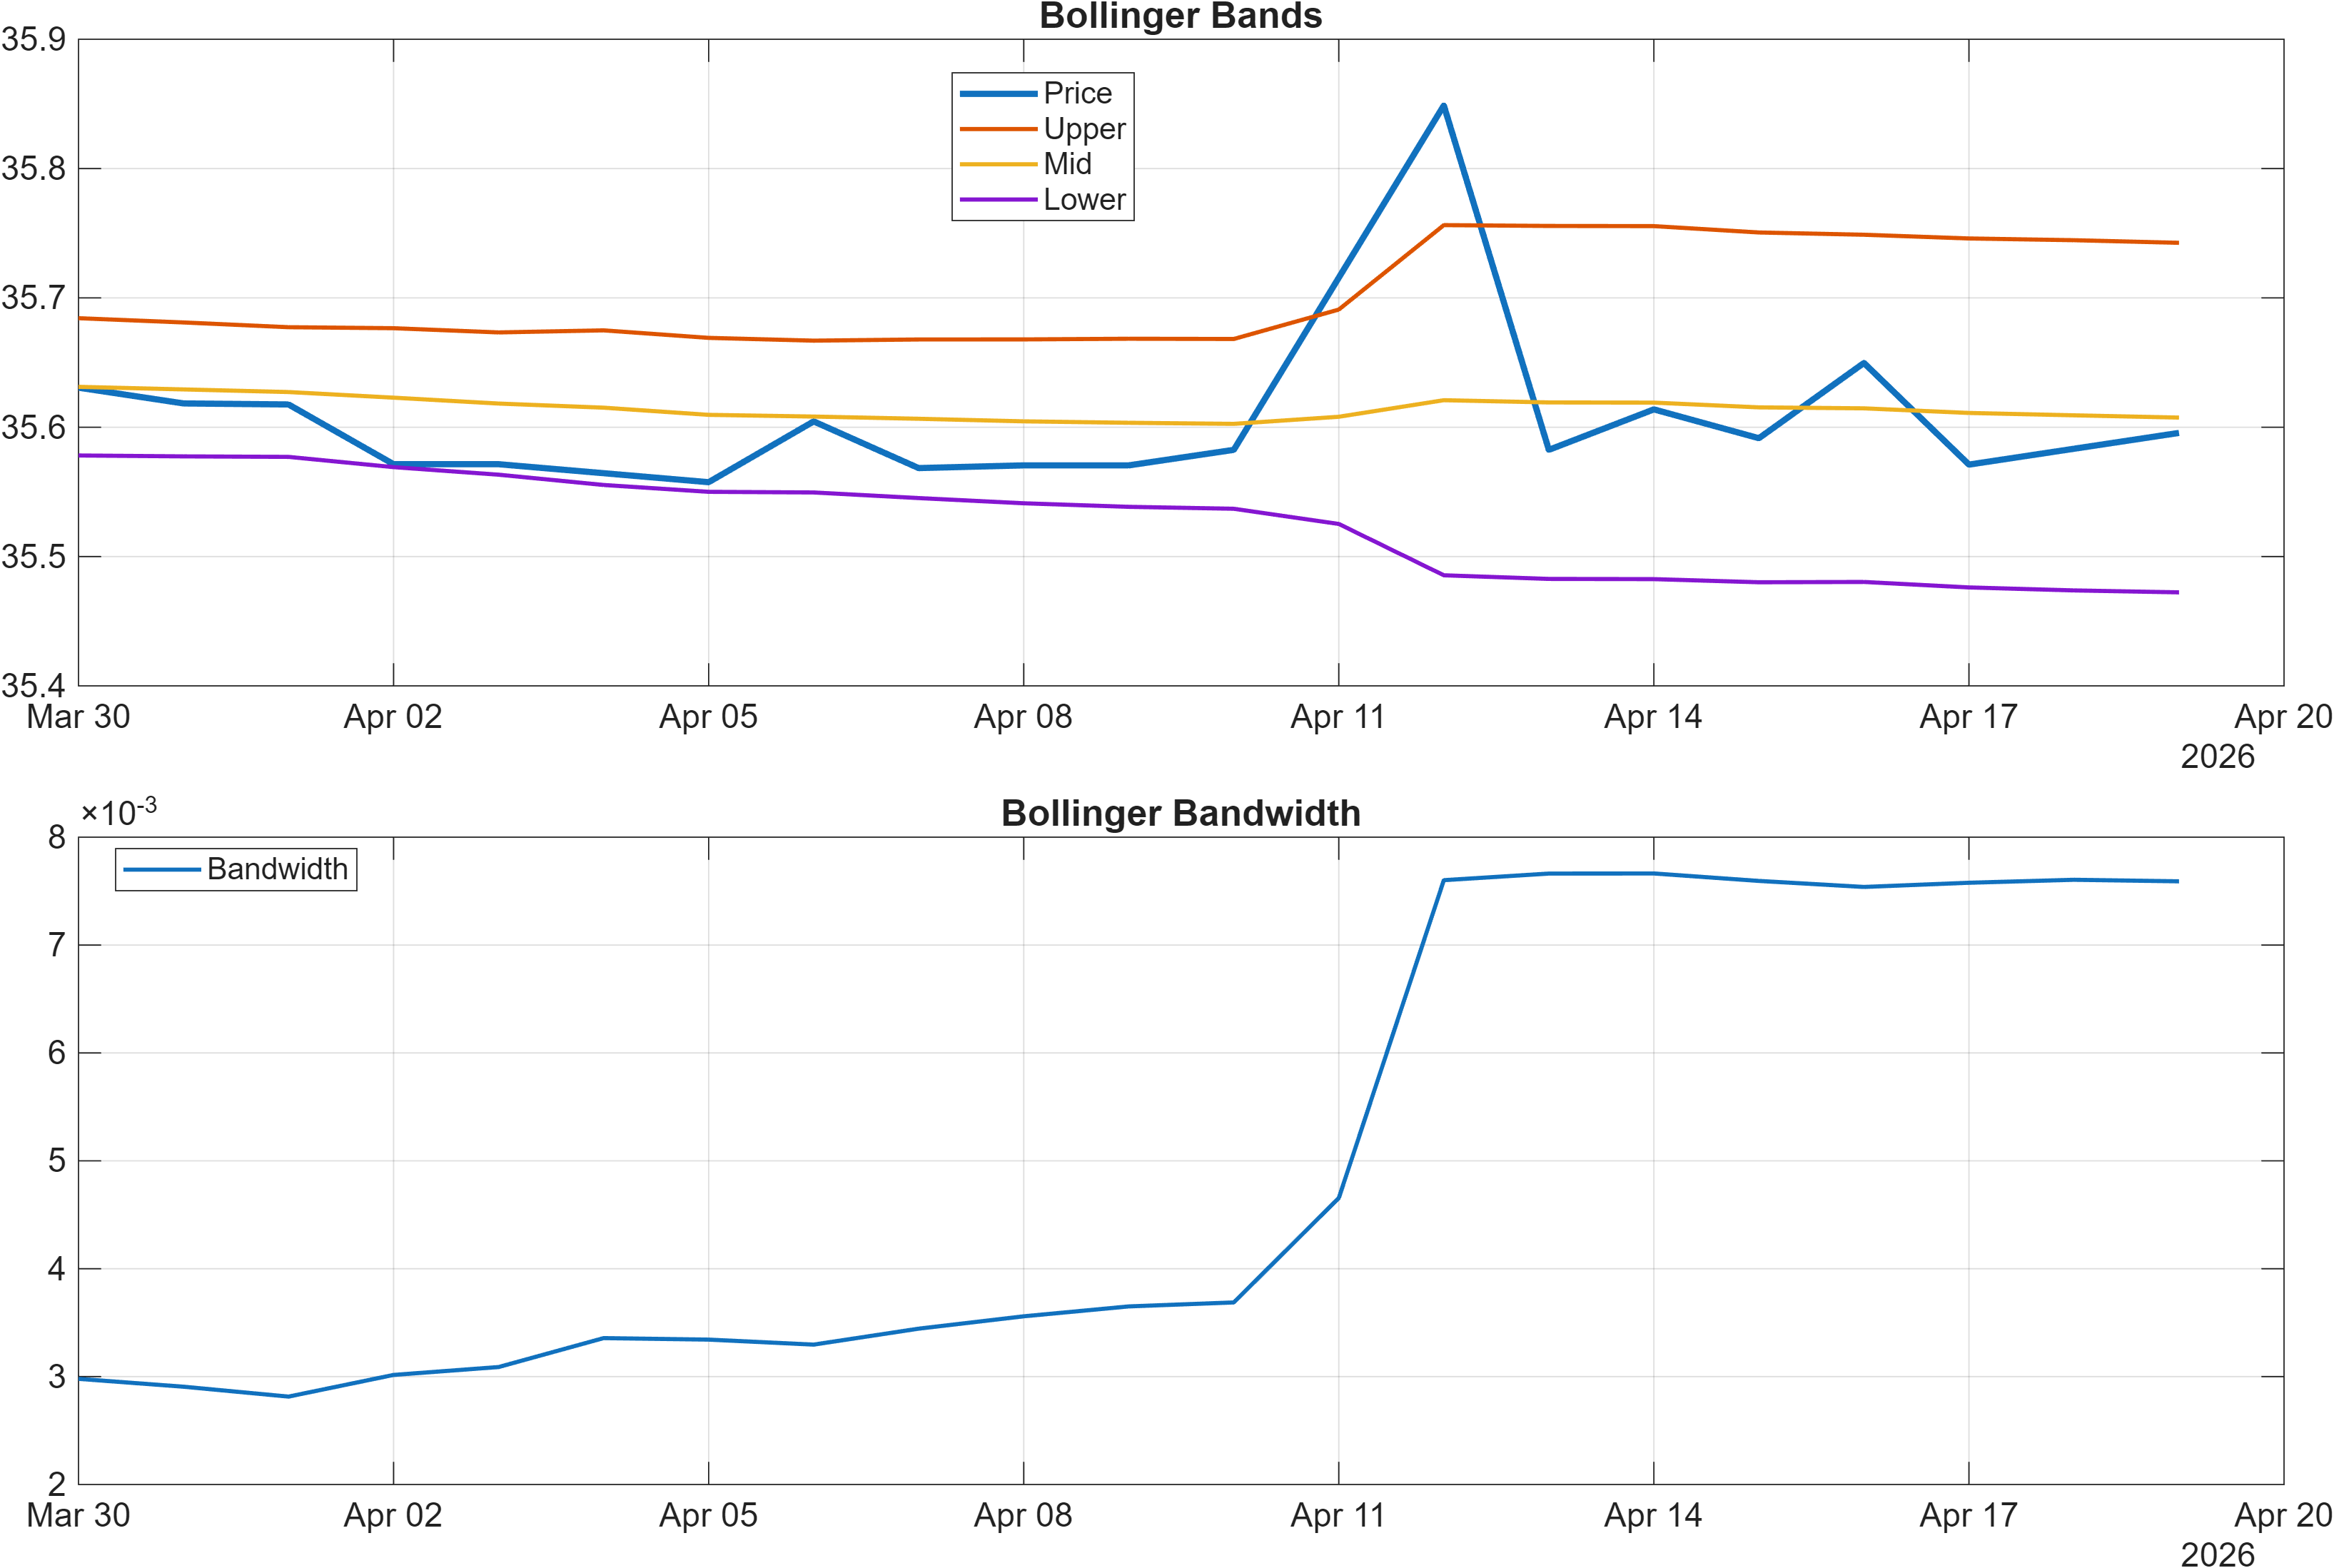
Momentum is muted; volatility compression elevates the value of level breaks
The momentum complex is signaling “low conviction” rather than a clean directional edge. RSI(14) at 52.26 is consistent with a market oscillating around equilibrium, and the stated RSI bias = Neutral aligns with that. Meanwhile, the MACD histogram at -0.0036 (table value -0.003554) is modestly negative—enough to show slight downside pressure, but not the kind of acceleration typically associated with sustained trend legs.
What stands out more is the volatility regime. Bollinger bandwidth at 0.0076 indicates a compressed environment, which tends to reduce the informational value of small indicator fluctuations while increasing the significance of decisive moves beyond established boundaries. In this setting, false starts are common: MACD can remain slightly negative during range trading, and RSI can hover near the low-50s without producing a durable edge.
The most defensible way to use these readings is as a filter, not a trigger. Neutral RSI reduces the case for immediate mean-reversion extremes, while slightly negative MACD argues against assuming upside persistence without confirmation. With compression present, the market’s next durable signal is more likely to be communicated through a break-and-hold dynamic near 35.8580 or a failure through 35.5431 than through incremental changes in the histogram.
Interpretation: RSI bias = Neutral, MACD hist = -0.0036.
Interpretation: Bandwidth (volatility regime) latest = 0.0076.
4) Support / Resistance zones
Support ~ 35.5431 | Resistance ~ 35.8580
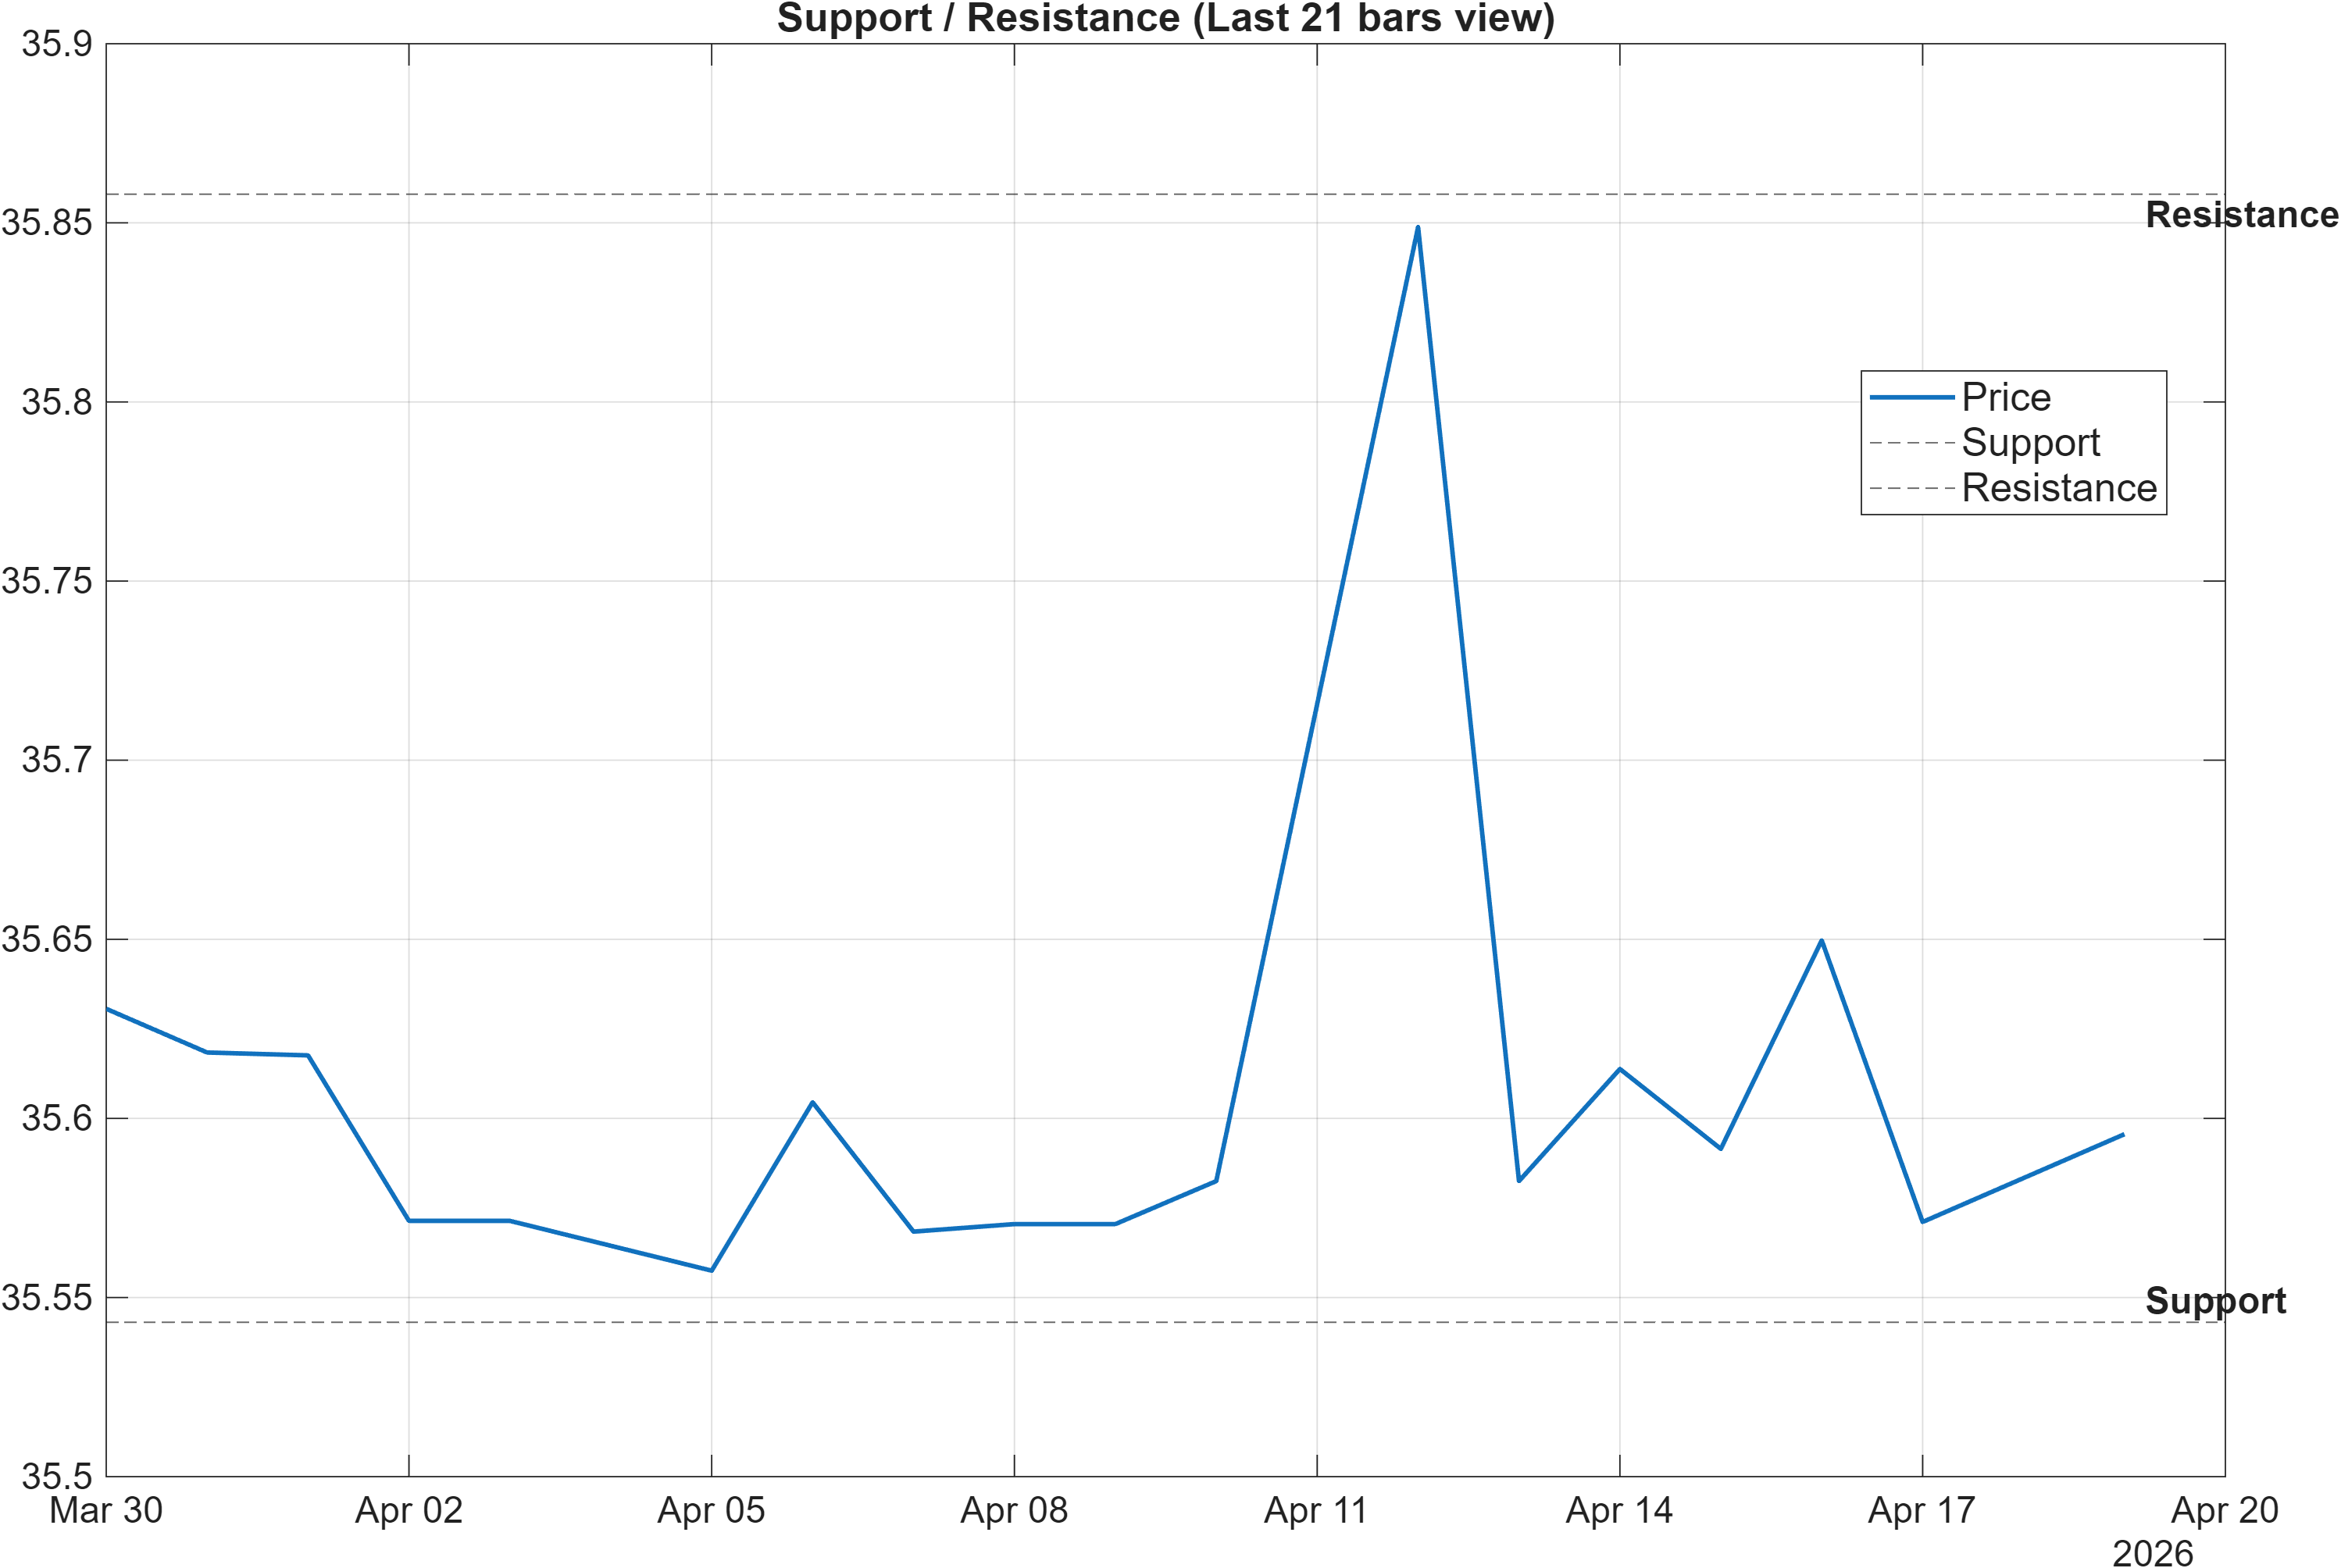
Decision zones: range integrity vs regime transition
With volatility compressed (0.0076) and momentum largely neutral (RSI 52.26), the support/resistance structure becomes the primary decision framework. The defined band—support near 35.5431 and resistance near 35.8580—acts as a probabilistic map for where positioning is most likely to change. In range conditions, the market typically rewards patience: repeated tests without displacement often degrade signal quality, while the first clean break can produce a sharper reaction than indicators imply.
The scenario guidance is explicitly level-based: a break above resistance with volume is treated as a continuation condition, while a close below support increases deterioration risk. This is consistent with the broader mixed evidence set: longer-run ranks remain bullish (e.g., Yearly #4), yet the moving-average structure is bearish. That mismatch raises the value of an objective “line in the sand” approach: the range boundaries serve as confirmation points to resolve the conflict between long-horizon relative strength and near-term trend softness.
Tactically, the most informative behavior is often found in the reaction to these levels rather than the initial touch. A rejection at 35.8580 that coincides with still-negative MACD histogram readings (around -0.0036) would be more consistent with ongoing consolidation. Conversely, holding above resistance would help repair the currently bearish MA signals and bring price action closer to the long-horizon rank posture.
Scenario view: Break above resistance with volume → continuation. Close below support → signal deterioration risk.
5) Quant Technical Dashboard (18 Signals)
KGNAI AI Technical Analysis Score (Deep Reinforcement Learning): Rank #868 out of 963 (Rank 1 represents the strongest technical positioning and a higher probability of favorable price behavior. As ranks increase toward the maximum, the probability of favorable outcomes weakens and bearish positioning becomes more dominant.) | Label: Bearish | Score: -0.803
18-Signal Technical Confluence Score: -0.111 (Neutral)
Overall Technical Score (18-signal confluence + DRL rank blend): -0.319 (Bearish)
Note: The blended score reflects signal strength weighted against broader AI technical ranking, which may temporarily diverge.
Blended technical score breakdown: -0.319 (Bearish | Bull 4 / Bear 6 / Neutral 8)
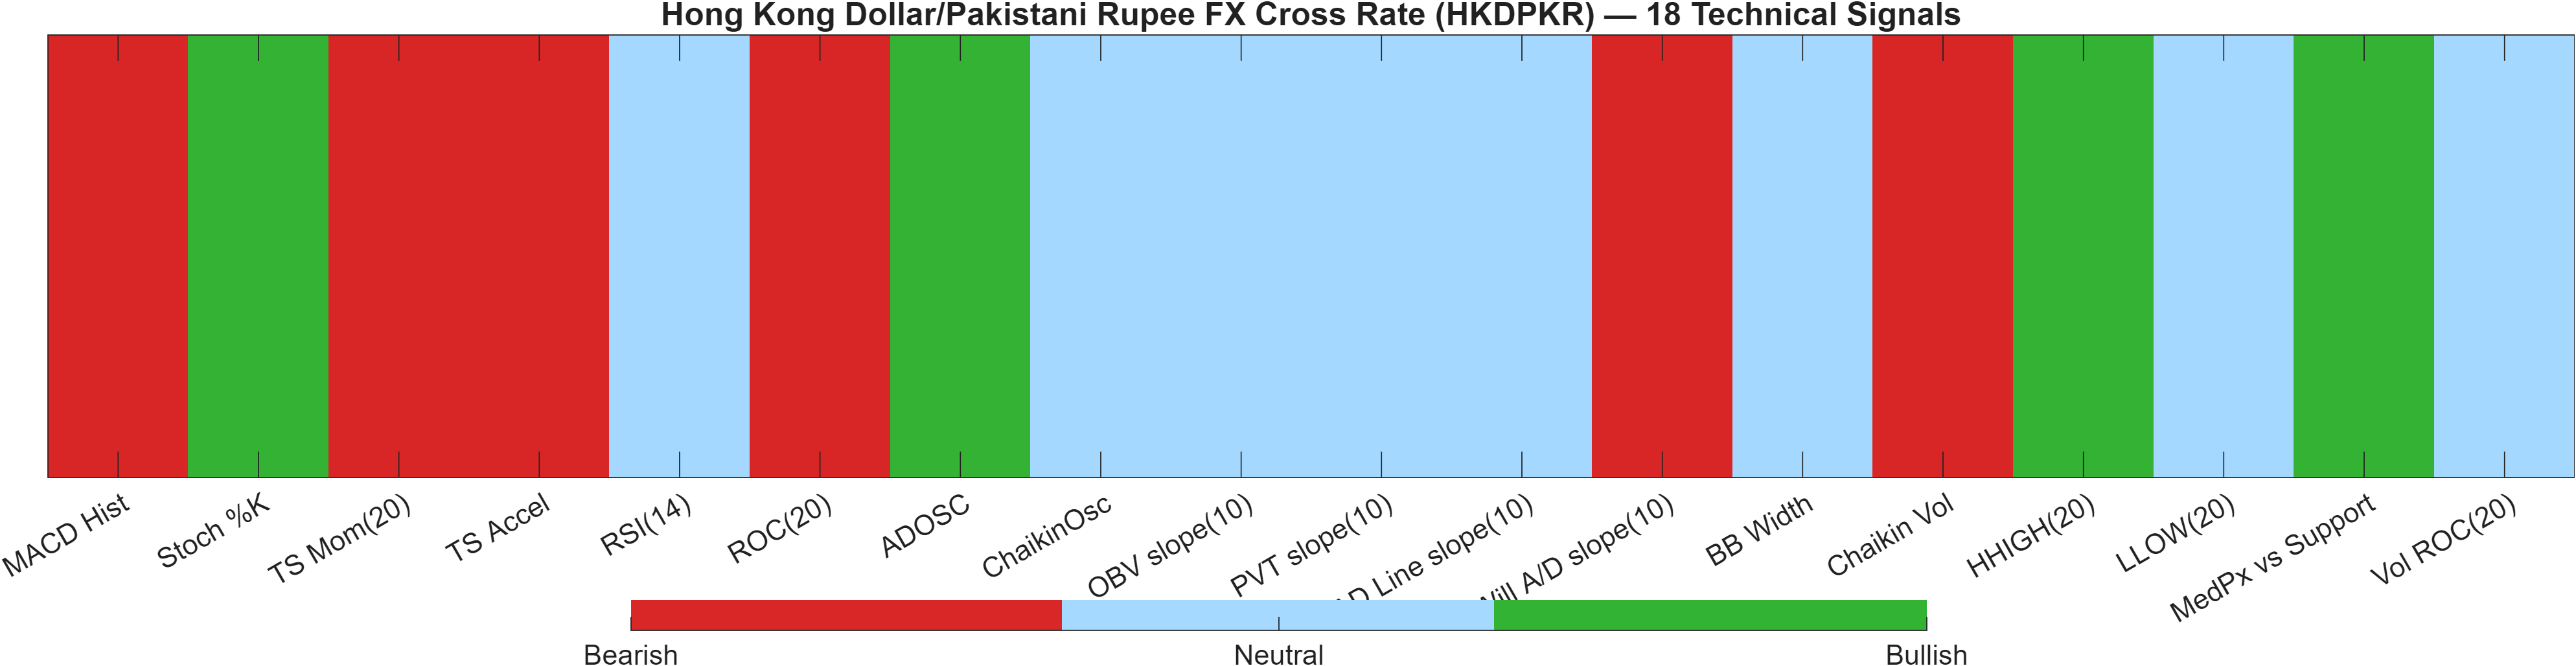
Confluence vs model rank: a neutral surface with bearish weighting underneath
The dashboard highlights a useful distinction between “what most indicators say” and “how the broader technical model scores the setup.” On the surface, the 18-Signal Technical Confluence Score is -0.111, which is Neutral. However, once blended with the Deep Reinforcement Learning technical rank, the Overall Technical Score shifts to -0.319, labeled Bearish. The DRL component is notably weak: Rank #868 out of 963 with a score of -0.803.
This is a classic “compression with skew” setup: a large share of signals are neutral (Neutral 8), but the weighting leans negative (Bear 6 vs Bull 4). Examples of bearish pressure inside the table include the MACD histogram (-0.003554) and downside-leaning time-series momentum measures, while the bullish side shows pockets of stabilization (e.g., Stoch %K 14.43 signaling oversold-type conditions, and ADOSC 45.41 suggesting some accumulation characteristics).
When the blended score is bearish while confluence is neutral, it typically argues for higher confirmation standards. In practice, that means using the technical dashboard to avoid over-interpreting isolated bullish prints during a bearish-weighted regime, and focusing instead on whether price can reclaim range leadership via 35.8580—or whether weakness persists toward 35.5431.
Signal table (Bull/Bear/Neutral)
| Indicator | Value | Signal |
|---|---|---|
| MACD Hist | -0.003554 | Bearish |
| Stoch %K | 14.43 | Bullish |
| TS Mom(20) | -0.0473 | Bearish |
| TS Accel | -0.0074 | Bearish |
| RSI(14) | 52.26 | Neutral |
| ROC(20) | -0.06401 | Bearish |
| ADOSC | 45.41 | Bullish |
| ChaikinOsc | 0 | Neutral |
| OBV slope(10) | 0 | Neutral |
| PVT slope(10) | 0 | Neutral |
| AD Line slope(10) | 0 | Neutral |
| Will A/D slope(10) | -0.3064 | Bearish |
| BB Width | 0.007591 | Neutral |
| Chaikin Vol | 486.3 | Bearish |
| HHIGH(20) | 35.87 | Bullish |
| LLOW(20) | 35.52 | Neutral |
| MedPx vs Support | 0.1603 | Bullish |
| Vol ROC(20) | — | Neutral |
Interpretation: Indicator-level signals form the base confluence, which is then adjusted using a separate AI-driven technical ranking model. The final technical score summarizes this combined view.
6) News sentiment + extractive gist
Note: Instrument-specific news matches were not found, so the digest includes broader market/sector headlines. Links are provided for verification.
Sentiment score (avg): 0.040 | Positive: 19% | Neutral: 81% | Negative: 0%
KGNAI AI News Sentiment Score (normalized -1 to +1): Not available (as of —) | Label: Not available | Overall news score: 0.04
Positive Developments
Recent coverage across major financial outlets indicates a constructive macro tone driven by de-escalation narratives and a “risk-on” impulse across multiple asset classes. The aggregated messaging points to easing tail-risk perception around geopolitics and improved confidence in trade and shipping continuity, which tends to reduce short-term demand for defensive currency positioning. In FX markets, such shifts can compress volatility—consistent with HKDPKR’s low Bollinger bandwidth (0.0076)—and keep cross rates range-bound even when longer-horizon relative ranks remain strong (for HKDPKR, Yearly #4). Broader commodities coverage also reflects sharp, sentiment-sensitive moves, reinforcing that the macro backdrop is currently headline-reactive. For HKDPKR, the positive takeaway is not a directional call; it is that the environment can support steadier conditions where technical levels (35.5431 / 35.8580) become more influential than incremental momentum oscillations.
Neutral / Mixed Developments
The neutral cluster of coverage is characterized by ongoing monitoring of policy communication and near-term positioning rather than clear new information. The net effect is a “wait-and-see” macro posture: markets appear responsive to incremental updates, but without a single dominant narrative that forces a repricing across all currency pairs. That matches HKDPKR’s internal technical texture—RSI(14) 52.26 sits near balance, and the short-horizon ranks remain Neutral (e.g., Daily #219, Monthly #266). In this context, sentiment functions as a background condition rather than a driver: it can amplify moves if price approaches key zones, but it is not currently strong enough—by itself—to resolve the range.
Negative / Risk Signals
Risk-focused coverage remains centered on the potential for renewed energy and inflation pressures and the market sensitivity to abrupt narrative reversals. Even when headline risk appears to ease, follow-on uncertainty can reintroduce volatility quickly—often showing up first in broader USD crosses and risk proxies before filtering into less liquid or more range-bound crosses. For HKDPKR, the relevant risk is that compressed conditions can break abruptly: the technical blend is already Bearish (-0.319) with a weak DRL technical rank (#868), so a downside break below 35.5431 would be more consistent with deterioration than with a benign continuation of range trade. Sentiment currently reads neutral (0.040), but the distribution suggests the market is not pricing a negative scenario aggressively—leaving room for repricing if conditions shift.
What to monitor next
- Whether price can hold above 35.8580 long enough to reduce the bearish moving-average posture.
- Whether MACD hist improves from around -0.0036 as price approaches resistance.
- Whether volatility expands meaningfully from 0.0076, indicating a transition away from compression.
Snapshot: AI Rank (Short–Mid–Long): Mixed (Neutral–Neutral–Bullish) · Technical Confluence: Neutral · Key Levels: Support ~35.54 | Resistance ~35.86 · News Sentiment: Neutral
Sources referenced: Reuters, Bloomberg, Yahoo Finance, MarketWatch, Investing.com
7) Sources
- USD/CHF Price Forecast: Breaks below key SMAs, eyes on 0.7800 — https://www.fxstreet.com/news/usd-chf-price-forecast-breaks-below-key-smas-eyes-on-07800-202604172230
- US President Trump says he can trust Iranians – ABC News — https://www.fxstreet.com/news/us-president-trump-says-he-can-trust-iranians-abc-news-202604172208
- Singapore: CPI seen higher on energy shock – DBS — https://www.fxstreet.com/news/singapore-cpi-seen-higher-on-energy-shock-dbs-202604172129
- AI: Competitive edge debate – UBS — https://www.fxstreet.com/news/ai-competitive-edge-debate-ubs-202604172038
- Silver Price Forecast: Bullish and poised to close above $81 — https://www.fxstreet.com/news/silver-price-forecast-bullish-and-poised-to-end-above-81-202604171957
- China: Policy easing expectations trimmed – DBS — https://www.fxstreet.com/news/china-policy-easing-expectations-trimmed-dbs-202604171951
- Gold surges past $4,850 as Hormuz reopening crushes the US Dollar — https://www.fxstreet.com/news/gold-surges-past-4-850-as-hormuz-reopening-crushes-the-us-dollar-202604171909
- Asia FX: De-escalation hopes support regional currencies – MUFG — https://www.fxstreet.com/news/asia-fx-de-escalation-hopes-support-regional-currencies-mufg-202604171908
You may also like: How KGNAI AI ranks instruments across global markets
Disclaimer: KGNAI provides AI-generated analytics and educational market commentary only. This is not financial advice. Markets involve risk. Always do your own research.