
RON/GBP (RONGBP) Technical & Rank Review — 24-Apr-2026 (Neutral, range-bound regime)
RON/GBP (RONGBP) remains in a sideways-to-stalled regime where the evidence set is mixed across horizons and signal groups. Across KGNAI’s cross-sectional universe of 960 instruments, the pair sits in the lower half of the distribution on multiple timeframes (Daily #591, Weekly #695, Monthly #691), consistent with a Neutral stance rather than a directional trend signal. Technically, the tape shows internal disagreement: price action relative to the MA50 is Bearish, while the MA50 versus MA200 relationship is Bullish, a configuration that often accompanies transitional phases rather than clean breakouts. Momentum diagnostics lean soft—RSI(14) is 40 and MACD histogram is negative—yet volatility remains contained with Bollinger Bandwidth at 0.0069, reinforcing a “compressed” environment where confirmation matters more than anticipation. The actionable focus is therefore on probabilistic decision zones: support ~0.1691 and resistance ~0.1714, with sentiment mildly positive but largely neutral (0.052 average; 63% neutral).
- Rank stance (Short / Mid / Long): Neutral / Neutral / Neutral (Daily #591; Weekly #695; Yearly #561 out of 960).
- Technical confluence: Neutral (18-signal score -0.222).
- Key levels: Support ~0.1691 | Resistance ~0.1714 (tight decision band for range confirmation).
- News sentiment bias: Mildly constructive but mostly neutral (avg 0.052; 31% positive / 63% neutral / 6% negative).
- Confirmation / invalidation: A close above 0.1714 supports continuation; a close below 0.1691 increases deterioration risk.
What KGNAI Measures
KGNAI evaluates assets using large cross-sectional datasets built from millions of structured data points. Inputs incorporate fundamental metrics, technical structures, and systematically processed news sentiment. Statistical models, machine learning, and AI frameworks are used to assess relative positioning, signal alignment, and probabilistic behavior across broad universes.
How to Read This Report
- Ranks are comparative across the tracked universe, not absolute price targets.
- Confluence reflects alignment among independent signal groups.
- Support/resistance levels are probabilistic decision zones, not guarantees.
- Sentiment provides contextual bias within the broader analytical framework.
1) KGNAI AI Analysis
Region: FOREX
Total universe size: 960 ranked instruments
- Daily rank: #591 out of 960 — Neutral
- Weekly rank: #695 out of 960 — Neutral
- Monthly rank: #691 out of 960 — Neutral
- 3-Monthly rank: #574 out of 960 — Neutral
- 6-Monthly rank: #600 out of 960 — Neutral
- Yearly rank: #561 out of 960 — Neutral
Cross-horizon rankings cluster in the lower half of the 960-instrument universe, with the Weekly (#695) and Monthly (#691) readings sitting weaker than the Daily (#591). That pattern matters: when the shorter horizon is less weak than the mid-horizon, it often reflects local stabilization inside a broader neutral/soft backdrop rather than a confirmed trend reversal.
The 3-Monthly (#574) and Yearly (#561) standings sit modestly better than the Weekly/Monthly prints, suggesting the long window is not decisively bearish. Instead, the profile resembles a range persistence case where the instrument is not offering sustained relative strength versus peers, but also not collapsing into the weakest tail of the distribution.
Term labeling is uniformly Neutral (Short / Mid / Long), which aligns with the later technical sections: the system is not seeing a strong consensus across independent tests. Practically, the highest-value use of this rank block is expectation management: within this universe context, RONGBP is not behaving like a top-decile momentum instrument, so breakout signals typically demand cleaner confirmation (e.g., level breaks) than they would in a high-ranking trend environment.
KGNAI ranks each instrument across large universes using multiple proprietary AI tests and statistical models (millions of data points). Lower ranks generally indicate stronger probability of favorable performance behavior, while higher ranks indicate weaker probability and more bearish positioning.
Term view: Short-term: Neutral. Mid-term: Neutral. Long-term: Neutral.
Want the full universe and complete rank tables? Unlock full access on KGNAI: https://www.kgnai.com/pricing
2) Price & trend overview
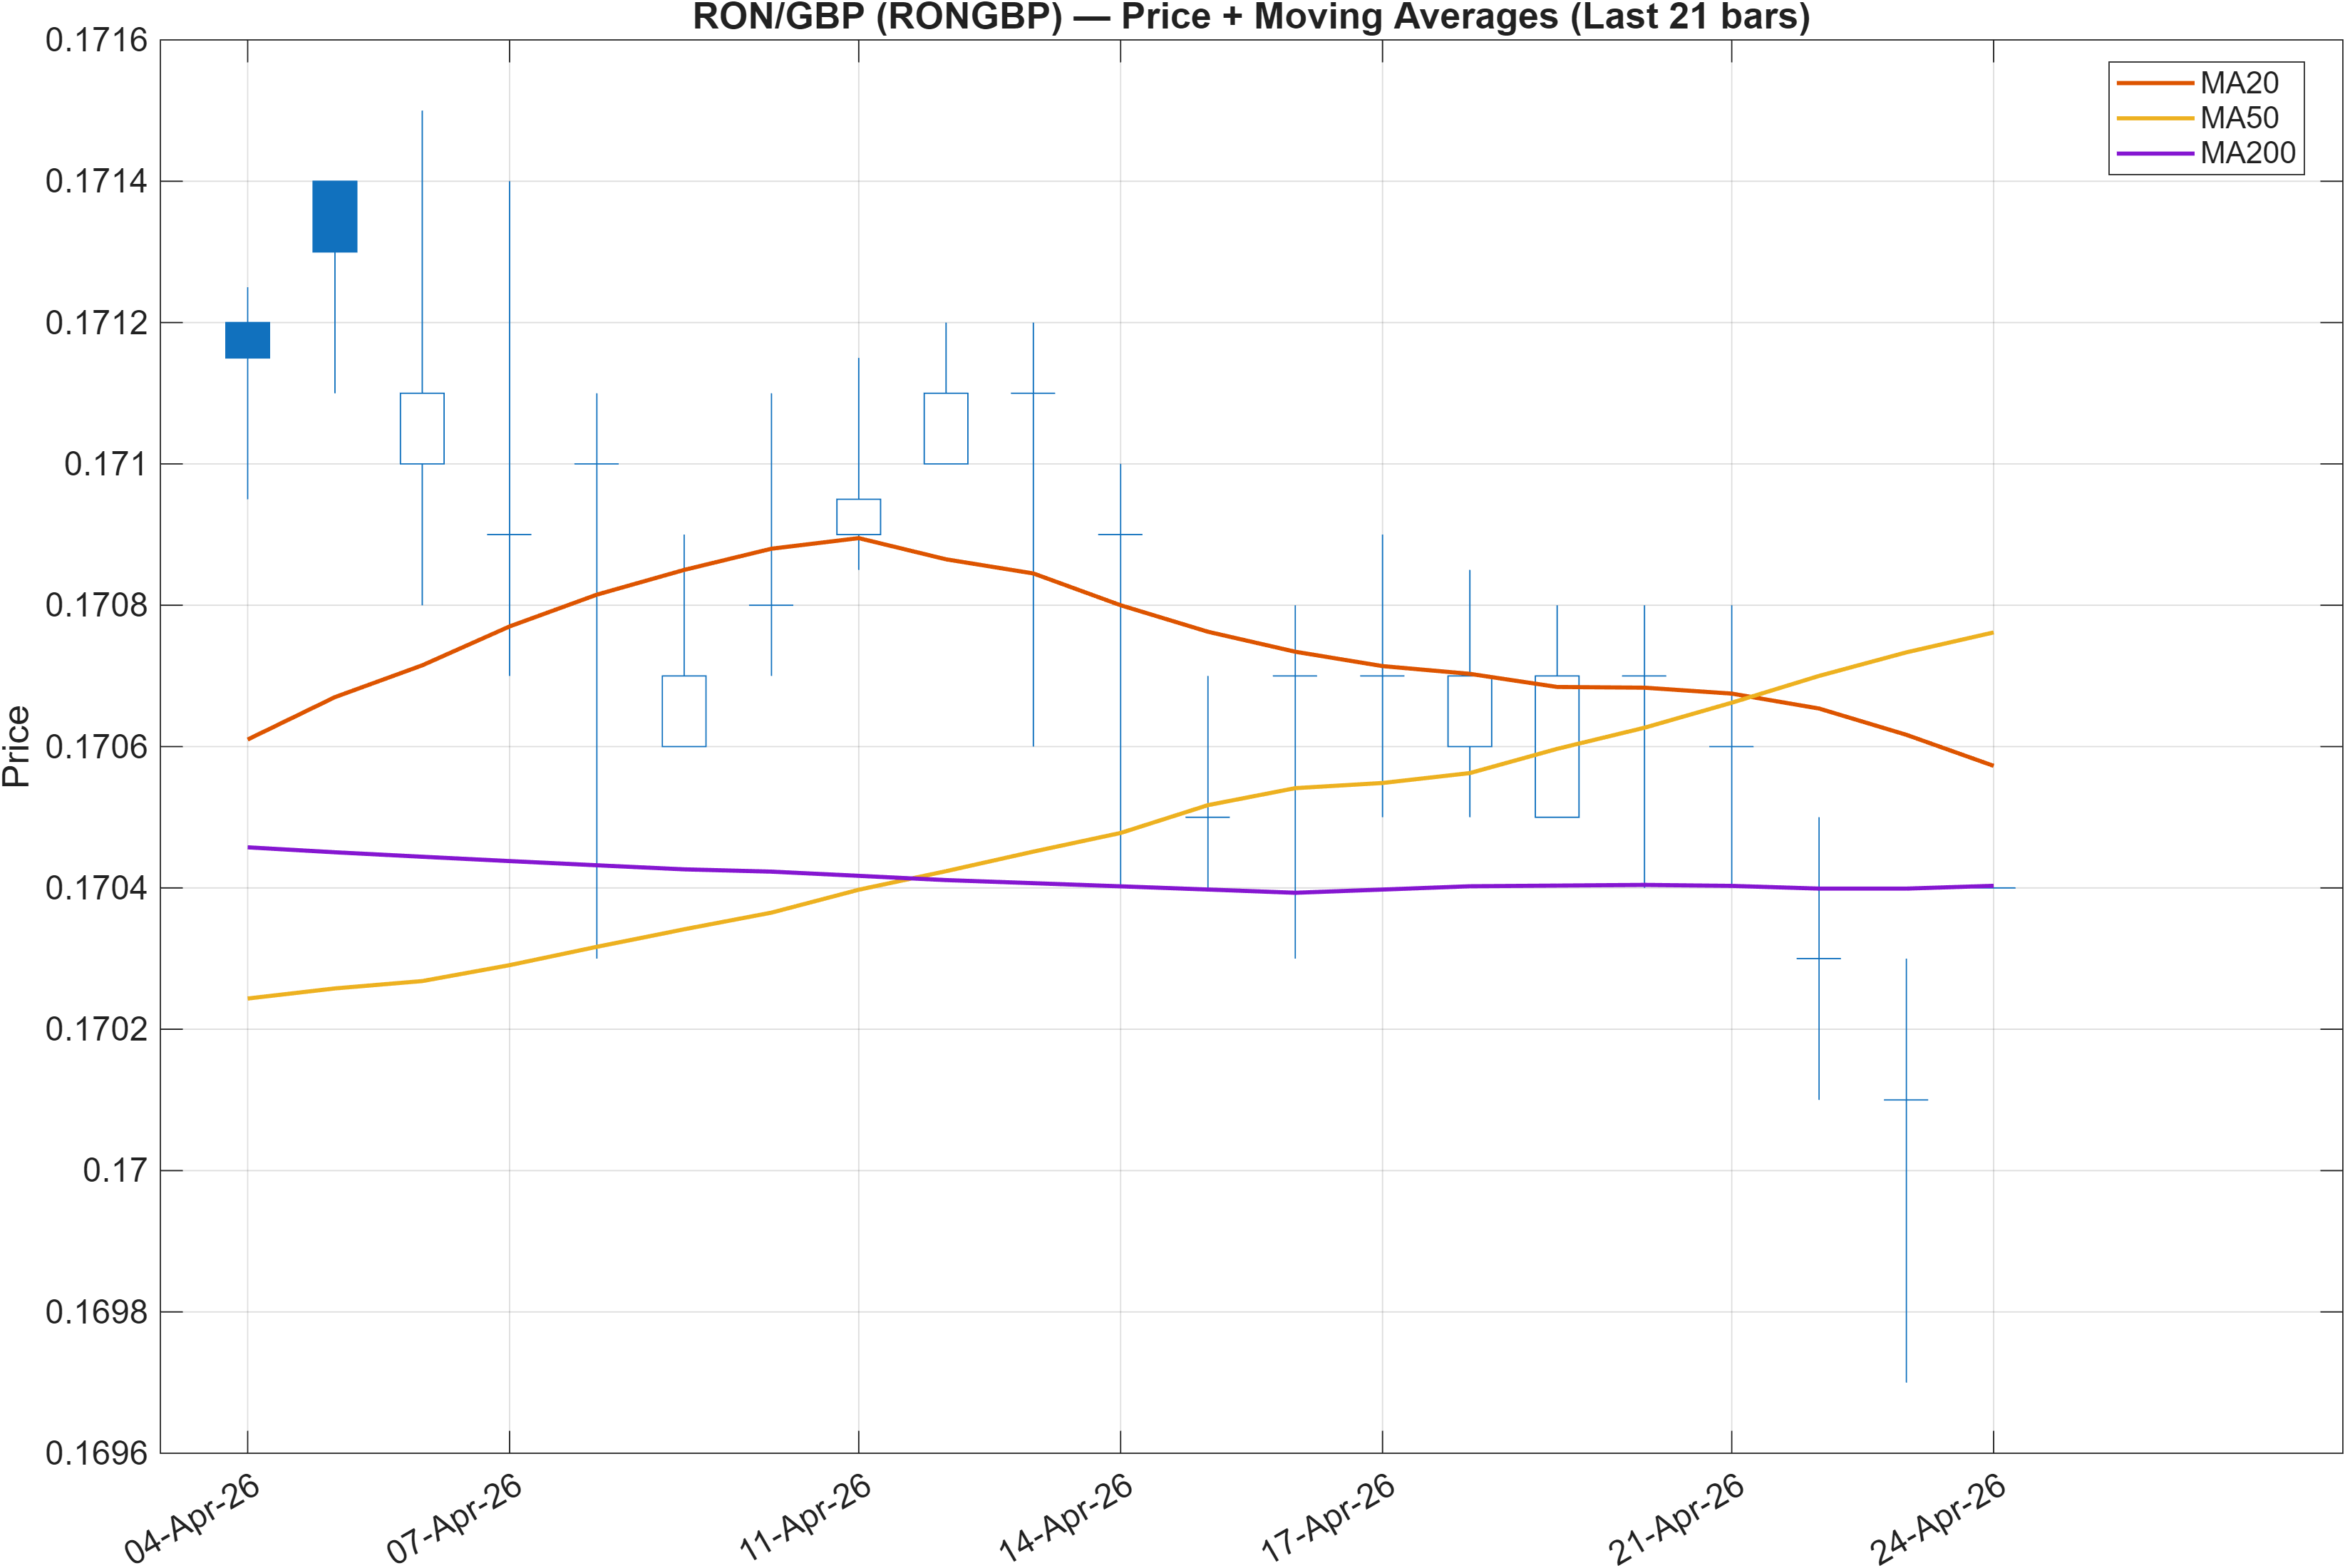
The moving-average structure is split, which is typically how range-bound markets express themselves in systematic trend frameworks. The close versus MA50 is labeled Bearish, while MA50 versus MA200 is labeled Bullish. That combination often indicates that the longer-run baseline has not fully rolled over, but the nearer-term tape is leaning softer—consistent with the ranks being neutral rather than strongly directional.
In this configuration, the MA200 commonly acts as a regime anchor while the MA50 becomes the battleground for shorter-duration control. Because the Daily (#591) is less weak than the Weekly (#695) and Monthly (#691), the trend picture is better described as stabilization within a broader neutral regime rather than renewed upside leadership.
This matters for execution discipline: trend-following entries tend to degrade when the market oscillates around the intermediate moving average. Instead, the more robust approach is to wait for level-based confirmation (see support/resistance at 0.1691 / 0.1714) or for momentum to align with the moving-average signal set (e.g., RSI lifting from 40 while MACD histogram turns up from negative territory). Until then, the evidence favors treating moves as range legs rather than trend initiation.
Interpretation: Close vs MA50 = Bearish, MA50 vs MA200 = Bullish.
3) Momentum & volatility dashboard
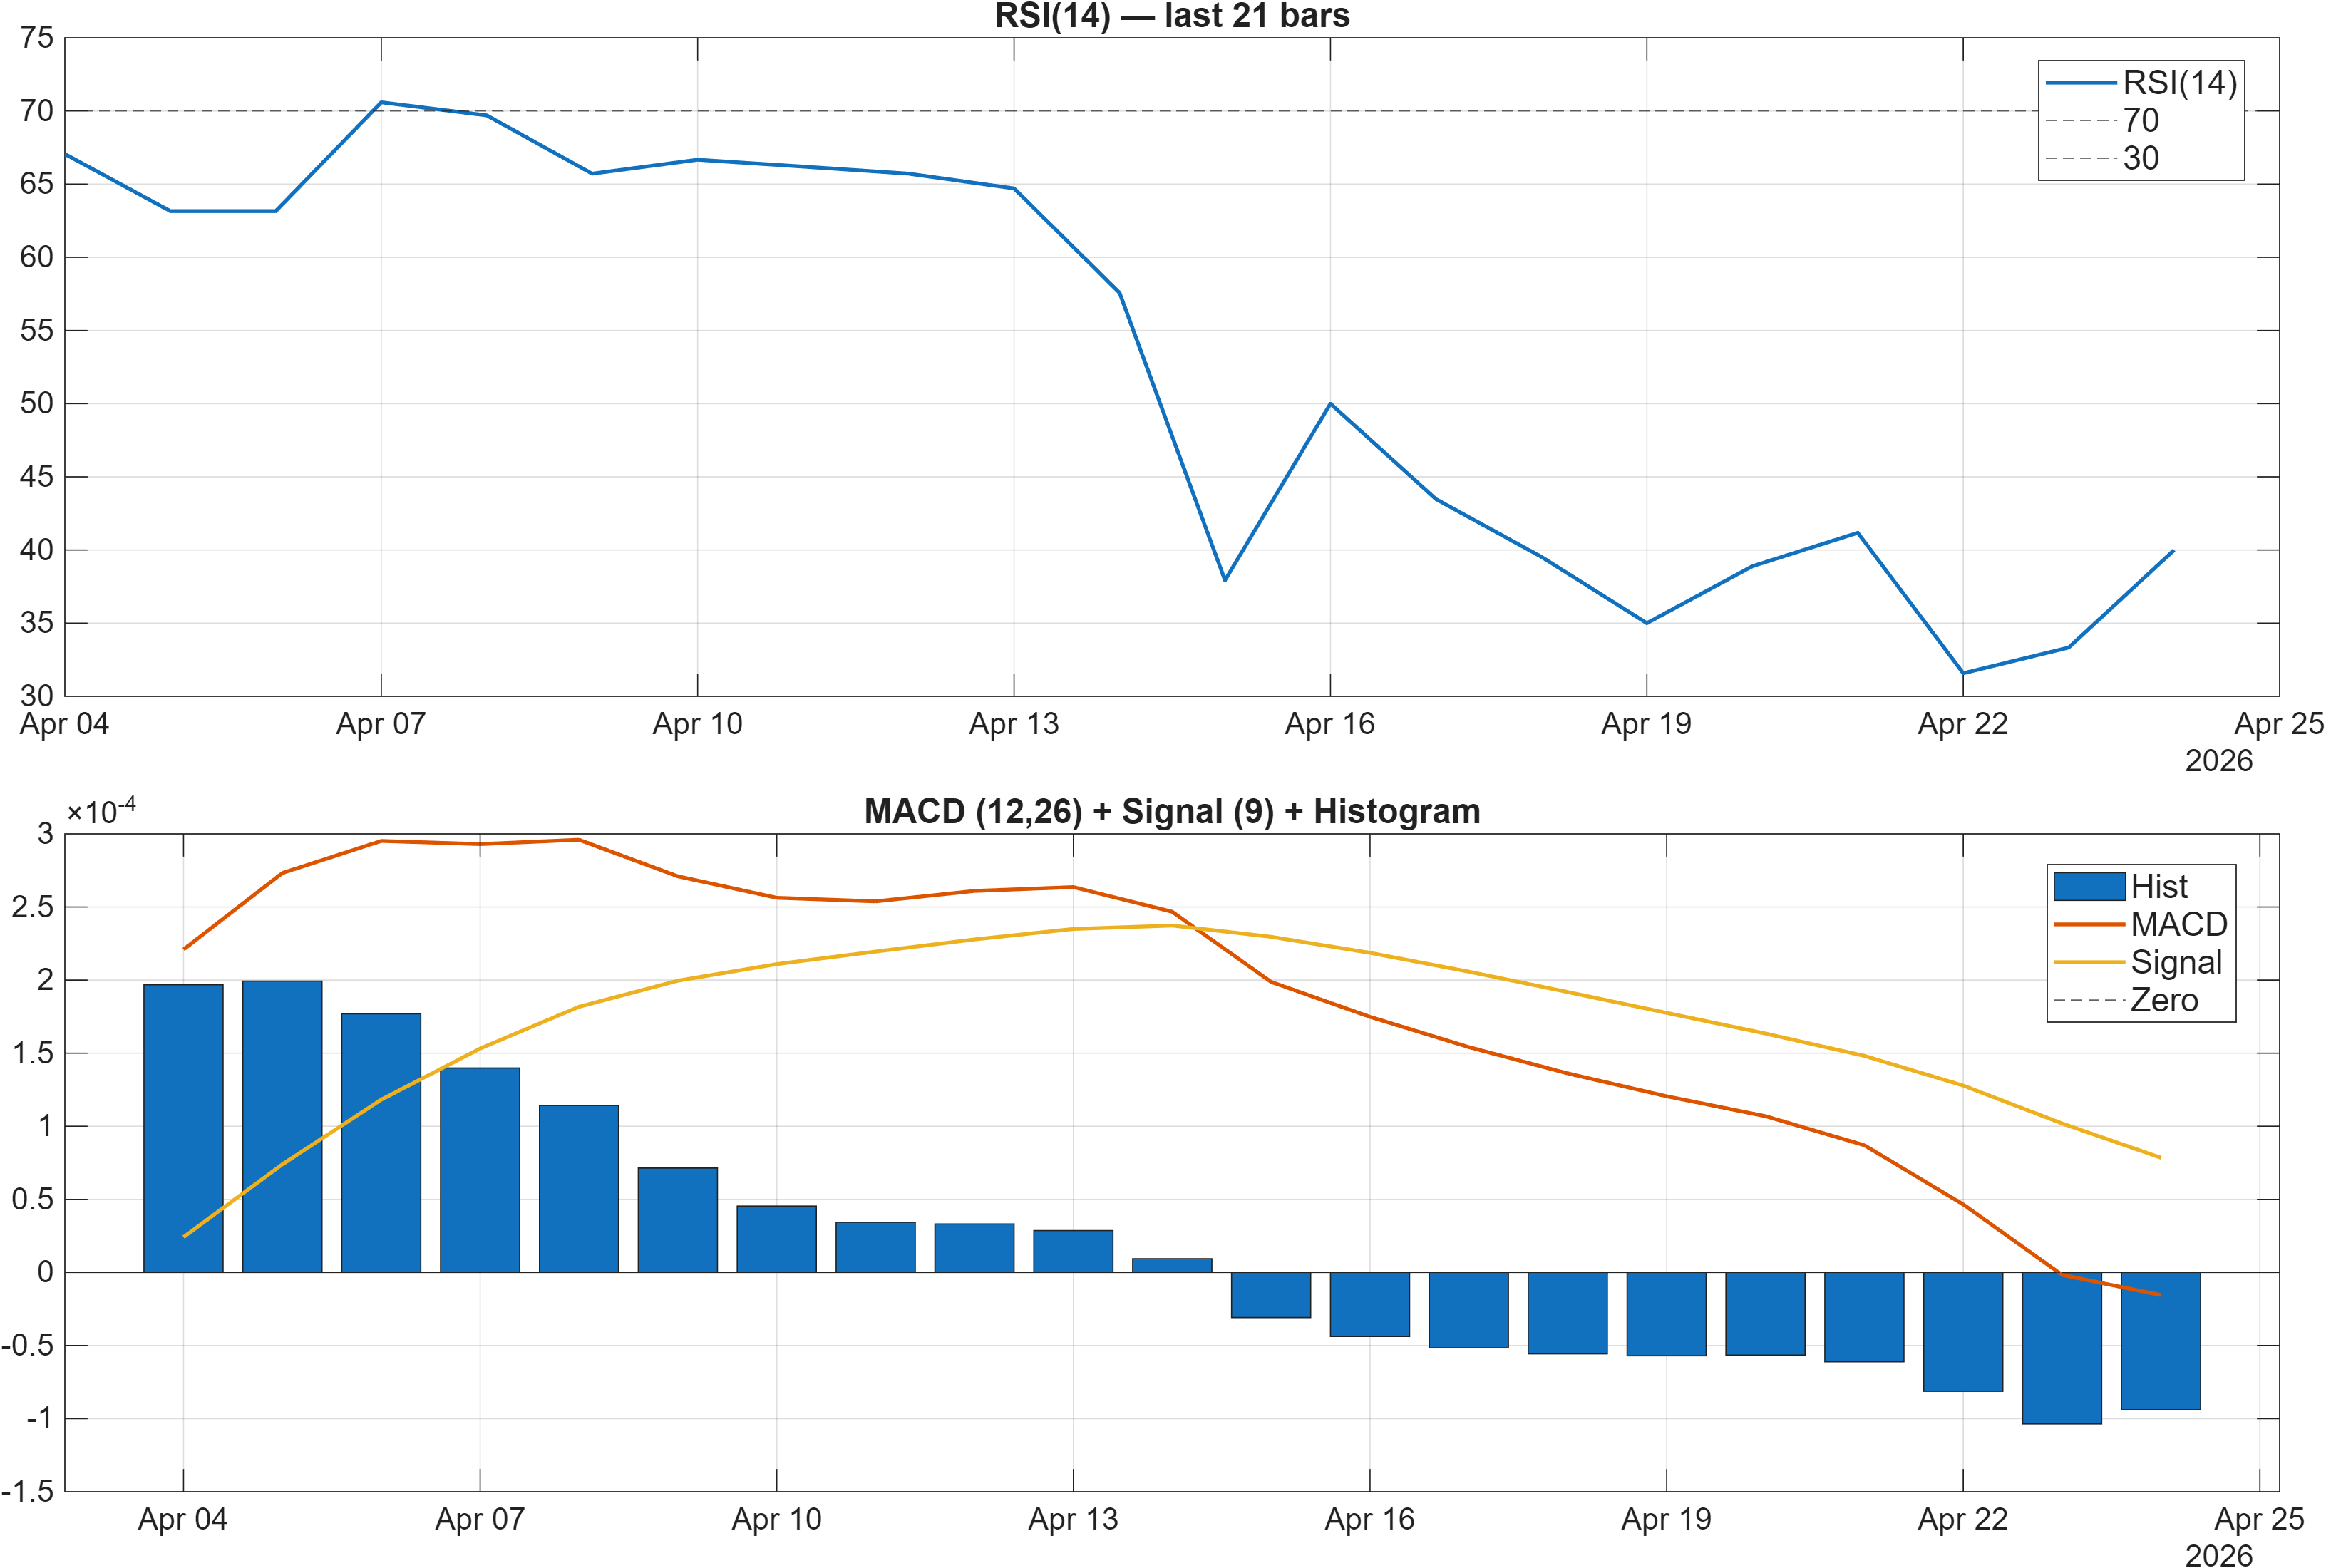
Interpretation: RSI bias = Bearish, MACD hist = -0.0001.
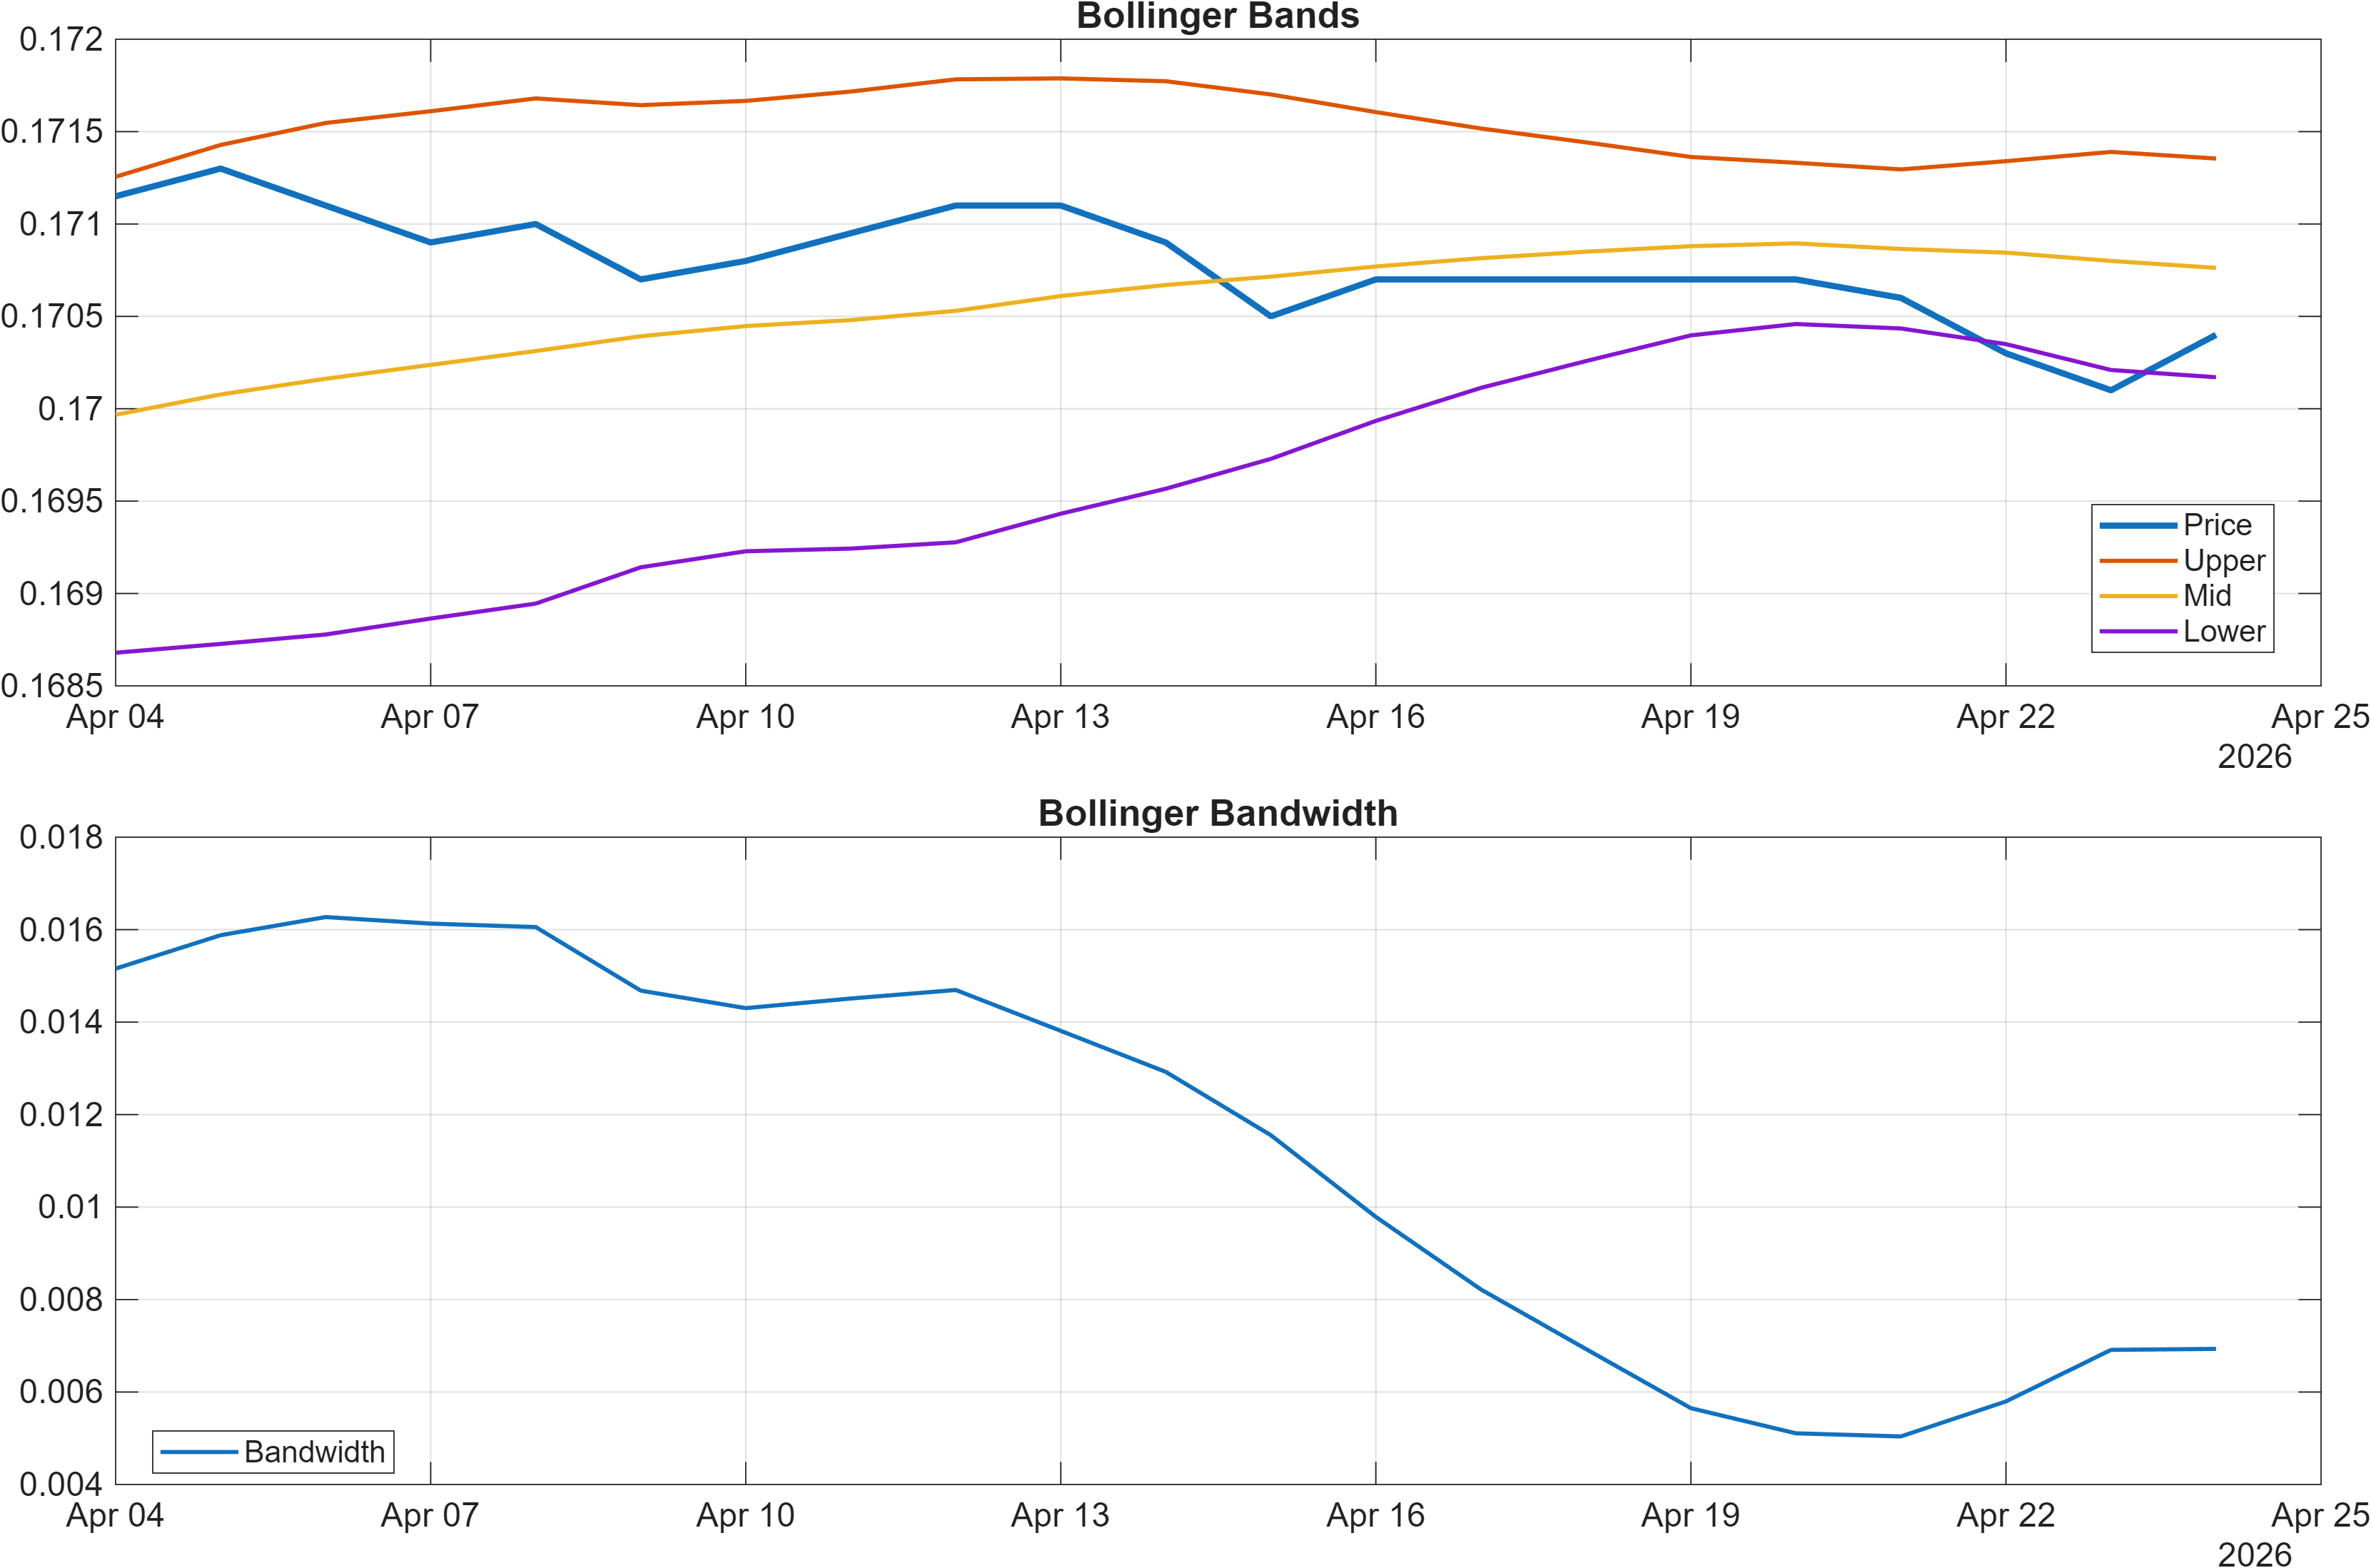
Interpretation: Bandwidth (volatility regime) latest = 0.0069.
Momentum reads as soft but not capitulative. RSI(14) at 40 is below the midline and is explicitly categorized as bearish, signaling that upside impulses have not been strong enough to reclaim typical “trend-supportive” momentum ranges. Consistently, the MACD histogram is negative (shown as -0.0001 in the dashboard and -9.394e-05 in the signal table), reinforcing that recent price pressure has skewed to the downside.
What makes this more nuanced is the volatility regime: Bollinger Bandwidth at 0.0069 points to compressed realized volatility. Compression can persist, but it often shifts the analytic priority from “how strong is momentum now?” to “is momentum improving at the same time volatility expands?” Without that paired confirmation, bearish momentum readings in a tight-volatility band frequently translate into drift rather than a clean directional move.
The practical implication is that a momentum-led thesis needs additional evidence. A bullish improvement would typically require RSI to recover from 40 while MACD histogram rises from negative territory; a bearish continuation would be more credible if the negative MACD persists while price breaks the support zone (0.1691) and volatility begins to expand from 0.0069. Until one of those alignment events occurs, the market structure remains consistent with the ranks’ neutral clustering (e.g., Daily #591, 3-Monthly #574) rather than a high-conviction directional setup.
4) Support / Resistance zones
Support ~ 0.1691 | Resistance ~ 0.1714
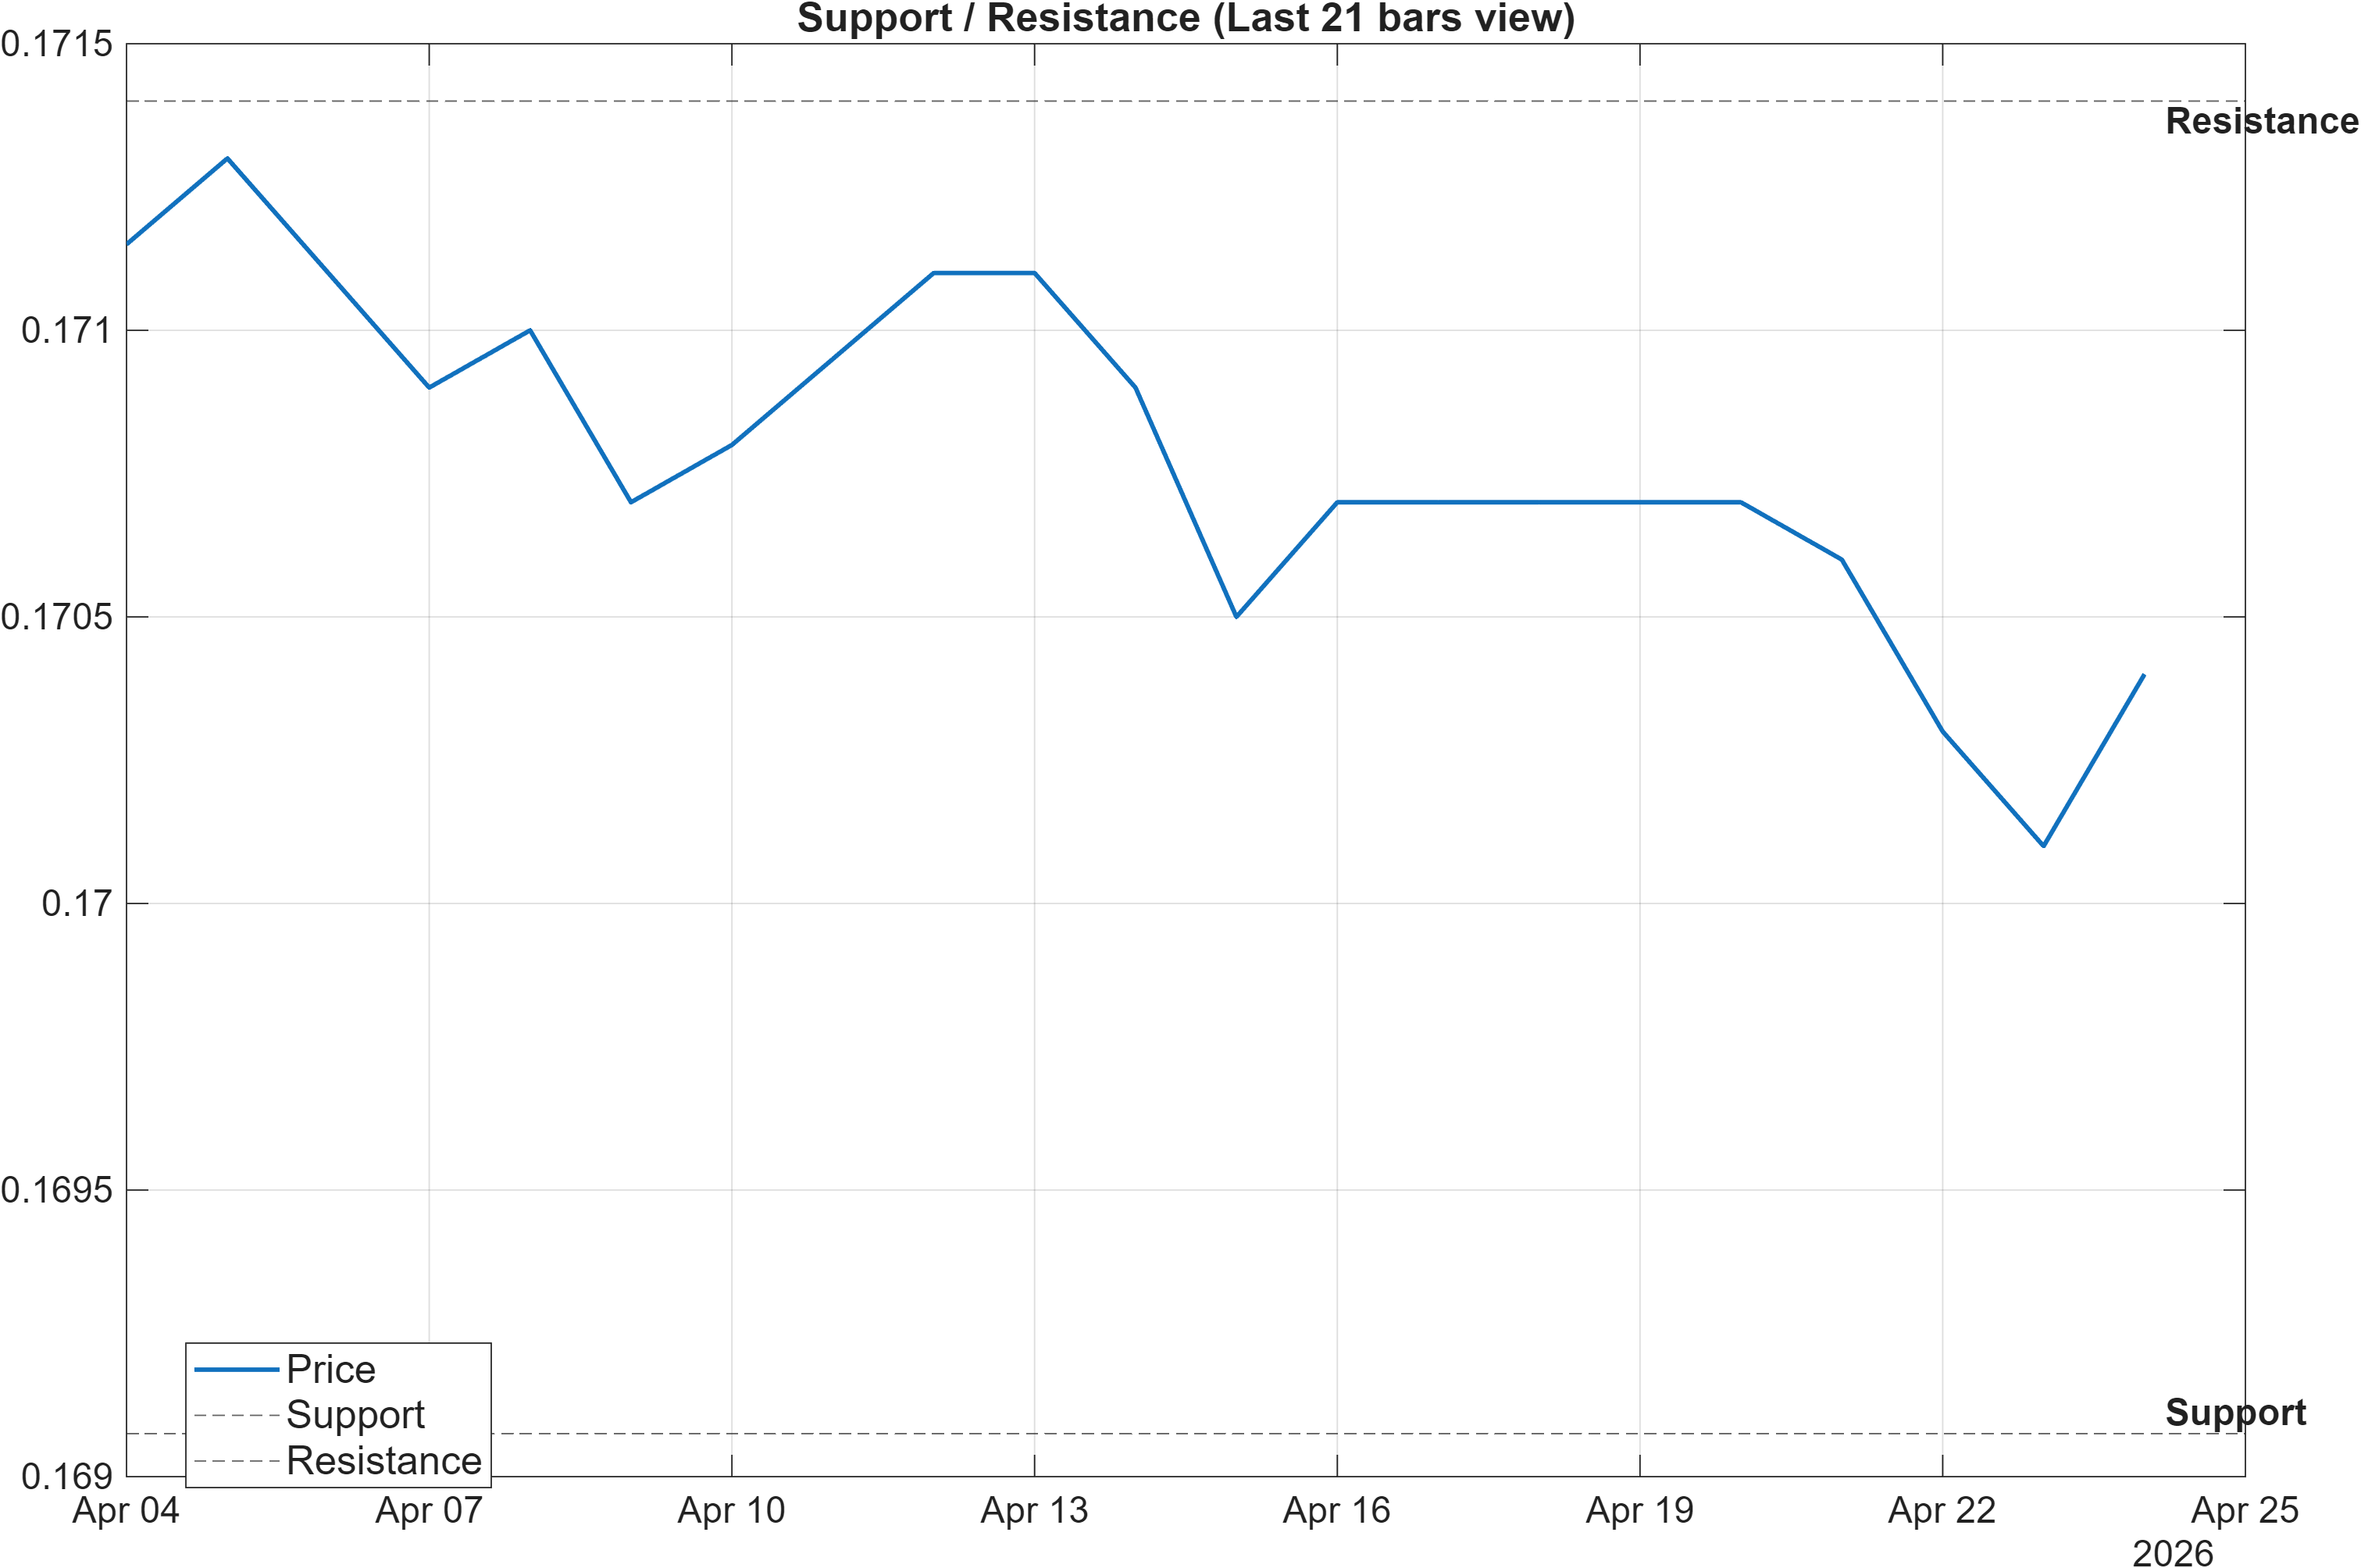
With volatility compressed (Bandwidth 0.0069) and momentum leaning bearish (RSI 40; MACD histogram negative), the 0.1691–0.1714 band becomes the primary decision framework. In range regimes, these zones act less like “targets” and more like state-change thresholds: behavior near the boundary often matters more than the distance traveled inside the range.
The nearby resistance at 0.1714 sits close to the signal-table 20-day high reference (HHIGH(20) at 0.1715), which increases its relevance as an overhead supply point. A sustained acceptance above 0.1714 would therefore do more than just clear a line—it would also indicate a break beyond a recent upper boundary, improving the odds that the MA/RSI/MACD stack can re-align toward a more constructive regime.
On the downside, support at 0.1691 is close to the 20-day low reference (LLOW(20) at 0.1697), which makes it a meaningful “last defense” zone for the current range character. If price closes below 0.1691 while bearish momentum persists (RSI holding sub-50; negative MACD histogram), the probability shifts toward range failure rather than simple mean reversion.
The scenario framing embedded in the chart language is appropriately conditional: a break above resistance with volume signals continuation; a close below support increases deterioration risk. In a neutral-ranked instrument (Weekly #695; Monthly #691), anchoring decisions to these levels is typically more robust than relying on single-indicator momentum calls.
Scenario view: Break above resistance with volume → continuation. Close below support → signal deterioration risk.
5) Quant Technical Dashboard (18 Signals)
KGNAI AI Technical Analysis Score (Deep Reinforcement Learning): Not available
18-Signal Technical Confluence Score: -0.222 (Neutral)
Overall Technical Score (18-signal confluence + DRL rank blend): -0.222 (Neutral)
Note: The blended score reflects signal strength weighted against broader AI technical ranking, which may temporarily diverge.
Blended technical score breakdown: -0.222 (Neutral | Bull 2 / Bear 6 / Neutral 10)
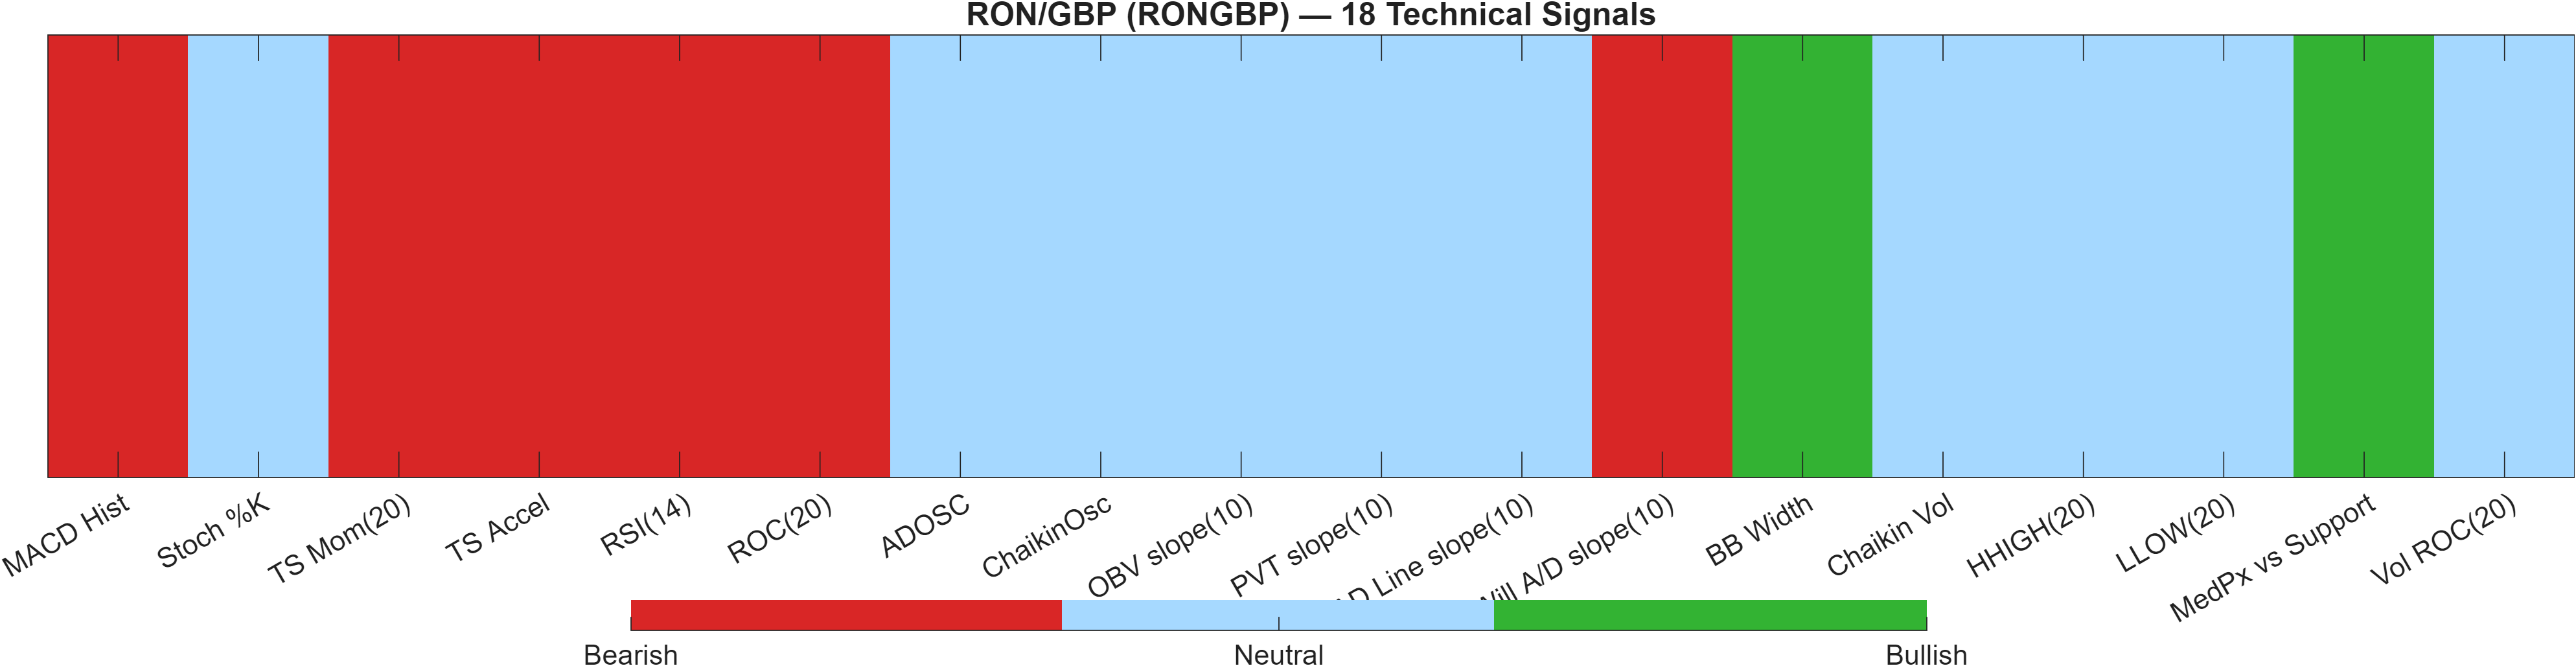
Signal table (Bull/Bear/Neutral)
| Indicator | Value | Signal |
|---|---|---|
| MACD Hist | -9.394e-05 | Bearish |
| Stoch %K | 58.33 | Neutral |
| TS Mom(20) | -0.0009 | Bearish |
| TS Accel | -0.0028 | Bearish |
| RSI(14) | 40 | Bearish |
| ROC(20) | -0.5254 | Bearish |
| ADOSC | — | Neutral |
| ChaikinOsc | — | Neutral |
| OBV slope(10) | 0 | Neutral |
| PVT slope(10) | 0 | Neutral |
| AD Line slope(10) | — | Neutral |
| Will A/D slope(10) | -0.0004 | Bearish |
| BB Width | 0.006933 | Bullish |
| Chaikin Vol | -20.86 | Neutral |
| HHIGH(20) | 0.1715 | Neutral |
| LLOW(20) | 0.1697 | Neutral |
| MedPx vs Support | 0.001325 | Bullish |
| Vol ROC(20) | — | Neutral |
The confluence outcome is Neutral with an 18-signal score of -0.222, and the same value carries through to the overall technical score because the Deep Reinforcement Learning rank is Not available. Compositionally, the mix (Bull 2 / Bear 6 / Neutral 10) explains why the label is not strongly directional: bearish momentum dominates the “active” signals, but a large neutral block dampens conviction.
The bearish cluster is concentrated in classical momentum/velocity diagnostics: RSI(14) at 40, ROC(20) at -0.5254, and time-series momentum/acceleration (TS Mom(20) -0.0009; TS Accel -0.0028). This is consistent with the earlier MA interpretation (close vs MA50 bearish) and with negative MACD histogram readings.
By contrast, the bullish signals are more structural than directional. BB Width is flagged bullish (0.006933) while the separate bandwidth read is 0.0069—together describing a tight-volatility regime rather than a confirmed upside impulse. “MedPx vs Support” is also bullish (0.001325), which fits a market sitting above a nearby support zone even while momentum is soft.
Taken as a whole, this dashboard reads as momentum under pressure inside a contained range. The highest-confidence inference is not direction, but conditionality: confluence improves if upside breaks coincide with momentum repair; deterioration risk rises if support breaks while the bearish momentum stack persists.
Interpretation: Indicator-level signals form the base confluence, which is then adjusted using a separate AI-driven technical ranking model. The final technical score summarizes this combined view.
6) News sentiment + extractive gist
Note: Instrument-specific news matches were not found, so the digest includes broader market/sector headlines. Links are provided for verification.
Sentiment score (avg): 0.052 | Positive: 31% | Neutral: 63% | Negative: 6%
KGNAI AI News Sentiment Score (normalized -1 to +1): Not available (as of —) | Label: Not available | Overall news score: 0.05
Positive Developments
Recent coverage across major financial outlets indicates a mildly constructive tone dominated by “stability” narratives rather than catalyst-driven optimism. The distribution—31% positive against 6% negative—implies that the newsflow skew is not strongly risk-off, which can help explain why the market is able to hold a tight volatility regime (Bandwidth 0.0069) instead of widening into a disorderly move. Some coverage highlights pockets of resilience in major FX pairs and the idea that certain macro datapoints have not triggered immediate repricing. For RONGBP, that matters indirectly: in quiet regimes, cross rates can remain bound to technical decision levels, making 0.1691 and 0.1714 more actionable than narrative-driven forecasts. Overall, the “positive” side reads as a stabilizing backdrop rather than a directional tailwind, aligning with the report’s Neutral technical confluence (-0.222) and mid-universe ranks (e.g., Daily #591).
Neutral / Mixed Developments
The neutral bucket is the majority at 63%, consistent with market attention being split across scheduled policy expectations and headline-sensitive geopolitical context. In practical terms for a cross like RONGBP, mixed macro interpretation can keep flows two-sided and reinforce mean-reversion behavior—especially when momentum signals are soft (RSI 40; MACD histogram negative) but price remains close to well-defined boundaries. Neutral coverage also tends to increase the importance of “reaction function” trading: rather than trading the headline, markets often trade whether the exchange rate can sustain a break beyond nearby levels. That is coherent with a regime where the close versus MA50 is bearish while the MA50 versus MA200 remains bullish—an unresolved structure that can persist until a clearer catalyst compresses into a level break.
Negative / Risk Signals
Risk-oriented coverage continues to emphasize sensitivity to geopolitical developments and energy-related uncertainty, which can intermittently pressure broader risk sentiment even when price action stays range-bound. For FX crosses, that can show up as sudden volatility expansion from otherwise compressed baselines (again, Bollinger Bandwidth 0.0069 is the key tell). Importantly, the negative share is low at 6%, so the signal here is not an overwhelming “risk-off” warning—rather, it is a reminder that the current technical neutrality can shift quickly if headlines provoke a regime change. In that event, downside risk becomes more credible if price acceptance develops below 0.1691 alongside already-bearish momentum inputs (e.g., ROC(20) -0.5254, TS Accel -0.0028). Conversely, a benign risk backdrop would be expected to keep price contained unless resistance at 0.1714 is decisively cleared.
What to monitor next
- Whether price can sustain acceptance above 0.1714 while MACD histogram improves from negative readings.
- Whether volatility expands from a 0.0069 bandwidth baseline during any test of 0.1691.
- Whether RSI(14) can recover from 40 toward neutral territory without a support violation.
Sources referenced: Reuters, Bloomberg, Yahoo Finance, MarketWatch, Investing.com
7) Sources
- Not available in the provided data.
You may also like: How KGNAI AI ranks instruments across global markets
Disclaimer: KGNAI provides AI-generated analytics and educational market commentary only. This is not financial advice. Markets involve risk. Always do your own research.