
USDFKP (USDFKP) — Technical stance turns defensively bearish as of 15-Apr-2026
USDFKP enters 15-Apr-2026 with rank weakness concentrated in the weekly and monthly horizons, while shorter-term positioning remains more mixed. Across a 963-instrument FX universe, the daily rank sits at #577 (neutral), but the weekly and monthly ranks deteriorate to #941 and #929, consistent with a market that is struggling to regain durable traction. Technically, the signal stack leans defensive: the blended technical view is Bearish with an overall score of -0.456, and momentum diagnostics show RSI(14) at 29.51 with a negative MACD histogram (-0.0020), a combination often associated with persistent downside pressure even when short-term oversold conditions emerge. Volatility is not extreme, with Bollinger bandwidth at 0.0381, which can keep reactions sharp around key levels. The primary decision zone remains support ~0.7369 versus resistance ~0.7563, where confirmation signals become more actionable.
- Rank stance: Short-term Neutral (daily #577); Mid-term Bearish (weekly #941, monthly #929); Long-term Neutral (6-month #328)
- Technical confluence label: 18-signal confluence Neutral (-0.278), but blended overall technical score Bearish (-0.456)
- Key levels: Support 0.7369 | Resistance 0.7563
- News sentiment bias: Neutral (avg 0.025; 31% positive / 50% neutral / 19% negative)
- Confirmation / invalidation condition: A close below 0.7369 increases deterioration risk; a break above 0.7563 is the primary level-based counter-signal in the provided framework.
KGNAI evaluates assets using large cross-sectional datasets built from millions of structured data points. Inputs incorporate fundamental metrics, technical structures, and systematically processed news sentiment. Statistical models, machine learning, and AI frameworks are used to assess relative positioning, signal alignment, and probabilistic behavior across broad universes.
- Ranks are comparative across the tracked universe, not absolute price targets.
- Confluence reflects alignment among independent signal groups.
- Support/resistance levels are probabilistic decision zones, not guarantees.
- Sentiment provides contextual bias within the broader analytical framework.
1) KGNAI AI Analysis
Region: FOREX
Total universe size: 963 ranked instruments
- Daily rank: #577 out of 963 — Neutral
- Weekly rank: #941 out of 963 — Bearish
- Monthly rank: #929 out of 963 — Bearish
- 3-Monthly rank: #929 out of 963 — Bearish
- 6-Monthly rank: #328 out of 963 — Neutral
- Yearly rank: Not available for this horizon — Not available
Cross-horizon alignment: weak mid-term, mixed near-term
The rank profile shows a clear horizon split. Weekly and monthly ranks sit deep in the lower tail of the universe (#941 and #929 out of 963), signaling that—relative to peers—USDFKP is currently positioned with unfavorable performance behavior characteristics on those horizons. By contrast, the daily rank at #577 is closer to the middle of the universe, which is consistent with tactical stabilization attempts that have not yet translated into a sustained regime shift.
The 6-month rank at #328 places the instrument in a comparatively stronger long-horizon bucket than the weekly/monthly view, aligning with the stated Long-term: Neutral stance. This configuration commonly appears when an older trend structure has not fully broken down on longer windows, yet recent price action and momentum have degraded enough to pressure the intermediate model horizons.
The term view provided—Short-term: Bearish, Mid-term: Bearish, Long-term: Neutral—suggests the immediate task is not “trend confirmation” but damage control: the market would need evidence that the weekly/monthly weakness is no longer persistent. Yearly ranking is Not available in the provided data.
2) Price & trend overview
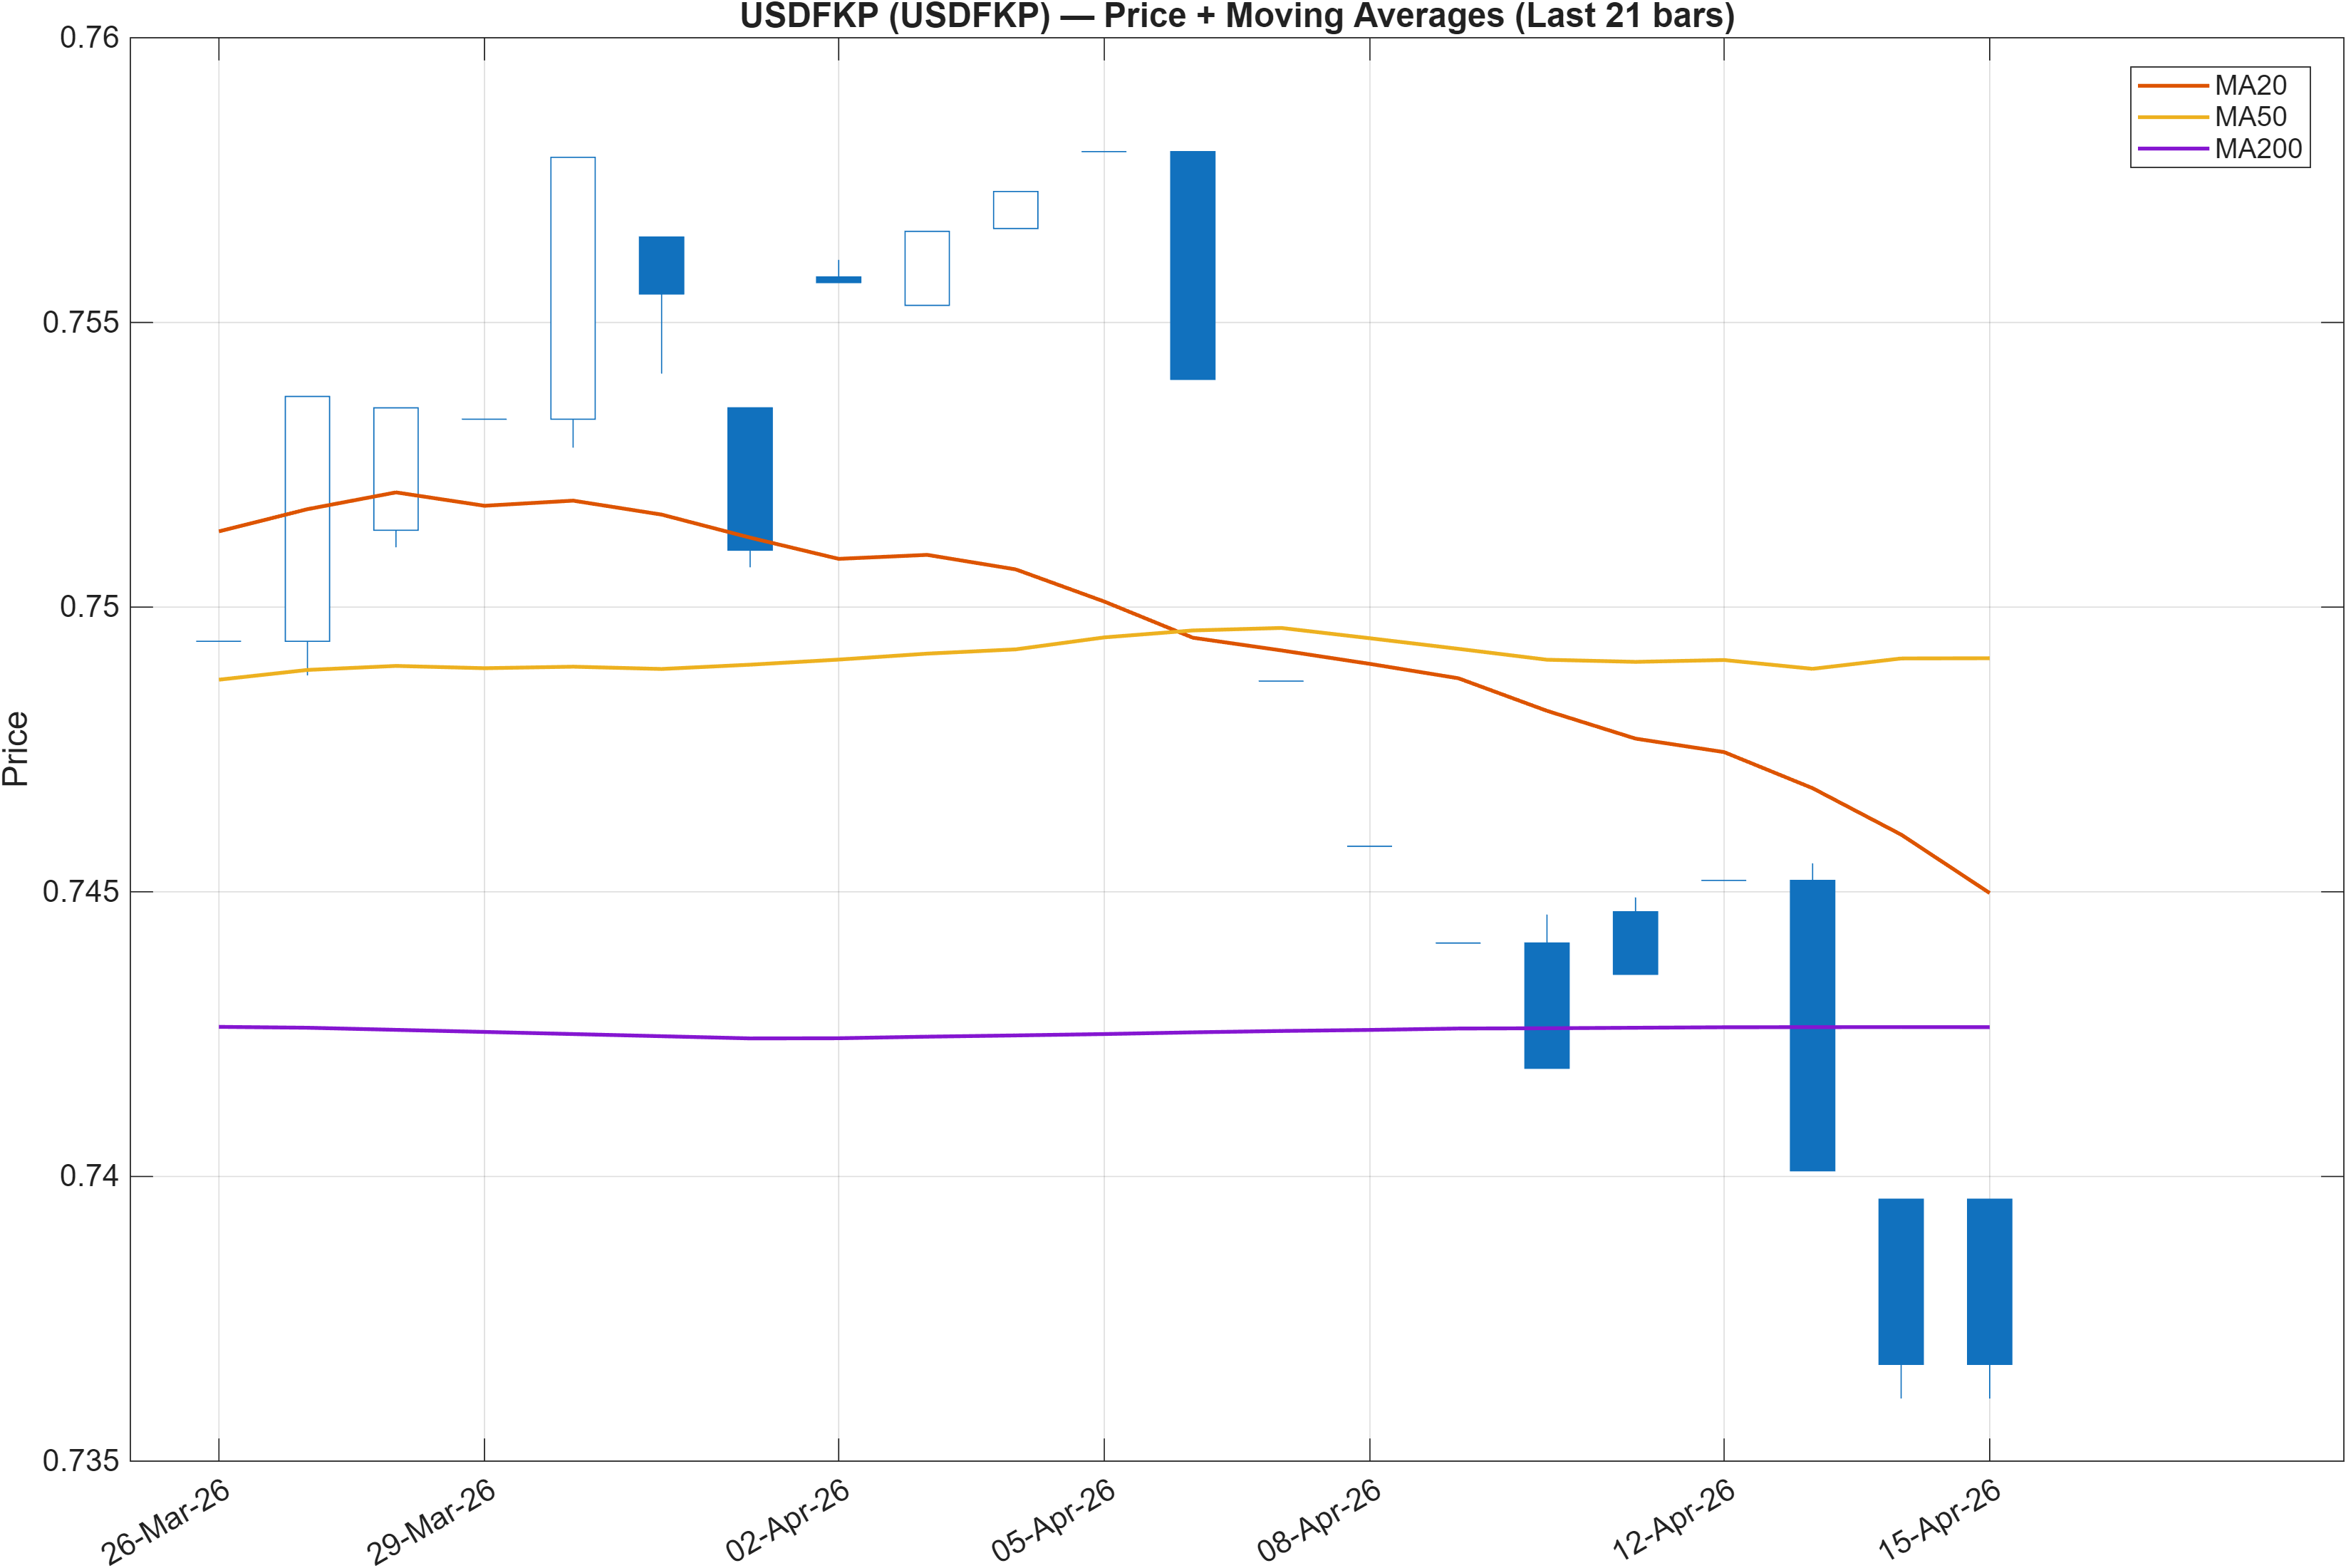
Interpretation: Close vs MA50 = Bearish, MA50 vs MA200 = Bullish.
Regime tension: short-term weakness inside a longer moving-average up-bias
The moving-average read is internally conflicted: price below the MA50 (bearish) while MA50 above MA200 (bullish). Structurally, this often characterizes a market that remains in a broader upward regime (longer average still above the slower one) but is undergoing a meaningful pullback or drawdown phase on the shorter window. That interpretation aligns with the horizon split in ranks, where the 6-month rank (#328) is materially stronger than the weekly/monthly ranks (#941 / #929).
For trend-followers, the critical issue is whether the current weakness is merely a corrective move within a still-positive longer-term structure, or whether it is the early stage of a regime transition that eventually pulls the MA50 down toward the MA200. The model’s present stance leans defensive: the intermediate horizons are positioned bearishly, and the technical stack (Section 5) blends to -0.456 (Bearish).
With support/resistance levels defined at 0.7369 and 0.7563, trend interpretation becomes more practical when mapped to those zones. A market holding above the support band while attempting to reclaim resistance tends to be read as trend repair; repeated rejection below resistance while leaning on support tends to look like distribution and continued pressure. The provided moving-average configuration supports this “test-and-resolve” framing rather than a clean directional signal.
3) Momentum & volatility dashboard
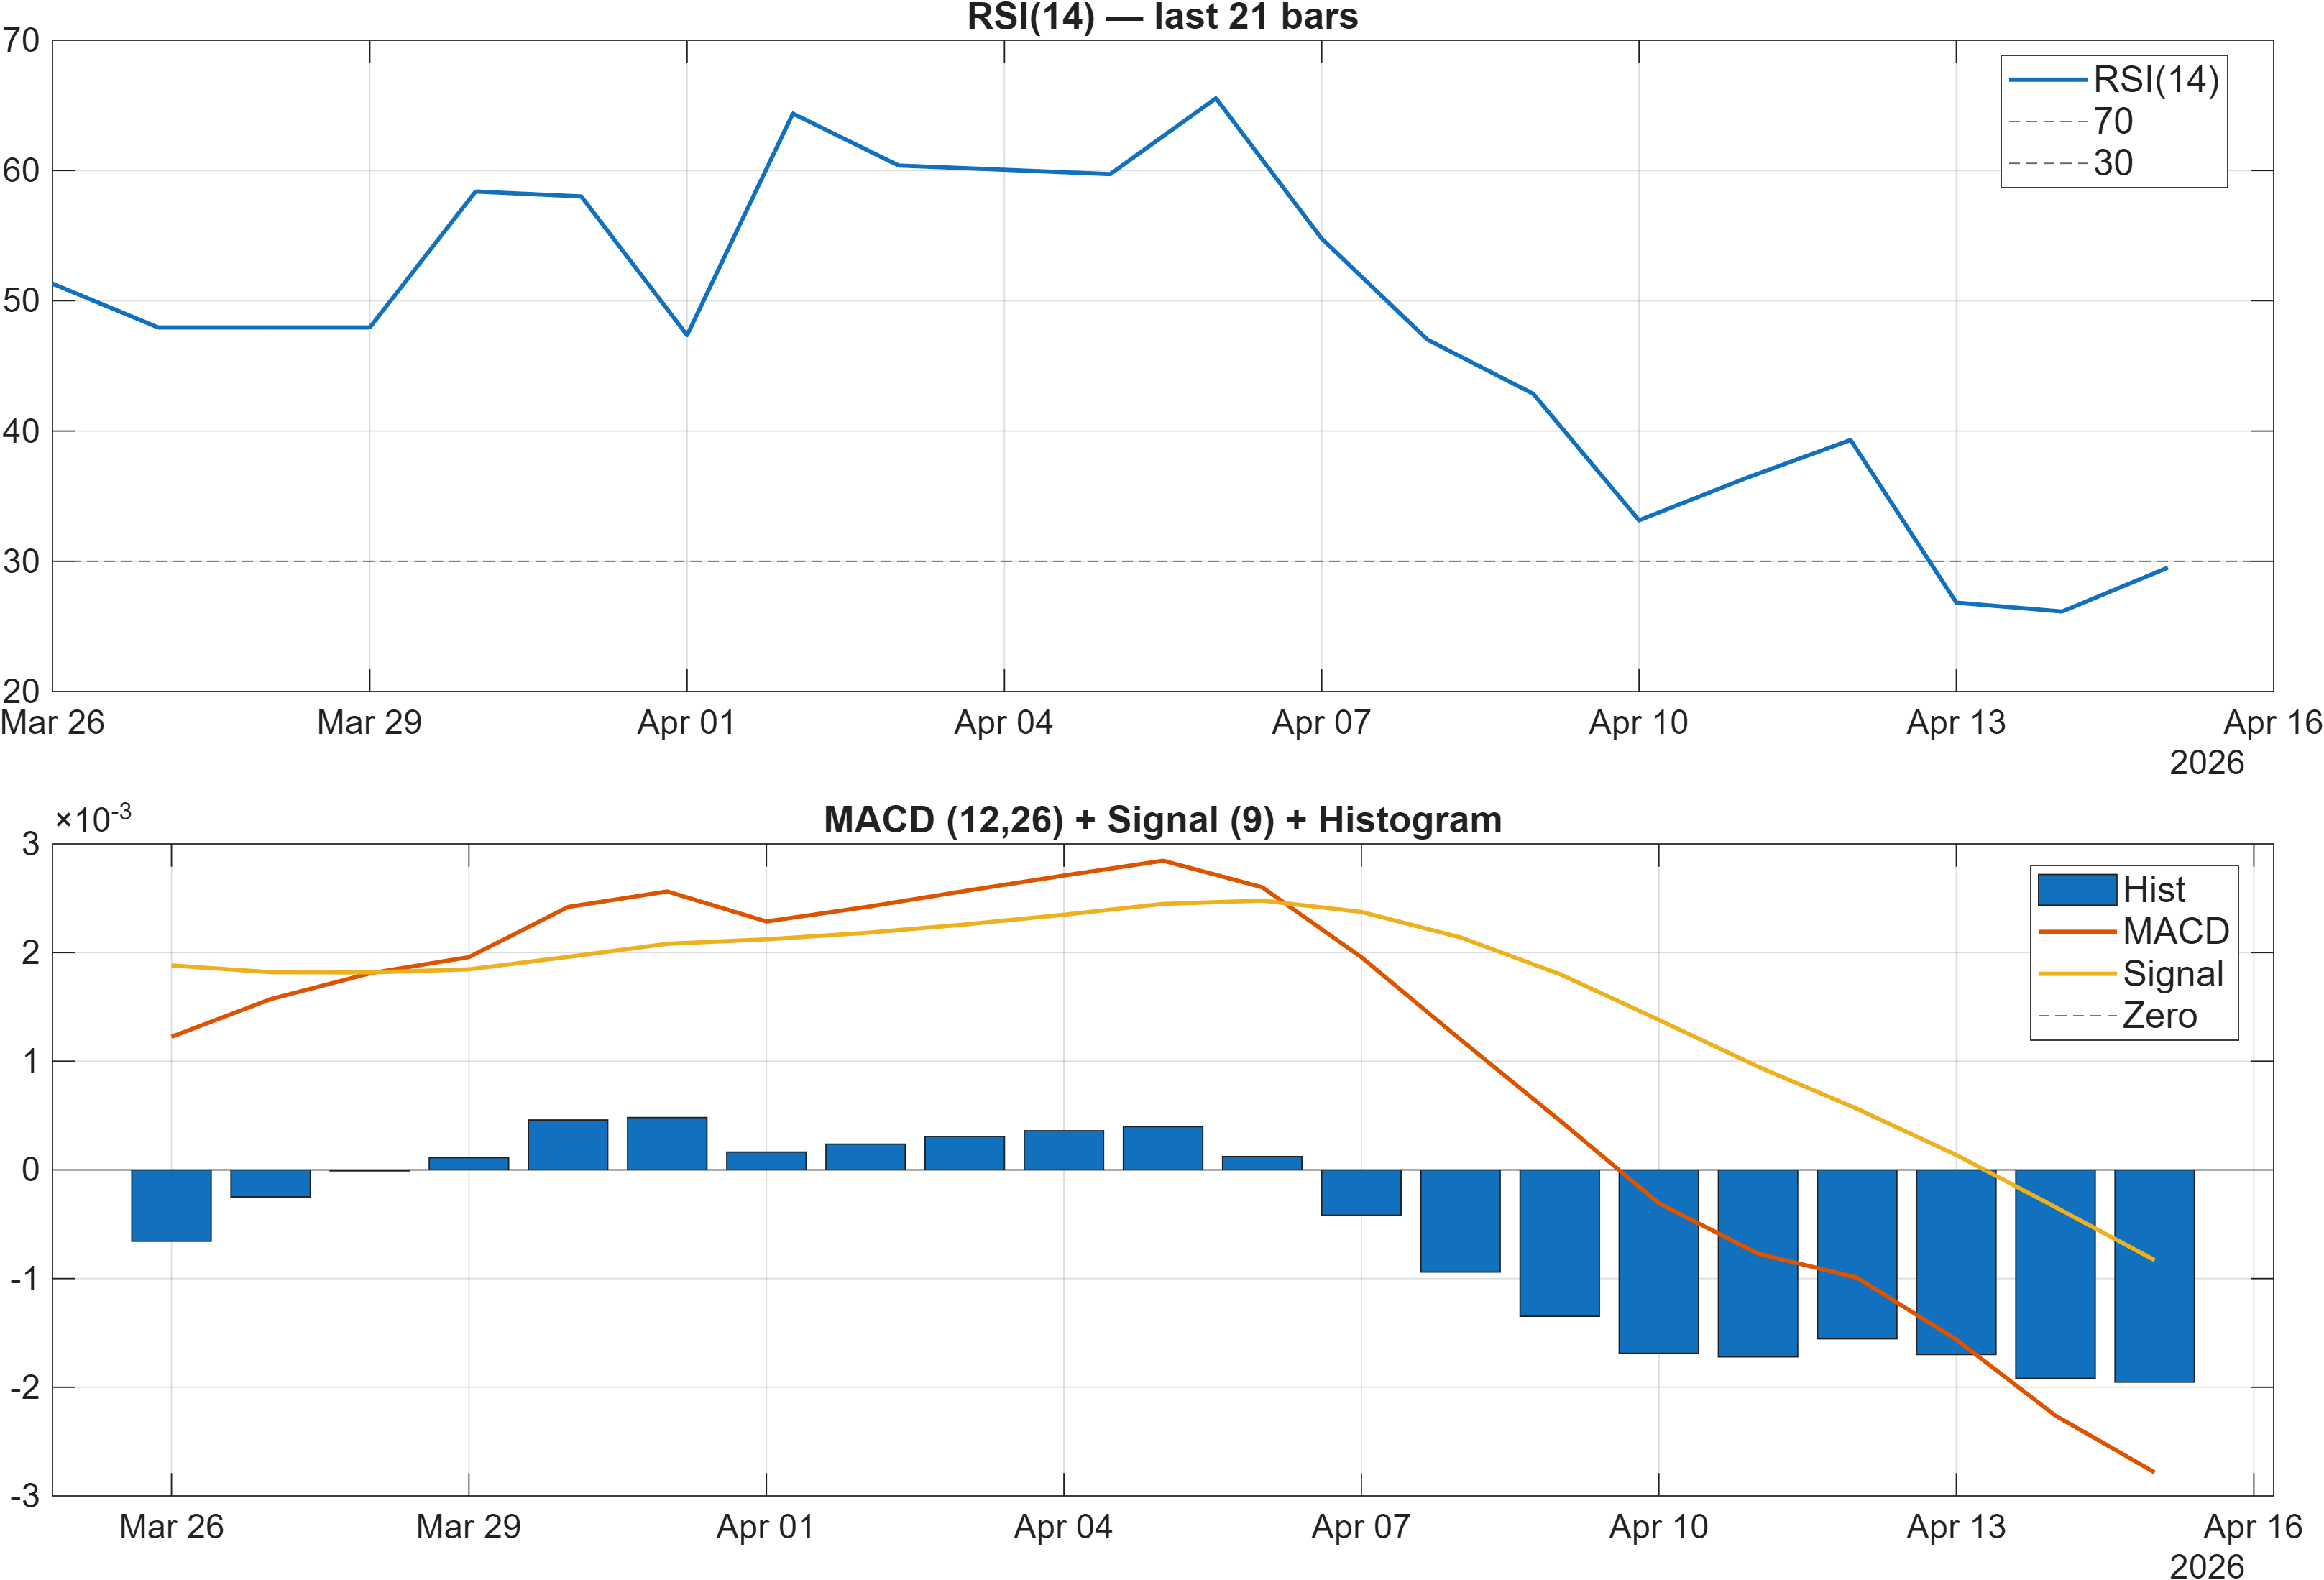
Interpretation: RSI bias = Bearish, MACD hist = -0.0020.
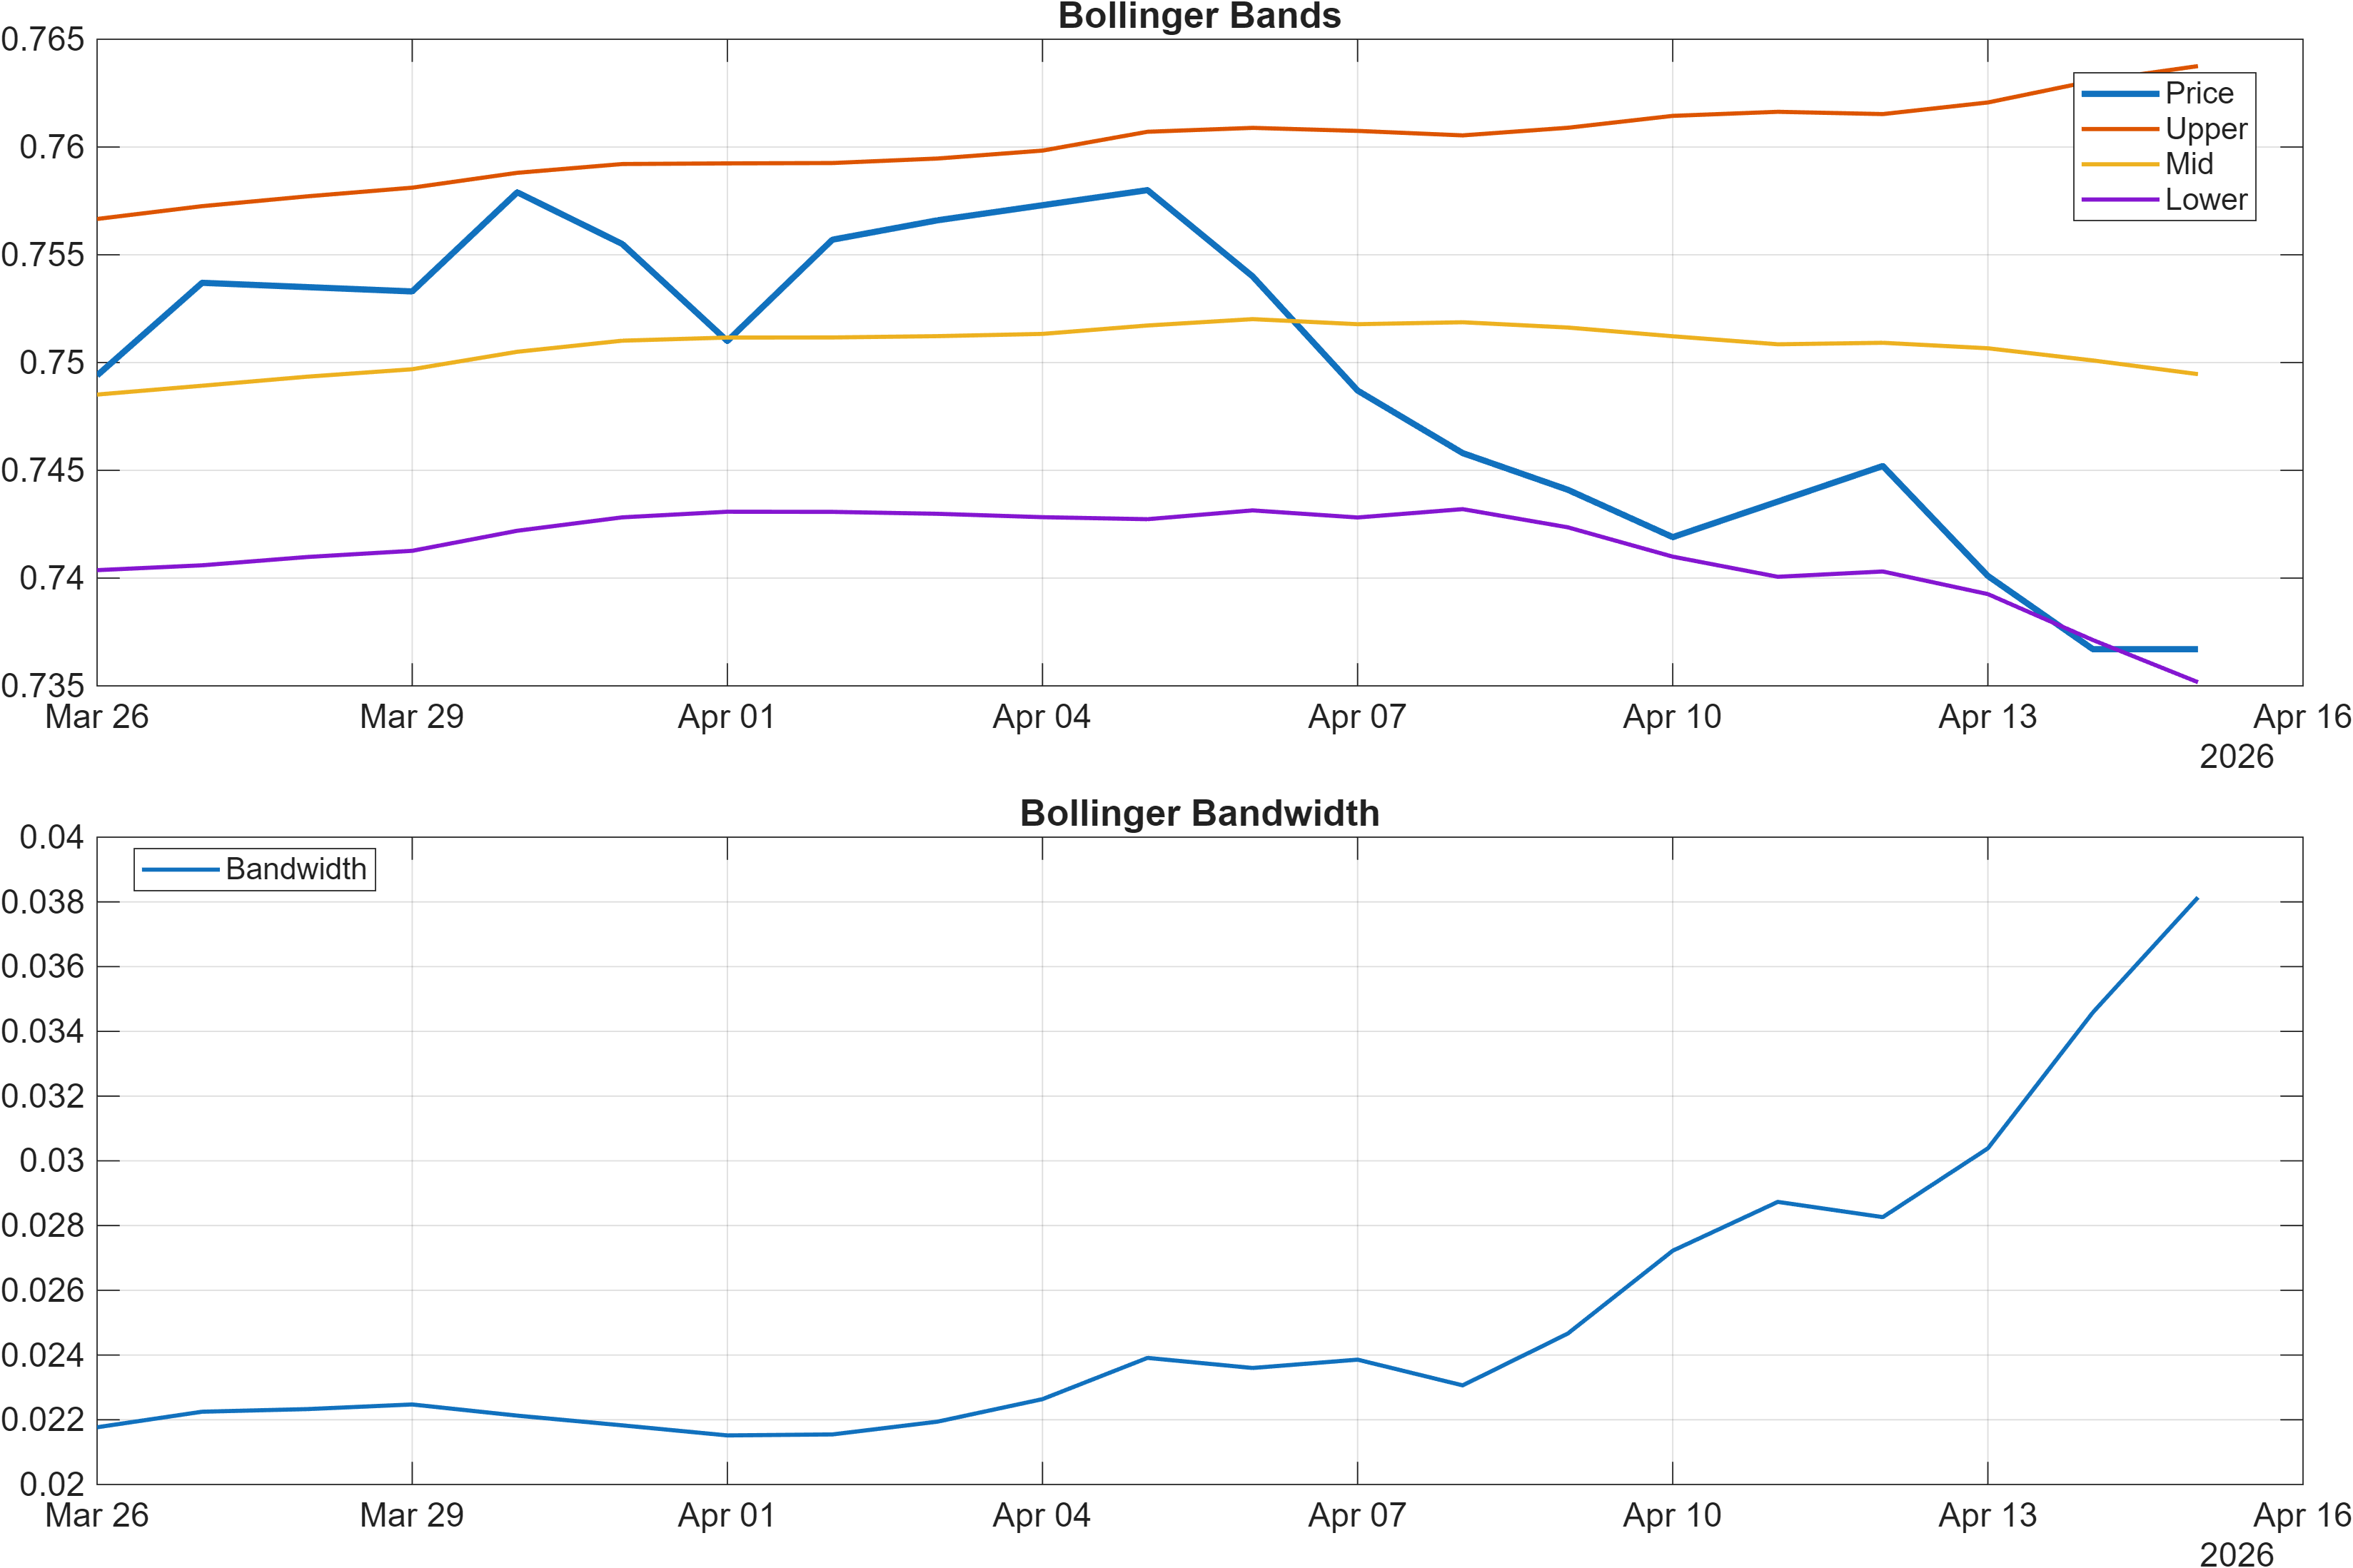
Interpretation: Bandwidth (volatility regime) latest = 0.0381.
Momentum pressure with limited volatility expansion
Momentum metrics remain skewed to the downside. The dashboard notes RSI bias = Bearish, and the RSI reading in the signal set is 29.51, a level that frequently coincides with oversold conditions. Oversold does not function as a timing tool by itself; in many FX regimes it can persist while price continues to drift lower, especially when intermediate-horizon ranks are weak (#941 weekly; #929 monthly).
The MACD histogram at -0.0020 reinforces that downside momentum remains present rather than fully stabilizing. When MACD stays negative while RSI is depressed, the common pattern is failed rebounds unless a clear catalyst (technical or flow-based) shifts the slope of momentum. In the 18-signal table, TS Mom(20) = -0.017 and TS Accel = -0.0256 further align with decelerating conditions, which is consistent with a market that is still “leaning down” rather than basing cleanly.
Volatility context matters for interpreting these momentum signals. Bollinger bandwidth at 0.0381 indicates a relatively contained volatility regime rather than a dramatic expansion. In practice, this can mean price remains vulnerable to grinding moves that pressure support zones without the cathartic reversal signatures often associated with high-volatility washouts. That makes the next interaction with 0.7369 (support) and 0.7563 (resistance) especially informative: contained volatility often compresses decision-making into tighter, level-driven outcomes.
4) Support / Resistance zones
Support ~ 0.7369 | Resistance ~ 0.7563
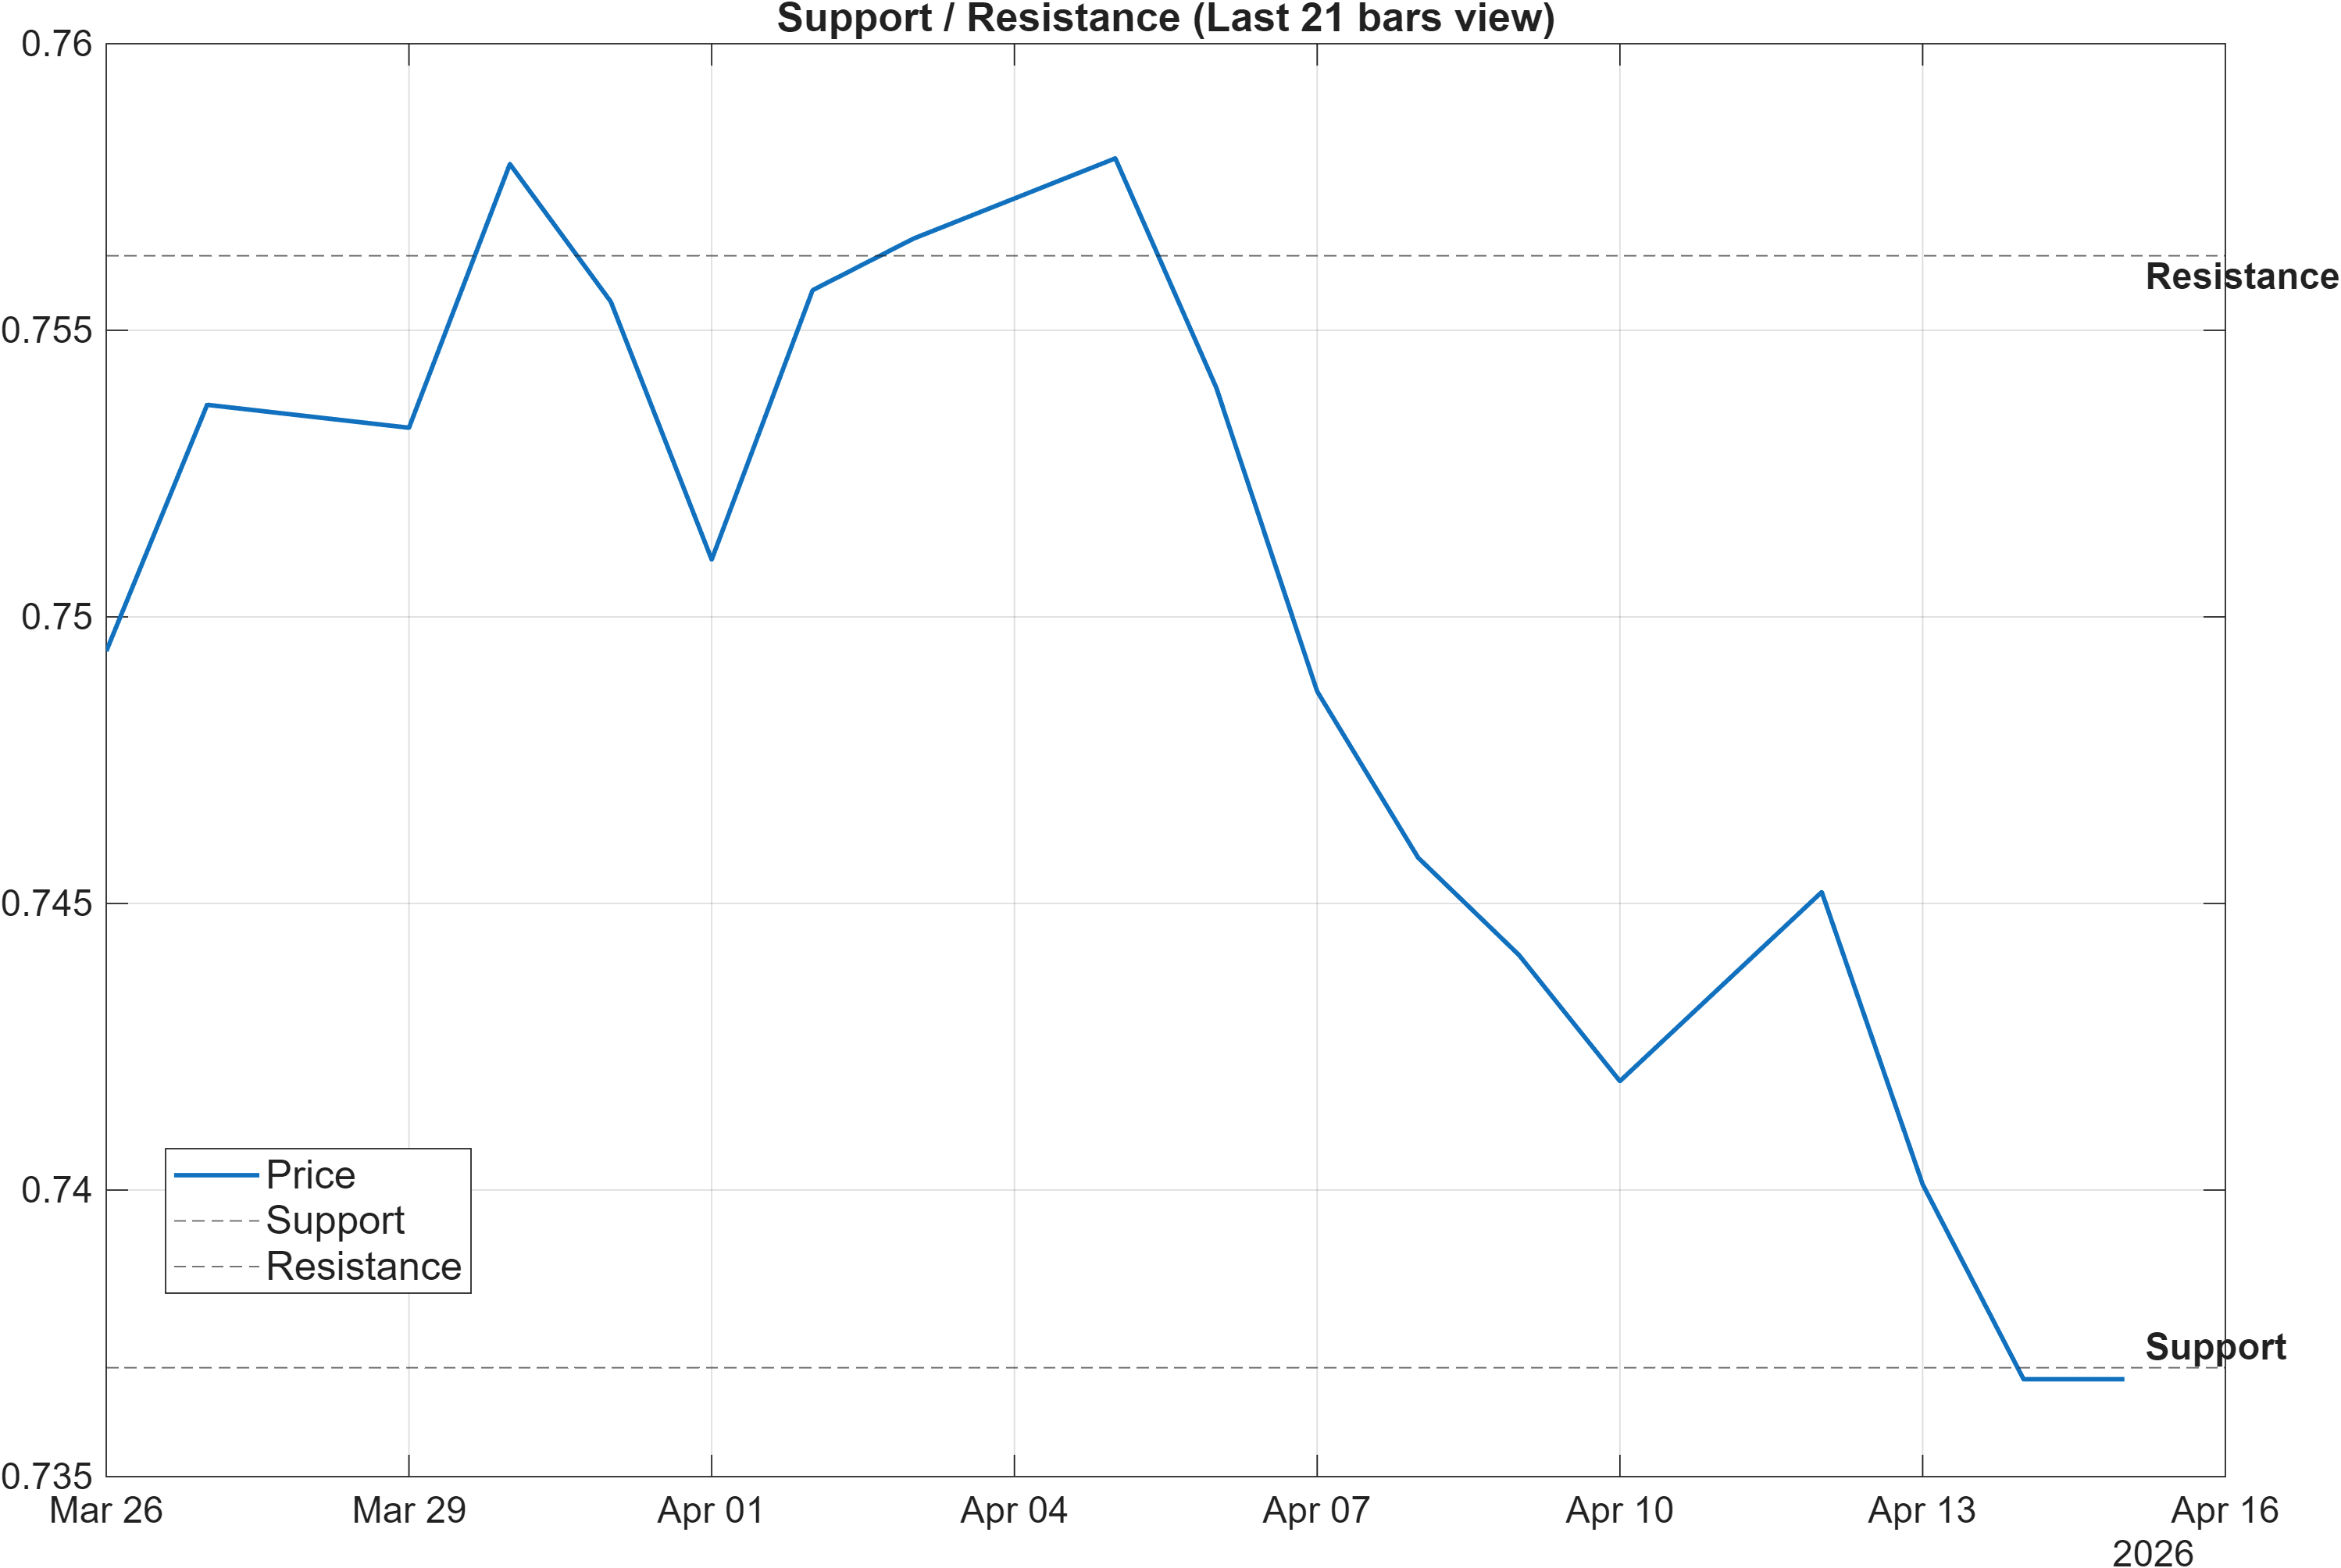
Scenario view: Break above resistance with volume → continuation. Close below support → signal deterioration risk.
Decision zones: level integrity versus drift-through risk
The current framework defines a clean two-sided map: support near 0.7369 and resistance near 0.7563. With the broader signal blend leaning bearish (-0.456) and intermediate-horizon ranks sitting in the weak tail (#941 weekly; #929 monthly), the market is effectively operating under a higher burden of proof for bullish continuation. In that setting, resistance becomes more than an upside checkpoint—it functions as the primary boundary that would need to be reclaimed to argue that downside pressure is easing.
Support, meanwhile, is the immediate integrity test. The scenario guidance is explicit: a close below support elevates deterioration risk. This aligns with momentum conditions that are already stressed (RSI 29.51, MACD histogram -0.0020)—signals that can produce sharp reactions around support, but also leave the market susceptible to break-and-continue outcomes if buyers fail to defend the zone.
The volatility regime adds nuance. With bandwidth at 0.0381, the market is not flagged as being in an extreme expansion phase. When volatility is contained, the more common failure mode is a slow bleed through support rather than an immediate, high-range breakdown. Conversely, if price approaches support and begins to hold while momentum stabilizes, the same contained-volatility backdrop can produce an orderly mean reversion toward resistance. Within this provided structure, the next high-information signal is whether price can avoid a closing break below 0.7369 while attempting to pressure 0.7563.
5) Quant Technical Dashboard (18 Signals)
KGNAI AI Technical Analysis Score (Deep Reinforcement Learning): Rank #901 out of 963 (Rank 1 represents the strongest technical positioning and a higher probability of favorable price behavior. As ranks increase toward the maximum, the probability of favorable outcomes weakens and bearish positioning becomes more dominant.) | Label: Bearish | Score: -0.871
18-Signal Technical Confluence Score: -0.278 (Neutral)
Overall Technical Score (18-signal confluence + DRL rank blend): -0.456 (Bearish)
Note: The blended score reflects signal strength weighted against broader AI technical ranking, which may temporarily diverge.
Blended technical score breakdown: -0.456 (Bearish | Bull 3 / Bear 8 / Neutral 7)
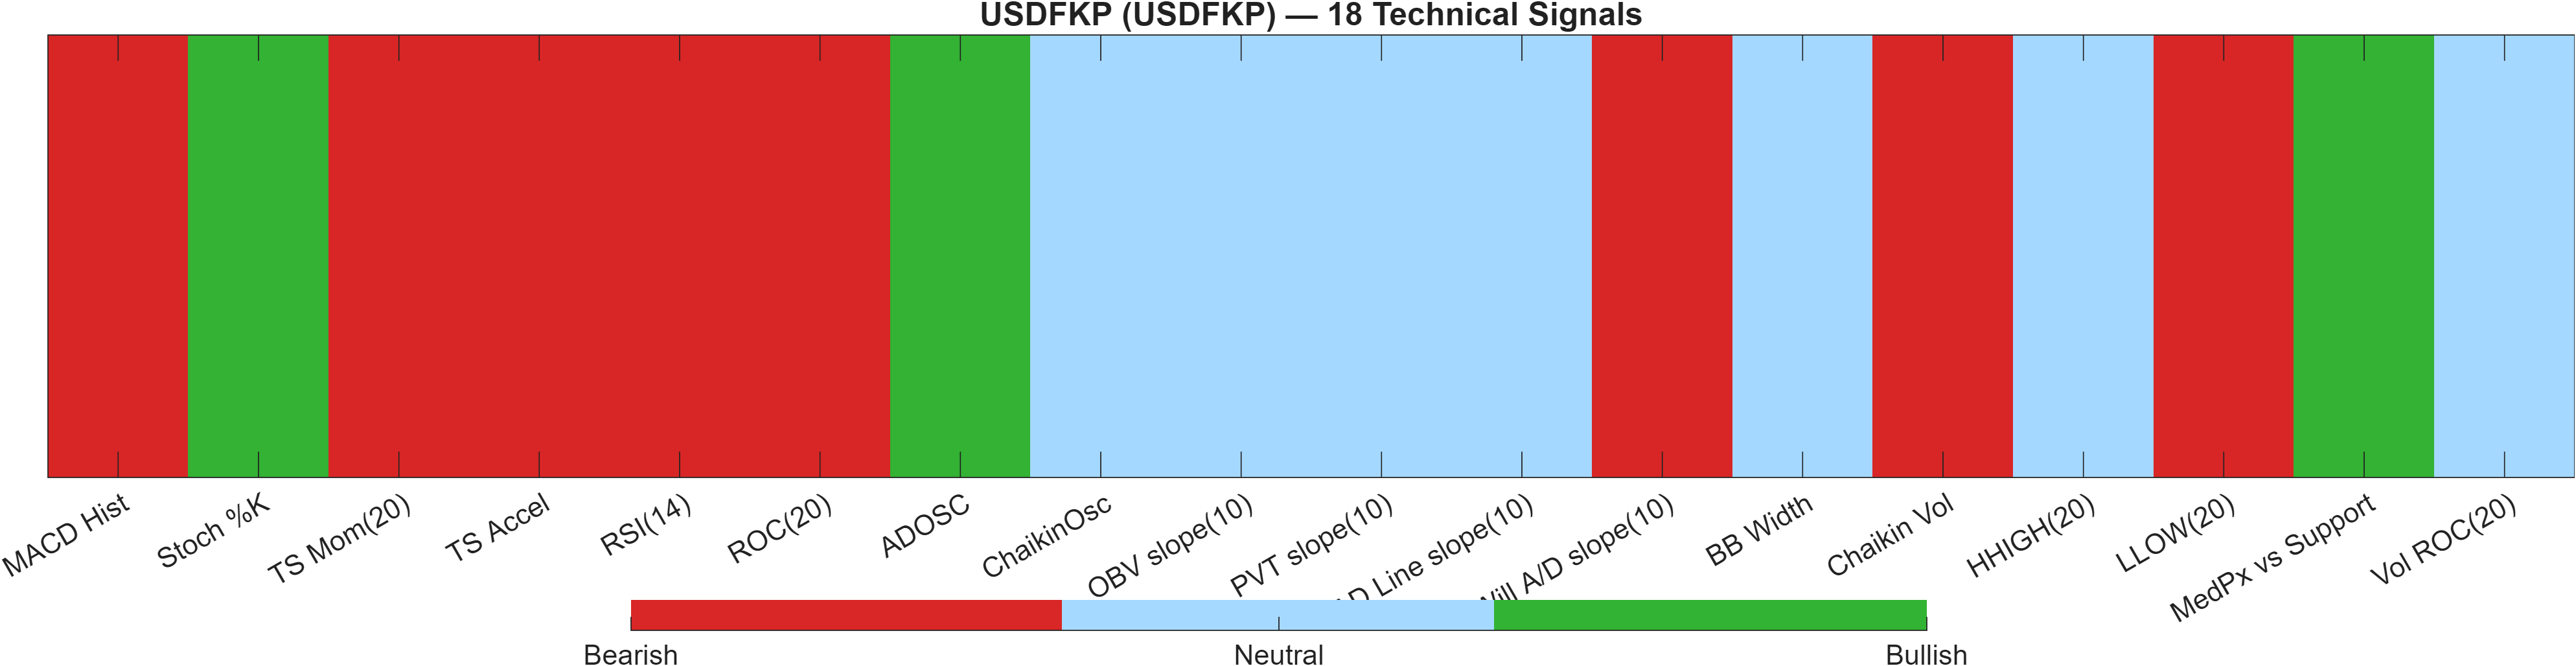
Model blend: neutral confluence overridden by weak AI technical rank
The technical dashboard highlights a signal hierarchy that matters for interpretation. The 18-signal confluence score is -0.278, labeled Neutral, which suggests indicator-level evidence is mixed rather than uniformly bearish. However, the Deep Reinforcement Learning technical rank is #901 out of 963 with a score of -0.871 and a Bearish label. That weak AI-rank layer pulls the blended assessment down to an overall technical score of -0.456 (Bearish).
The breakdown—Bull 3 / Bear 8 / Neutral 7—supports the idea of asymmetric risk: there are bullish pockets, but they do not dominate the set. For example, Stoch %K at 2.74 is marked bullish, consistent with oversold rebound potential, and ADOSC at 8.571 is also bullish, hinting at constructive accumulation/flow signals within the window. Offsetting those, core momentum and rate-of-change measures are negative: MACD Hist -0.001953, ROC(20) -2.256, and TS Mom(20) -0.017 are all flagged bearish.
The practical implication is that “oversold bounce” signatures may appear, but the blended system is not yet validating them as durable. With the Bollinger width reading of 0.03814 marked neutral and multiple volume/flow slopes listed as neutral (several at 0 or —), the dashboard is not signaling broad participation strong enough to outweigh the AI-rank weakness. This keeps the focus on confirmation around 0.7563 and defense of 0.7369.
Signal table (Bull/Bear/Neutral)
| Indicator | Value | Signal |
|---|---|---|
| MACD Hist | -0.001953 | Bearish |
| Stoch %K | 2.74 | Bullish |
| TS Mom(20) | -0.017 | Bearish |
| TS Accel | -0.0256 | Bearish |
| RSI(14) | 29.51 | Bearish |
| ROC(20) | -2.256 | Bearish |
| ADOSC | 8.571 | Bullish |
| ChaikinOsc | 0 | Neutral |
| OBV slope(10) | 0 | Neutral |
| PVT slope(10) | 0 | Neutral |
| AD Line slope(10) | — | Neutral |
| Will A/D slope(10) | -0.0221 | Bearish |
| BB Width | 0.03814 | Neutral |
| Chaikin Vol | 29.23 | Bearish |
| HHIGH(20) | 0.758 | Neutral |
| LLOW(20) | 0.7361 | Bearish |
| MedPx vs Support | 0.00095 | Bullish |
| Vol ROC(20) | — | Neutral |
Interpretation: Indicator-level signals form the base confluence, which is then adjusted using a separate AI-driven technical ranking model. The final technical score summarizes this combined view.
6) News sentiment + extractive gist
Note: Instrument-specific news matches were not found, so the digest includes broader market/sector headlines. Links are provided for verification.
Sentiment score (avg): 0.025 | Positive: 31% | Neutral: 50% | Negative: 19%
KGNAI AI News Sentiment Score (normalized -1 to +1): Not available (as of —) | Label: Not available | Overall news score: 0.03
Positive Developments
Recent coverage across major financial outlets indicates a moderately constructive macro tone driven by intermittent risk-on impulses: expectations around diplomatic progress have been associated with calmer pricing in risk assets, while narratives around de-escalation have coincided with easing near-term geopolitical premia in energy. For FX markets, these conditions can reduce demand for pure defensive positioning and increase sensitivity to relative-rate and growth differentials rather than headline shock. In this context, USDFKP’s news sentiment mix leans slightly positive on balance (31% positive versus 19% negative), though the average score remains close to flat at 0.025. The implication is that the news backdrop is not strongly directional for this instrument, but it can still influence short-horizon volatility around technical levels—especially when the technical state is already stressed (e.g., RSI(14) 29.51) and markets are prone to sharp mean-reversion attempts.
Neutral / Mixed Developments
The dominant message flow is best described as mixed and informational: the market appears to be weighing shifting expectations without a single, durable theme that anchors FX direction. This aligns with the sentiment distribution’s 50% neutral share and with the platform note that instrument-specific matches were not found. For interpretation, that matters because macro-driven narratives can move broad USD positioning, but they do not automatically translate into persistent trend for an individual cross. With the technical map tightly defined between 0.7369 (support) and 0.7563 (resistance), neutral headlines tend to function as “noise amplifiers” rather than trend catalysts—pushing price within the range rather than resolving it. In that setting, the technical confirmation signals remain the higher-weight inputs versus day-to-day news drift.
Negative / Risk Signals
Risk-oriented coverage still flags potential volatility triggers: policy uncertainty, intermittent geopolitical tension, and the possibility of renewed shock transmission through energy and trade channels. Even when markets appear calmer, these themes can reprice quickly and tend to impact FX via risk appetite, terms-of-trade expectations, and rate-path repricing. For USDFKP, the primary concern is not that sentiment is deeply negative (negative share is 19%), but that the instrument’s technical condition is already fragile: the blended technical score is -0.456 (Bearish), and the Deep RL technical rank sits at #901 out of 963. In such states, adverse macro headlines can act as catalysts for level breaks rather than merely producing intraday volatility—making the close-below-support condition at 0.7369 the key risk checkpoint in the provided framework.
- Whether price can hold above 0.7369 on a closing basis while momentum stabilizes (RSI/MACD behavior).
- Any sustained push through 0.7563 that coincides with improving technical breadth beyond the current Bull 3 / Bear 8 / Neutral 7 mix.
- Whether volatility remains contained (bandwidth 0.0381) or begins to expand alongside directional follow-through.
Sources referenced: Reuters, Bloomberg, Yahoo Finance, MarketWatch, Investing.com
Snapshot: AI Rank (Short–Mid–Long): Mixed (Bearish tilt) (Bearish–Bearish–Neutral) · Technical Confluence: Neutral · Key Levels: Support ~0.74 | Resistance ~0.76 · News Sentiment: Neutral
7) Sources
- US Dollar Index treads water above 98.00 despite growing market optimism — https://www.fxstreet.com/news/us-dollar-index-treads-water-above-9800-despite-growing-market-optimism-202604150423
- US President Trump: Not thinking about extending the ceasefire — https://www.fxstreet.com/news/us-president-trump-not-thinking-about-extending-the-ceasefire-202604150354
- NZD/USD consolidates around 0.5900; close to one-month high amid peace talks optimism — https://www.fxstreet.com/news/nzd-usd-consolidates-around-05900-close-to-one-month-high-amid-peace-talks-optimism-202604150354
- Pound Sterling slips as US Dollar firms despite Middle East diplomacy hopes — https://www.fxstreet.com/news/pound-sterling-slips-as-us-dollar-firms-despite-middle-east-diplomacy-hopes-202604150331
- USD/CAD gains ground above 1.3700 while outlook remains uncertain amid Iran optimism — https://www.fxstreet.com/news/usd-cad-gains-ground-above-13700-while-outlook-remains-uncertain-amid-iran-optimism-202604150316
- Silver Price Forecast: XAG/USD corrects from one-month top, bullish bias intact near $80.00 — https://www.fxstreet.com/news/silver-price-forecast-xag-usd-corrects-from-one-month-top-bullish-bias-intact-near-8000-202604150312
- Gold eases from four-week top as Hormuz risks temper USD weakness — https://www.fxstreet.com/news/gold-eases-from-four-week-top-as-hormuz-risks-temper-usd-weakness-202604150250
- Australian Dollar gains support from US–Iran talks optimism — https://www.fxstreet.com/news/australian-dollar-gains-support-from-us-iran-talks-optimism-202604150220
You may also like: How KGNAI AI ranks instruments across global markets
Disclaimer: KGNAI provides AI-generated analytics and educational market commentary only. This is not financial advice. Markets involve risk. Always do your own research.