
NOKISK (NOK/ISK) — 29-Apr-2026 Technical Confluence vs Rank Divergence (Cautious Stance)
NOK/ISK (NOKISK) is currently defined by a clear cross-horizon divergence: the daily rank sits at #76 out of 961 (Bullish), while the weekly and monthly ranks remain deep in the lower tail (#946 and #939, both Bearish). This gap matters because it often signals either (a) a short-term tactical rebound inside a broader unfavorable regime, or (b) an early transition that still lacks multi-week confirmation. On pure technicals, moving-average structure is constructive (close vs MA50 Bullish; MA50 vs MA200 Bullish) and momentum indicators lean supportive, including RSI(14) at 66.51 and a positive MACD histogram (0.0024). Volatility is comparatively contained with Bollinger Bandwidth at 0.0368, placing more weight on level discipline around support ~12.7696 and resistance ~13.1610. News sentiment is mixed-to-neutral in distribution, while the normalized model score remains -0.23 (Bearish).
Key Takeaways
- Short / Mid / Long rank stance: Short-term Bearish · Mid-term Bearish · Long-term Neutral (Not available in the provided data)
- Technical confluence label: 18-signal confluence Bullish (0.389) while the blended overall technical score is Neutral (0.116)
- Key levels: Support ~ 12.7696 · Resistance ~ 13.1610
- News sentiment bias: Distribution reads Neutral (avg 0.115; 75% neutral) but normalized score is Bearish (-0.23)
- Confirmation / invalidation condition: Sustained acceptance above 13.1610 would improve continuation odds; a close below 12.7696 elevates deterioration risk per the provided scenario view.
What KGNAI Measures
KGNAI evaluates assets using large cross-sectional datasets built from millions of structured data points. Inputs incorporate fundamental metrics, technical structures, and systematically processed news sentiment. Statistical models, machine learning, and AI frameworks are used to assess relative positioning, signal alignment, and probabilistic behavior across broad universes.
How to Read This Report
- Ranks are comparative across the tracked universe, not absolute price targets.
- Confluence reflects alignment among independent signal groups.
- Support/resistance levels are probabilistic decision zones, not guarantees.
- Sentiment provides contextual bias within the broader analytical framework.
1) KGNAI AI Analysis
Region: FOREX
Total universe size: 961 ranked instruments
- Daily rank: #76 out of 961 — Bullish
- Weekly rank: #946 out of 961 — Bearish
- Monthly rank: #939 out of 961 — Bearish
- 3-Monthly rank: #934 out of 961 — Bearish
- 6-Monthly rank: Not available for this horizon — Not available
- Yearly rank: Not available for this horizon — Not available
The ranking profile is best understood as a timeframe conflict. The daily placement in the upper decile (#76) suggests near-term behavior has improved versus the broad FX universe, yet the weekly and monthly ranks (#946 and #939) remain near the bottom, implying that the broader regime is still assessed as unfavorable. When this shape appears, the key question is persistence: whether the short-term strength can survive multiple evaluation cycles and begin pulling intermediate horizons higher, or whether it fades and the longer-horizon weakness reasserts.
The 3-month horizon (#934) reinforces that the current daily improvement is not yet reflected in multi-month comparisons. In practice, this often coincides with either a counter-trend rally or a stabilization phase that has not matured into a confirmed transition. Consistent with that interpretation, the technical layer later in the report shows a Bullish 18-signal confluence (0.389) but only a Neutral blended technical score (0.116), meaning the indicator stack is improving while the broader AI technical ranking still applies a restraint.
The provided term view remains Bearish for short- and mid-term, with long-term not available in the provided data. For NOKISK, the most decision-relevant takeaway is that any constructive daily behavior is occurring against a backdrop of weaker multi-week ranking pressure—so confirmation should be judged by whether higher timeframes begin to move away from the current extreme bearish cluster rather than by isolated daily strength.
Term view: Short-term: Bearish. Mid-term: Bearish. Long-term: Not available.
Want the full universe and complete rank tables? Unlock full access on KGNAI: https://www.kgnai.com/pricing
2) Price & trend overview
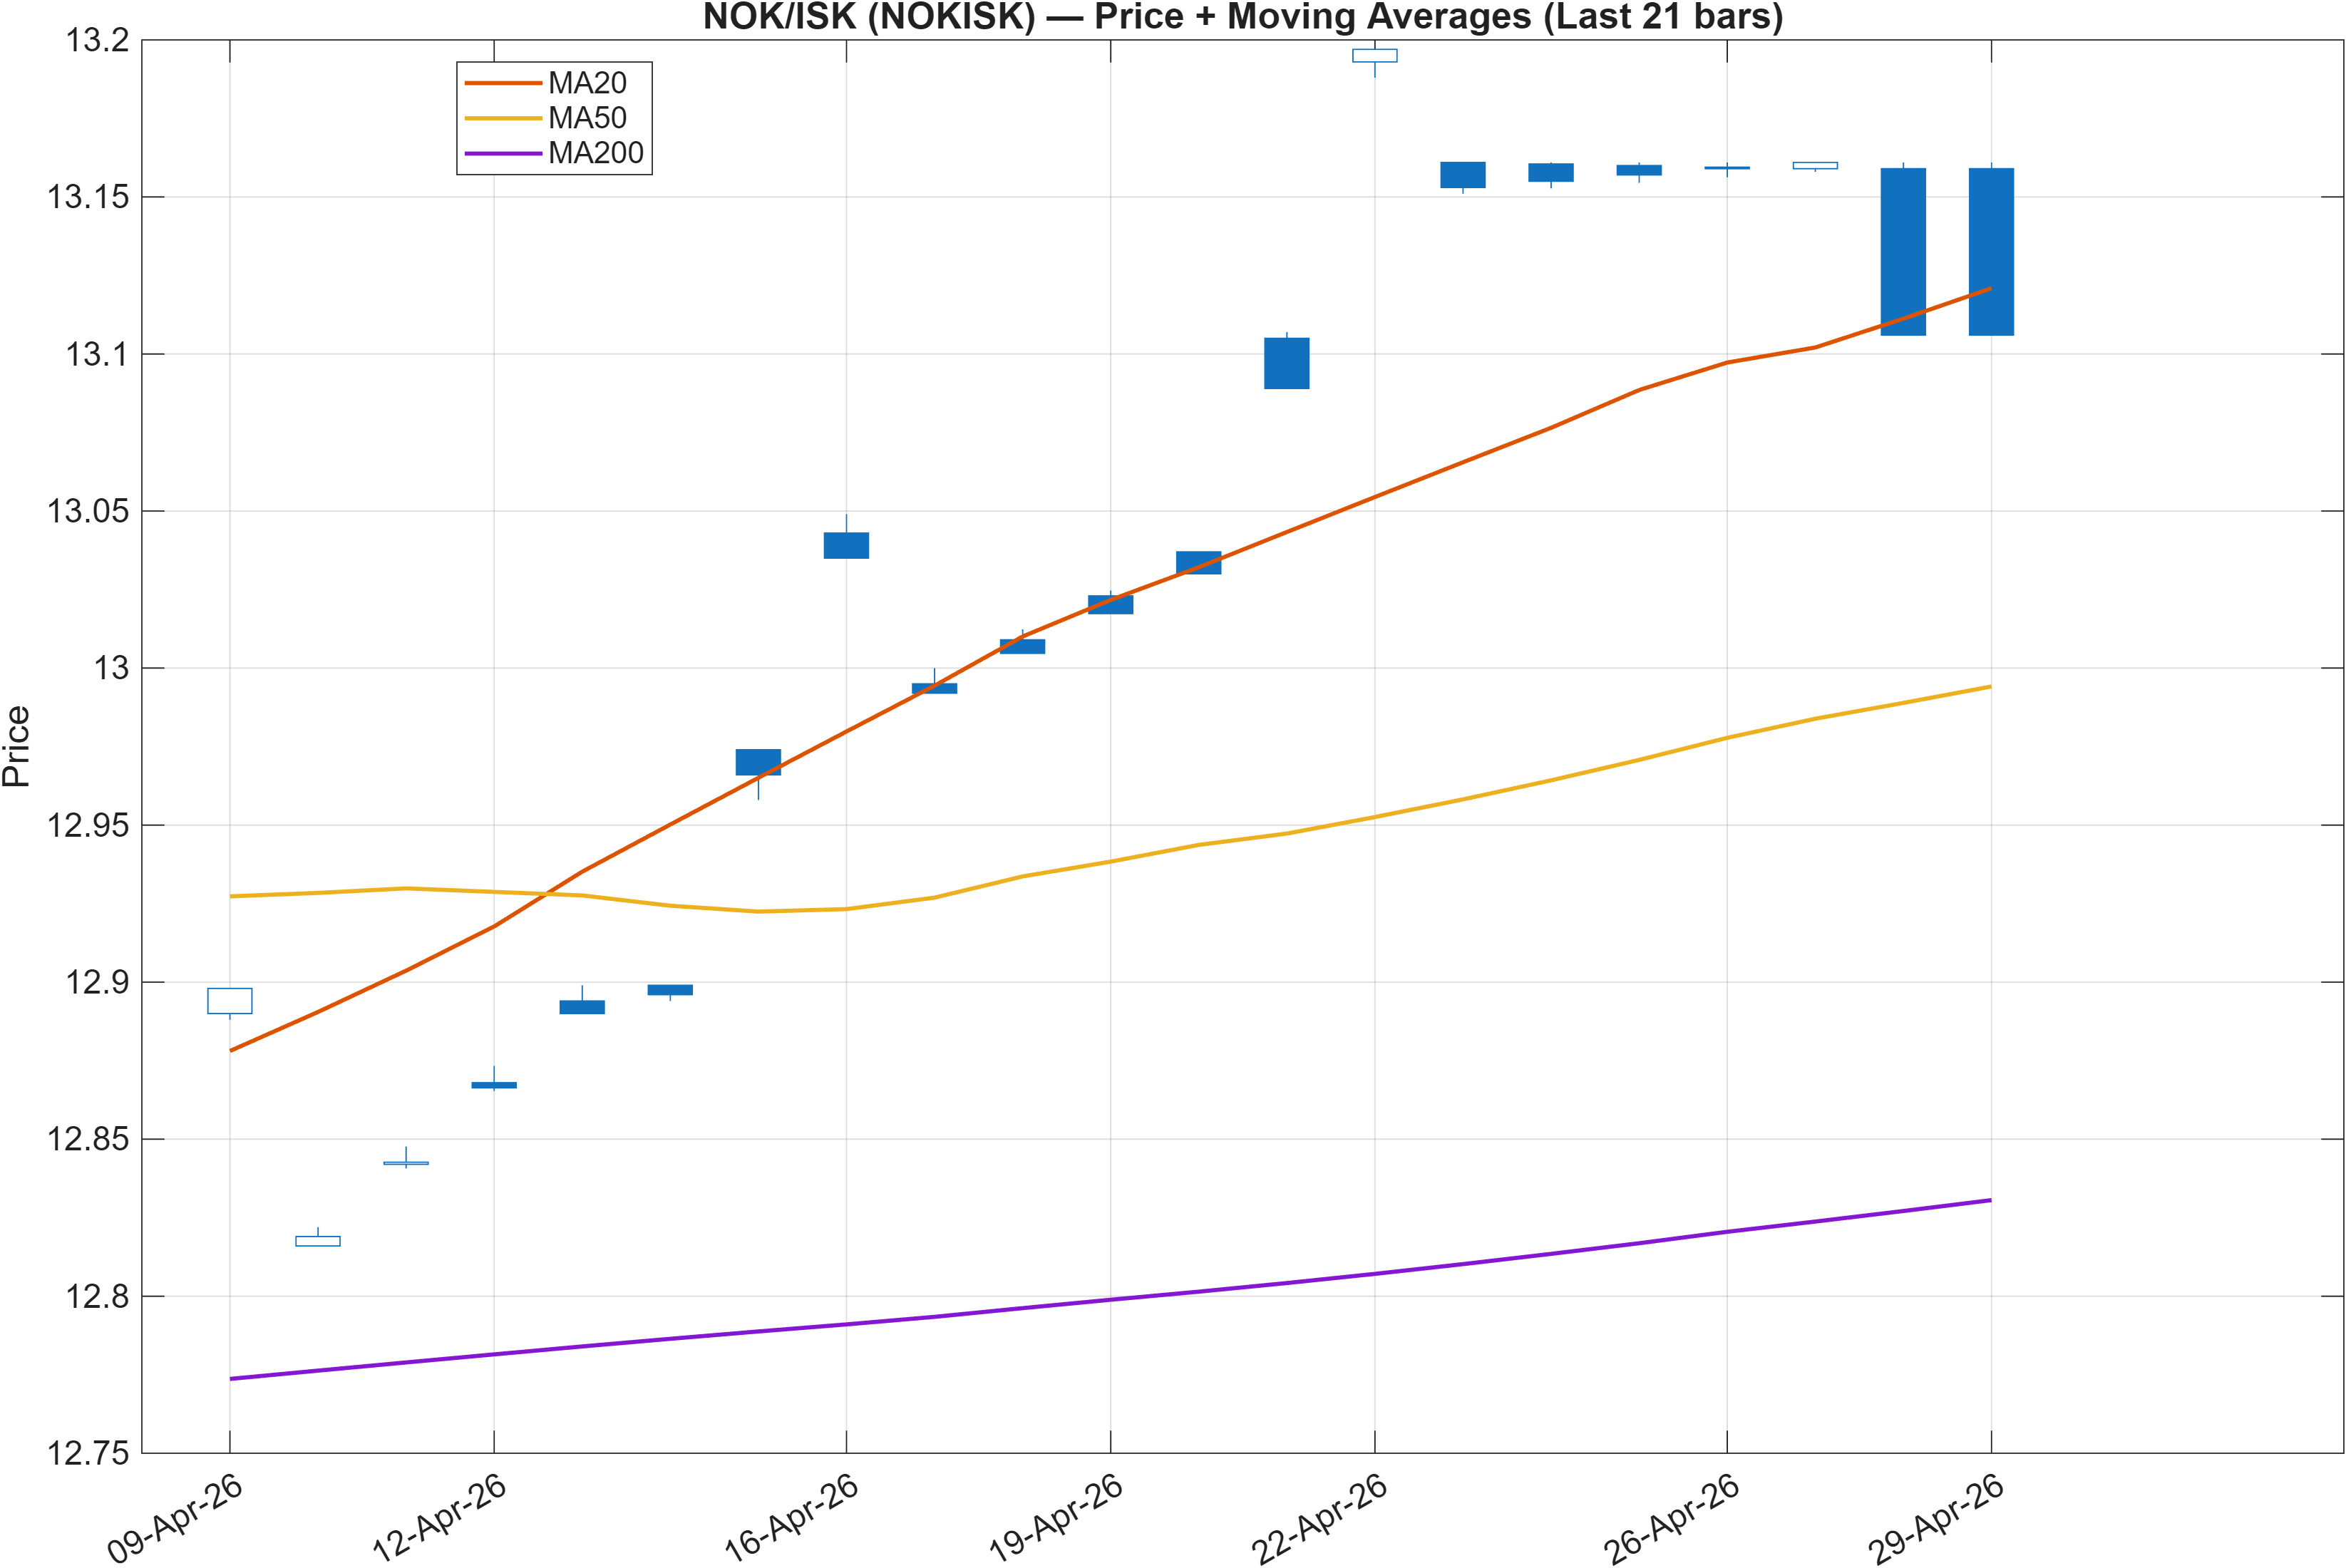
Interpretation: Close vs MA50 = Bullish, MA50 vs MA200 = Bullish.
Trend structure: constructive slope, but rank regime still disagrees
NOKISK’s trend read is supportive on two independent moving-average tests: price is above the MA50, and the MA50 is above the MA200 (both flagged Bullish). That combination typically reflects a market that has already shifted into an improving medium-term structure rather than merely bouncing intraday. However, the ranking layer is not confirming the same degree of strength across horizons: the weekly rank at #946 and monthly rank at #939 still sit near the weakest end of the 961-instrument universe.
This disconnect is analytically useful because it forces a differentiation between chart-level trend and cross-sectional quality. A pair can trend positively and still be ranked poorly if its pattern is less robust than peers, if volatility-adjusted behavior remains unattractive, or if recent improvements are too new to dominate the multi-week scorecards. In that context, the moving-average alignment should be treated as a necessary condition for stabilization, not a sufficient condition for a regime change in the ranks.
The level map later in the report further frames the trend: the market is operating between support near 12.7696 and resistance near 13.1610. When trend signals are positive but cross-sectional ranks are still extreme on the bearish side, price behavior around these boundaries often becomes the differentiator—acceptance above resistance can help the trend evidence “graduate” into higher-timeframe ranking improvement, while a loss of support would argue the moving-average positives were not durable.
3) Momentum & volatility dashboard
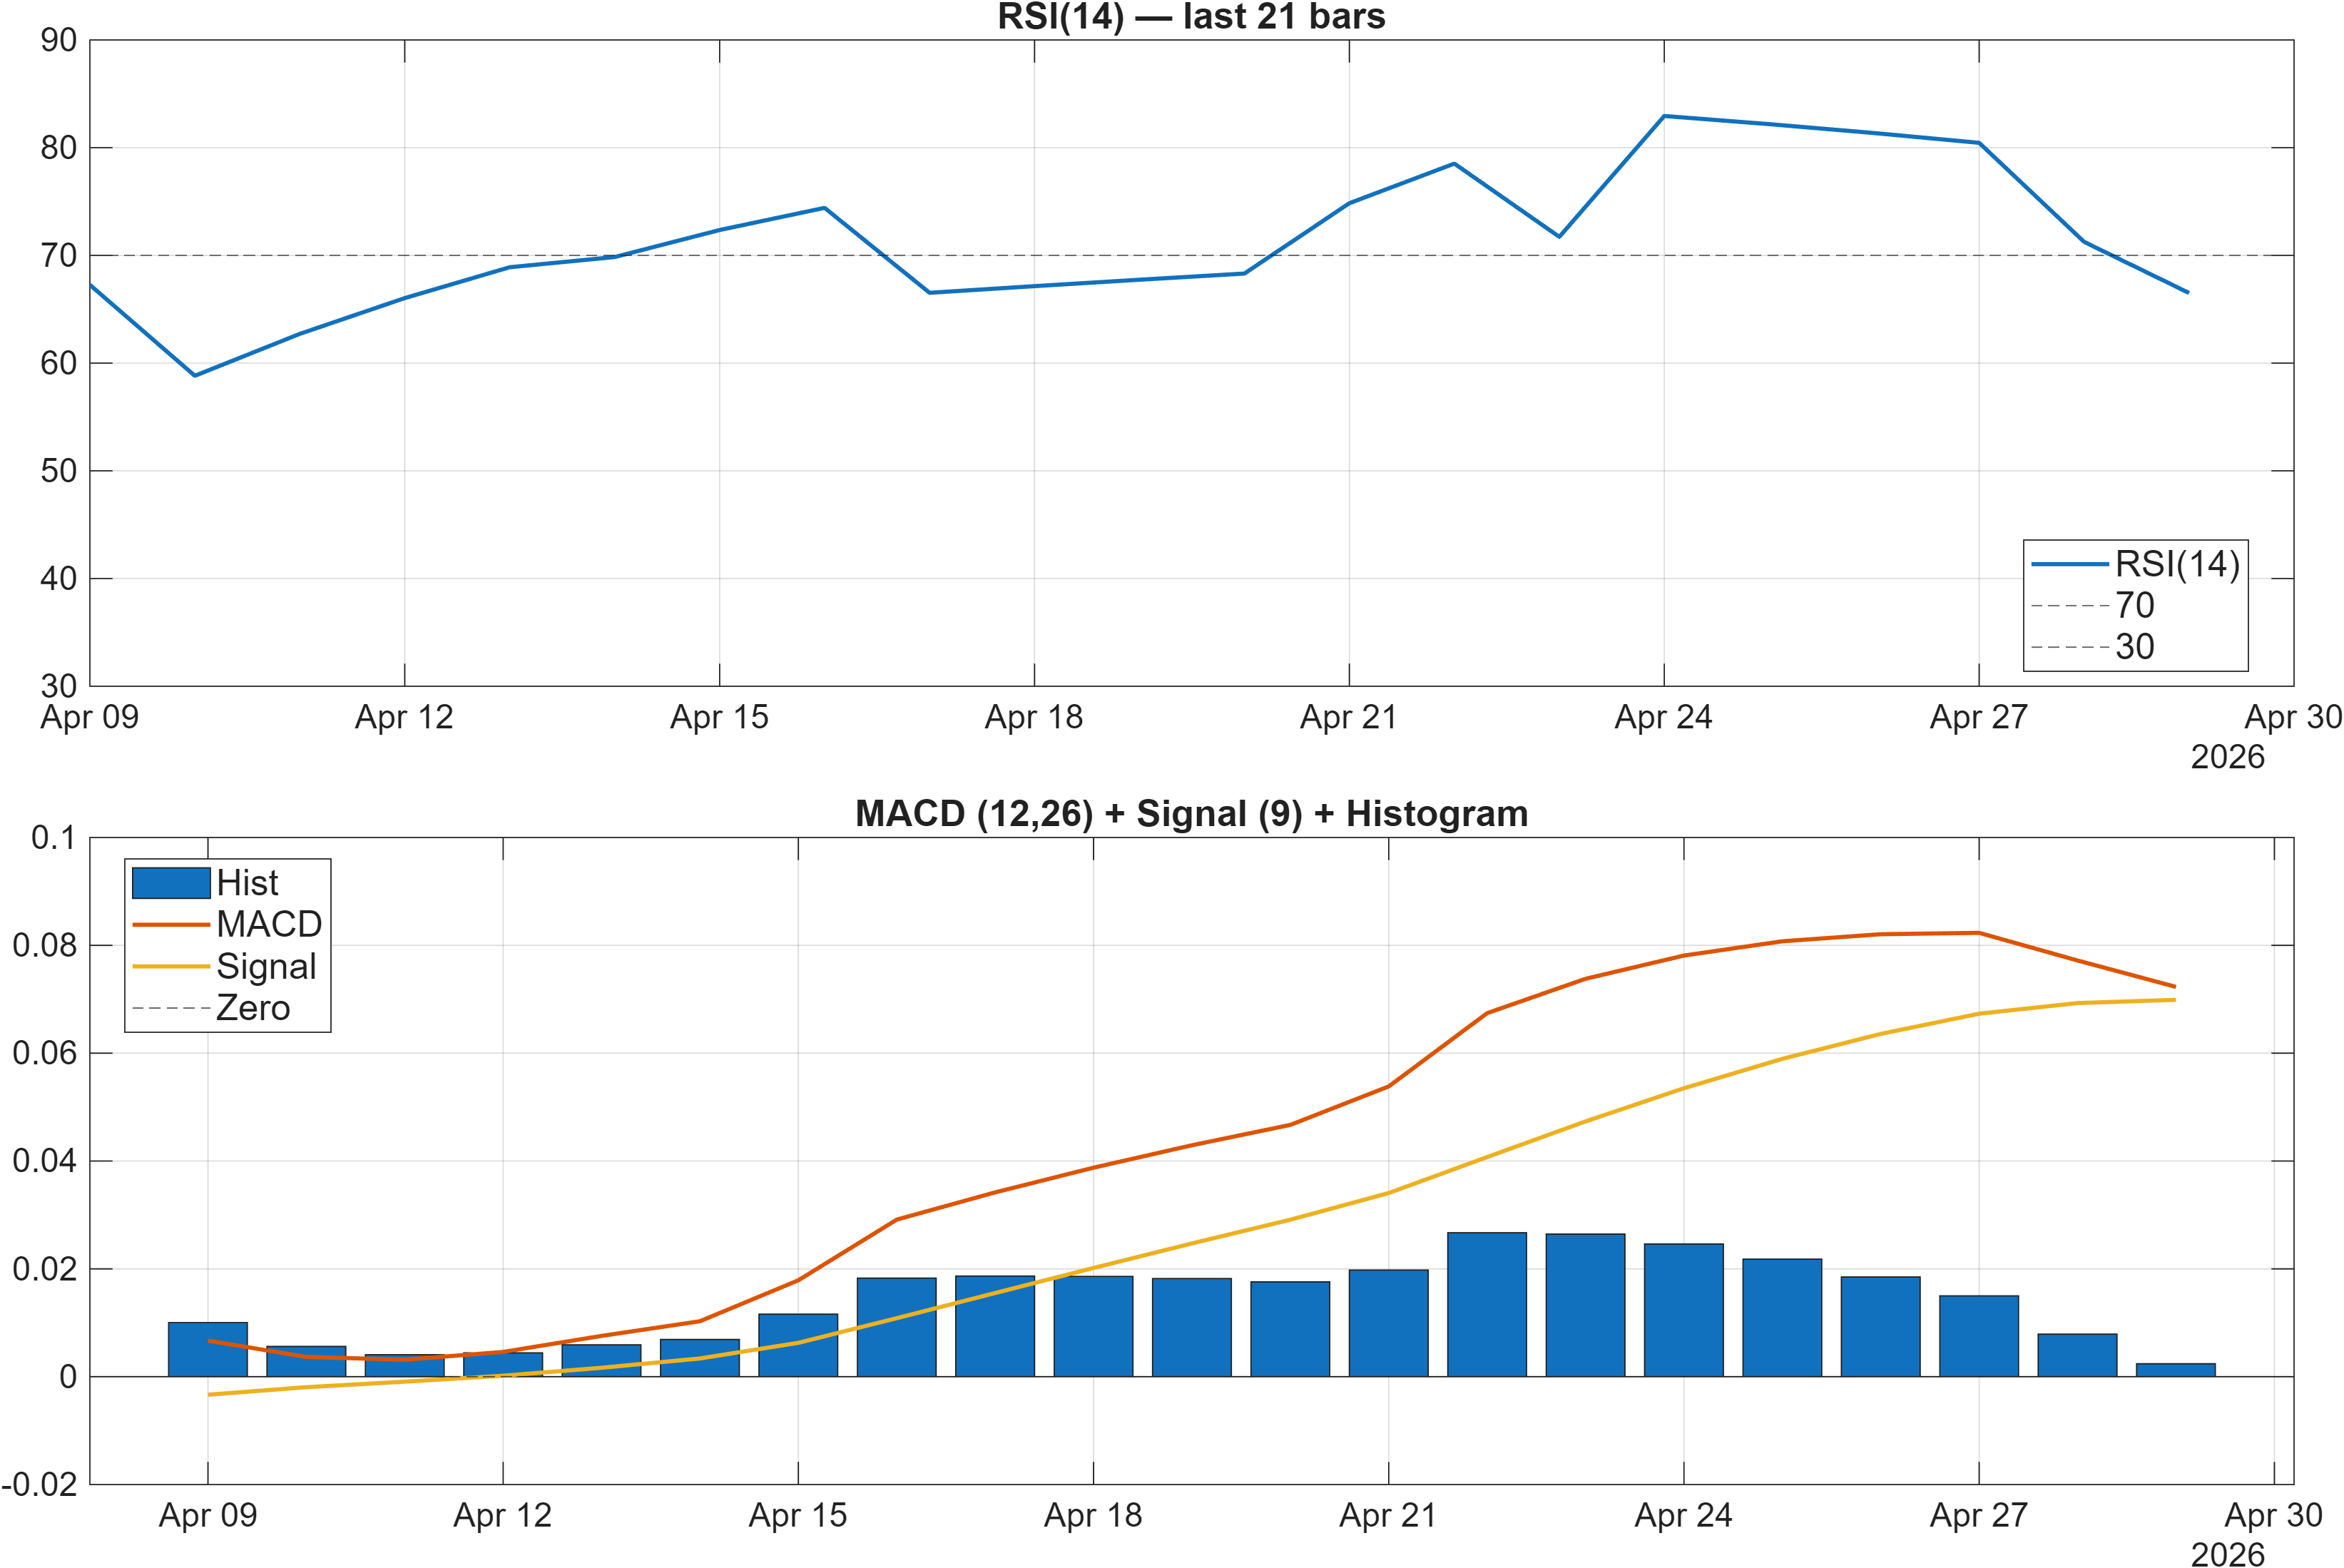
Interpretation: RSI bias = Bullish, MACD hist = 0.0024.
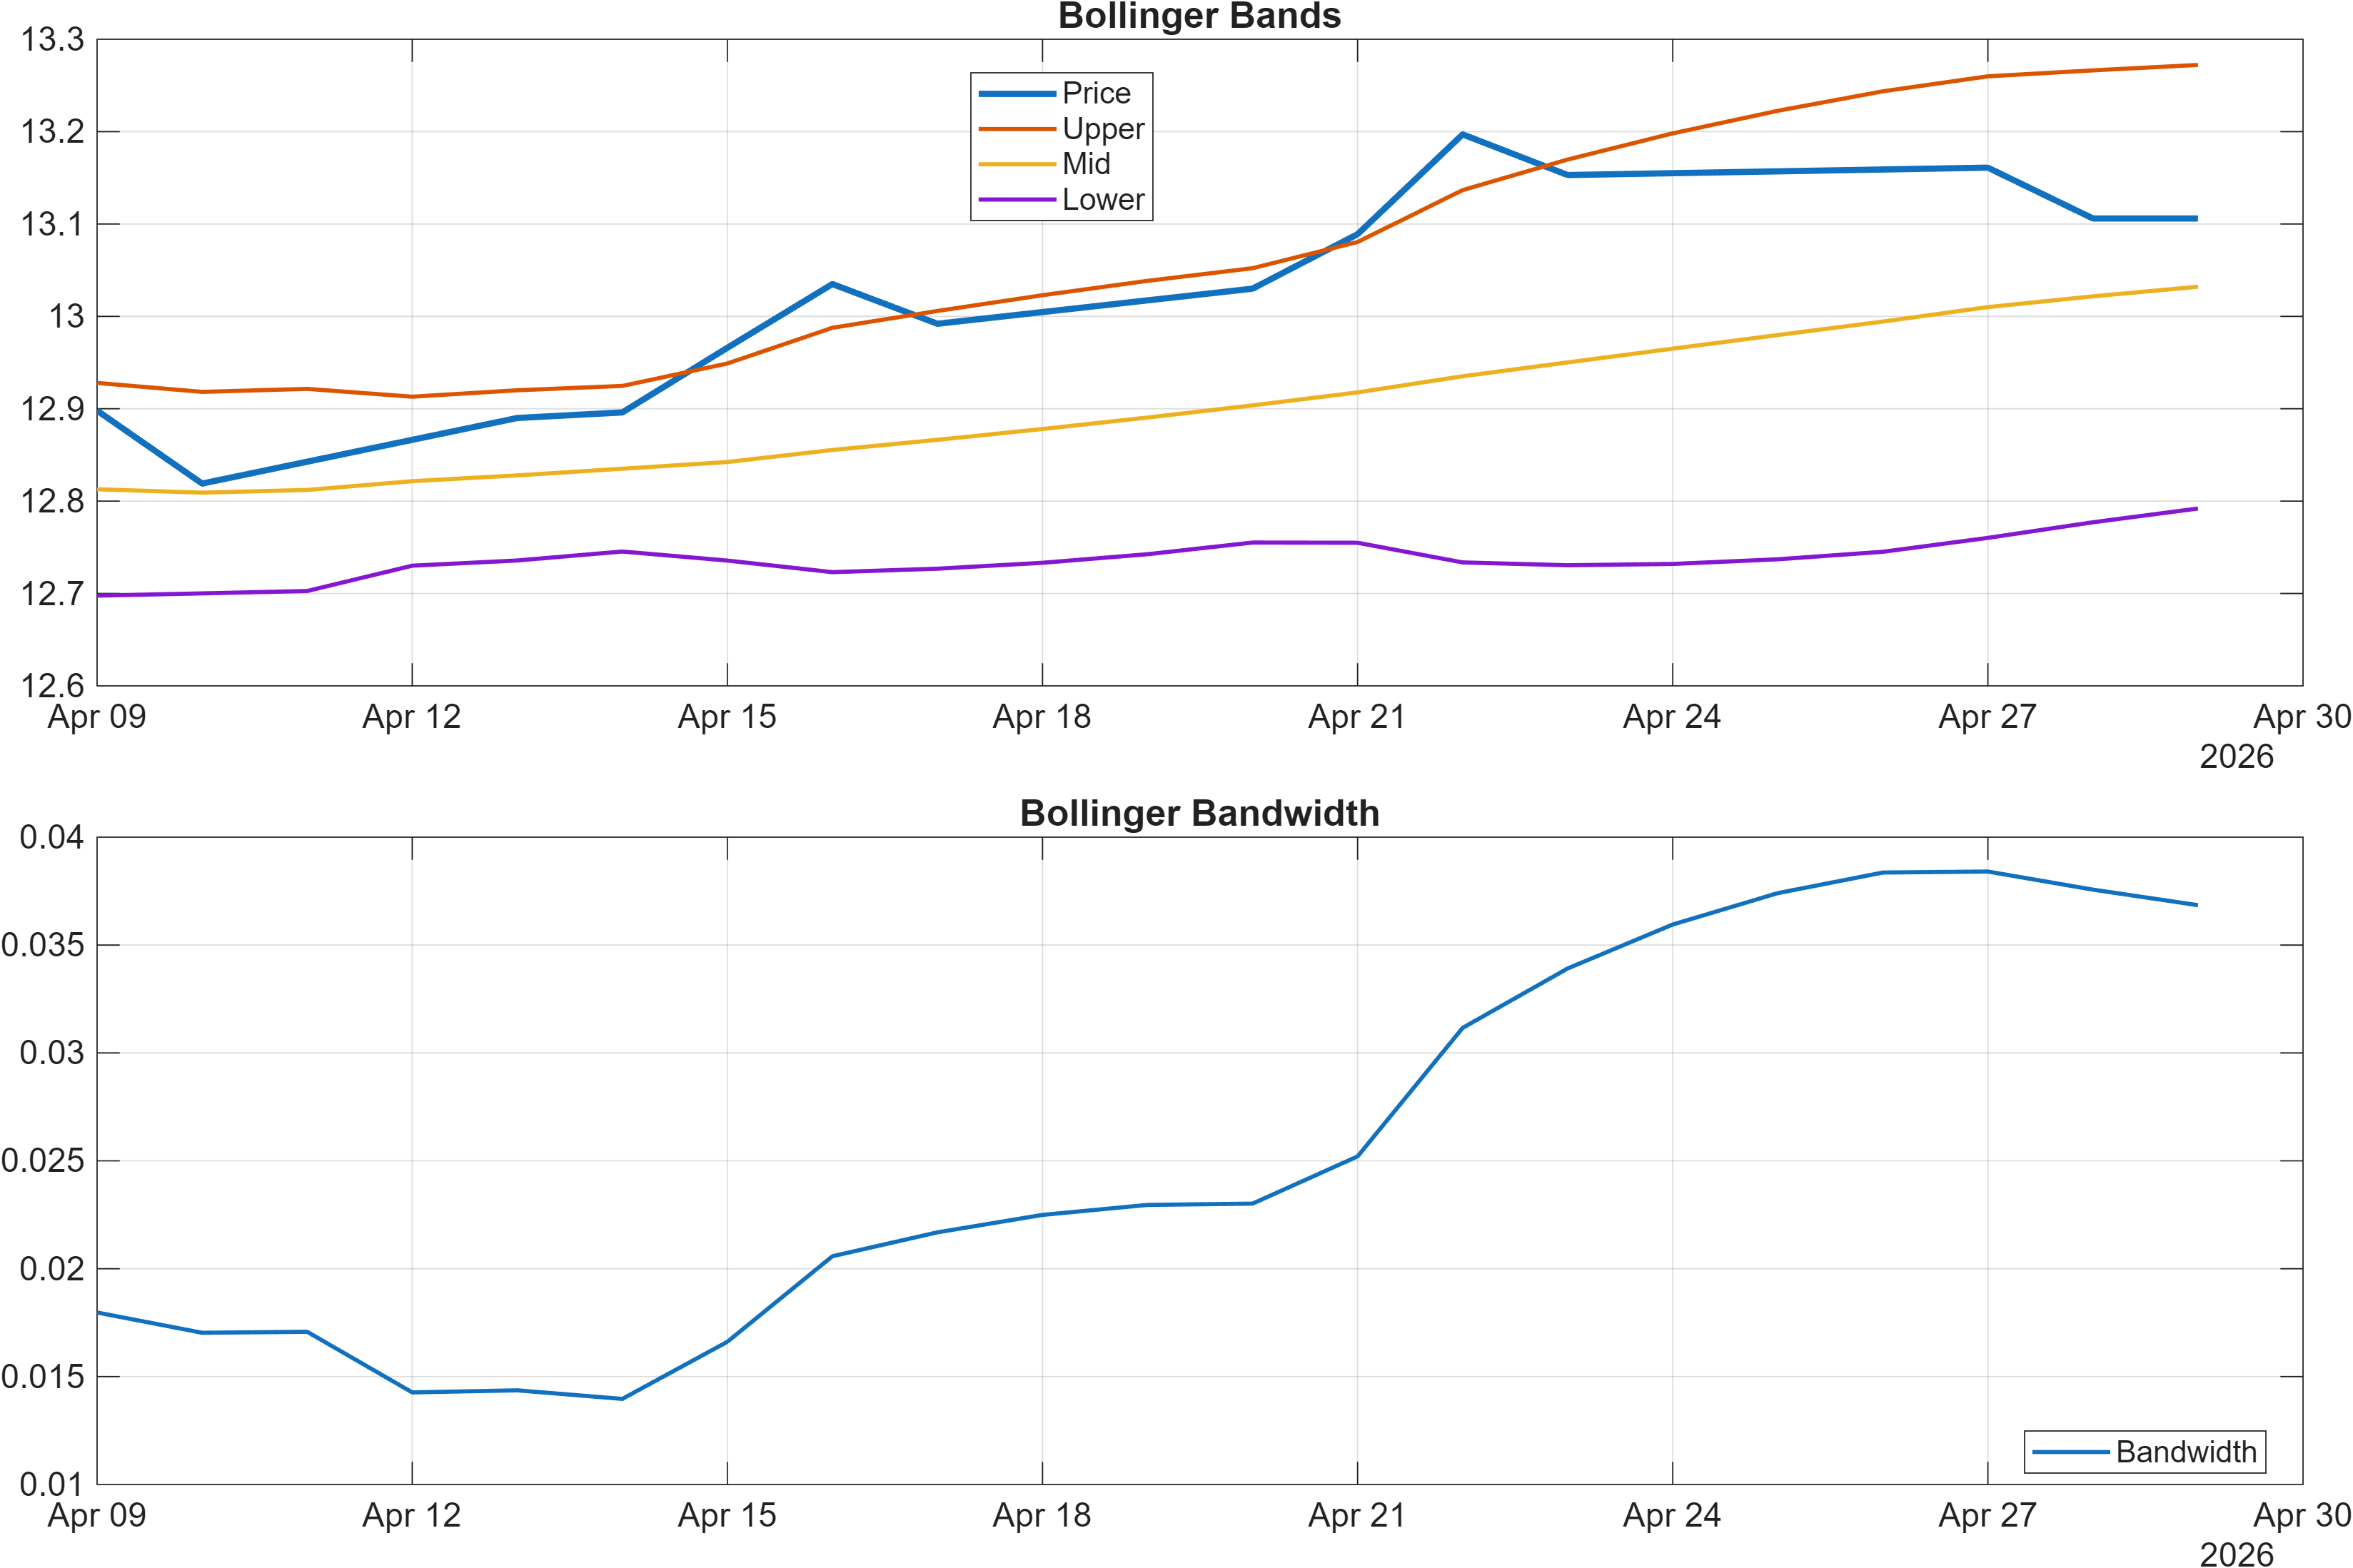
Interpretation: Bandwidth (volatility regime) latest = 0.0368.
Momentum supports continuation, while volatility remains contained
Momentum is currently biased to the upside on the core oscillators. The report flags RSI bias as Bullish, with RSI(14) at 66.51, which typically indicates sustained bid-side pressure rather than a flat mean-reversion environment. The MACD histogram is also positive at 0.0024, consistent with incremental momentum still pointing upward rather than rolling over. In the broader signal table, the momentum family reinforces the same tone: ROC(20) at 2.239 is Bullish and trend-state momentum over 20 periods is also Bullish.
Volatility, however, does not show the type of expansion that often accompanies a decisive breakout. The latest Bollinger Bandwidth at 0.0368 suggests a relatively contained regime. When momentum is positive but volatility is compressed, markets can trend in a controlled manner—yet they can also become more sensitive to discrete level breaks because liquidity and positioning tend to concentrate near obvious technical boundaries.
This makes the support/resistance frame (12.7696 / 13.1610) more than a chart annotation: it becomes the primary “volatility trigger.” A push above resistance in a low-to-moderate bandwidth regime can create an abrupt transition into higher realized volatility, while a failure that slips back toward support can unwind momentum quickly. Given the extreme bearish placement of weekly/monthly ranks (#946, #939), monitoring whether momentum can stay constructive without a volatility surge is central to distinguishing an orderly grind higher from a short-lived rebound.
4) Support / Resistance zones
Support ~ 12.7696 | Resistance ~ 13.1610
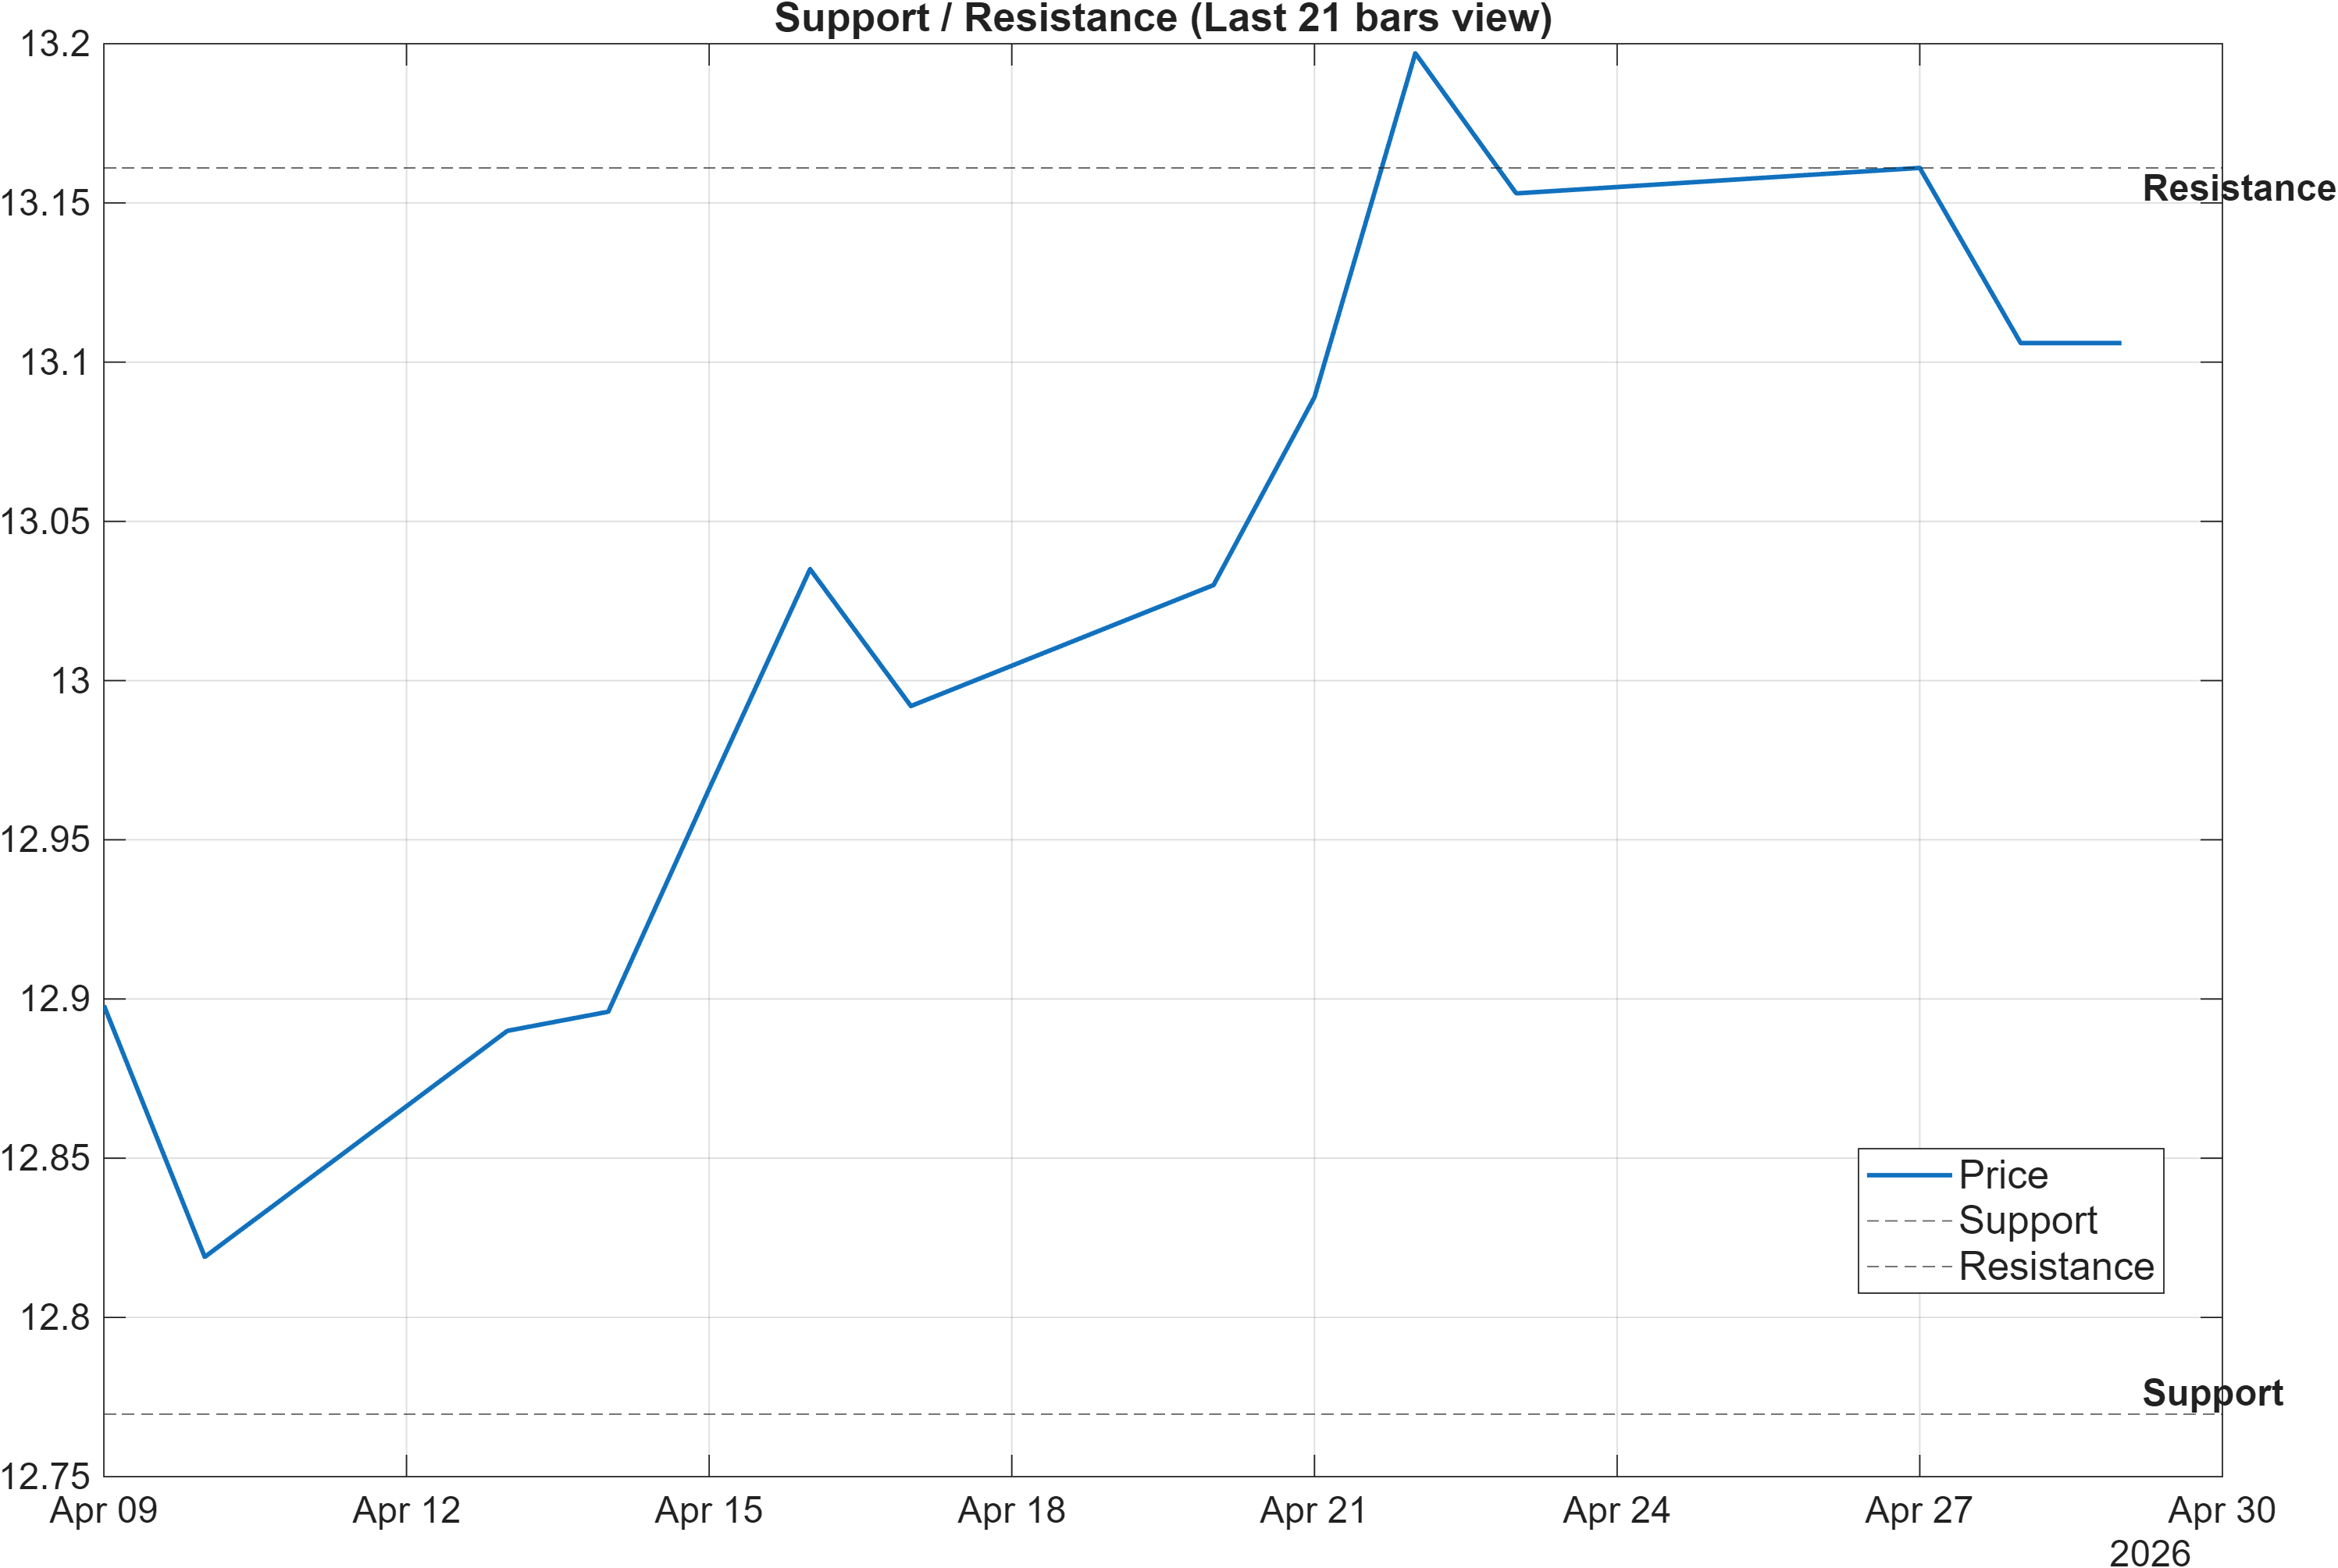
Scenario view: Break above resistance with volume → continuation. Close below support → signal deterioration risk.
Decision zones: confirmation requires acceptance, not just intrusion
With volatility measured as relatively contained (Bandwidth 0.0368) and momentum biased higher (RSI(14) 66.51; MACD hist 0.0024), the immediate analytical burden shifts to behavior at the boundaries. The resistance near 13.1610 is the key confirmation zone: the scenario framework explicitly calls for a break above resistance with volume to support continuation. While volume is referenced in the scenario text, instrument-specific volume data is not available in the provided data; therefore, confirmation must be evaluated through price acceptance behavior as shown in the figures.
The support near 12.7696 is equally important because it anchors the “invalidations first” discipline that the framework emphasizes. A close below this level is flagged as deterioration risk, which is particularly relevant given the multi-week ranking backdrop (weekly #946, monthly #939). When longer horizons remain ranked near the bottom of the universe, breaks of support tend to carry disproportionate information content: they often imply that the recent daily improvement (#76) did not translate into durable demand.
A useful way to read the zone map is to treat it as a compression test. If price can oscillate above support and repeatedly pressure resistance without momentum fading, it supports the idea that the positive technical confluence (0.389) is starting to dominate. If instead resistance rejects while RSI remains elevated, that can indicate momentum is becoming “spent” rather than expanding—often a precursor to mean reversion back into the middle of the range.
5) Quant Technical Dashboard (18 Signals)
KGNAI AI Technical Analysis Score (Deep Reinforcement Learning): Rank #731 out of 961 (Rank 1 represents the strongest technical positioning and a higher probability of favorable price behavior. As ranks increase toward the maximum, the probability of favorable outcomes weakens and bearish positioning becomes more dominant.) | Label: Neutral | Score: -0.521
18-Signal Technical Confluence Score: 0.389 (Bullish)
Overall Technical Score (18-signal confluence + DRL rank blend): 0.116 (Neutral)
Note: The blended score reflects signal strength weighted against broader AI technical ranking, which may temporarily diverge.
Blended technical score breakdown: 0.116 (Neutral | Bull 8 / Bear 1 / Neutral 9)
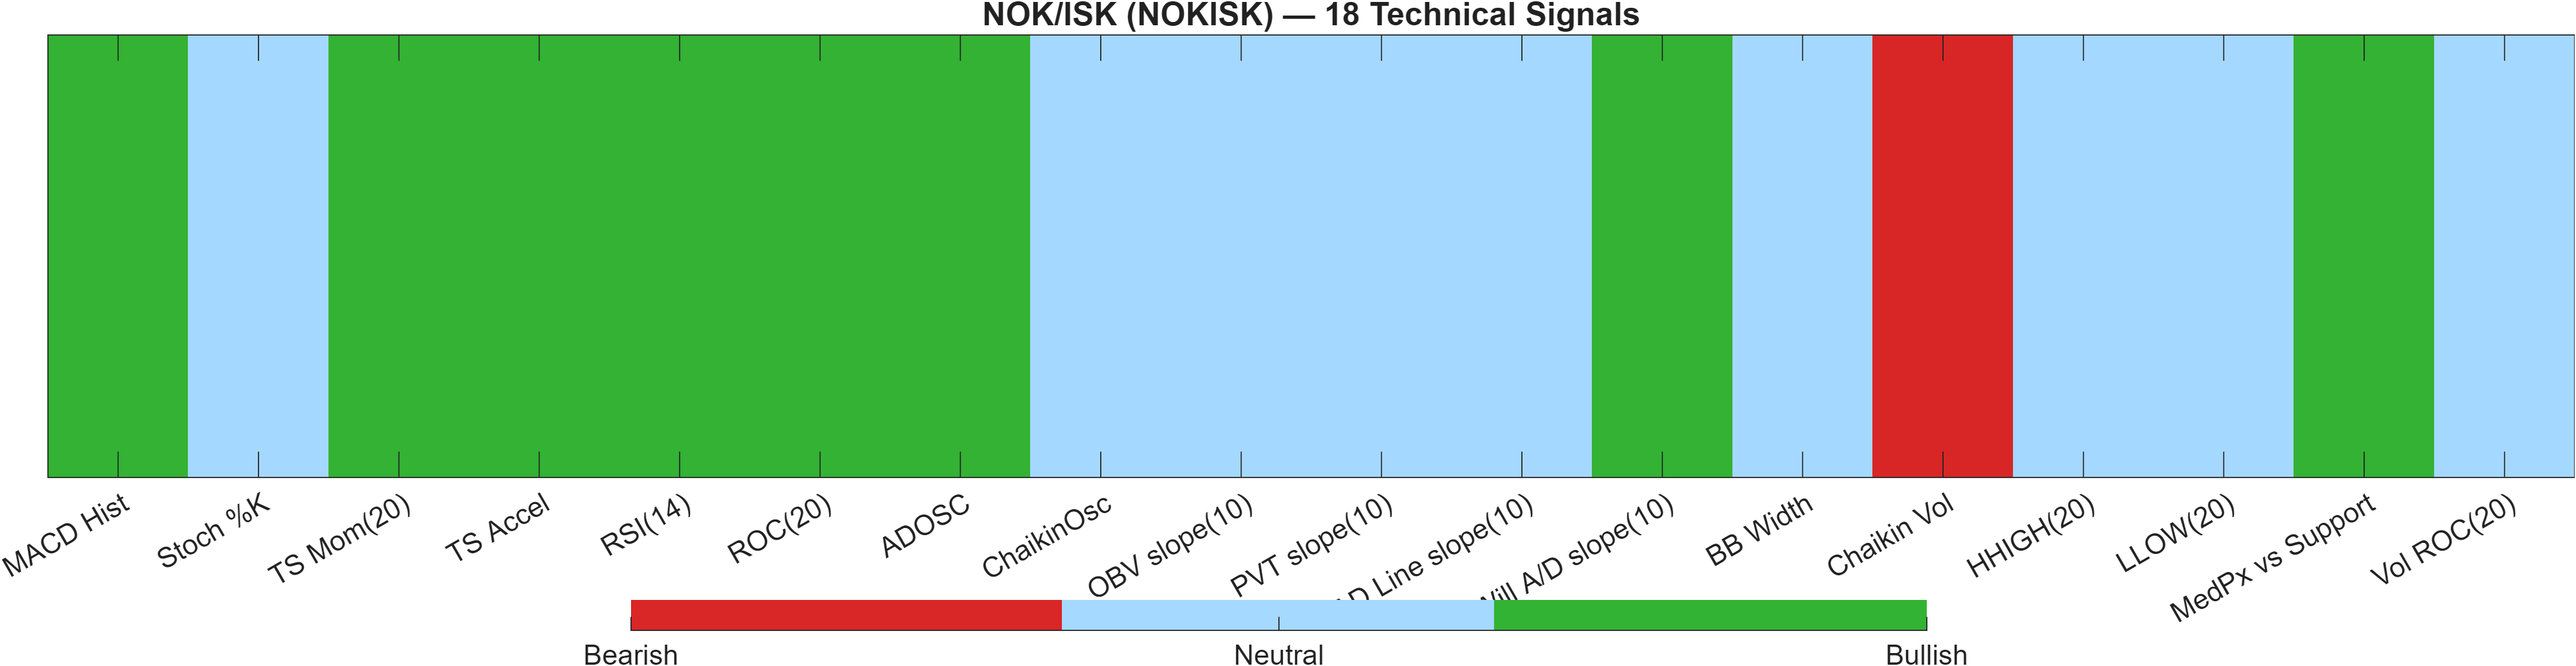
Confluence vs AI rank blend: why “Bullish” can still resolve to “Neutral”
The technical stack presents a nuanced message. On the one hand, the 18-signal confluence score is 0.389 (Bullish), with the breakdown showing Bull 8 / Bear 1 / Neutral 9. That distribution indicates broad improvement across multiple indicator families without a large cluster of explicit bearish triggers. The RSI signal is Bullish (RSI(14) 66.51) and the MACD histogram is positive (0.002398), which typically supports trend persistence rather than immediate exhaustion.
On the other hand, the Deep Reinforcement Learning (DRL) technical rank is #731 out of 961 with a Neutral label and score -0.521. This is the balancing mechanism that prevents the dashboard from over-responding to a single favorable pocket of indicators: it effectively asks whether the current technical pattern resembles historically strong technical states across the full universe. The resulting blended overall technical score is therefore only 0.116 (Neutral), explicitly acknowledging that the indicator layer is improving faster than the broader AI technical ranking is willing to confirm.
The most informative “tension point” inside the signal mix is that bearish readings are sparse (only one explicitly Bearish signal is shown), yet many measures remain Neutral—consistent with a market that is constructive but still consolidating. The contained volatility signature (BB Width 0.03685, Neutral) reinforces that interpretation: trend-following signals may remain positive, but a more decisive state shift often requires either volatility expansion or repeated acceptance above resistance (13.1610) to convert neutral clusters into bullish confirmations.
Signal table (Bull/Bear/Neutral)
| Indicator | Value | Signal |
|---|---|---|
| MACD Hist | 0.002398 | Bullish |
| Stoch %K | 45.51 | Neutral |
| TS Mom(20) | 0.287 | Bullish |
| TS Accel | 0.2523 | Bullish |
| RSI(14) | 66.51 | Bullish |
| ROC(20) | 2.239 | Bullish |
| ADOSC | 1.818 | Bullish |
| ChaikinOsc | 0 | Neutral |
| OBV slope(10) | 0 | Neutral |
| PVT slope(10) | 0 | Neutral |
| AD Line slope(10) | 0 | Neutral |
| Will A/D slope(10) | 0.09117 | Bullish |
| BB Width | 0.03685 | Neutral |
| Chaikin Vol | 160.9 | Bearish |
| HHIGH(20) | 13.2 | Neutral |
| LLOW(20) | 12.82 | Neutral |
| MedPx vs Support | 0.3639 | Bullish |
| Vol ROC(20) | — | Neutral |
Interpretation: Indicator-level signals form the base confluence, which is then adjusted using a separate AI-driven technical ranking model. The final technical score summarizes this combined view.
6) News sentiment + extractive gist
Note: Instrument-specific news matches were not found, so the digest includes broader market/sector headlines. Links are provided for verification.
Sentiment score (avg): 0.115 | Positive: 25% | Neutral: 75% | Negative: 0%
KGNAI AI News Sentiment Score (normalized -1 to +1): -0.23 (as of 2025-06-24) | Label: Bearish | Overall news score: -0.23
Positive Developments
Recent coverage across major financial outlets indicates a modestly constructive tone around select macro and fiscal updates, emphasizing incremental improvement rather than a clean risk-on pivot. The notable “positive” element in the provided digest is the presence of fiscal outcomes described as better than prior expectations (for example, deficit comparisons that were framed as smaller than forecast). In FX terms, this type of messaging can reduce near-term tail concerns and contribute to steadier risk pricing, even if it does not meaningfully re-rate a currency pair on its own. For NOKISK, the relevance is indirect: the pair’s technicals already lean constructive on momentum (RSI bias Bullish; MACD histogram positive at 0.0024), so any improvement in the broader backdrop can help those signals persist. Still, with weekly and monthly ranks sitting near the bottom of the universe (#946 and #939), positive news flow would typically need to be persistent and broadly reinforcing to show up as a genuine multi-horizon rank improvement.
Neutral / Mixed Developments
A large share of the news set is informational and event-driven, reflecting markets awaiting central-bank decisions and reacting to commodity price fluctuations without a stable directional consensus. The sentiment distribution provided aligns with this: 75% neutral and an average sentiment of 0.115. For NOKISK specifically, neutral macro coverage tends to shift attention back to market structure—range boundaries and the volatility regime—rather than encouraging trend extension by itself. With Bollinger Bandwidth at 0.0368, the current regime reads more like contained movement than a high-energy breakout environment. In such conditions, news that is “waiting-mode” in tone often supports mean-reverting behavior unless price can establish acceptance beyond resistance at 13.1610. Mixed coverage therefore fits the technical picture: constructive momentum, but not yet a decisive transition state.
Negative / Risk Signals
The risk-oriented items in the digest are dominated by uncertainty around geopolitical developments and their spillover into commodities, alongside pre-event caution into major policy announcements. Even when the distribution shows 0% negative, the normalized news model score is still -0.23 (Bearish), suggesting the language balance and risk framing are not supportive on a normalized basis. For FX crosses, risk framing can matter through liquidity conditions and correlations (particularly when energy and rates expectations become the market’s organizing variables). In NOKISK, that matters because the rank structure already signals fragility across multi-week horizons: the daily rank (#76) is strong, but the weekly/monthly ranks (#946/#939) imply the broader regime remains unfavorable. Under that setup, risk shocks are more likely to express as failed breakouts or quick reversals back toward support (12.7696) than as smooth continuation.
What to monitor next
- Whether price can sustain acceptance above 13.1610 without a sharp volatility expansion (Bandwidth currently 0.0368).
- Whether momentum cools from elevated readings (RSI(14) 66.51) while staying above support 12.7696.
- Whether the weekly/monthly ranks (#946, #939) improve materially, reducing the current cross-horizon divergence.
Snapshot: AI Rank (Short–Mid–Long): Bearish (Bearish–Bearish–Not available) · Technical Confluence: Bullish · Key Levels: Support ~12.77 | Resistance ~13.16 · News Sentiment: Neutral
7) Sources
- WTI hovers around $97.00 following reports of US to extend Iran blockade
- Silver advances above $73.50 as traders await Fed rate decision
- India Gold price today: Gold rises, according to FXStreet data
- USD/JPY Price Forecast: Remains below 160.00 intervention threshold ahead of Fed
- Asian stocks mixed, Nikkei declines on rising energy prices
- Gold steadies around $4,600; bears have the upper hand ahead of Fed decision
- EUR/USD Price Forecast: Likely to find direction after Fed’s policy announcement
- EUR/JPY remains subdued below 187.00 as risk-off sentiment weighs on Euro
You may also like: How KGNAI AI ranks instruments across global markets
Disclaimer: KGNAI provides AI-generated analytics and educational market commentary only. This is not financial advice. Markets involve risk. Always do your own research.