
TWDPKR (TWD/PKR) — 26-Apr-2026 Technical & Rank View: Bullish bias with near-term cooling risk
TWDPKR enters 26-Apr-2026 with a constructive medium-to-long horizon backdrop in KGNAI’s cross-sectional ranking framework, while shorter-term conditions look more mixed. The rank stack shows the market’s strongest relative positioning concentrated beyond the daily window, with the 3-Monthly rank at #28 standing out versus the Daily rank at #284 in a 961-instrument universe. Technically, the blended view remains supportive: the overall technical score is 0.451 (Bullish), even as the AI technical rank reads #194 (Neutral), signaling a mild model-level divergence. Momentum is clearly elevated—RSI(14) at 79.75 and a positive MACD histogram (0.0029)—while volatility remains contained with Bollinger Bandwidth at 0.0213. Nearby decision zones are well-defined at support ~8.7041 and resistance ~8.8767, framing confirmation and invalidation conditions.
- Rank stance: Short-term Neutral (Daily #284); Mid-term Bullish (Weekly #180 / Monthly #126); Long-term Bullish (3-Monthly #28 / 6-Monthly #75 / Yearly #122).
- Technical confluence: Bullish via overall technical score 0.451, despite DRL technical rank #194 labeled Neutral.
- Key levels: Support ~8.7041 | Resistance ~8.8767 (probabilistic zones, not certainties).
- News sentiment bias: Neutral with sentiment score (avg) 0.120 (31% positive / 63% neutral / 6% negative); instrument-specific matches not found.
- Confirmation / invalidation: A sustained break above 8.8767 supports continuation framing; a close below 8.7041 elevates deterioration risk per the scenario logic.
What KGNAI Measures
KGNAI evaluates assets using large cross-sectional datasets built from millions of structured data points. Inputs incorporate fundamental metrics, technical structures, and systematically processed news sentiment. Statistical models, machine learning, and AI frameworks are used to assess relative positioning, signal alignment, and probabilistic behavior across broad universes.
How to Read This Report
- Ranks are comparative across the tracked universe, not absolute price targets.
- Confluence reflects alignment among independent signal groups.
- Support/resistance levels are probabilistic decision zones, not guarantees.
- Sentiment provides contextual bias within the broader analytical framework.
1) KGNAI AI Analysis
Region: FOREX
Total universe size: 961 ranked instruments
- Daily rank: #284 out of 961 — Neutral
- Weekly rank: #180 out of 961 — Bullish
- Monthly rank: #126 out of 961 — Bullish
- 3-Monthly rank: #28 out of 961 — Bullish
- 6-Monthly rank: #75 out of 961 — Bullish
- Yearly rank: #122 out of 961 — Bullish
Cross-sectional ranks frame TWDPKR’s positioning as time-horizon dependent. The near-term read is comparatively softer—Daily #284 sits closer to the middle of the universe—while the market strengthens meaningfully as the horizon extends. The most notable signal is the 3-Monthly rank of #28, placing the pair in the top tier of the 961-instrument set and indicating that, over that window, TWDPKR has exhibited stronger “favorable behavior” characteristics than most peers in the dataset.
This stack creates a useful alignment test: the Weekly #180 and Monthly #126 reinforce a bullish medium-term bias, while the daily neutrality suggests either consolidation, mean-reversion pressure, or a lag in short-horizon confirmation. The 6-Monthly #75 and Yearly #122 keep the longer-run context constructive, but they are not as extreme as the 3-month reading—consistent with an upswing that has been particularly strong in the recent quarter.
Practically, this is a bullish tilt with a short-term “quality control” requirement: the medium/long ranking advantage is already present, but the daily window has not fully converged. That divergence is often where risk management matters most—participants will typically watch whether price can hold above key supports while shorter-term signals catch up, or whether near-term weakness forces a broader de-rating.
2) Price & trend overview
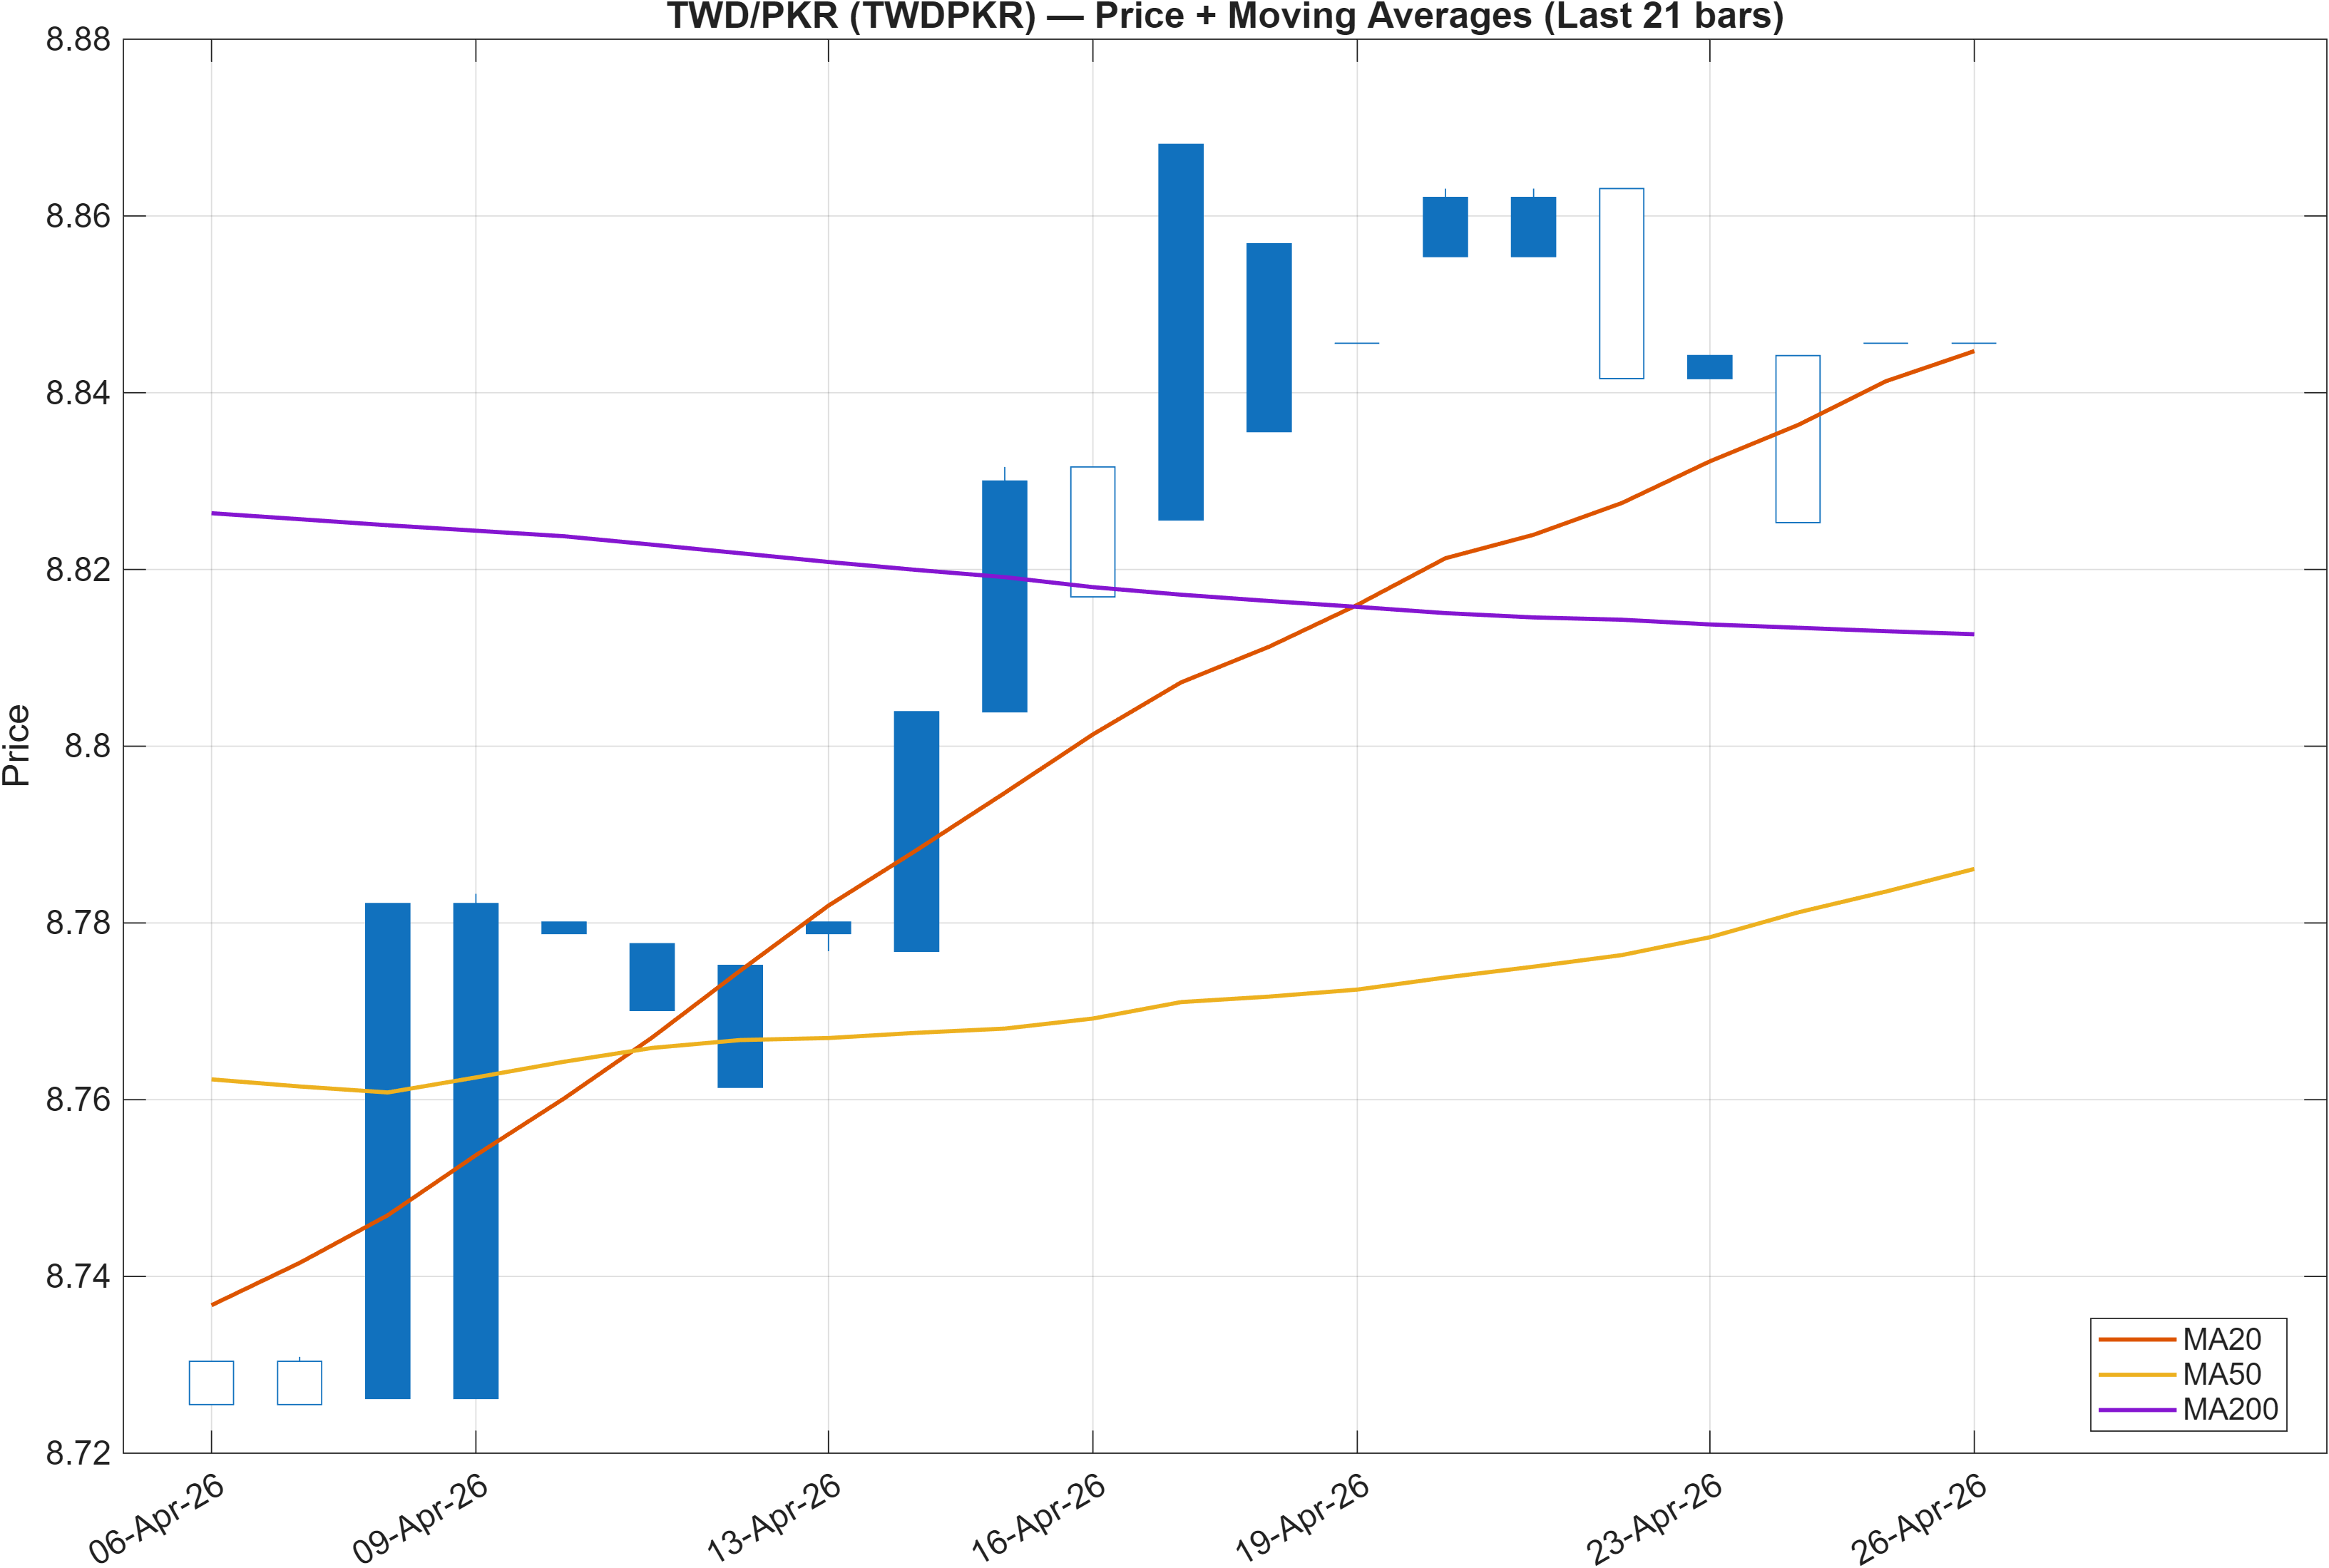
Interpretation: Close vs MA50 = Bullish, MA50 vs MA200 = Bearish.
Trend alignment vs regime friction
The moving-average readout is explicitly mixed: price relative to the MA50 is Bullish, while MA50 vs MA200 is Bearish. That combination typically appears when a newer upswing is underway but the longer-duration trend filter has not turned. In other words, the market can be behaving well in the near-to-intermediate window without having fully repaired the longer-run structure.
This matters because the rank stack is strongest at the 3-month horizon (#28) and remains bullish at 6 months (#75) and one year (#122). That is consistent with a phase in which the market’s recent performance is strong enough to dominate intermediate horizon models, yet the longer moving-average relationship (MA50 below MA200) still signals residual trend inertia. When this friction exists, continuation often requires persistent closes that keep the market above its intermediate trend proxy, rather than one-off spikes.
From a market-structure perspective, mixed MA states also tend to amplify the importance of nearby levels. With resistance identified at ~8.8767, a firm transition through that zone can act as a “proof point” that the shorter-term bullishness is not merely a retracement. Conversely, inability to maintain traction while the long filter remains bearish can invite rotational behavior back toward support ~8.7041.
In short: the trend picture supports the idea of an intermediate recovery within a longer-term unresolved regime. That is compatible with bullish ranks, but it raises the bar for confirmation via level behavior and follow-through.
3) Momentum & volatility dashboard
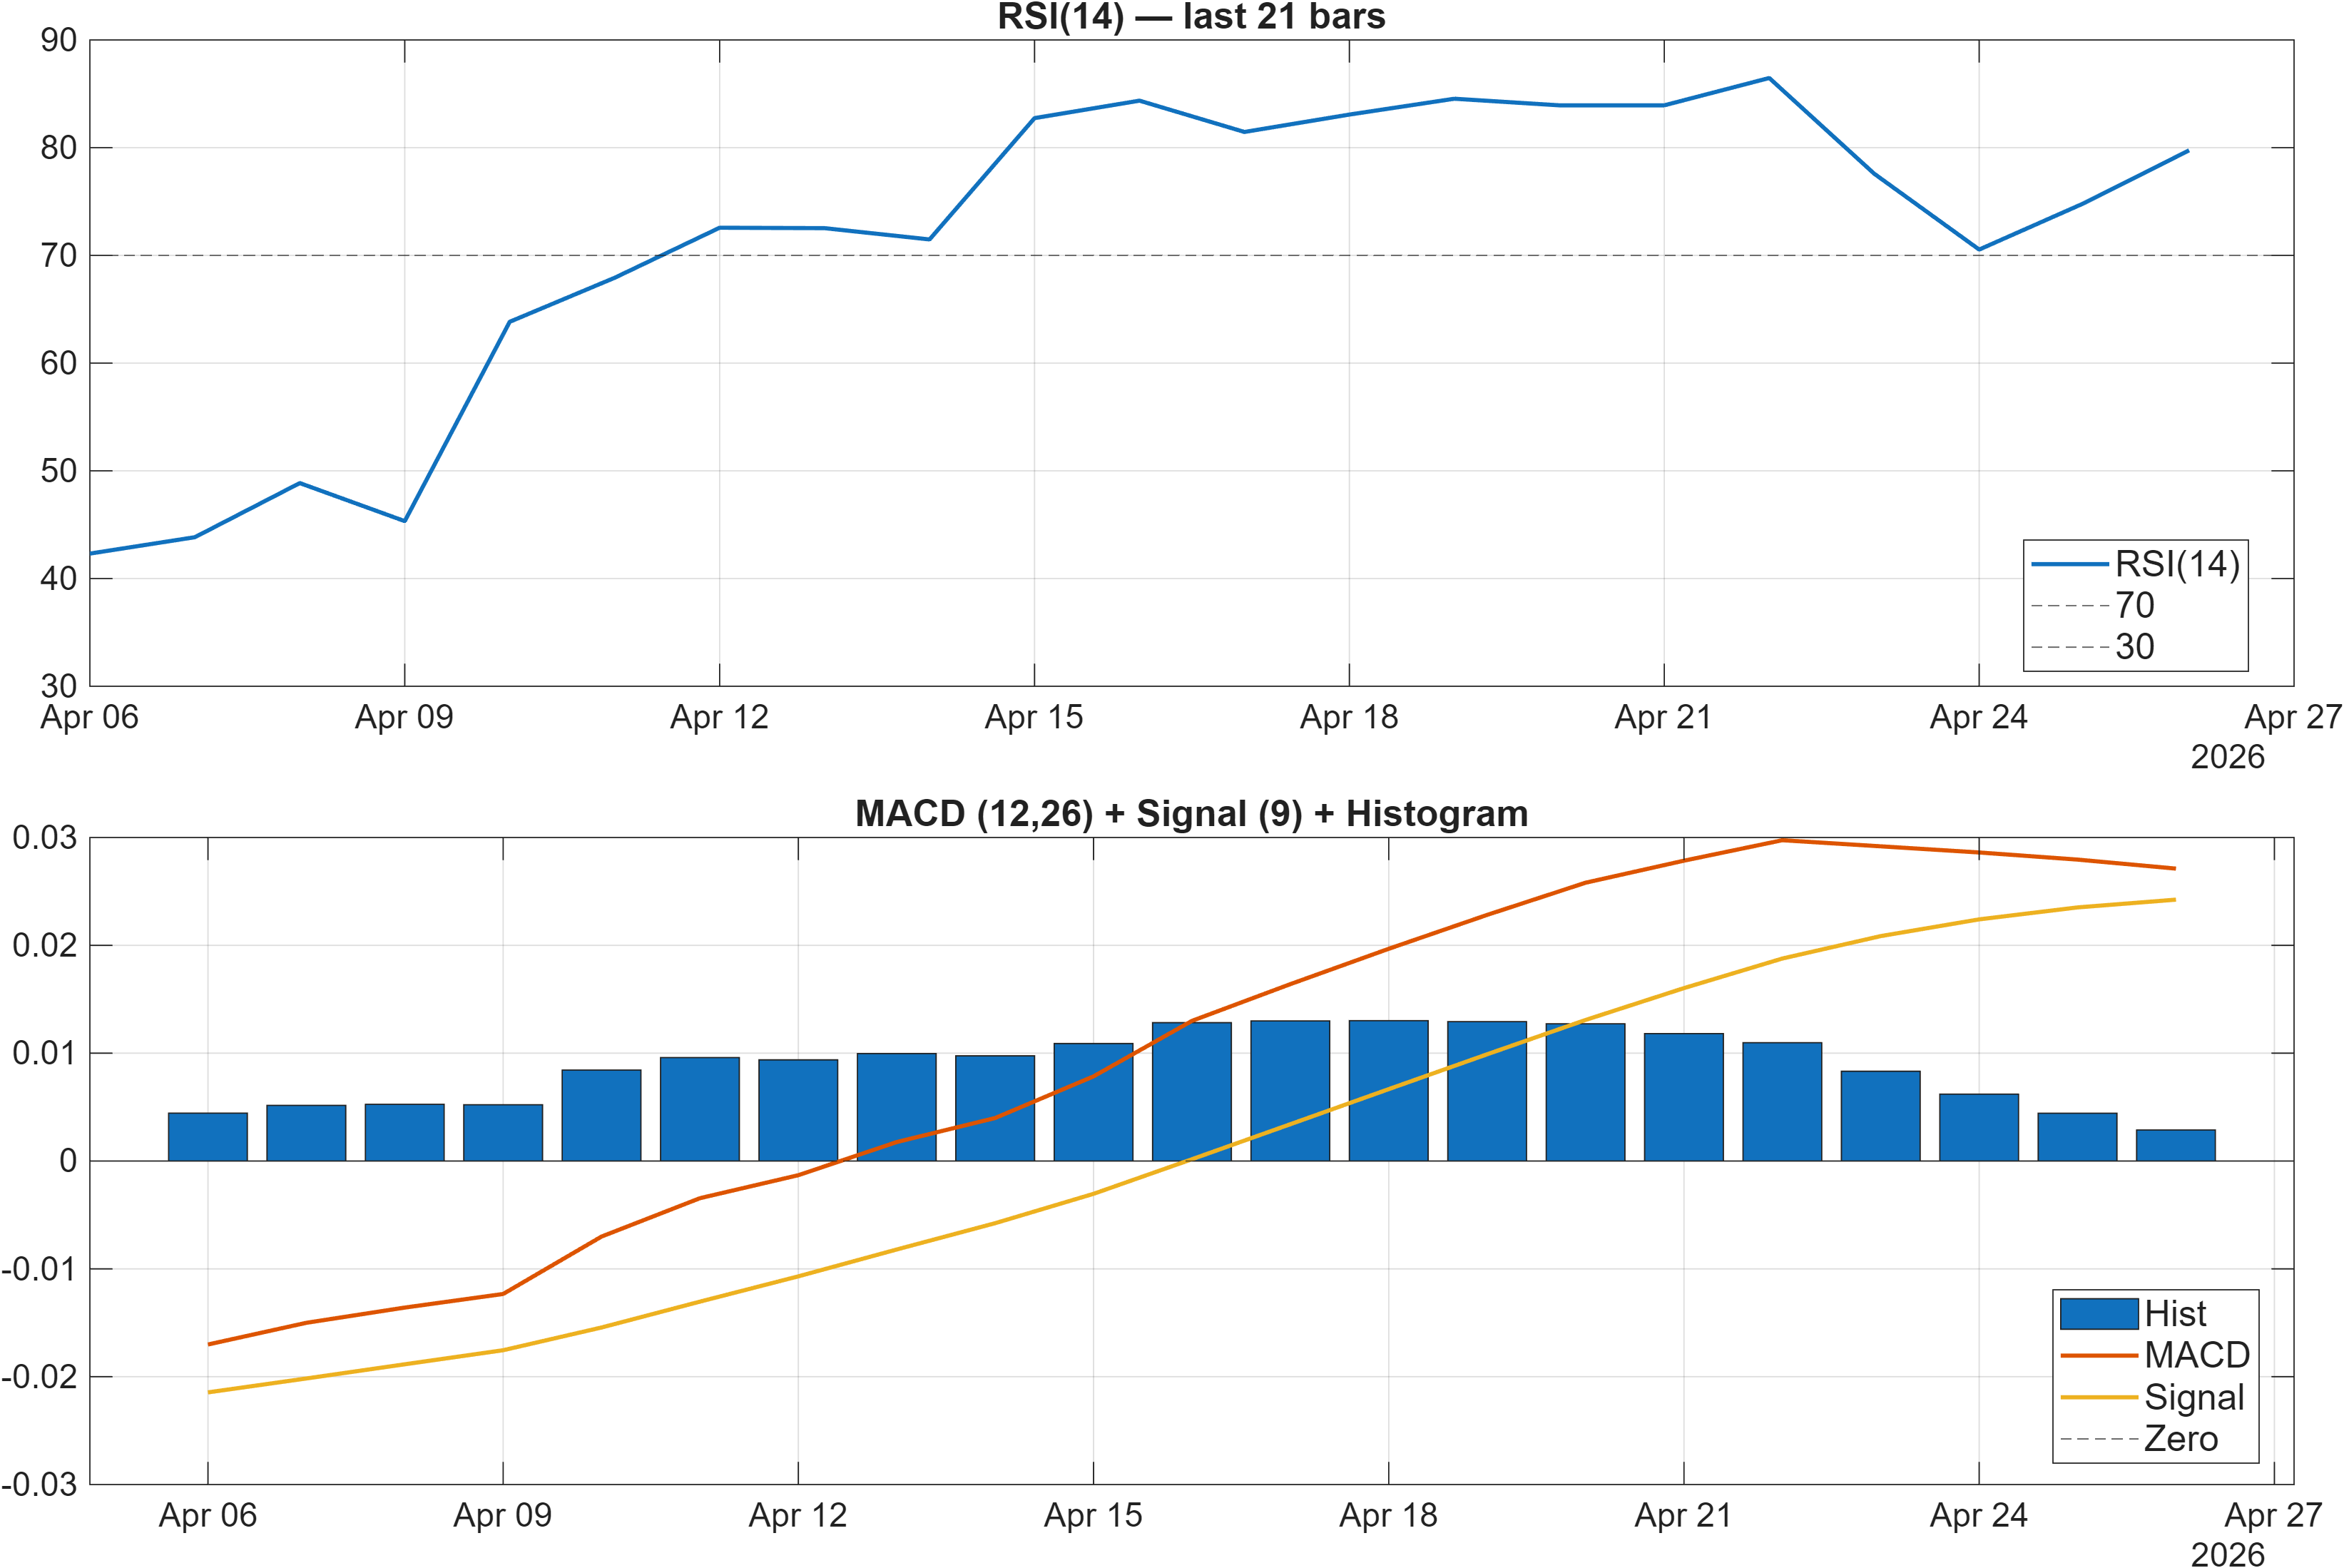
Interpretation: RSI bias = Bullish, MACD hist = 0.0029.
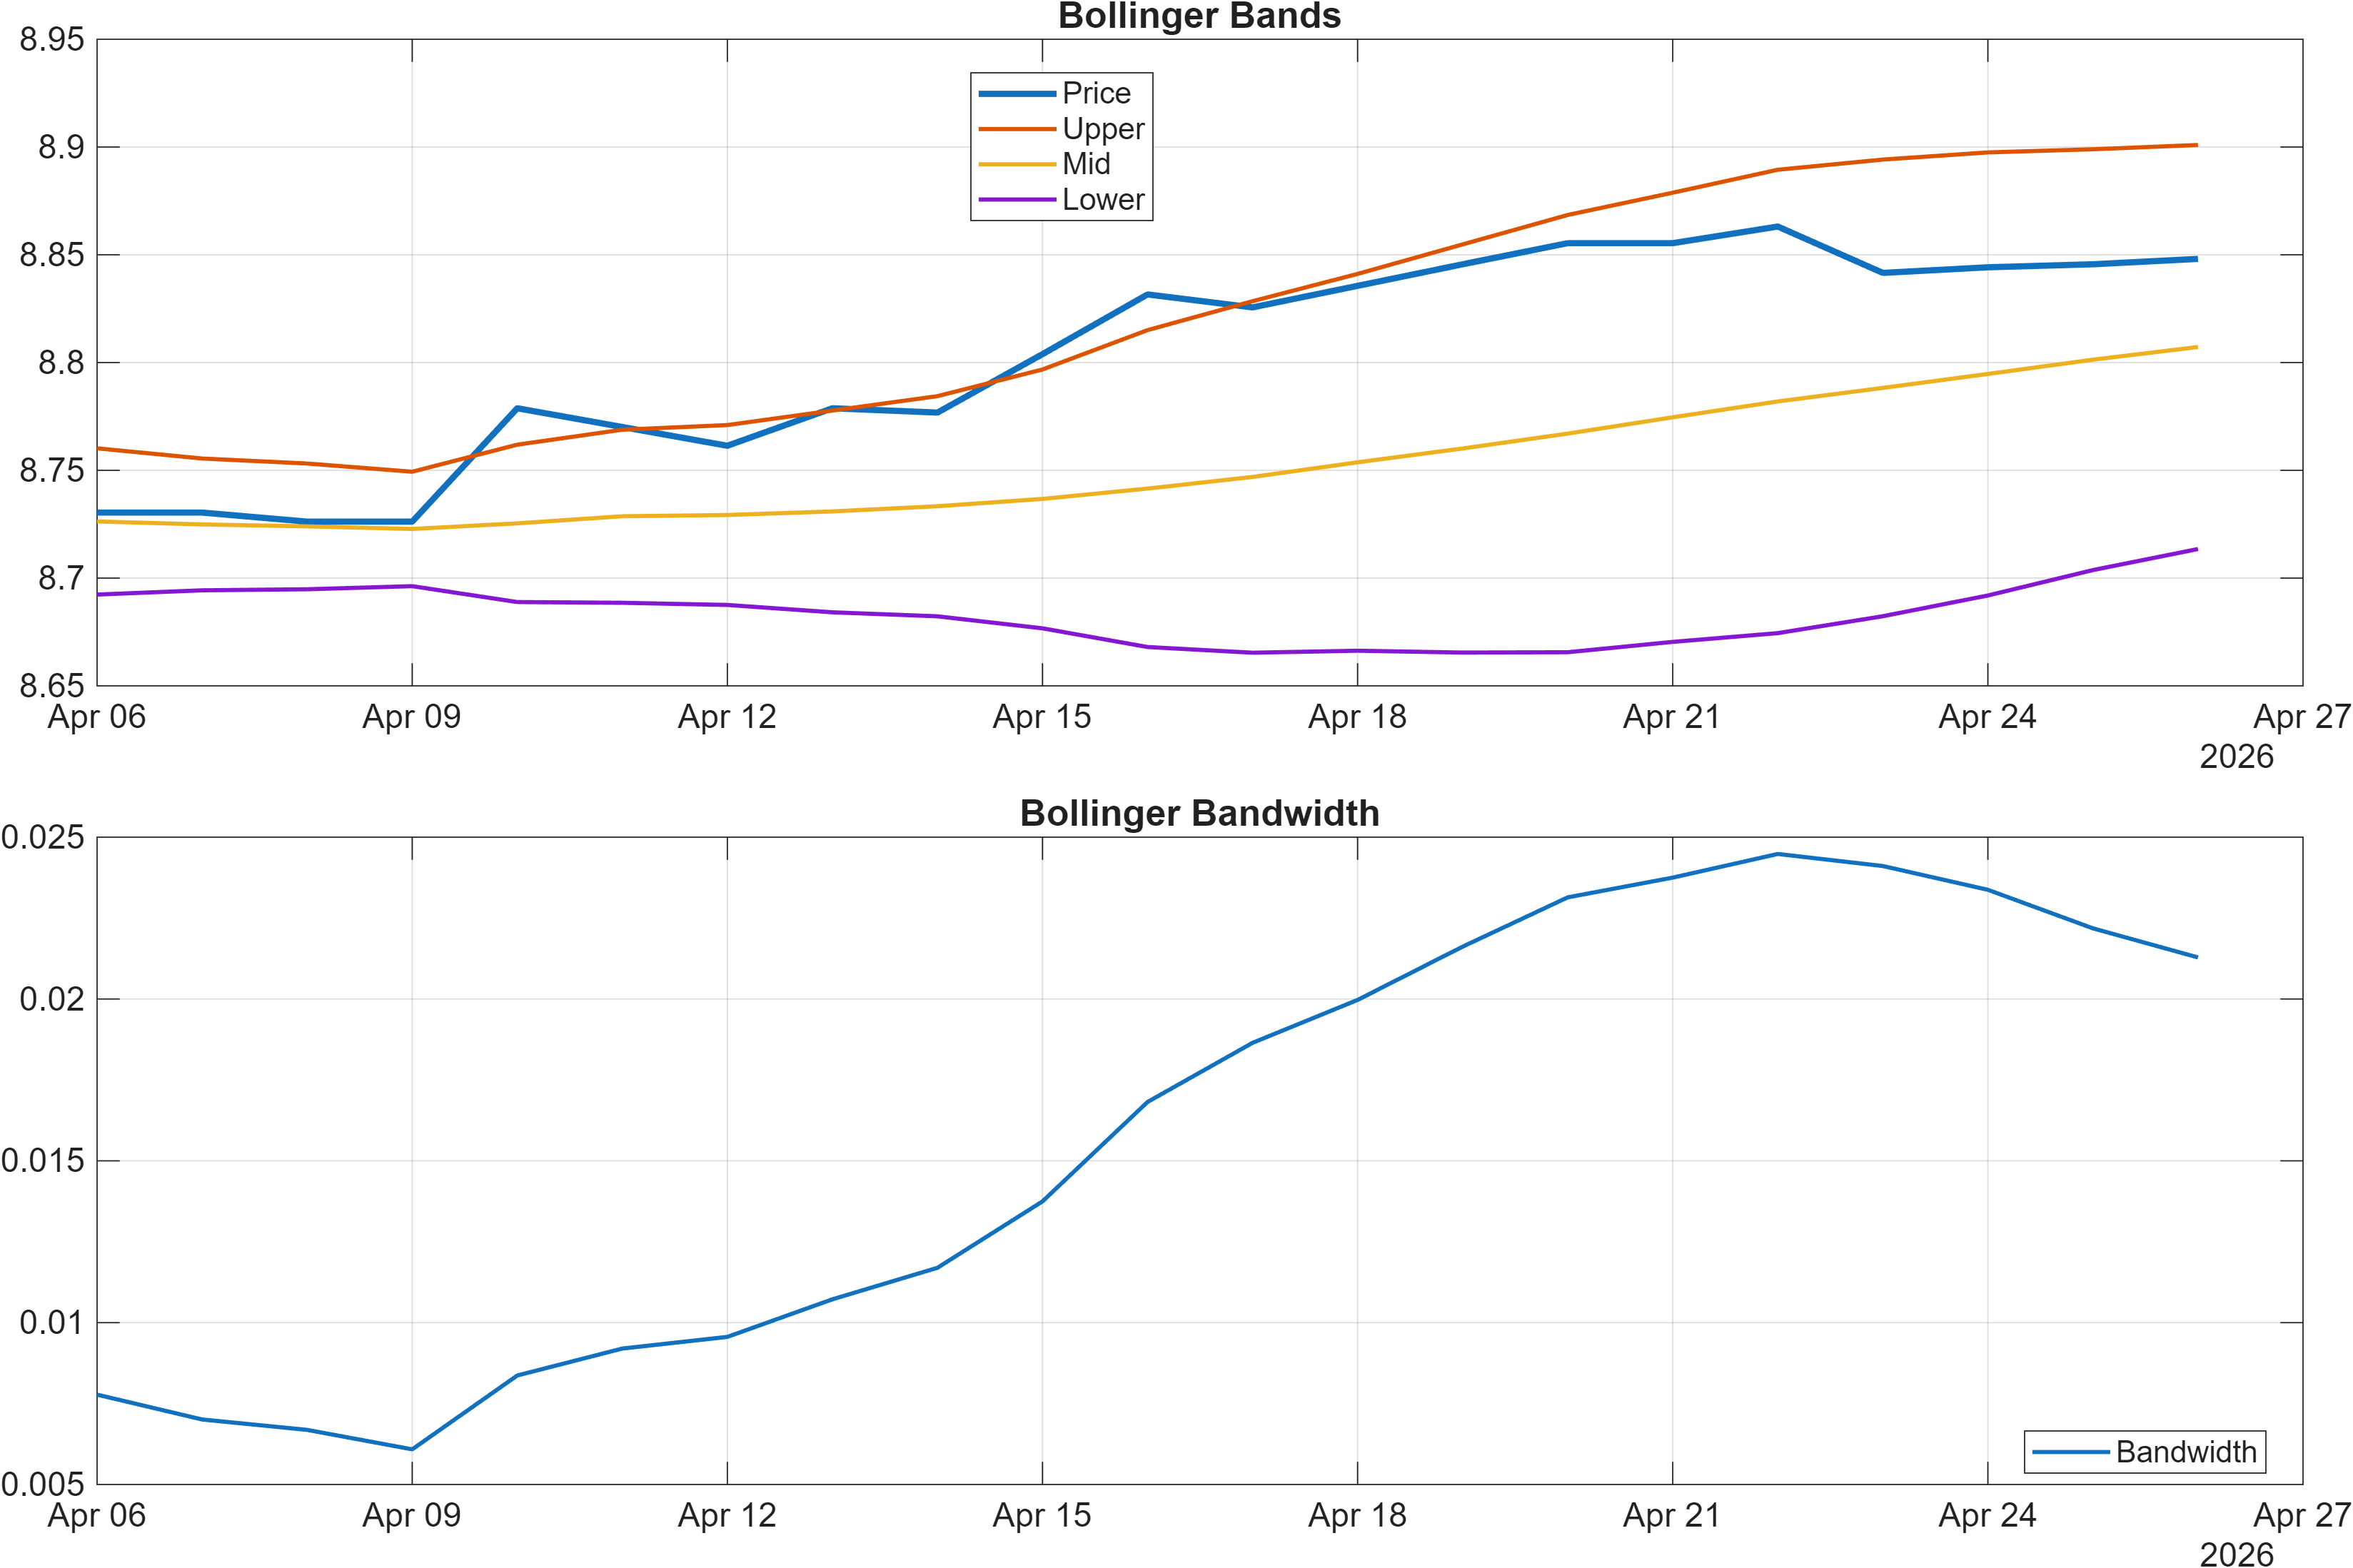
Interpretation: Bandwidth (volatility regime) latest = 0.0213.
Momentum expansion with a late-cycle feel
Momentum signals are broadly constructive, but they also flag potential near-term stretch. The most direct evidence is RSI(14) at 79.75, a level commonly associated with overbought regimes rather than early-stage accumulation. At the same time, the MACD histogram at 0.0029 remains positive, which supports the idea that upside pressure has not fully rolled over even if the market is extended.
Where this becomes more nuanced is volatility. Bollinger Bandwidth at 0.0213 indicates a relatively contained volatility regime. When momentum is elevated while bandwidth is not expanding aggressively, it can imply a steady grind higher rather than a high-volatility breakout. That is often compatible with continuation, but it can also mean that reversals—if they occur—may come through sharp mean-reversion bursts as positioning becomes one-sided.
The 18-signal layer (expanded in Section 5) supports this interpretation: the dashboard shows multiple bullish momentum and rate-of-change signals alongside a large neutral cluster. That mix tends to occur when trend is positive but the system is not uniformly “risk-on” across all sub-models. In that setting, the most informative behavior is whether momentum cools without breaking structure—i.e., whether the pair can digest gains while holding above key supports.
Overall, the momentum/volatility profile looks like trend persistence with elevated sensitivity: the thrust is still present, but the probability of short-horizon pullbacks rises as RSI stays stretched.
4) Support / Resistance zones
Support ~ 8.7041 | Resistance ~ 8.8767
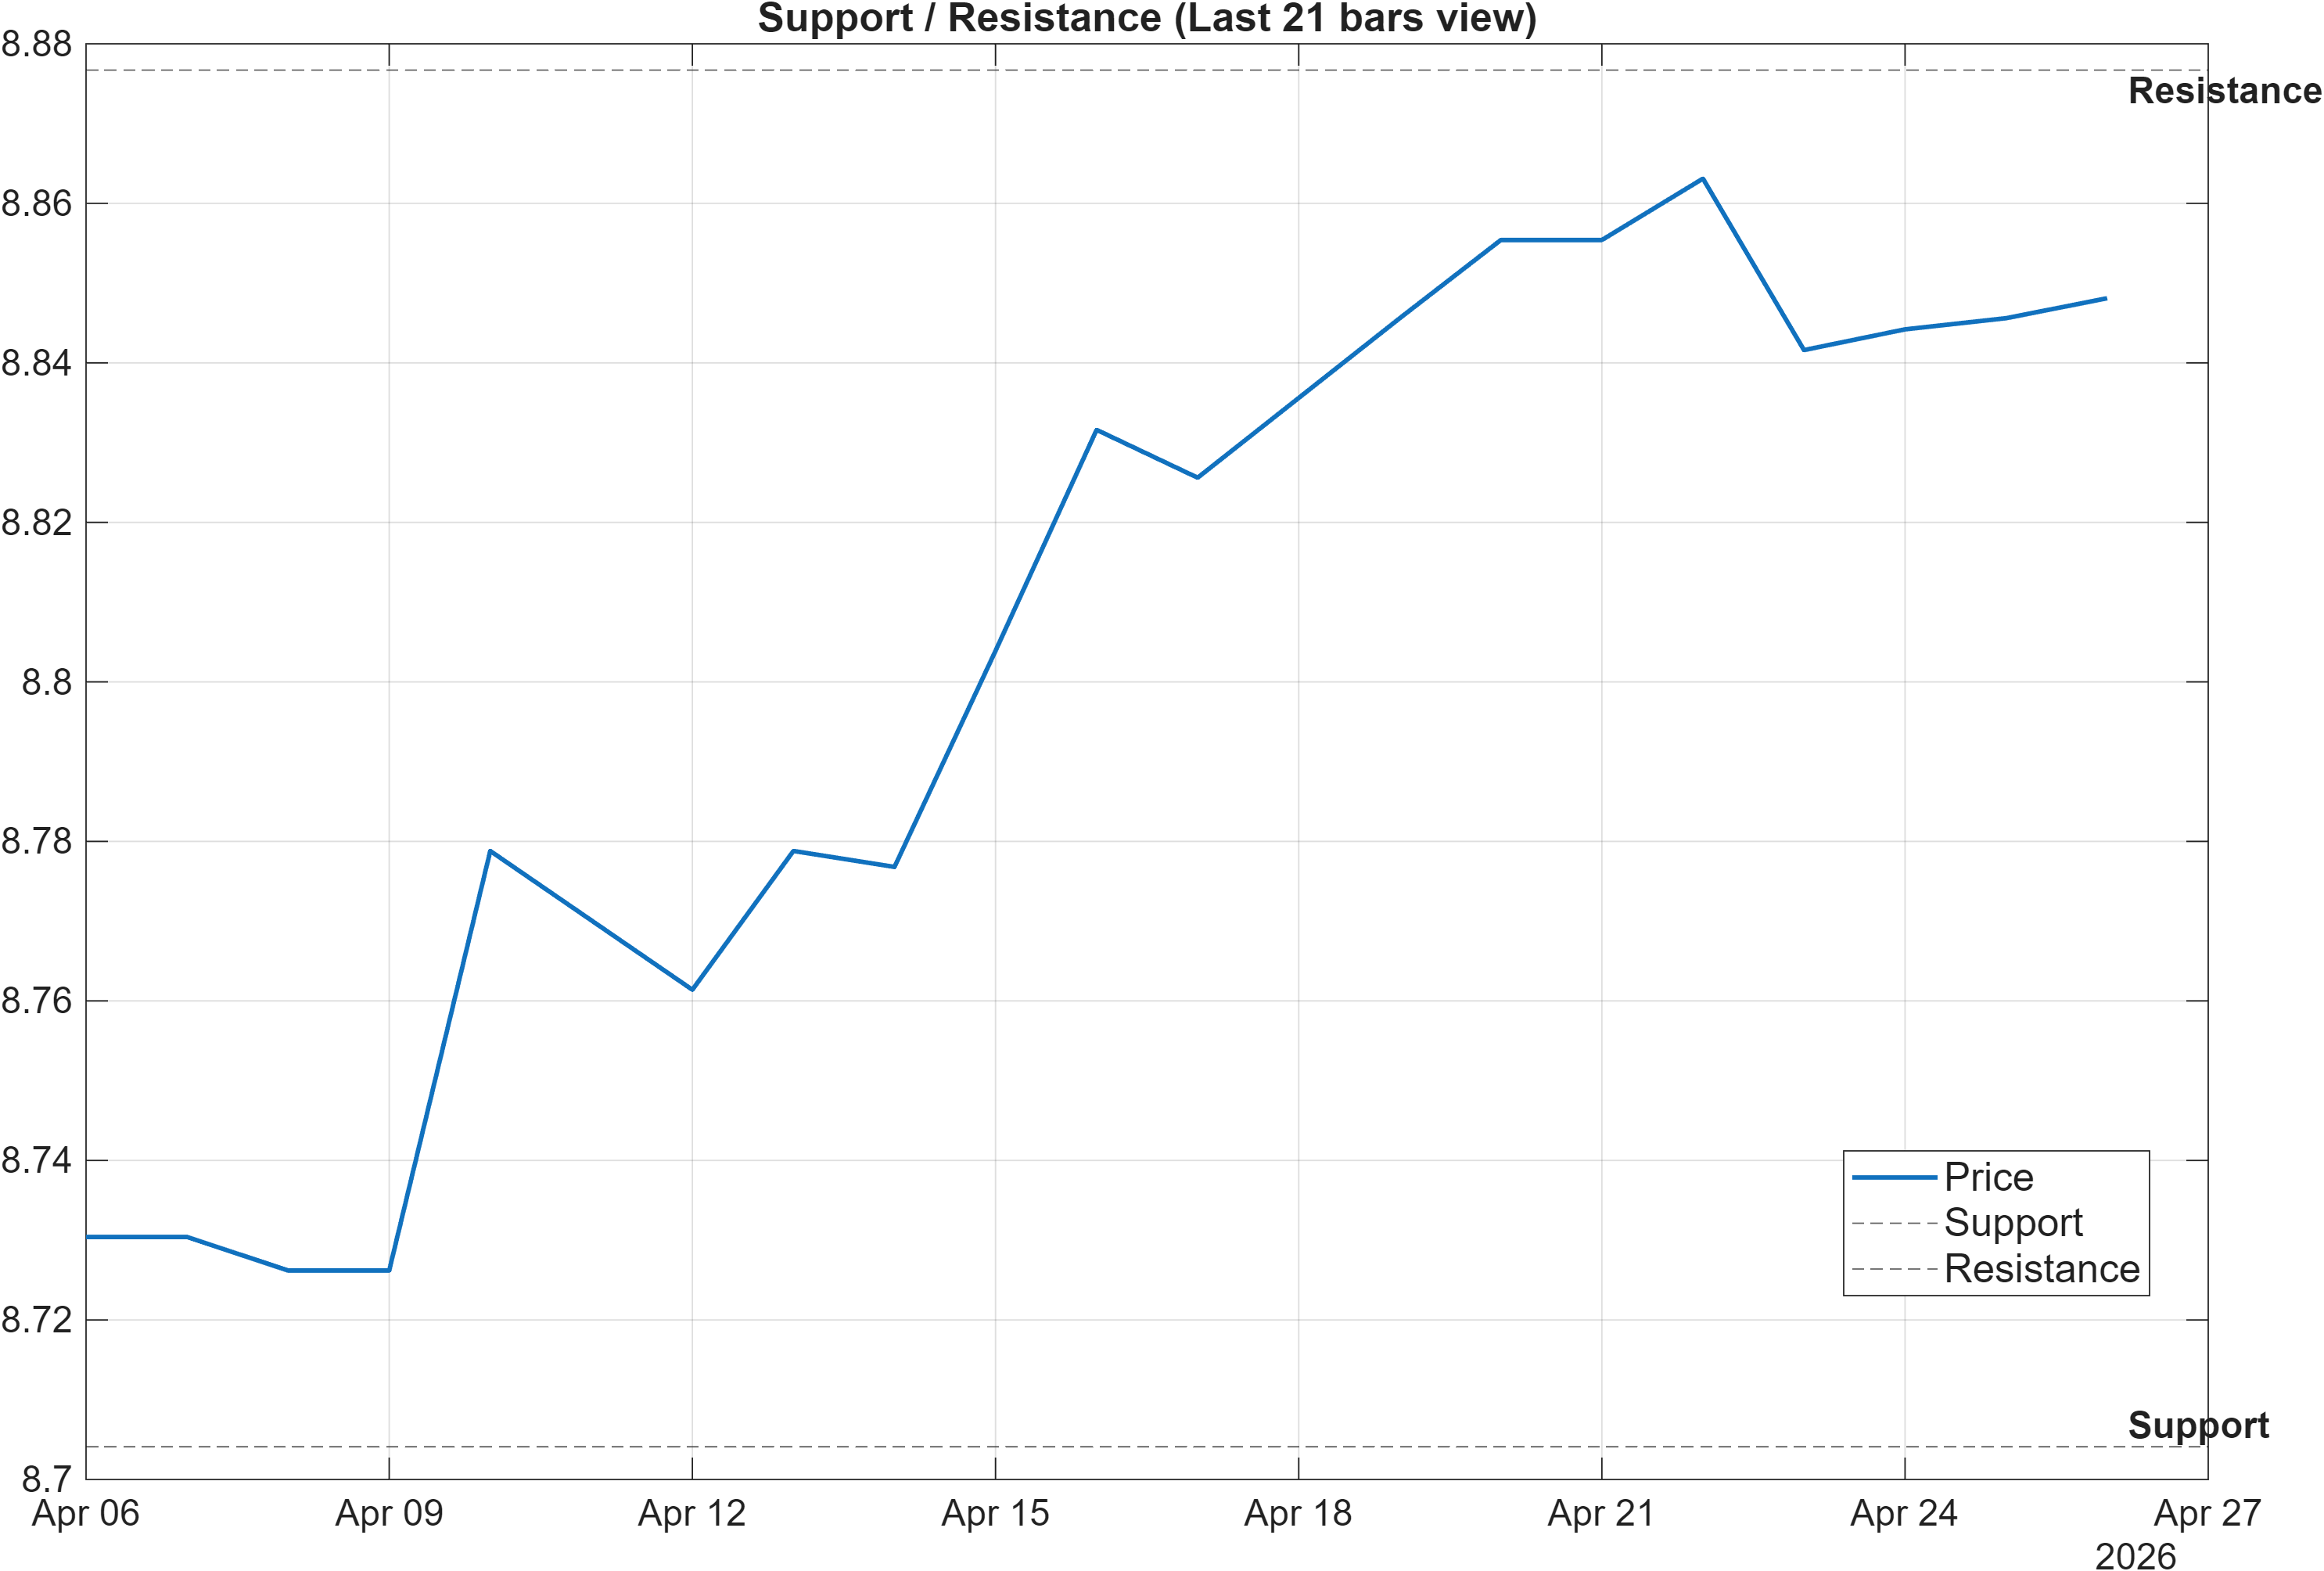
Scenario view: Break above resistance with volume → continuation. Close below support → signal deterioration risk.
Decision zones as confirmation filters
The current map is clean: support ~8.7041 and resistance ~8.8767. With momentum already elevated (RSI 79.75) and the medium-term ranks bullish (Monthly #126, 3-Monthly #28), these zones operate less as “targets” and more as confirmation filters for whether the bullish bias remains structurally intact.
A constructive continuation pathway requires the market to demonstrate acceptance above 8.8767. The base logic in the provided scenario explicitly adds a participation check (“with volume”), which is particularly relevant given that several volume/flow proxies in the signal table are neutral or unavailable (e.g., OBV slope(10) = 0, and some series are marked “—”). In practice, that means price behavior around resistance carries more informational weight when flow metrics are not uniformly confirming.
On the downside, the close below 8.7041 condition is a clear deterioration trigger. It would not automatically negate the broader ranking strength (notably 6-Monthly #75), but it would increase the likelihood that the strong 3-month ranking is transitioning into a consolidation or retracement phase. In markets with contained volatility (bandwidth 0.0213), breaches of well-telegraphed supports can be especially informative because they often occur only when the market’s “quiet trend” regime is changing.
Net: the level structure supports a bounded, rules-based read—continuation is best validated above resistance, while risk rises materially if support fails on a closing basis.
5) Quant Technical Dashboard (18 Signals)
KGNAI AI Technical Analysis Score (Deep Reinforcement Learning): Rank #194 out of 961 (Rank 1 represents the strongest technical positioning and a higher probability of favorable price behavior. As ranks increase toward the maximum, the probability of favorable outcomes weakens and bearish positioning becomes more dominant.) | Label: Neutral | Score: 0.596
18-Signal Technical Confluence Score: 0.389 (Bullish)
Overall Technical Score (18-signal confluence + DRL rank blend): 0.451 (Bullish)
Note: The blended score reflects signal strength weighted against broader AI technical ranking, which may temporarily diverge.
Blended technical score breakdown: 0.451 (Bullish | Bull 7 / Bear 0 / Neutral 11)
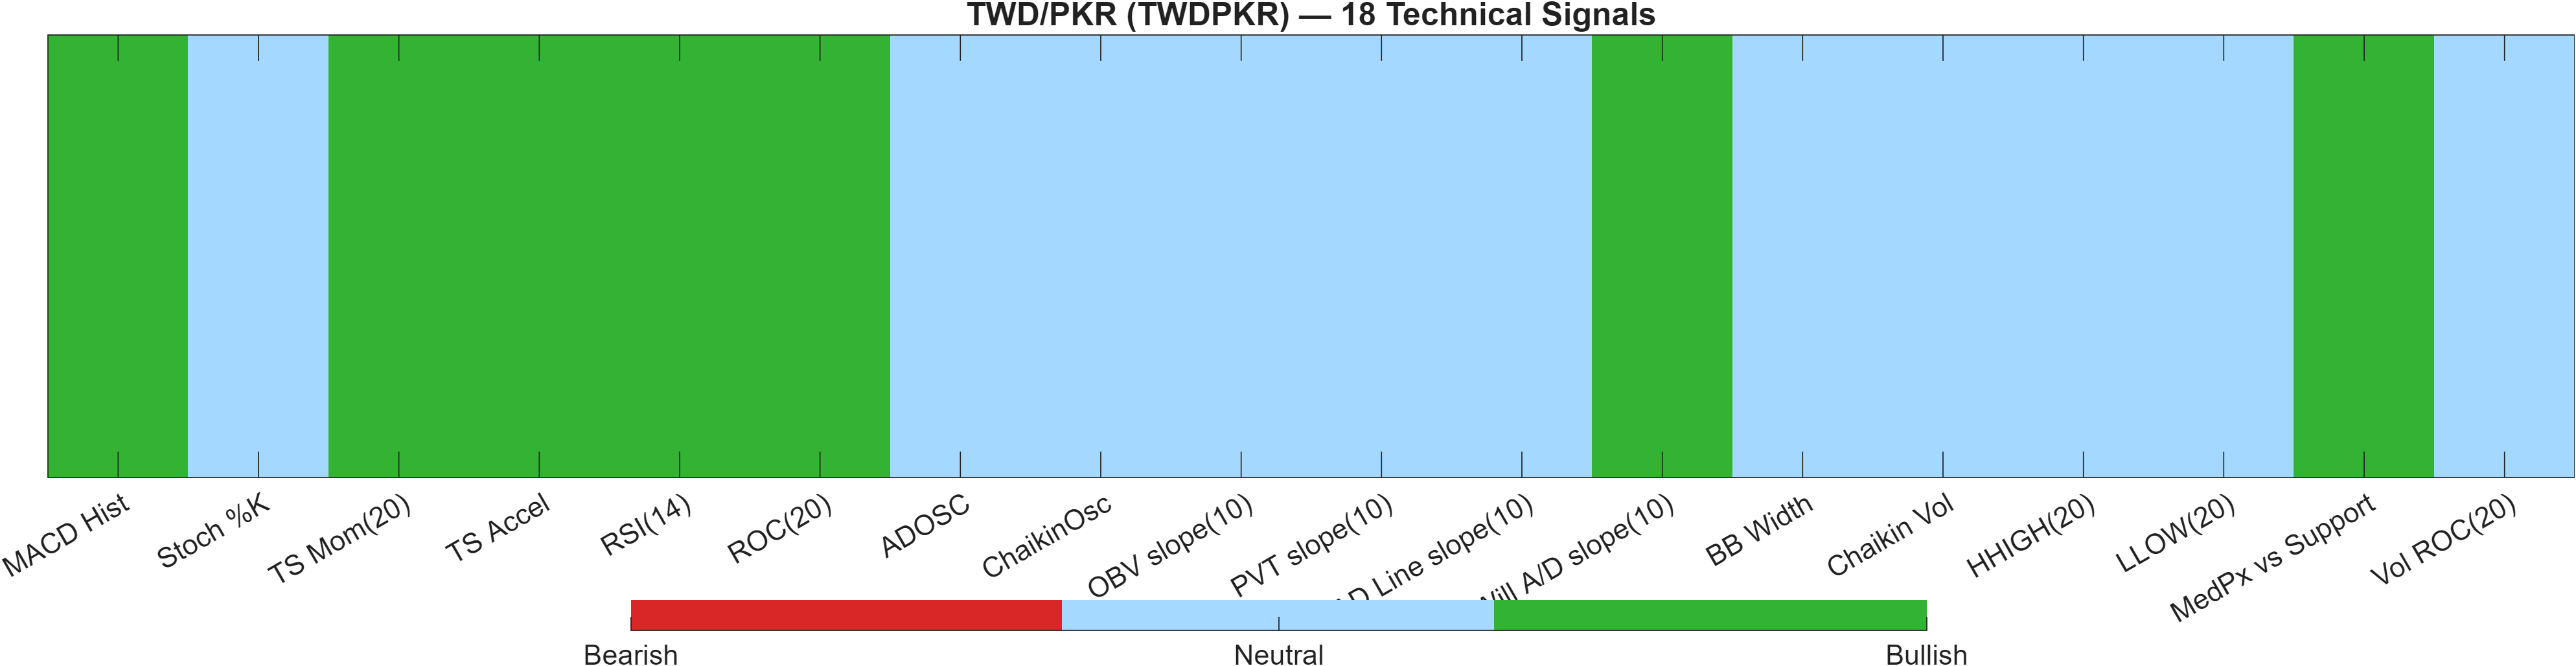
Signal blending: confluence strength vs model-rank restraint
The technical stack is best described as bullish confluence with a neutral model overlay. On one side, the 18-signal layer prints 0.389 (Bullish) and contributes to an overall technical score of 0.451 (Bullish). On the other, the Deep Reinforcement Learning (DRL) technical rank is #194 (Neutral) with a score of 0.596. When those disagree, the most common interpretation is that “classic” indicators are aligned, while the broader pattern-recognition/ranking model is less convinced that the setup is among the strongest opportunities in the full universe.
The internal breadth is also informative: Bull 7 / Bear 0 / Neutral 11 shows there is no bearish cluster dominating the dashboard, but the system is not uniformly bullish either. That is consistent with a market that is trending yet potentially late in the swing—especially when paired with RSI(14) at 79.75. Momentum can remain positive, but the distribution of neutrals often increases the likelihood of pause-and-hold behavior rather than uninterrupted extension.
This blend argues for treating resistance and support as active filters. If price can clear 8.8767 while momentum remains constructive (e.g., MACD histogram stays positive at 0.0029), the neutral DRL read may begin to converge upward. If the market fails to extend and instead loses 8.7041 on a closing basis, the neutral DRL stance would appear more consistent with a broader “not-ready” classification.
Signal table (Bull/Bear/Neutral)
| Indicator | Value | Signal |
|---|---|---|
| MACD Hist | 0.002878 | Bullish |
| Stoch %K | 47.43 | Neutral |
| TS Mom(20) | 0.1152 | Bullish |
| TS Accel | 0.1293 | Bullish |
| RSI(14) | 79.75 | Bullish |
| ROC(20) | 1.348 | Bullish |
| ADOSC | — | Neutral |
| ChaikinOsc | — | Neutral |
| OBV slope(10) | 0 | Neutral |
| PVT slope(10) | — | Neutral |
| AD Line slope(10) | — | Neutral |
| Will A/D slope(10) | 0.0076 | Bullish |
| BB Width | 0.02128 | Neutral |
| Chaikin Vol | -56.95 | Neutral |
| HHIGH(20) | 8.868 | Neutral |
| LLOW(20) | 8.726 | Neutral |
| MedPx vs Support | 0.1415 | Bullish |
| Vol ROC(20) | — | Neutral |
Interpretation: Indicator-level signals form the base confluence, which is then adjusted using a separate AI-driven technical ranking model. The final technical score summarizes this combined view.
6) News sentiment + extractive gist
Note: Instrument-specific news matches were not found, so the digest includes broader market/sector headlines. Links are provided for verification.
Sentiment score (avg): 0.120 | Positive: 31% | Neutral: 63% | Negative: 6%
KGNAI AI News Sentiment Score (normalized -1 to +1): Not available (as of —) | Label: Not available | Overall news score: 0.12
Positive Developments
Recent coverage across major financial outlets indicates a modestly constructive tone around broader risk appetite and policy narratives, which can indirectly influence FX positioning. Reported market conditions leaned “risk-on” in parts of the period, with attention on diplomatic de-escalation efforts and the potential for calmer headline risk. A key supportive thread in the news flow has been the idea that macro policy objectives remain oriented toward sustaining growth while managing inflation pressures, with repeated references to productivity and technology themes. For FX markets, these narratives often translate into episodic USD softness during risk-on swings, and improved appetite for carry or growth-sensitive exposures. In this dataset, the aggregate news mix still skews mostly neutral, but the positive share (31%) provides a slight constructive bias that may reinforce the medium-term bullish ranking profile when price action confirms.
Neutral / Mixed Developments
The neutral bucket dominates the coverage (63%), reflecting a market environment where participants are balancing multiple scheduled catalysts and unresolved geopolitical variables. Commentary has emphasized that upcoming central bank decisions and high-importance macro releases can lift FX volatility without necessarily establishing a durable directional trend. For TWDPKR specifically, this matters because the technical picture already shows a blend: bullish momentum signals alongside many neutral confirmations, and a DRL technical rank labeled Neutral. In such environments, price often respects well-defined support/resistance zones while waiting for macro clarity. With volatility regime readings still contained (Bollinger Bandwidth 0.0213), neutral news flow can act as a stabilizer—supporting range discipline until either policy communication or risk sentiment produces a cleaner impulse.
Negative / Risk Signals
Negative coverage (6%) is limited in proportion, but it remains relevant due to its potential to trigger abrupt risk repricing in FX. Recent reporting highlights that diplomatic processes can be uneven, with episodes of stalled progress and renewed uncertainty. When geopolitical risk headlines intensify, FX markets often rotate toward defensive positioning and can amplify short-horizon reversals—especially when technical conditions are stretched, as indicated by RSI(14) at 79.75. For TWDPKR, risk-off bursts would be most visible through failures to hold key technical structure, particularly a close below support at 8.7041. The absence of instrument-specific news matches also means the digest is contextual rather than causal; as a result, the most disciplined use of this section is to treat negative macro headlines as potential volatility triggers rather than directional forecasts.
- Whether price acceptance develops above 8.8767 or rejects that zone.
- Whether any volatility pickup coincides with a break of 8.7041 on a closing basis.
- Whether broader risk sentiment shifts meaningfully away from the current mostly-neutral news mix.
Sources referenced: Reuters, Bloomberg, Yahoo Finance, MarketWatch, Investing.com
7) Sources
Not available in the provided data.
You may also like: How KGNAI AI ranks instruments across global markets
Disclaimer: KGNAI provides AI-generated analytics and educational market commentary only. This is not financial advice. Markets involve risk. Always do your own research.