
USDXPF (US Dollar/Pacific Franc FX Spot Rate) — 12-Apr-2026 Technical & Rank View: Multi-horizon Weakness with Short-Term Rank Strength
USDXPF enters 12-Apr-2026 with a notable cross-horizon mismatch: the daily rank is #8 (top percentile strength), while weekly (#876) and monthly (#930) ranks sit deep in the bottom tail of the 965-instrument universe. On the technical layer, the 18-signal confluence score is -0.222 (Neutral), yet the blended view turns Bearish (-0.387) as the Deep Reinforcement Learning technical rank remains weak at #854. Momentum gauges lean cautious—RSI(14) at 30.8 and MACD histogram at -0.2171—while volatility remains relatively compressed with Bollinger bandwidth at 0.0255, a setup that often precedes expansion but does not specify direction. Key decision zones are clearly defined at support ~100.5707 and resistance ~103.7227. News sentiment reads mildly positive-to-neutral (avg 0.124) with limited instrument-specific matching in the provided data.
- Rank stance (Short / Mid / Long): Bearish / Bearish / Bearish, despite a top-tier daily rank (#8) versus weak weekly (#876) and monthly (#930).
- Technical confluence label: Neutral on 18-signal score (-0.222); overall technical bias Bearish on blended score (-0.387).
- Key levels: Support ~100.5707 | Resistance ~103.7227.
- News sentiment bias: Neutral overall (avg 0.124; 44% positive, 50% neutral, 6% negative).
- Confirmation / invalidation condition: A sustained close below 100.5707 would reinforce deterioration risk; a break above 103.7227 would pressure the bearish mid-horizon framing.
KGNAI evaluates assets using large cross-sectional datasets built from millions of structured data points. Inputs incorporate fundamental metrics, technical structures, and systematically processed news sentiment. Statistical models, machine learning, and AI frameworks are used to assess relative positioning, signal alignment, and probabilistic behavior across broad universes.
- Ranks are comparative across the tracked universe, not absolute price targets.
- Confluence reflects alignment among independent signal groups.
- Support/resistance levels are probabilistic decision zones, not guarantees.
- Sentiment provides contextual bias within the broader analytical framework.
1) KGNAI AI Analysis
Region: FOREX
Total universe size: 965 ranked instruments
- Daily rank: #8 out of 965 — Bullish
- Weekly rank: #876 out of 965 — Bearish
- Monthly rank: #930 out of 965 — Bearish
- 3-Monthly rank: #19 out of 965 — Bullish
- 6-Monthly rank: #905 out of 965 — Bearish
- Yearly rank: Not available for this horizon — Not available
The rank stack suggests a two-speed regime. The daily rank (#8) and 3-month rank (#19) point to strong relative behavior over very short and intermediate windows, but the weekly (#876), monthly (#930), and 6-month (#905) readings sit in the lower tail of the universe. In practice, this configuration often occurs when a market is experiencing a tactical rebound inside a broader weaker structure—or when short-horizon behavior is improving faster than the higher-timeframe trend can reprice.
The stated term view remains Bearish across short-, mid-, and long-term horizons. Given the extreme weekly/monthly placements, the daily strength should be treated as fragile unless it persists through the key level framework (support 100.5707, resistance 103.7227) and is confirmed by momentum repair (e.g., RSI rising away from 30.8 rather than stalling near oversold).
A final nuance: the absence of a yearly rank is a real limitation for long-horizon context—Not available in the provided data. With that constraint, the most reliable read is the agreement between weak weekly/monthly/6-month ranks and the bearish technical blend (-0.387), while monitoring whether the daily (#8) strength is signaling an early transition or merely a short-lived mean-reversion phase.
Want the full universe and complete rank tables? Unlock full access on KGNAI: https://www.kgnai.com/pricing
2) Price & trend overview
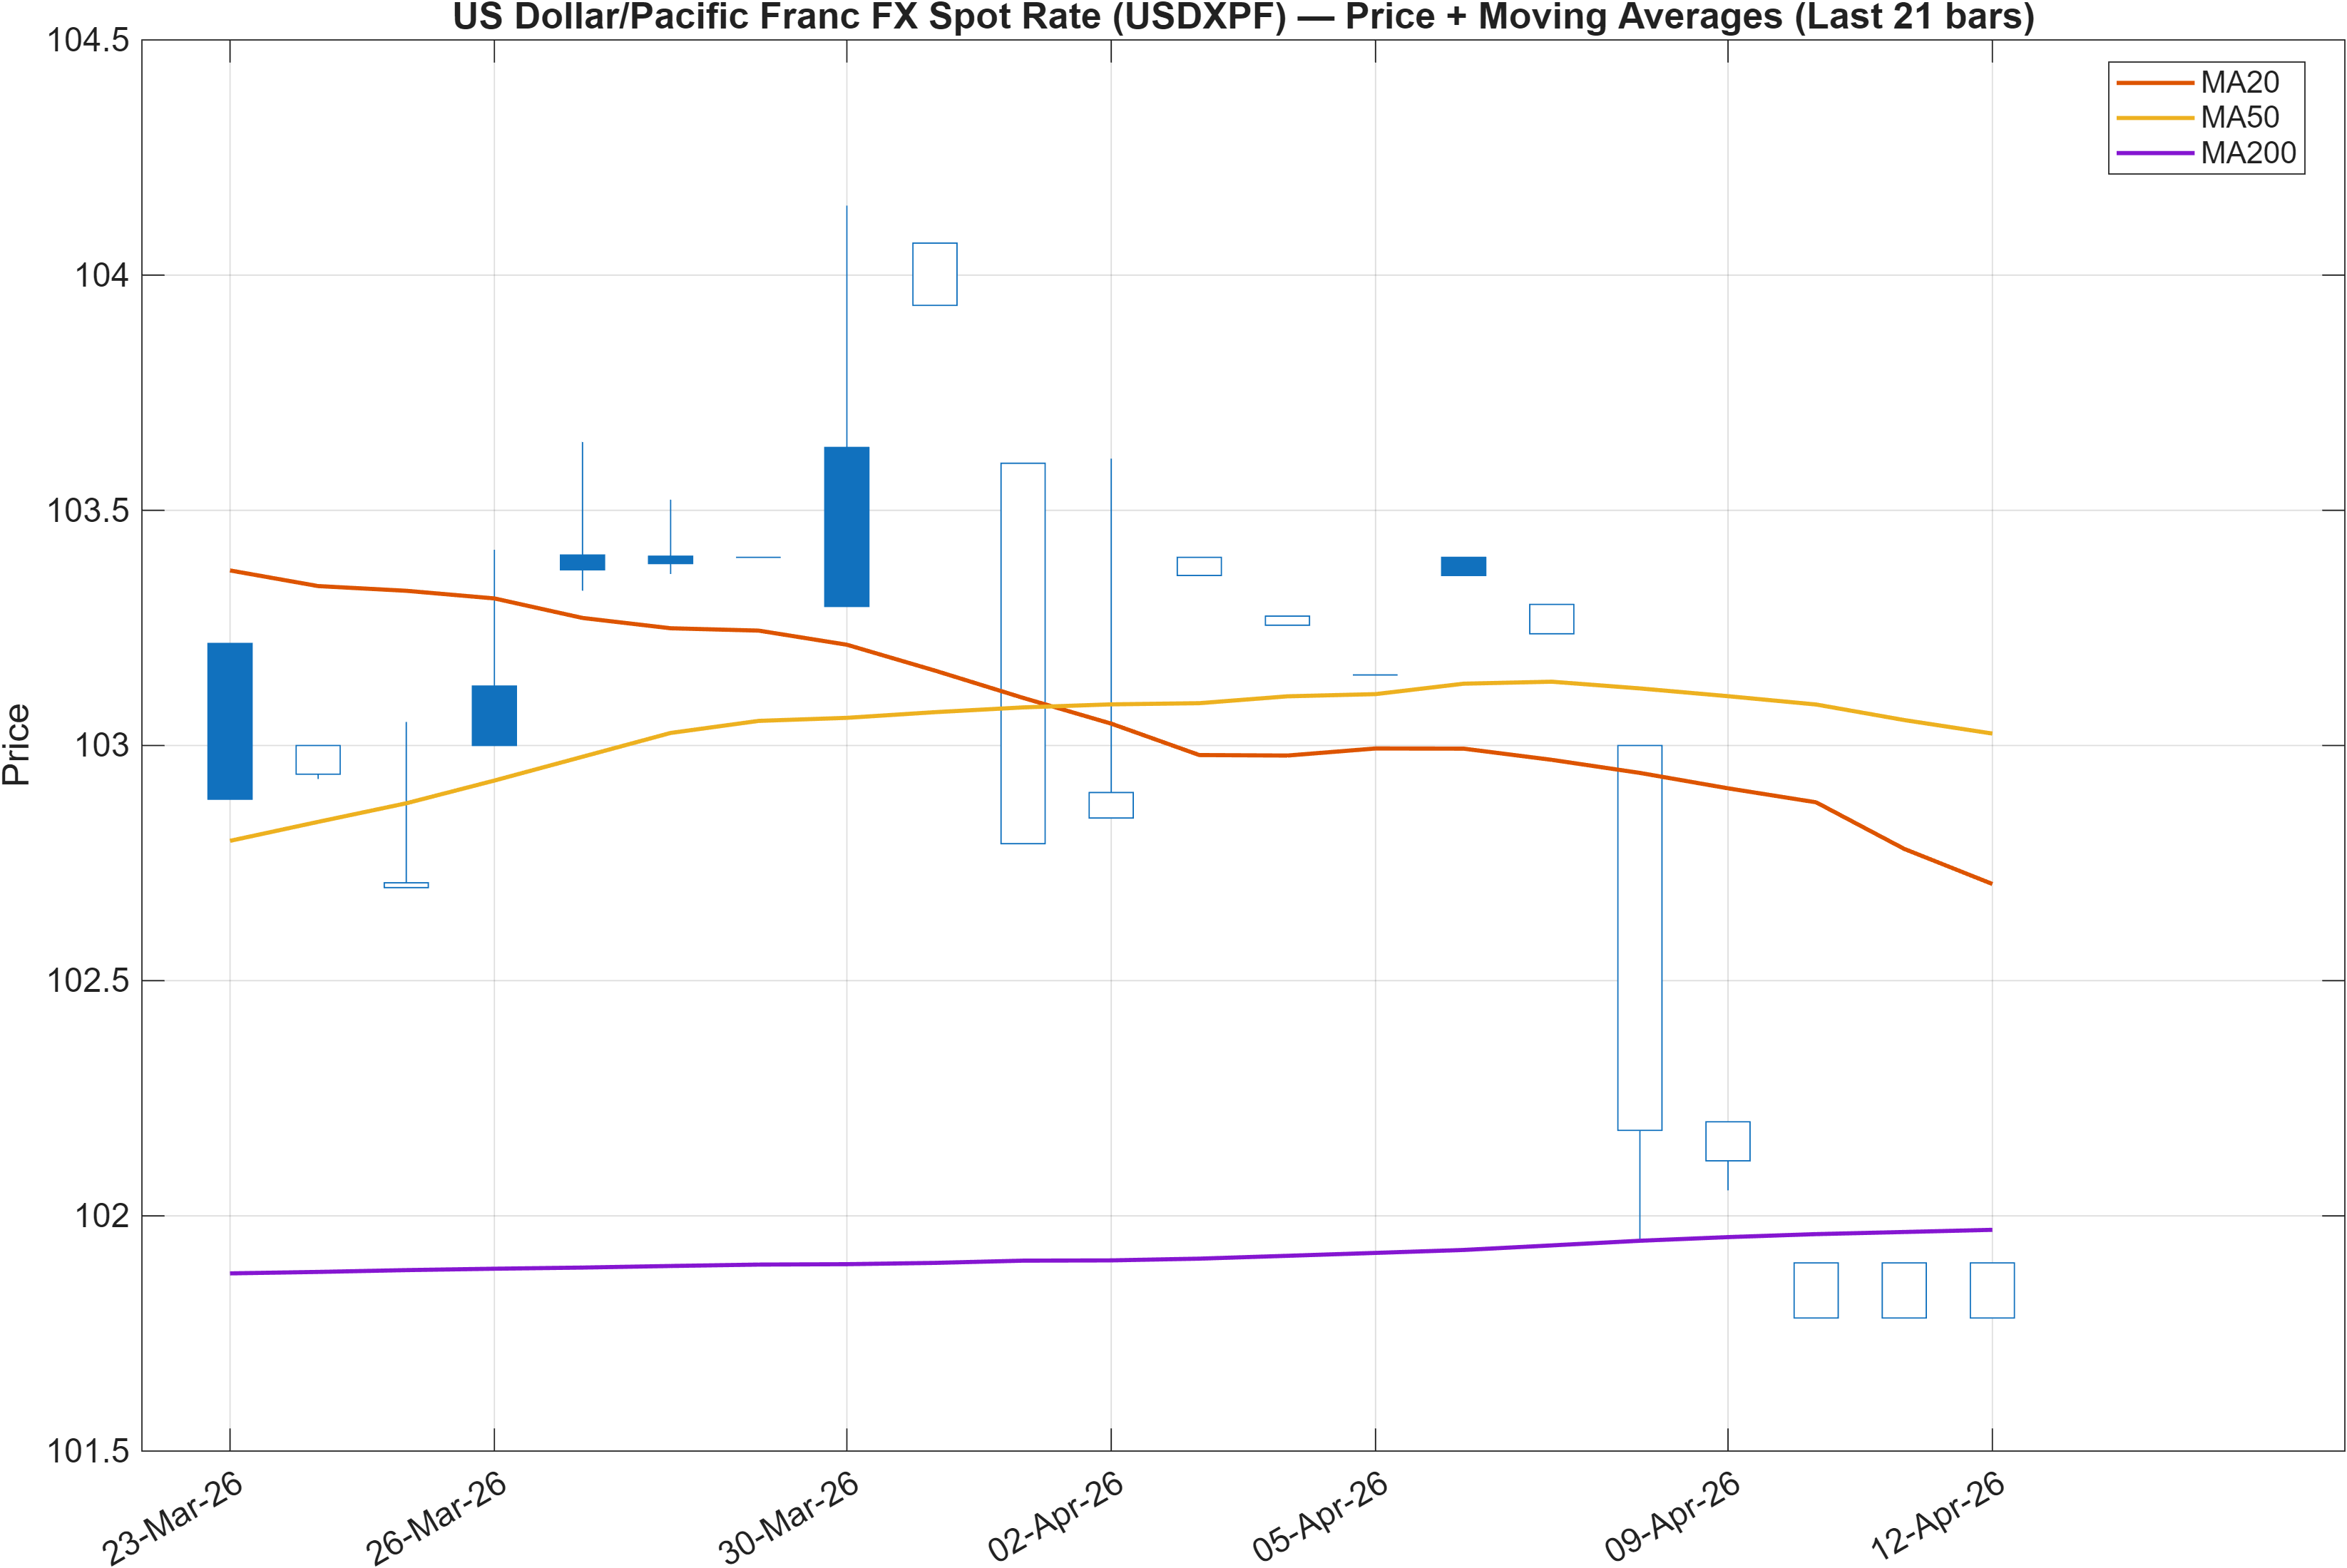
Interpretation: Close vs MA50 = Bearish, MA50 vs MA200 = Bullish.
Trend structure: pullback pressure within a longer moving-average hierarchy
The moving-average read is split: price is below the MA50 (bearish near-term posture), while MA50 remains above MA200 (bullish longer trend filter). That mix commonly reflects a market in correction mode rather than a fully confirmed downtrend—yet it also flags that the rebound implied by the higher MA stack is currently not being expressed in the most recent closes.
This is where the ranking divergence becomes useful: a top daily rank (#8) can coexist with a bearish close vs MA50 when the market is attempting to base or rotate after a drawdown; conversely, the very weak monthly rank (#930) argues that, even if a bounce develops, it may struggle to persist without a stronger shift in broad technical alignment. In other words, short-horizon relative strength is present, but the medium-horizon posture remains vulnerable.
Price behavior should be framed against the defined zones: with support at 100.5707 and resistance at 103.7227, the moving-average conflict becomes a question of which side of the range the market accepts. A recovery that can reclaim resistance would help reconcile the bullish MA50–MA200 relationship with the price action; repeated failures below the MA50, especially if accompanied by a drift toward 100.5707, would align more cleanly with the weak weekly (#876) and 6-month (#905) rank profile.
3) Momentum & volatility dashboard
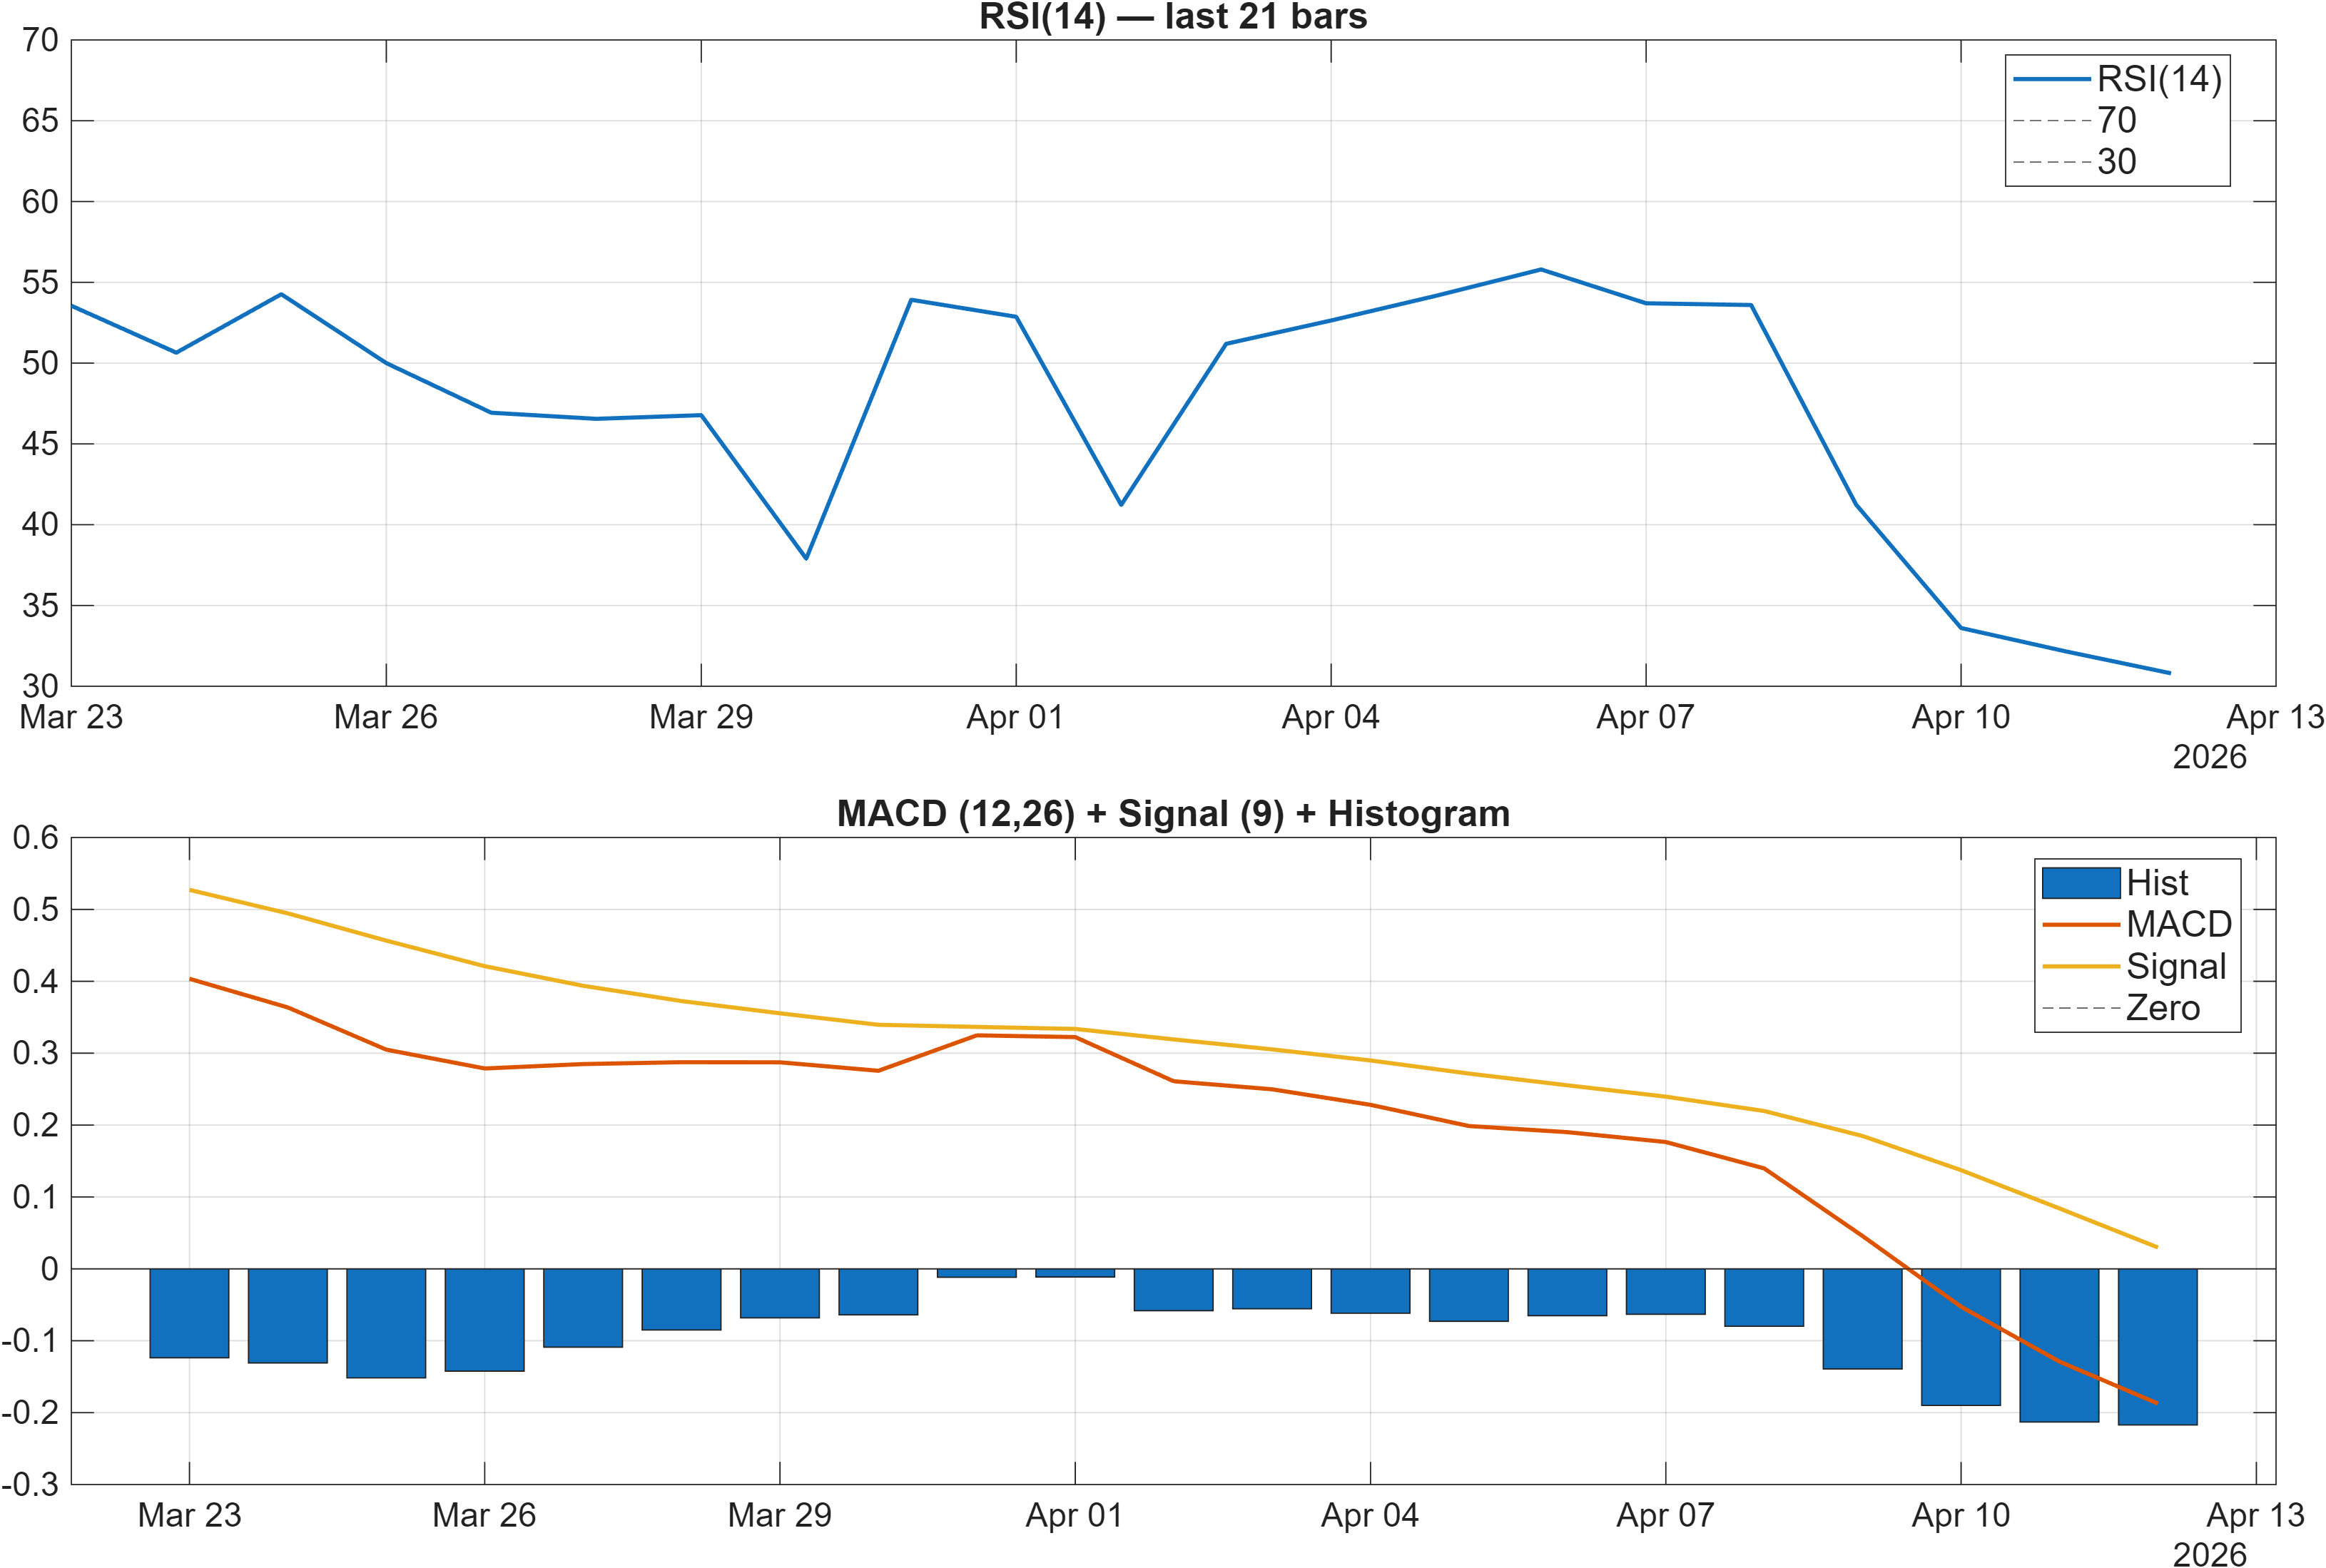
Interpretation: RSI bias = Bearish, MACD hist = -0.2171.
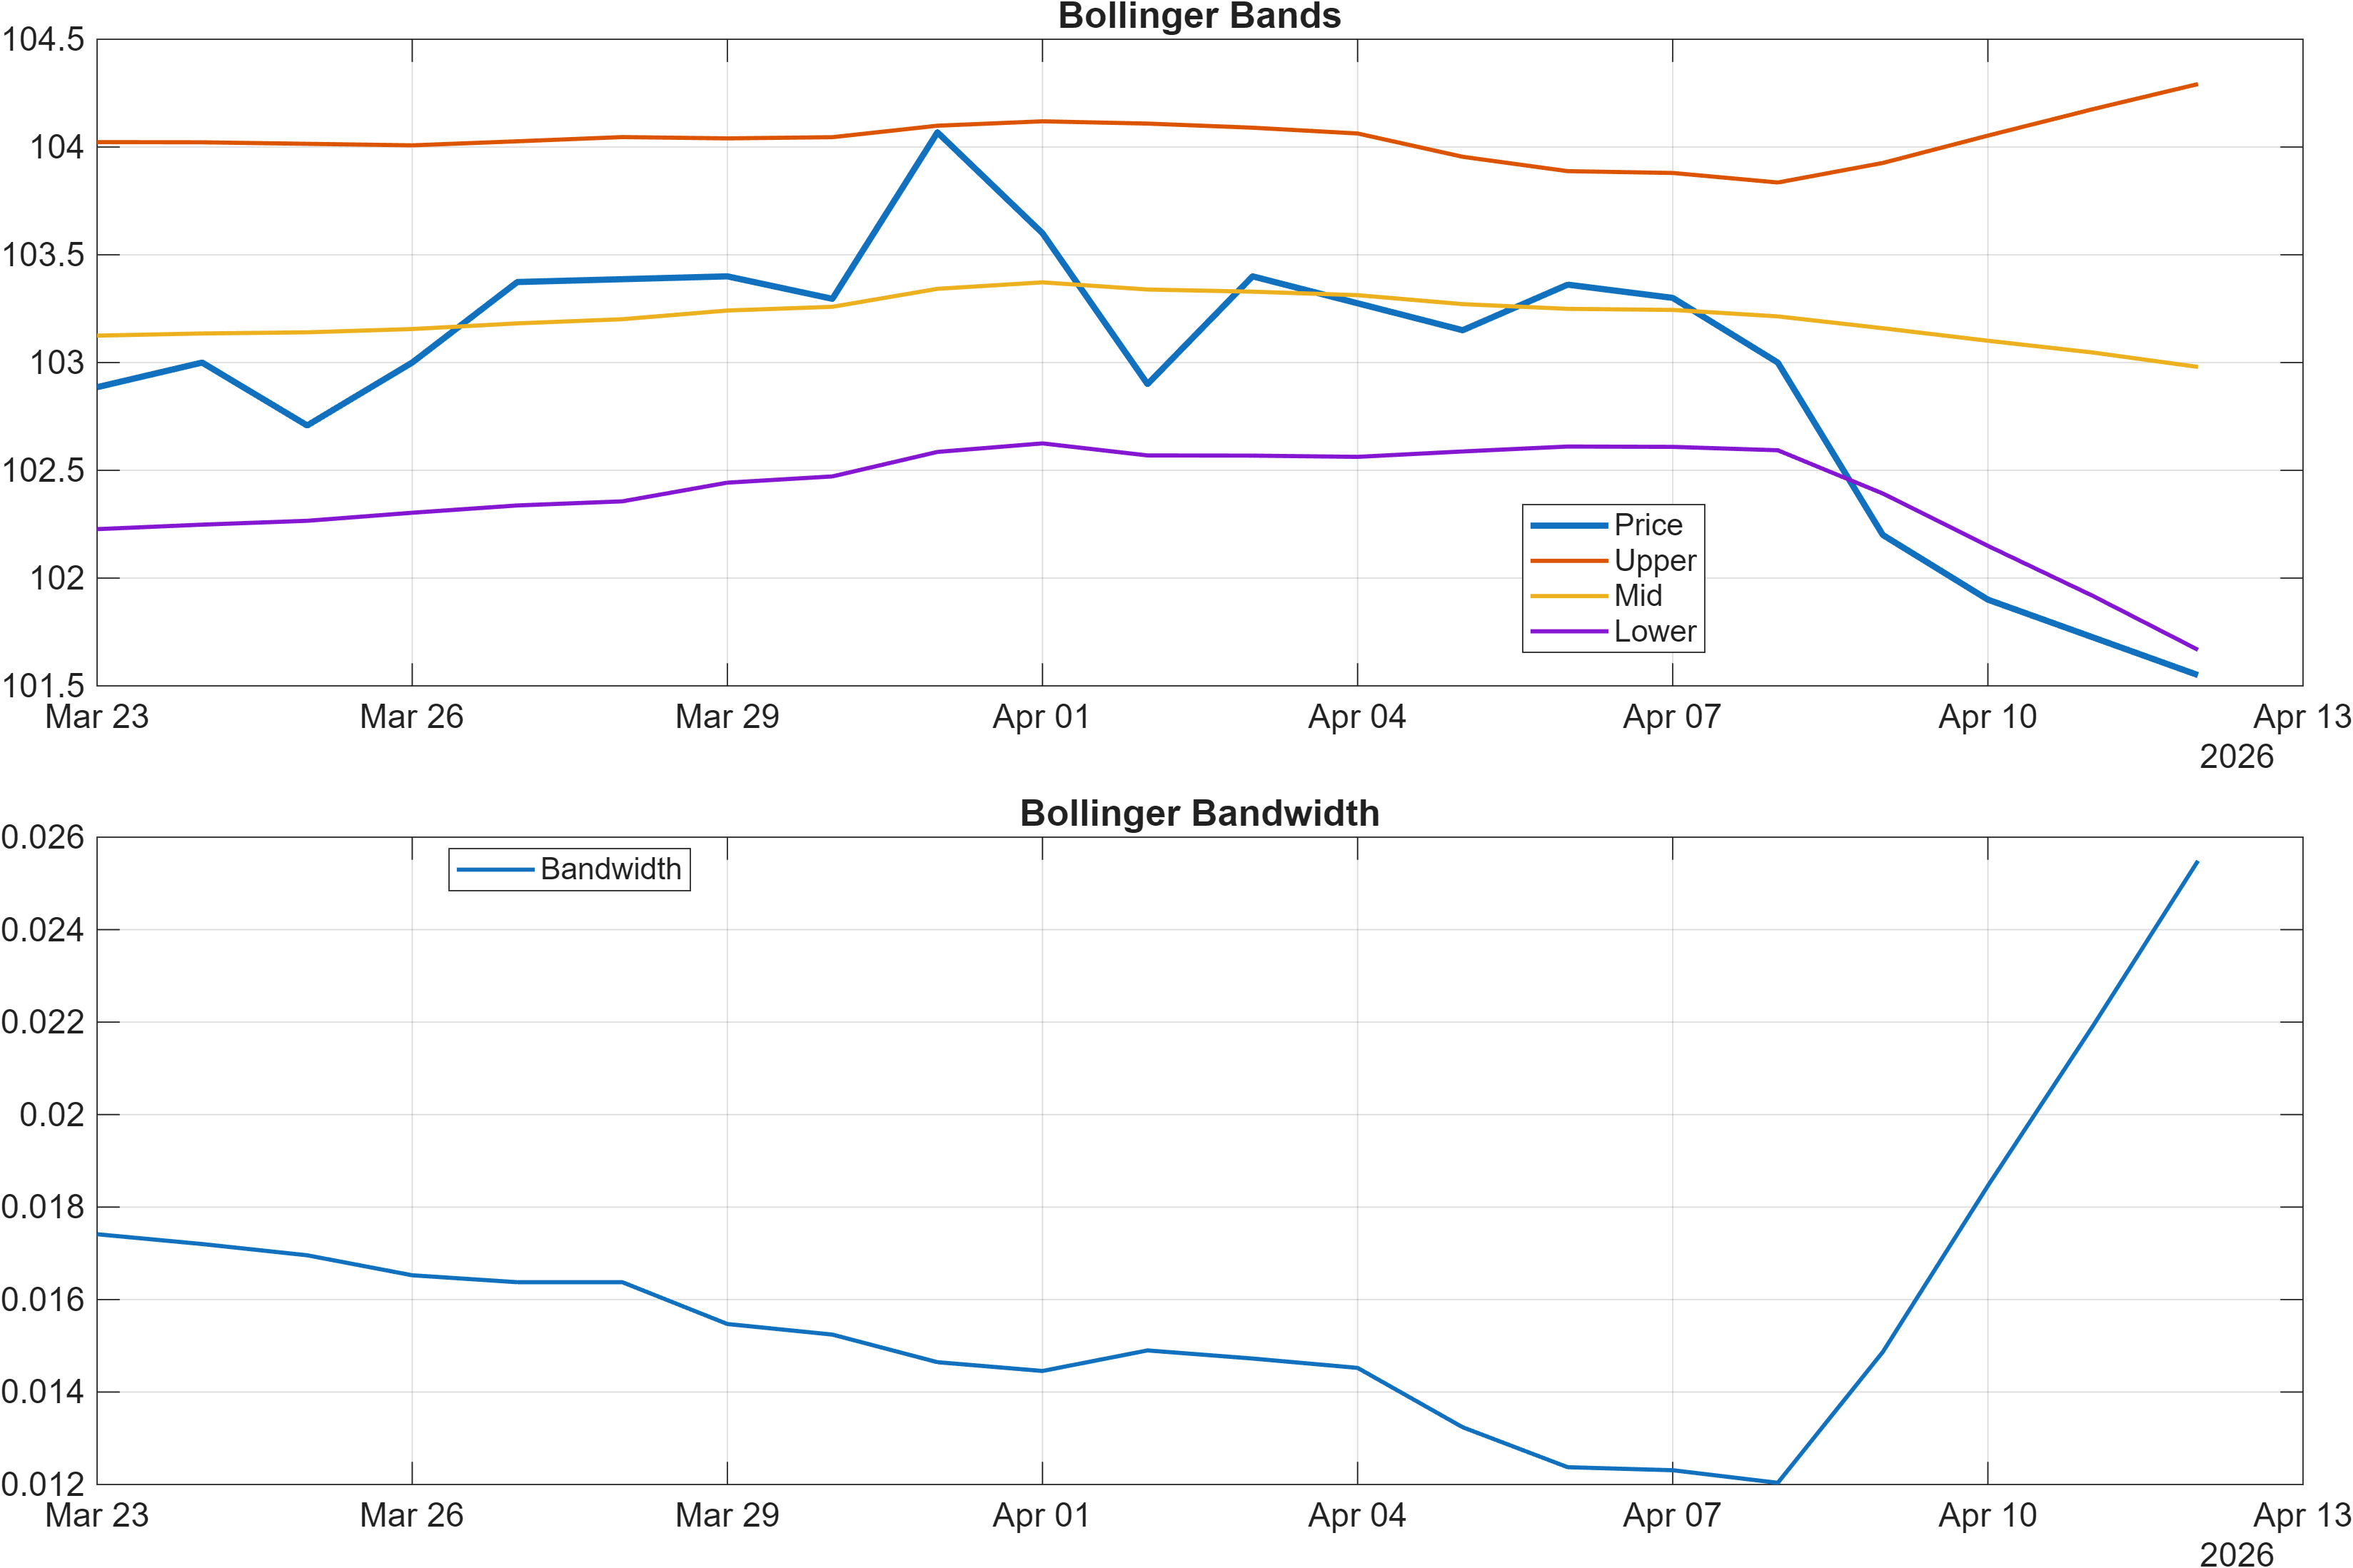
Interpretation: Bandwidth (volatility regime) latest = 0.0255.
Momentum condition: weak impulse with early signs of mean-reversion risk
Momentum remains biased to the downside. The MACD histogram at -0.2171 indicates that downside impulse is still present in the trend-following framework, while RSI(14) at 30.8 sits near the common oversold boundary. This combination often maps to a market that is pressured but potentially late-cycle in the immediate move—where incremental downside can become harder to extend without a volatility pickup or renewed selling participation.
The signal mix inside the broader technical set reinforces the same idea. TS Mom(20) at -1.1 and TS Accel at -1.5 point to negative momentum and decelerating trend quality, while Stoch %K at 7.241 (Bullish) flags a potential short-horizon rebound condition. When RSI is near 30 and stochastics are deeply depressed, markets can bounce even while MACD remains negative; the key is whether that bounce can convert into a structure shift (higher highs / higher lows) rather than a brief relief move.
Volatility regime: compressed bandwidth increases sensitivity to level breaks
Volatility is relatively contained with Bollinger bandwidth at 0.0255 (and BB Width 0.02549 in the signal table), consistent with a compression state. Compression can persist, but it also tends to increase the informational value of support and resistance tests. With levels at 100.5707 and 103.7227, a volatility expansion that occurs near either boundary can resolve the current momentum ambiguity more decisively than oscillators alone.
4) Support / Resistance zones
Support ~ 100.5707 | Resistance ~ 103.7227
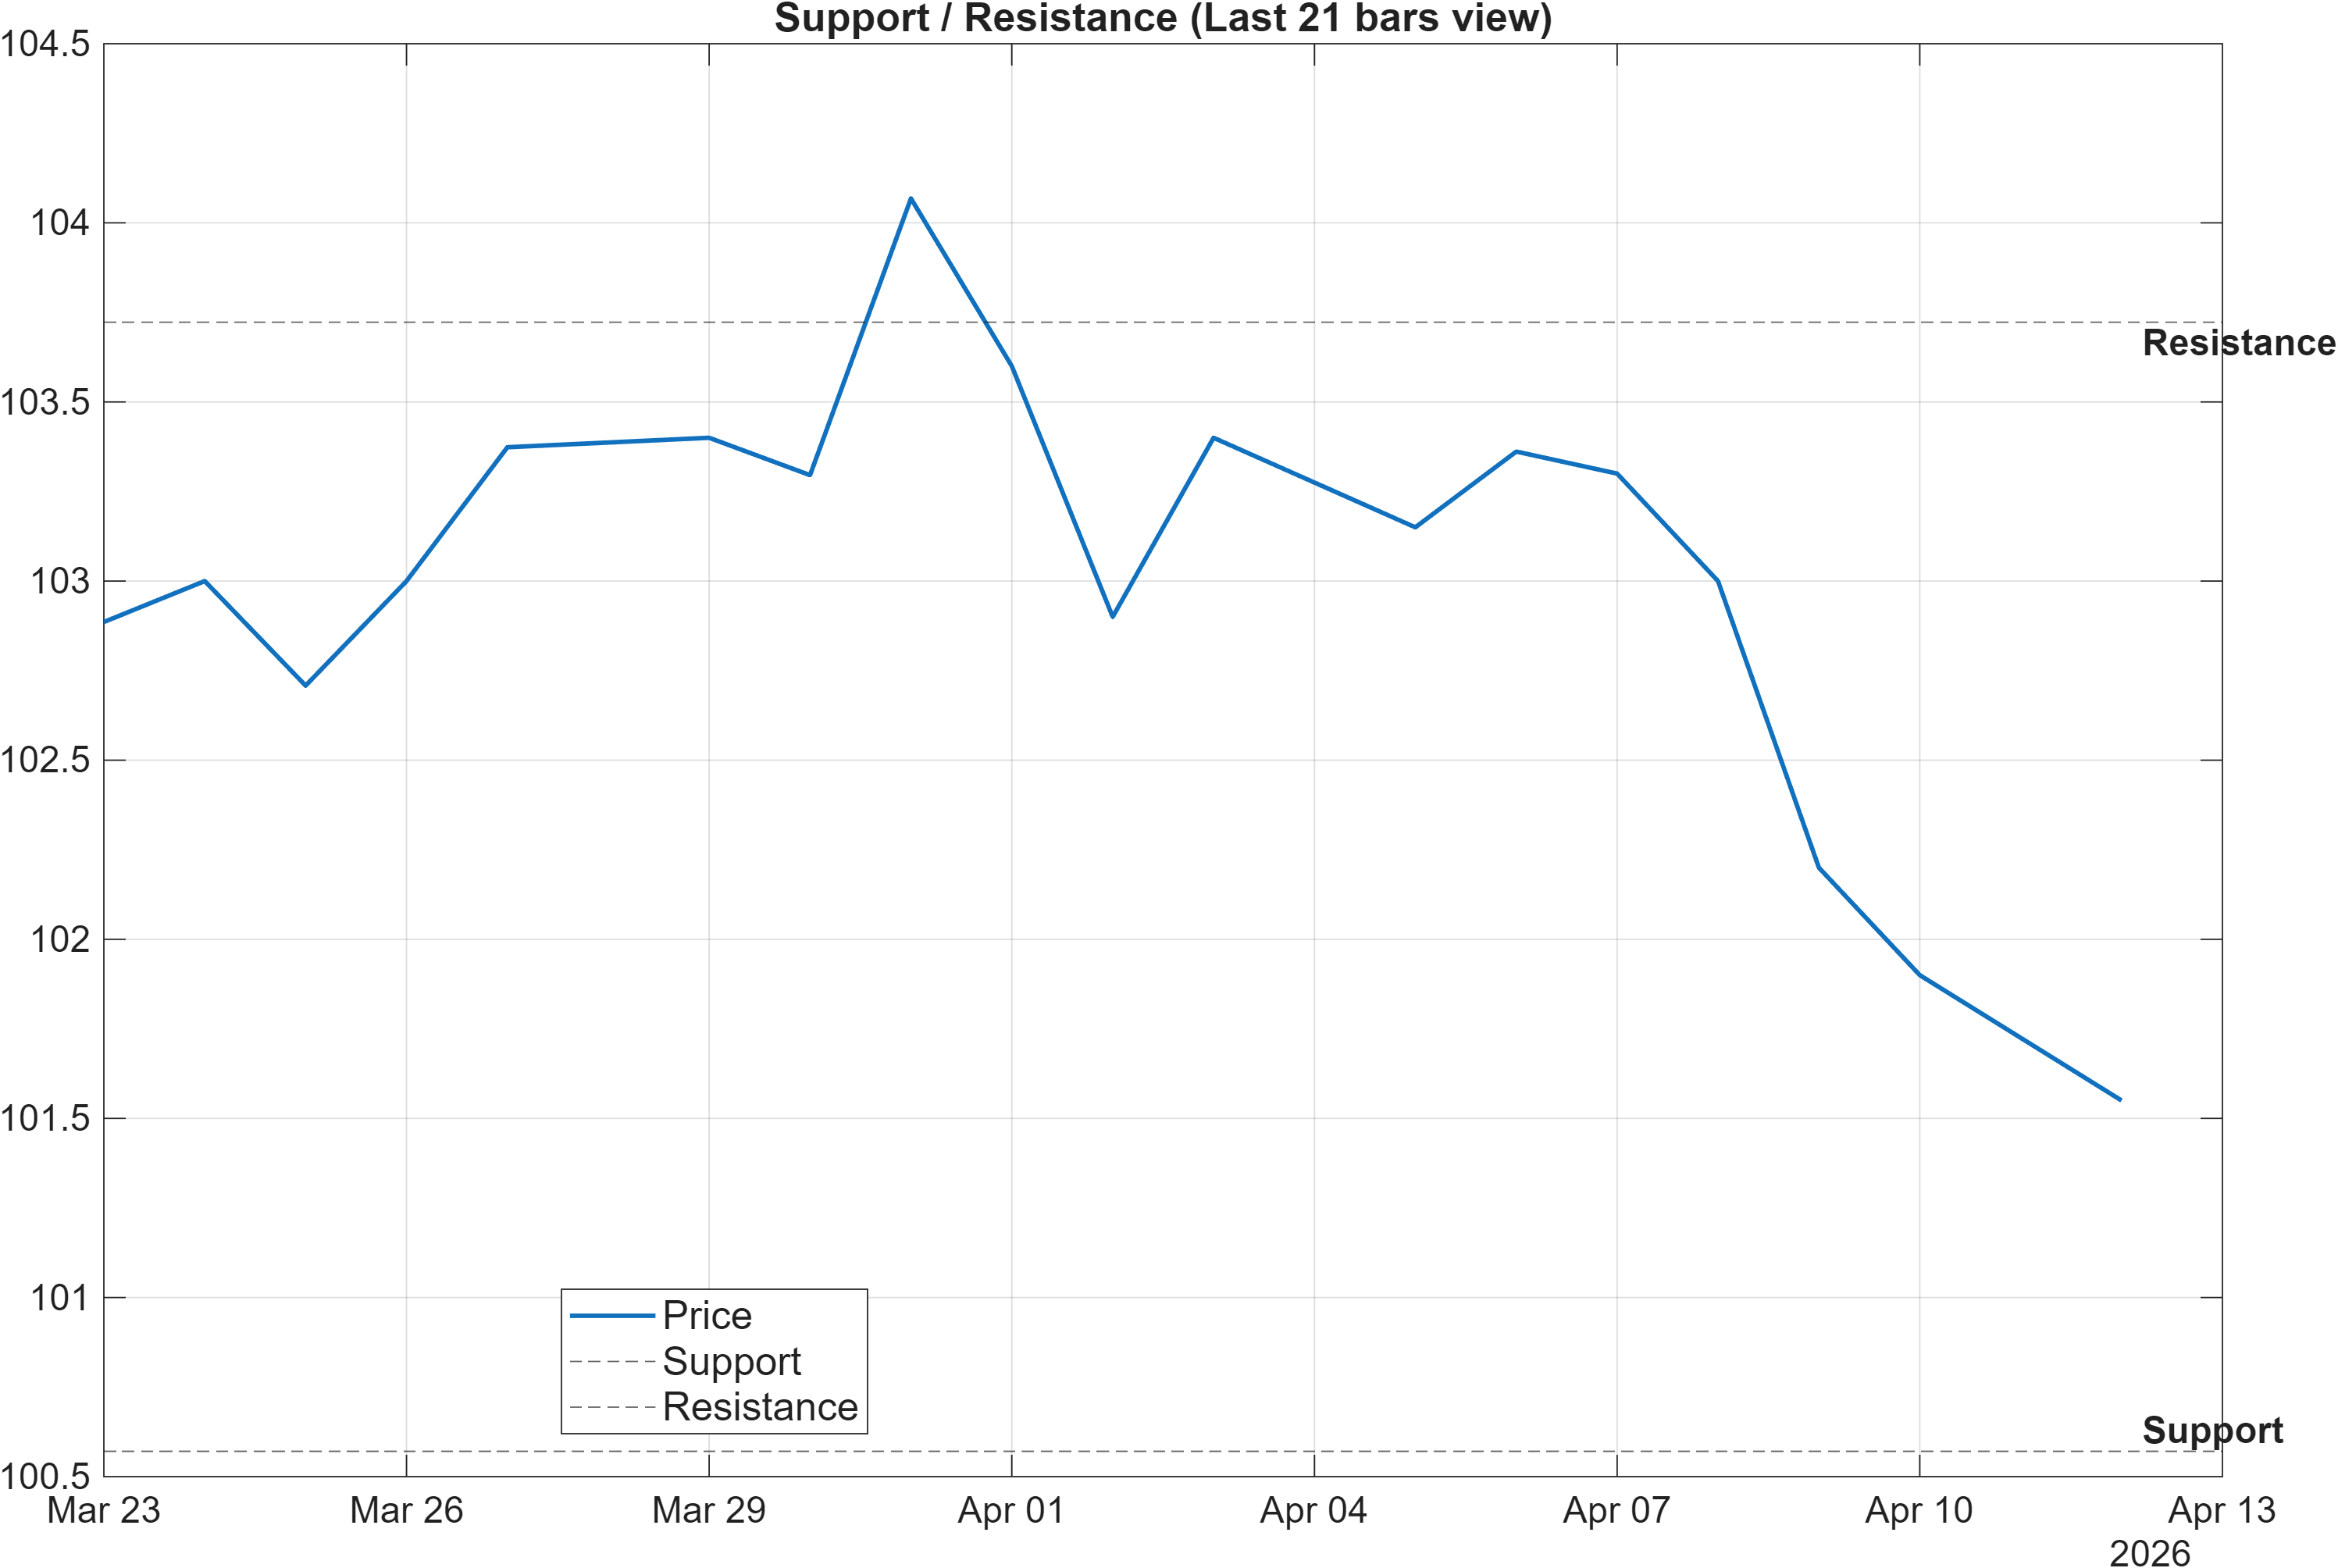
Scenario view: Break above resistance with volume → continuation. Close below support → signal deterioration risk.
Decision zones: range acceptance vs breakdown risk
The level map is clean: 100.5707 is the key support reference, and 103.7227 is the principal resistance boundary. Given the compressed volatility (bandwidth 0.0255), these zones carry more weight than usual because small directional moves can quickly translate into regime shifts in momentum readings.
On the downside, a close below 100.5707 would align with the broader weakness implied by the monthly rank (#930) and the weak DRL technical rank (#854). It would also be consistent with the momentum set where MACD histogram (-0.2171) remains negative and ROC(20) at -1.408 points to ongoing rate-of-change pressure. In that context, support is less a “floor” and more a validation checkpoint for whether the bearish profile is reasserting control.
On the upside, a successful push through 103.7227 would force a reassessment because it would better reconcile the MA50 vs MA200 bullish structure with price action and would be directionally consistent with the strong daily rank (#8) and 3-month rank (#19). Importantly, the signal dashboard shows several participation metrics sitting at Neutral (e.g., OBV slope(10) = 0; AD Line slope(10) = 0), suggesting that a breakout case benefits from clearer confirmation rather than assumption.
5) Quant Technical Dashboard (18 Signals)
KGNAI AI Technical Analysis Score (Deep Reinforcement Learning): Rank #854 out of 965 (Rank 1 represents the strongest technical positioning and a higher probability of favorable price behavior. As ranks increase toward the maximum, the probability of favorable outcomes weakens and bearish positioning becomes more dominant.) | Label: Bearish | Score: -0.770
18-Signal Technical Confluence Score: -0.222 (Neutral)
Overall Technical Score (18-signal confluence + DRL rank blend): -0.387 (Bearish)
Note: The blended score reflects signal strength weighted against broader AI technical ranking, which may temporarily diverge.
Blended technical score breakdown: -0.387 (Bearish | Bull 3 / Bear 7 / Neutral 8)
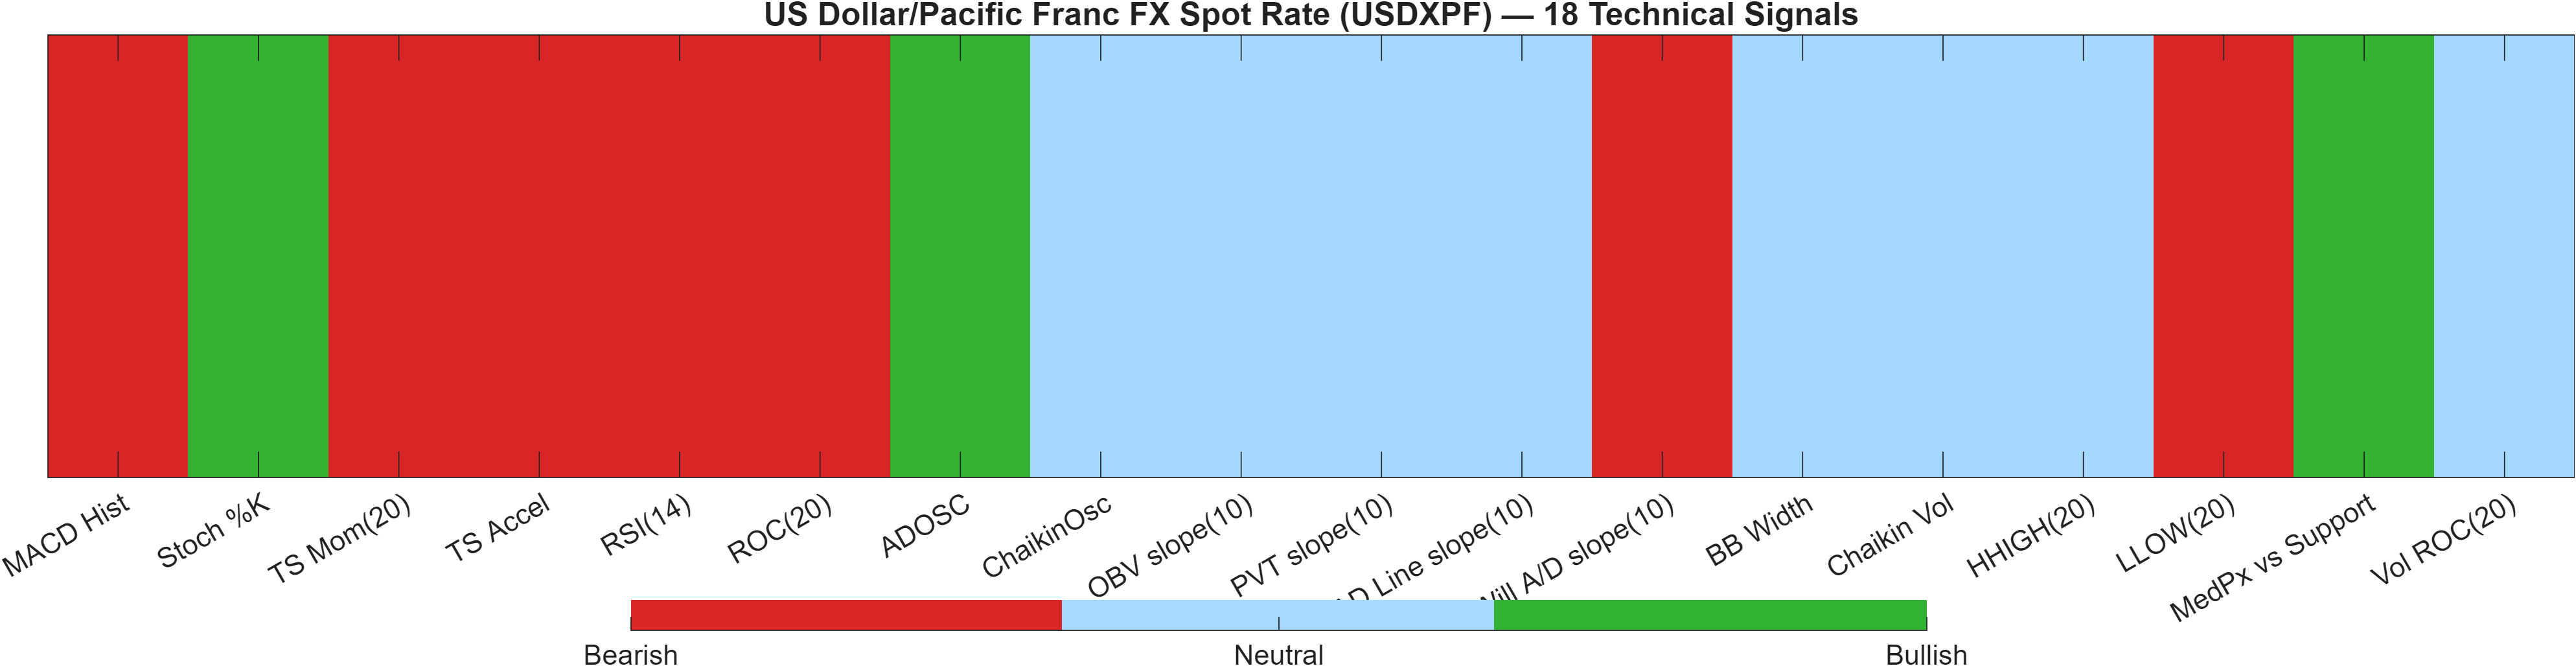
Confluence vs model rank: neutral surface signals, bearish blended conclusion
The dashboard highlights a methodical weakening rather than a one-factor breakdown. The 18-signal confluence score (-0.222) is Neutral, but the DRL technical rank (#854) and DRL score -0.770 pull the combined result to Bearish at -0.387. This is a classic “signals not fully broken, but statistical positioning weak” profile—often seen when a market is stuck below key averages and momentum remains negative, yet volatility/flow indicators are not uniformly confirming.
Internally, the bearish case is led by momentum and trend metrics: RSI(14) at 30.8, MACD histogram at -0.2171, and negative TS Mom(20) (-1.1) and TS Accel (-1.5). The counterweight is that a subset of indicators suggests short-horizon snapback potential, including Stoch %K at 7.241 (Bullish) and ADOSC at 100 (Bullish). Meanwhile, multiple participation measures register as flat (e.g., OBV slope(10) = 0; PVT slope(10) = 0), which can occur during consolidation phases and reduces conviction in either direction without a price-level resolution.
The most actionable synthesis is to treat the blended score (-0.387) as a bias, not a guarantee: a market can remain technically bearish while oscillators attempt to stabilize. With BB Width ~0.0255 still compressed, the next decisive swing is more likely to be dictated by acceptance above 103.7227 or failure through 100.5707 than by incremental changes in the neutral-heavy indicator set.
Signal table (Bull/Bear/Neutral)
| Indicator | Value | Signal |
|---|---|---|
| MACD Hist | -0.2171 | Bearish |
| Stoch %K | 7.241 | Bullish |
| TS Mom(20) | -1.1 | Bearish |
| TS Accel | -1.5 | Bearish |
| RSI(14) | 30.8 | Bearish |
| ROC(20) | -1.408 | Bearish |
| ADOSC | 100 | Bullish |
| ChaikinOsc | 0 | Neutral |
| OBV slope(10) | 0 | Neutral |
| PVT slope(10) | 0 | Neutral |
| AD Line slope(10) | 0 | Neutral |
| Will A/D slope(10) | -1 | Bearish |
| BB Width | 0.02549 | Neutral |
| Chaikin Vol | -40.97 | Neutral |
| HHIGH(20) | 104.1 | Neutral |
| LLOW(20) | 101.8 | Bearish |
| MedPx vs Support | 1.271 | Bullish |
| Vol ROC(20) | — | Neutral |
Interpretation: Indicator-level signals form the base confluence, which is then adjusted using a separate AI-driven technical ranking model. The final technical score summarizes this combined view.
6) News sentiment + extractive gist
Note: Instrument-specific news matches were not found, so the digest includes broader market/sector headlines. Links are provided for verification.
Sentiment score (avg): 0.124 | Positive: 44% | Neutral: 50% | Negative: 6%
KGNAI AI News Sentiment Score (normalized -1 to +1): Not available (as of —) | Label: Not available | Overall news score: 0.12
Positive Developments
Recent coverage across major financial outlets indicates a modestly constructive tone driven by risk-on impulses and periodic de-escalation narratives, which can weigh on USD defensiveness and support non-USD FX crosses depending on positioning. In the provided digest, broader market commentary emphasizes improving headline conditions after episodes of geopolitical stress, alongside equity stabilization. For USDXPF specifically, this backdrop matters mainly through its effect on USD demand and volatility expectations: with bandwidth at 0.0255, the market appears positioned for a tighter trading environment until a catalyst forces expansion. The sentiment distribution—44% positive and 50% neutral—supports the view that news flow is not overwhelmingly negative, even while the technical blend remains Bearish (-0.387). A constructive narrative can also help explain why the daily rank is #8 despite weak medium-horizon ranks.
Neutral / Mixed Developments
A meaningful portion of the flow is informational rather than directional, consistent with the sentiment mix and the platform note that instrument-specific matches were not found. Macro and regional updates—such as inflation and growth commentary—tend to influence FX through relative rate expectations and risk premia, but the provided data does not isolate a USDXPF-specific driver. In that setting, price tends to respect technical decision zones more cleanly. The market’s current alignment—RSI(14) at 30.8 (bearish bias) with a Neutral 18-signal confluence score (-0.222)—fits a mixed-information environment where participants require confirmation via level breaks, rather than reacting strongly to incremental headlines.
Negative / Risk Signals
Risk-oriented coverage highlights that policy sensitivity to inflation and geopolitical shocks remains elevated, which can reprice rate expectations and trigger sudden FX volatility. For USDXPF, that matters because the technical condition is already stressed: MACD histogram at -0.2171 and weak AI technical ranking (#854) suggest downside impulse has not fully cleared. If risk shocks re-emerge, support at 100.5707 becomes the key reference for whether the market is transitioning from “pressured consolidation” to a more persistent down-leg. Given the compressed bandwidth (0.0255), volatility can rise quickly once the market begins accepting below key levels—making the downside scenario potentially faster than what neutral sentiment alone would imply.
- What to monitor next: Whether USDXPF holds above 100.5707 during volatility expansion episodes.
- What to monitor next: Follow-through signs if price challenges 103.7227, given the daily rank strength (#8).
- What to monitor next: Whether momentum repair occurs (RSI lifts from 30.8) while MACD histogram (-0.2171) reduces negativity.
Sources referenced: Reuters, Bloomberg, Yahoo Finance, MarketWatch, Investing.com
Snapshot: AI Rank (Short–Mid–Long): Bearish (Bearish–Bearish–Bearish) · Technical Confluence: Neutral · Key Levels: Support ~100.57 | Resistance ~103.72 · News Sentiment: Neutral
7) Sources
- China: Inflation pressures build with energy – ING — https://www.fxstreet.com/news/china-inflation-pressures-build-with-energy-ing-202604102302
- Malaysia: Solid GDP and contained inflation – DBS — https://www.fxstreet.com/news/malaysia-solid-gdp-and-contained-inflation-dbs-202604102217
- CNY: Trade normalization and growth risks – TD Securities — https://www.fxstreet.com/news/cny-trade-normalization-and-growth-risks-td-securities-202604102148
- KRW: War risk keeps 1,450–1,550 range in focus – ING — https://www.fxstreet.com/news/krw-war-risk-keeps-1-450-1-550-range-in-focus-ing-202604102112
- Singapore: Exports boosted by electronics cycle – DBS — https://www.fxstreet.com/news/singapore-exports-boosted-by-electronics-cycle-dbs-202604102037
- AUD/USD Price Forecast: Aussie rejected at 0.7100, upside risks persist — https://www.fxstreet.com/news/aud-usd-price-forecast-rejected-at-07100-yet-upside-risks-remain-202604102015
- Fed’s Daly: If inflation stays elevated, we would hold steady — https://www.fxstreet.com/news/feds-daly-if-inflation-stays-elevated-we-would-hold-steady-202604102014
- China: Growth risks skewed to upside in Q1 – Commerzbank — https://www.fxstreet.com/news/china-growth-risks-skewed-to-upside-in-q1-commerzbank-202604102006
You may also like: How KGNAI AI ranks instruments across global markets
Disclaimer: KGNAI provides AI-generated analytics and educational market commentary only. This is not financial advice. Markets involve risk. Always do your own research.