
SIEMENS (Siemens Ltd.) — 13-Feb-2026 Technical Stance: Neutral Confluence Within a Defined Range
Siemens Ltd. (SIEMENS) currently presents a range-behavior profile in KGNAI’s multi-horizon framework, where short-term relative positioning is stronger than mid-cycle placement. Within a universe of 1214 ranked instruments, the daily rank (#67) contrasts with more moderate weekly (#399) and monthly (#506) placement, while longer-horizon ranks remain comparatively constructive (6-month #156, yearly #178). Technically, the blended view is Neutral: the 18-signal confluence score is 0.056 and the overall technical score is 0.208, consistent with mixed momentum and volume/accumulation cues. Key decision zones remain well-defined at support ~2873.1750 and resistance ~3190.0250. News flow is broadly low-friction—91% neutral and 0% negative—with a modestly positive average sentiment score (0.057) supporting a stable but confirmation-dependent setup.
- Rank stance: Short-term Neutral | Mid-term Neutral | Long-term Bullish
- Technical confluence: Neutral (18-signal confluence 0.056; overall technical score 0.208)
- Key levels: Support 2873.1750 | Resistance 3190.0250
- News sentiment bias: Neutral (avg 0.057; 9% positive, 91% neutral, 0% negative)
- Confirmation / invalidation: A sustained push above 3190.0250 with volume supports continuation; a close below 2873.1750 increases deterioration risk.
KGNAI ranks instruments by relative positioning across large market universes, emphasizing alignment across multiple independent tests rather than a single indicator. The goal is to identify where signals cluster consistently versus where readings are fragmented. Outputs describe probabilistic behavior tendencies observed historically in comparable setups—not forward certainty.
- Ranks are comparative across 1214 instruments, not absolute “buy/sell” signals.
- Confluence reflects signal agreement (18-indicator set plus a separate AI technical rank blend).
- Support/resistance are decision zones where follow-through or rejection tends to matter.
- Sentiment provides contextual bias and may diverge from price/technicals.
1) KGNAI AI Analysis
Region: INDIA
Total universe size: 1214 ranked instruments
- Daily rank: #67 out of 1214 — Bullish
- Weekly rank: #399 out of 1214 — Neutral
- Monthly rank: #506 out of 1214 — Neutral
- 3-Monthly rank: #690 out of 1214 — Neutral
- 6-Monthly rank: #156 out of 1214 — Bullish
- Yearly rank: #178 out of 1214 — Bullish
The rank stack is best read as a time-horizon spread rather than a single verdict. SIEMENS sits in the upper tier on the daily horizon (#67), yet shifts toward more average positioning on the weekly (#399) and monthly (#506) views, with the 3-month lens softer at #690. This “strong-short / softer-intermediate” pattern often coincides with range conditions where rallies can appear compelling but require follow-through through defined levels.
The longer windows remain comparatively constructive: 6-month #156 and yearly #178 indicate SIEMENS retains a stronger structural profile than much of the 1214-instrument universe. That alignment supports the idea that weakness is less likely to be purely trend-breaking without additional confirmation from price and volume behavior.
KGNAI’s stated term view—Short-term: Neutral, Mid-term: Neutral, Long-term: Bullish—fits the rank distribution: constructive longer-cycle positioning with a near-term tape that still needs confirmation. In practice, the key analytic question becomes whether near-term strength (daily) can “pull up” intermediate ranks, or whether intermediate neutrality restrains upside and keeps price oscillating between well-defined boundaries.
KGNAI ranks each instrument across large universes using multiple proprietary AI tests and statistical models (millions of data points). Lower ranks generally indicate stronger probability of favorable performance behavior, while higher ranks indicate weaker probability and more bearish positioning.
Term view: Short-term: Neutral. Mid-term: Neutral. Long-term: Bullish.
Want the full universe and complete rank tables? Unlock full access on KGNAI: https://www.kgnai.com/pricing
2) Price & trend overview
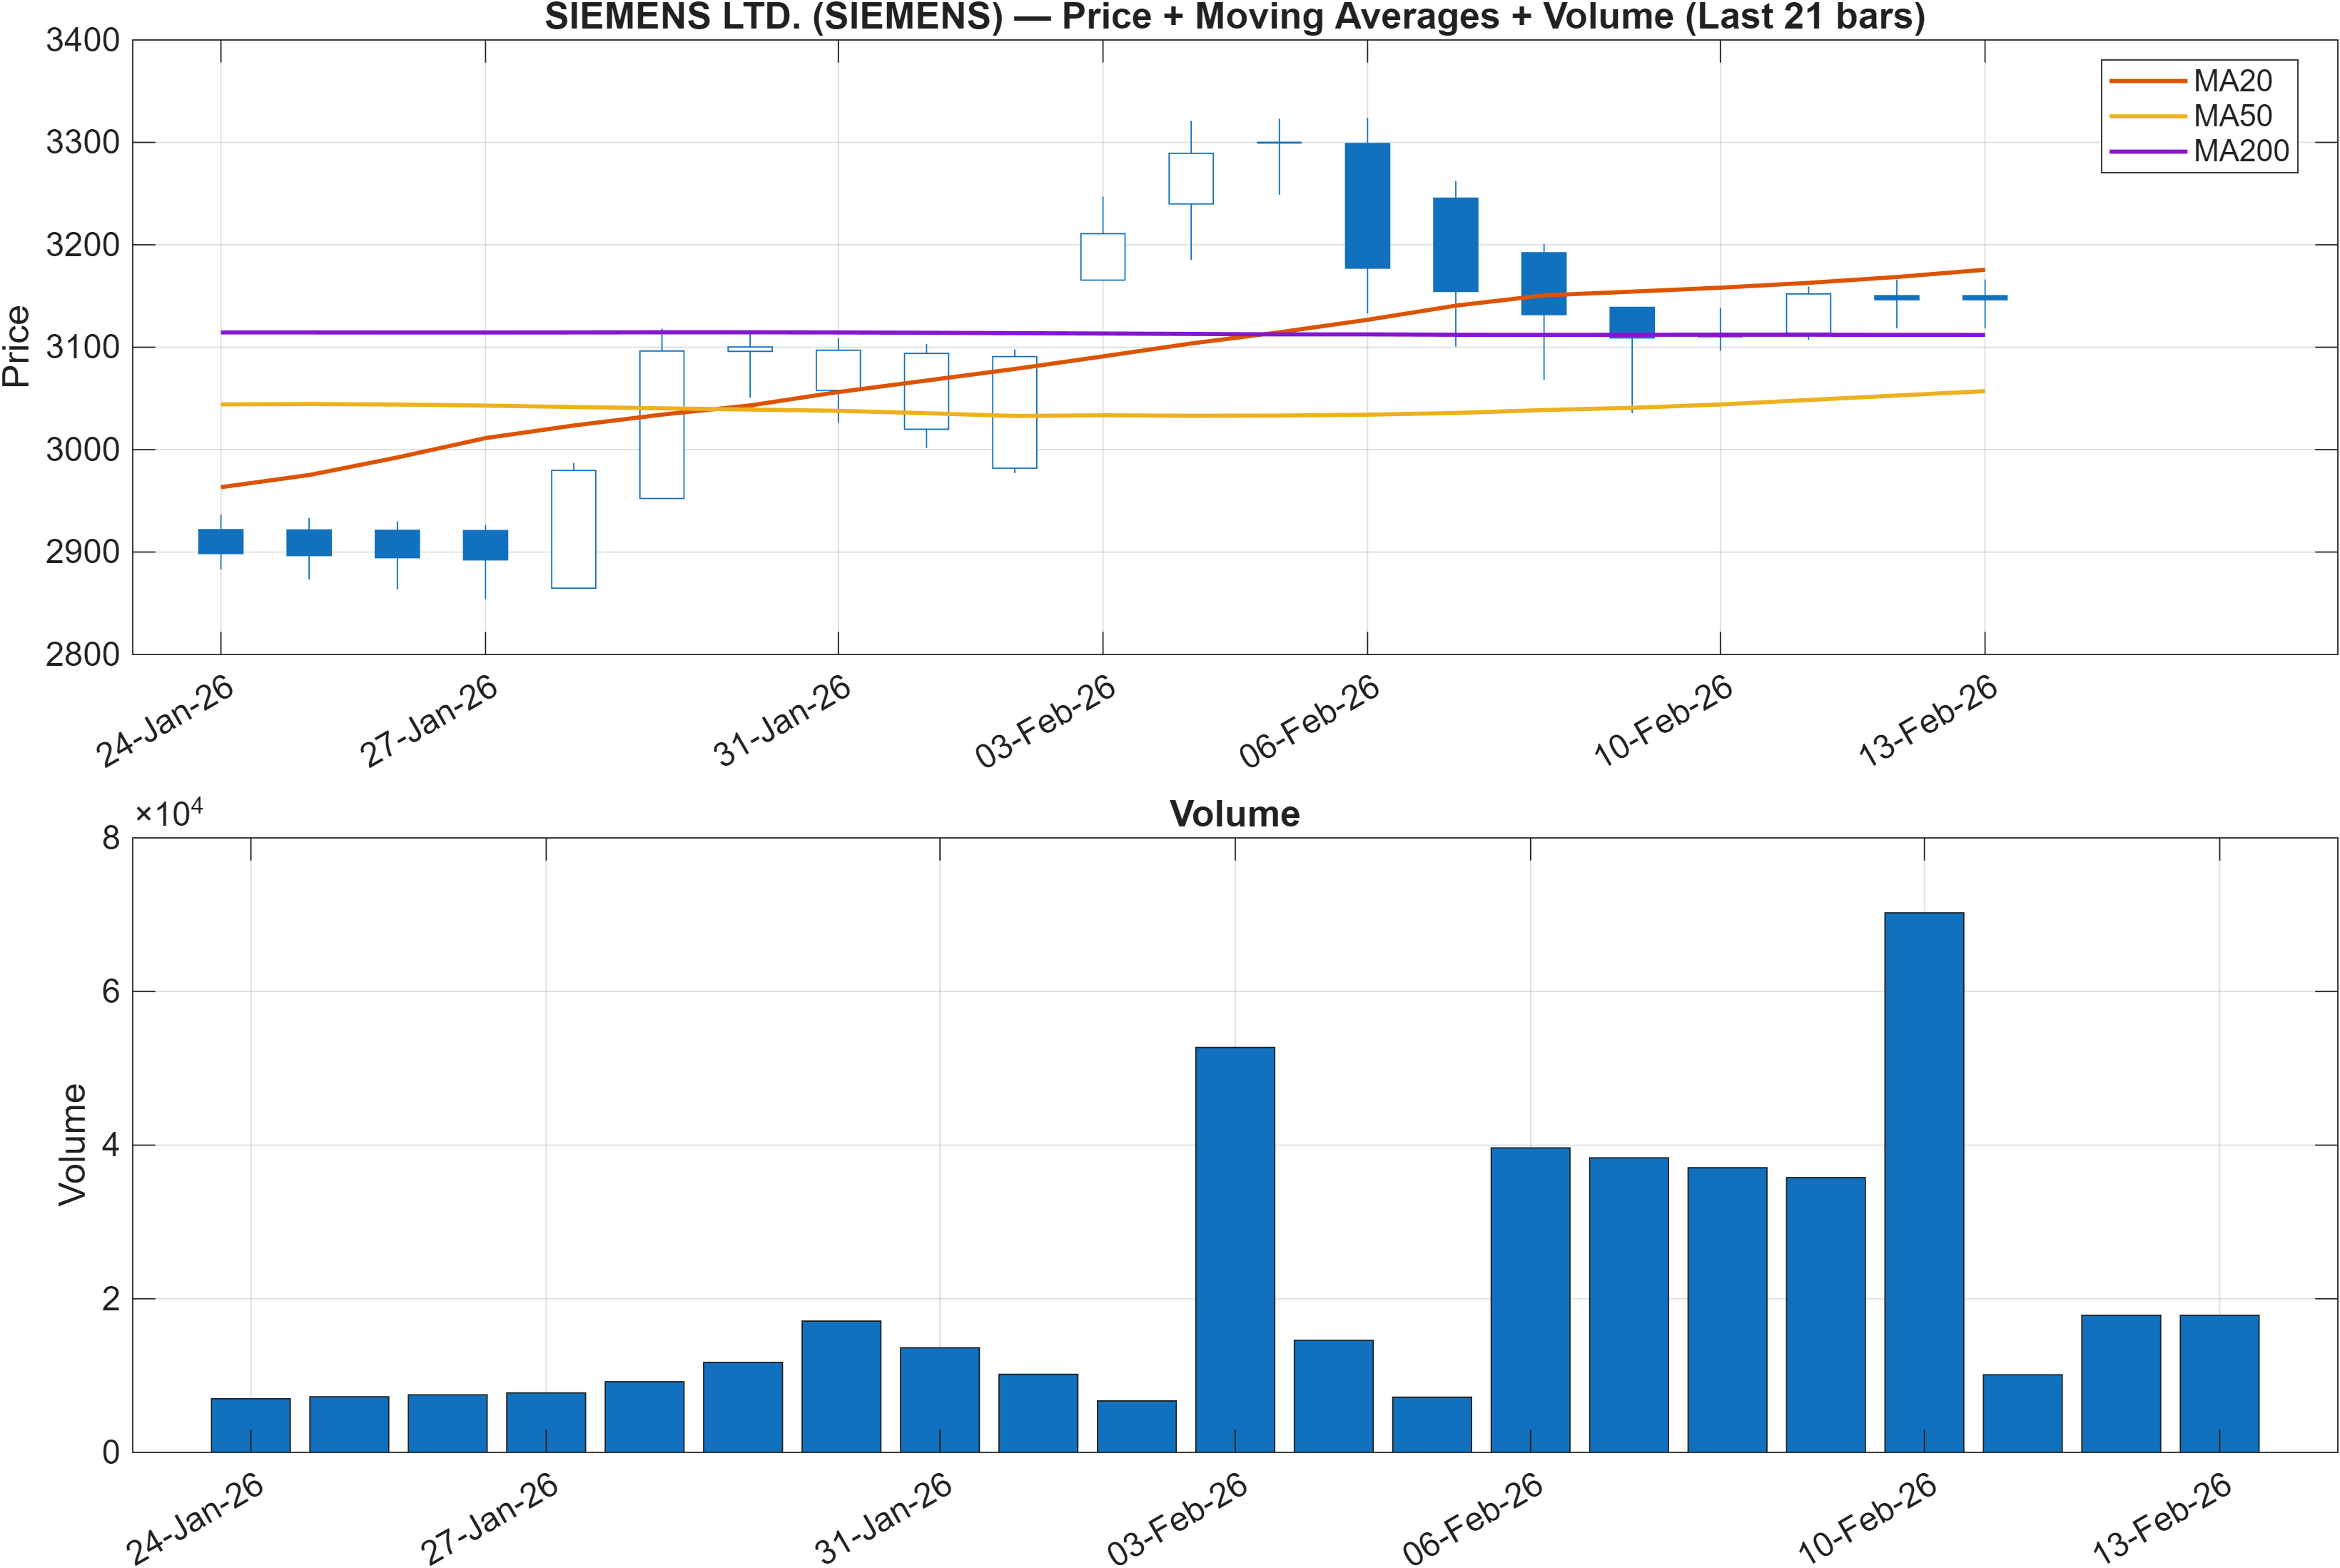
Interpretation: Close vs MA50 = Bullish, MA50 vs MA200 = Bearish.
The moving-average configuration describes a mixed trend regime. On one hand, the close relative to the MA50 is flagged Bullish, which is consistent with a market maintaining near-term lift. On the other, MA50 vs MA200 remains Bearish, a classic sign that the broader structure has not fully transitioned into a clean, sustained uptrend.
This blend often shows up when price is attempting to build a base or rotate higher inside a larger consolidation. It also aligns with the rank dispersion: a strong daily placement (#67) can occur even while weekly/monthly ranks (#399 and #506) stay neutral, because intermediate trend confirmation typically requires time above key pivots and steadier participation.
From a market-structure perspective, the setup benefits from being framed against the nearby decision zones—support ~2873.1750 and resistance ~3190.0250. When the fast trend cue (close vs MA50) is positive but the long trend cue (MA50 vs MA200) is negative, the most informative evidence tends to come from how price behaves near these levels: rejection keeps the range intact, while acceptance can start to lift intermediate ranks. Until that happens, trend-following signals and mean-reversion behavior can alternate, which is consistent with the report’s stated “range behavior” stance.
3) Momentum & volatility dashboard
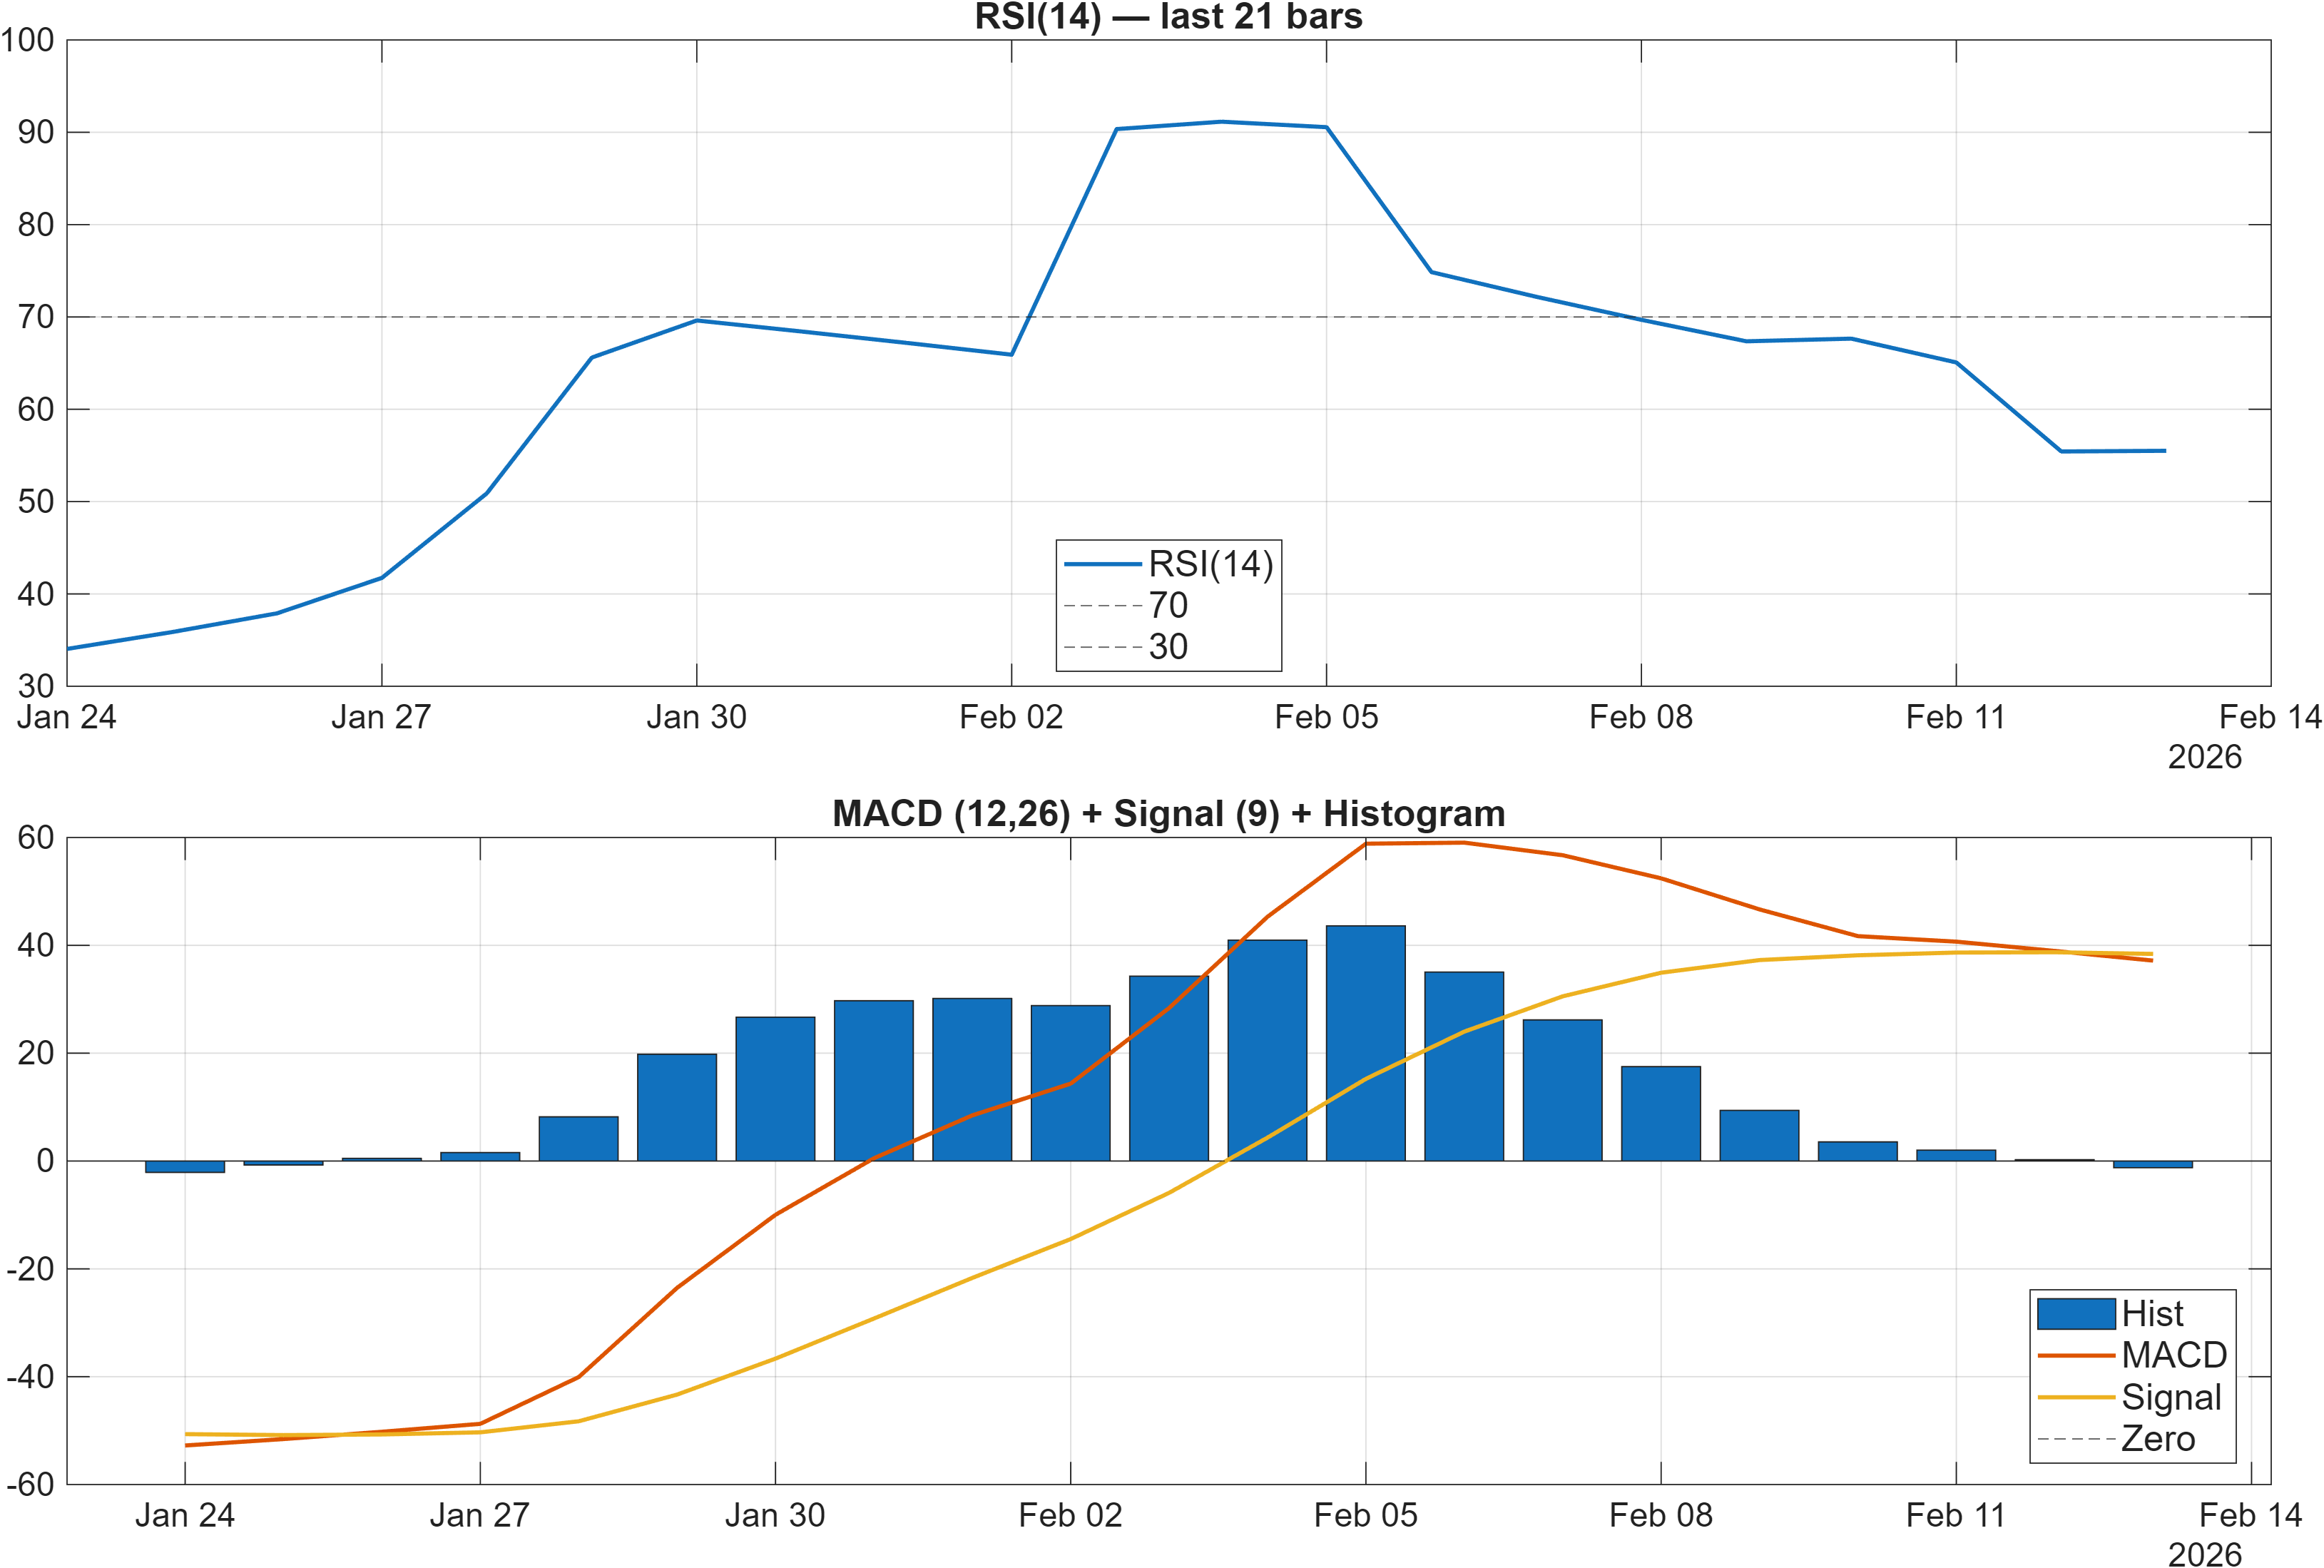
Interpretation: RSI bias = Neutral, MACD hist = -1.2423.
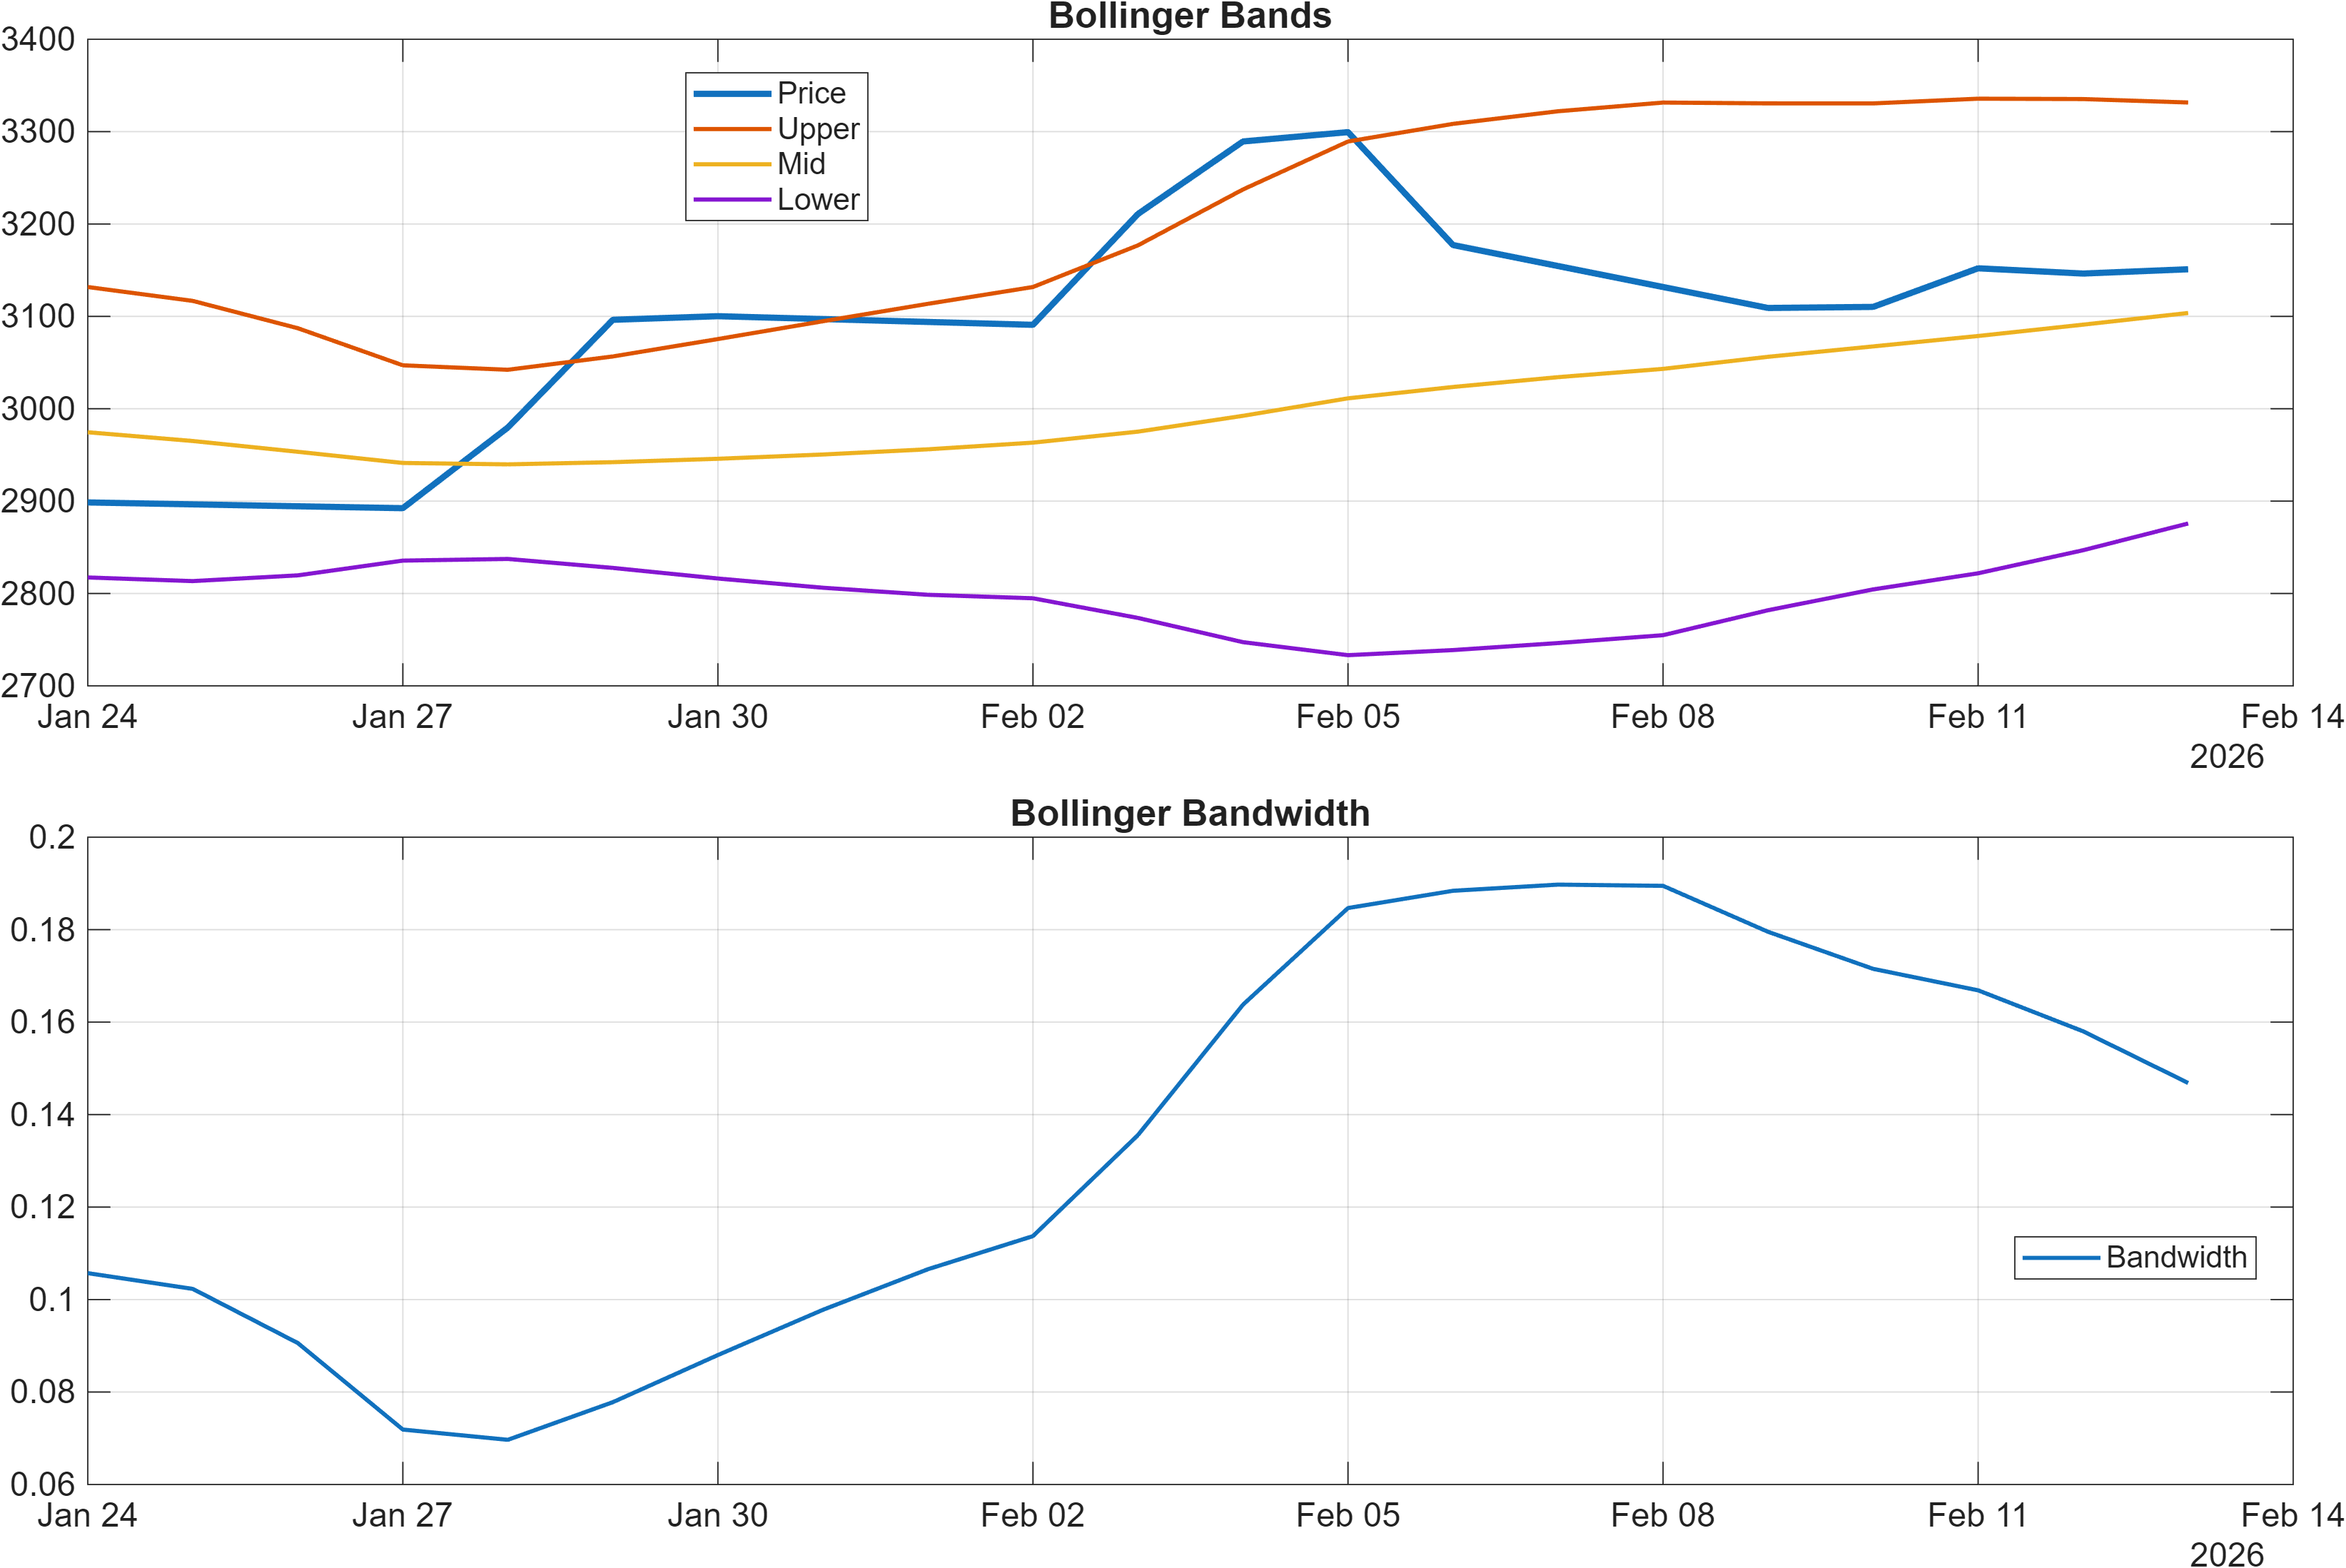
Interpretation: Bandwidth (volatility regime) latest = 0.1468.
Momentum readings lean balanced rather than directional. RSI bias is labeled Neutral, while the MACD histogram remains negative at -1.2423, suggesting upside impulses have not fully overwhelmed prior downside momentum. This is consistent with a tape that can rally in bursts but may struggle to maintain trend persistence without additional confirmation from participation and structure.
Volatility conditions appear contained: Bollinger Bandwidth is 0.1468, which typically aligns with compression-to-moderate expansion behavior rather than a high-volatility breakout state. In practical chart terms, this kind of bandwidth reading often favors more “two-sided” trading—pushes toward resistance get tested, pullbacks into support attract interest—until a catalyst or broad market shift expands the range.
Cross-checking with the multi-signal dashboard later in the report reinforces the mixed momentum message: RSI(14) is shown at 55.5 (Bullish in the signal table), while MACD Hist is still marked Bearish. When oscillators lean modestly constructive but MACD remains negative, the common failure mode is a rally that stalls before it can carry intermediate ranks (weekly/monthly) higher. The common success mode is a steady sequence of higher closes that flips MACD/participation signals while keeping RSI supported—an outcome that would typically show up as improvement in the overall technical score (currently 0.208, Neutral).
4) Support / Resistance zones
Support ~ 2873.1750 | Resistance ~ 3190.0250
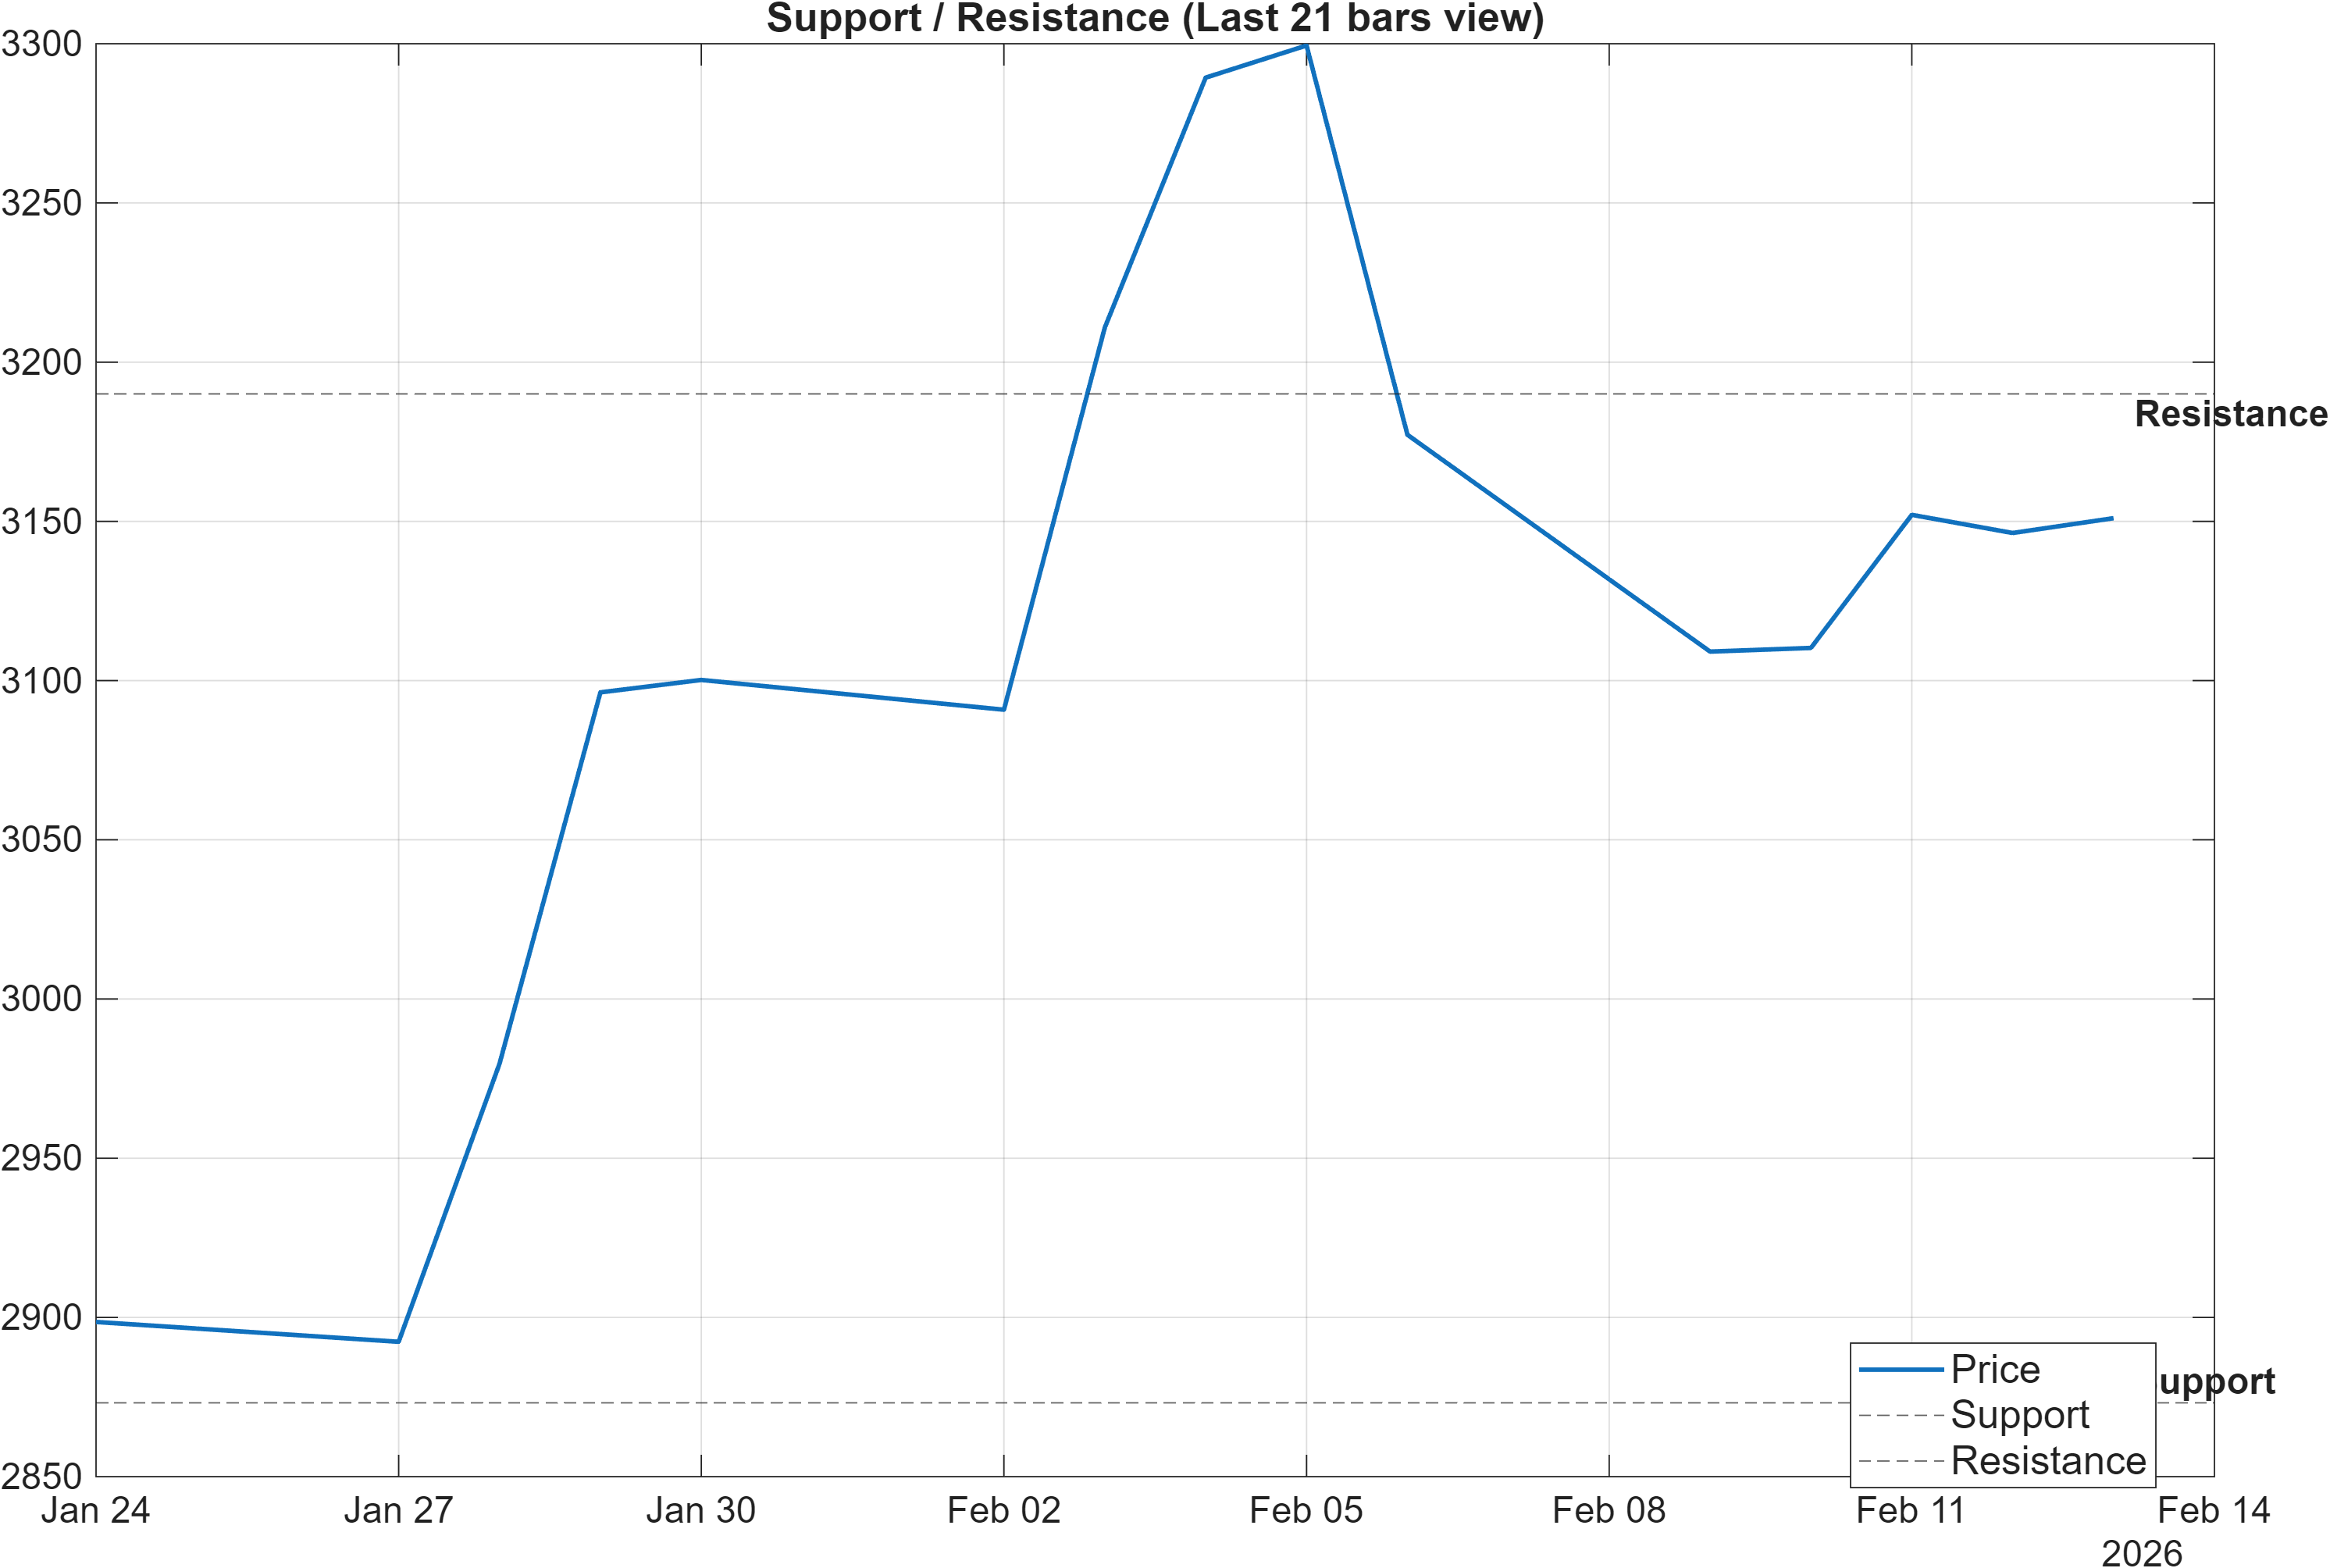
Scenario view: Break above resistance with volume → continuation. Close below support → signal deterioration risk.
The current structure is anchored by two clearly defined decision zones: 2873.1750 as support and 3190.0250 as resistance. With trend signals mixed (close vs MA50 bullish, MA50 vs MA200 bearish), these levels become the most direct way to separate rotation within a range from regime change.
A constructive sequence typically requires acceptance above resistance—specifically, a break above 3190.0250 supported by volume—because that is where “range sellers” tend to be forced to cover and where intermediate models may begin to re-rate. Conversely, a close below 2873.1750 raises the probability that the market is not merely retracing within the range but is transitioning into weaker positioning, which would likely show up as deterioration in the already-neutral intermediate ranks (e.g., weekly #399, monthly #506).
Additional context comes from the indicator-defined 20-day bounds embedded in the signal set: HHIGH(20) = 3324 and LLOW(20) = 2854. These values sit near, and slightly beyond, the primary resistance/support zones, reinforcing the idea that SIEMENS is operating in a contained band where price often oscillates between “known” liquidity pockets. In a range regime, false breaks are common; therefore, confirmation is less about a single intraday push and more about follow-through behavior (closing location, repeat tests, and participation). That framing aligns with the report’s Neutral confluence stance and encourages disciplined level-based interpretation.
5) Quant Technical Dashboard (18 Signals)
KGNAI AI Technical Analysis Score (Deep Reinforcement Learning): Rank #265 out of 1214 (Rank 1 represents the strongest technical positioning and a higher probability of favorable price behavior. As ranks increase toward the maximum, the probability of favorable outcomes weakens and bearish positioning becomes more dominant.) | Label: Neutral | Score: 0.563
18-Signal Technical Confluence Score: 0.056 (Neutral)
Overall Technical Score (18-signal confluence + DRL rank blend): 0.208 (Neutral)
Note: The blended score reflects signal strength weighted against broader AI technical ranking, which may temporarily diverge.
Blended technical score breakdown: 0.208 (Neutral | Bull 7 / Bear 6 / Neutral 5)
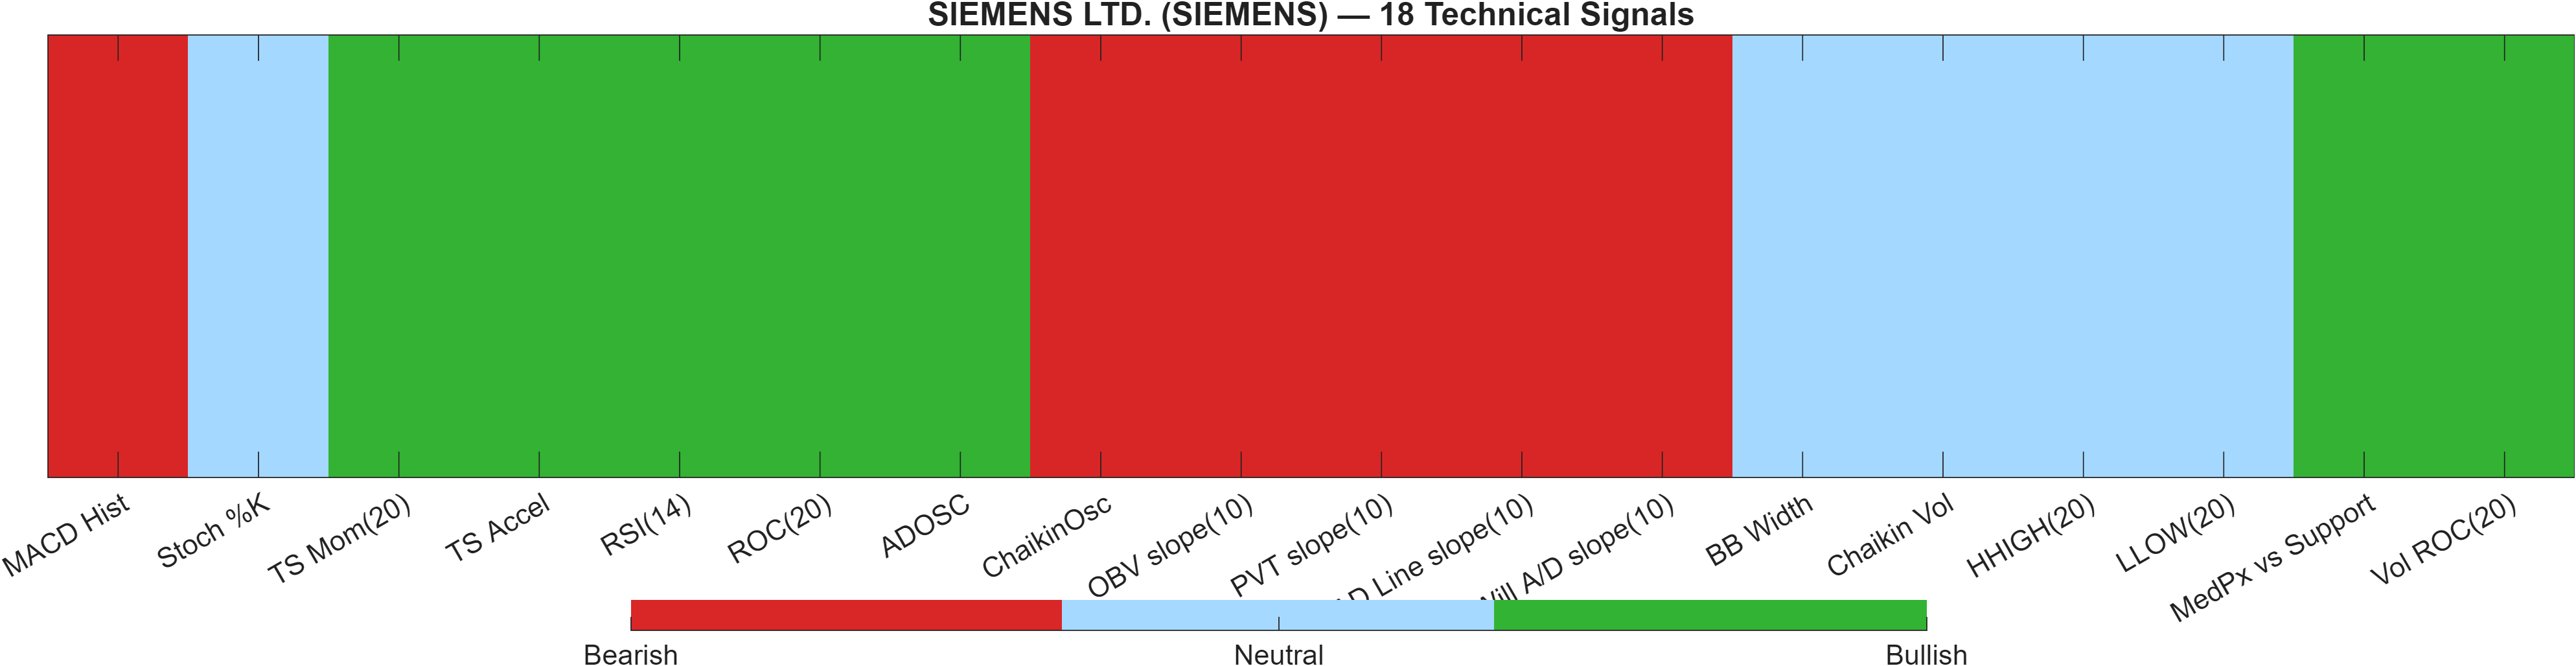
Signal table (Bull/Bear/Neutral)
| Indicator | Value | Signal |
|---|---|---|
| MACD Hist | -1.242 | Bearish |
| Stoch %K | 38.37 | Neutral |
| TS Mom(20) | 249.8 | Bullish |
| TS Accel | 481.3 | Bullish |
| RSI(14) | 55.5 | Bullish |
| ROC(20) | 8.786 | Bullish |
| ADOSC | 45.85 | Bullish |
| ChaikinOsc | -1639 | Bearish |
| OBV slope(10) | -6.655e+04 | Bearish |
| PVT slope(10) | -1760 | Bearish |
| AD Line slope(10) | -2.097e+04 | Bearish |
| Will A/D slope(10) | -159.8 | Bearish |
| BB Width | 0.1468 | Neutral |
| Chaikin Vol | -20.56 | Neutral |
| HHIGH(20) | 3324 | Neutral |
| LLOW(20) | 2854 | Neutral |
| MedPx vs Support | 269 | Bullish |
| Vol ROC(20) | 146.7 | Bullish |
Interpretation: Indicator-level signals form the base confluence, which is then adjusted using a separate AI-driven technical ranking model. The final technical score summarizes this combined view.
The technical dashboard quantifies the report’s central theme: mixed evidence with a Neutral net result. The Deep Reinforcement Learning technical rank is #265 out of 1214 with a score of 0.563 (Neutral), while the 18-signal layer reports a low but positive confluence score of 0.056. Blended together, the overall technical score is 0.208, also Neutral—suggesting neither a high-conviction trend-following profile nor a clearly deteriorating structure.
Internally, the heatmap mix matters: the breakdown shows Bull 7 / Bear 6 / Neutral 5, which is close to balanced. The bullish side is supported by momentum and activity measures such as RSI(14) = 55.5, ROC(20) = 8.786, and Vol ROC(20) = 146.7. At the same time, multiple accumulation/distribution slopes are bearish—e.g., OBV slope(10) = -6.655e+04 and ChaikinOsc = -1639—which often indicates participation is not uniformly reinforcing the price swing.
In a range environment, that divergence is common: price momentum can look acceptable while underlying “flow” measures remain hesitant. If SIEMENS is to transition from Neutral confluence toward clearer strength, the market typically needs these bearish participation signals to stabilize while maintaining volatility control (BB Width 0.1468) and holding above key structure zones. Absent that, the dashboard supports a more tactical, level-driven interpretation rather than assuming trend persistence.
6) News sentiment + extractive gist
Sentiment score (avg): 0.057 | Positive: 9% | Neutral: 91% | Negative: 0%
KGNAI AI News Sentiment Score (normalized -1 to +1): 1.00 (as of 2025-09-26) | Label: Bullish | Overall news score: 1.00
Positive Developments
Recent coverage across major financial outlets indicates a low-friction news backdrop for the name, with the distribution skewing overwhelmingly neutral (91%) and a small positive share (9%) alongside 0% negative in the provided snapshot. The average sentiment score of 0.057 reinforces that the tone is mildly constructive rather than emphatic. Company-related disclosures referenced in the provided material are largely administrative and governance-oriented, including updates around directors/key managerial personnel and auditors. In sentiment-driven models, this type of information tends to reduce uncertainty when it is routine and clearly communicated, supporting steadier trading conditions. Taken together with the long-horizon ranks (e.g., 6-month #156, yearly #178), the sentiment bias is consistent with a market that is not currently reacting to strongly adverse narrative pressure.
Neutral / Mixed Developments
The dominant feature of the news tape is neutrality, which is visible both in the 91% neutral classification and the absence of a negative share in the provided sentiment breakdown. Items referenced in the base content appear to repeat similar disclosure themes (management/auditor-related updates), suggesting information flow that is material for compliance but not necessarily directional for near-term price discovery. This kind of neutral-heavy environment often shifts the burden of evidence back to technical confirmation—particularly around the defined boundaries at 2873.1750 and 3190.0250—because catalysts are not clearly dominating the tape. The normalized KGNAI news sentiment score is shown as 1.00 (Bullish) as of 2025-09-26, which may reflect the model’s normalization rather than a continuously updated real-time reading in this snapshot.
Negative / Risk Signals
While the provided sentiment mix reports 0% negative, the risk lens still matters because governance and disclosure items can become market-relevant depending on context. The base content includes references to changes in directors/key managerial personnel and auditors, as well as a regulatory disclosure update. In isolation these are not quantified as negative in the snapshot, yet markets sometimes treat repeated governance-related updates as a monitoring item when they coincide with technical fragility. Here, the technical posture is already mixed—MACD histogram is -1.2423 and several participation indicators (e.g., OBV slope) are bearish—so any shift in narrative tone could interact with price’s proximity to 2873.1750. Risk, therefore, is less about the current classification and more about whether future releases introduce ambiguity that coincides with a loss of structural support.
- Whether price acceptance develops above 3190.0250 alongside improved participation signals (e.g., OBV/PVT slope stabilization).
- Any shift away from the current 91% neutral news mix that coincides with volatility expansion (BB Width moving away from 0.1468).
- Downside behavior on a test of 2873.1750, especially if intermediate ranks remain neutral (weekly #399, monthly #506).
Sources referenced: Reuters, Bloomberg, Yahoo Finance, MarketWatch, Investing.com
Snapshot: AI Rank (Short–Mid–Long): Mixed (Neutral–Neutral–Bullish) · Technical Confluence: Neutral · Key Levels: Support ~2873.18 | Resistance ~3190.03 · News Sentiment: Neutral
7) Sources
- Siemens Energy India Limited — https://nsearchives.nseindia.com/corporate/xbrl/CIM_79276_1625770_13022026094813_WEB.xml
- Siemens Energy India Limited — https://nsearchives.nseindia.com/corporate/ENRIN_13022026213651_AGMProceedings13022026.pdf
- Siemens Limited — https://nsearchives.nseindia.com/corporate/SiemensRaj_13022026213629_SEBI_Disclosure_-_Lemon_-_CCI_Approval.pdf
- Siemens Energy India Limited — https://nsearchives.nseindia.com/corporate/ENRIN_13022026212628_AGMProceedings13022026.pdf
- Siemens Energy India Limited — https://nsearchives.nseindia.com/corporate/ENRIN_13022026211841_Reg44VRScrutinizersReport.pdf
- Siemens Energy India Limited — https://nsearchives.nseindia.com/corporate/xbrl/CIM_79219_1625238_13022026053459_WEB.xml
- Siemens Energy India Limited — https://nsearchives.nseindia.com/corporate/ENRIN_13022026143539_BMOutcome13022026.pdf
- Siemens Energy India Limited — https://nsearchives.nseindia.com/corporate/ENRIN_13022026140225_BMOutcome13022026.pdf
You may also like: How KGNAI AI ranks instruments across global markets
Disclaimer: KGNAI provides AI-generated analytics and educational market commentary only. This is not financial advice. Markets involve risk. Always do your own research.