
MISHTANN (Mishtann Foods Ltd) Technical & Sentiment Report — 15-Feb-2026 (Neutral-to-Bullish Long-Term Bias)
Mishtann Foods Ltd (MISHTANN) screens as a neutral near-term setup with a more constructive profile further out on the curve. In KGNAI’s 1214-instrument India universe, the Daily rank #456 and Weekly rank #630 sit in the middle of the pack, while the Monthly rank #884 falls into the weaker half—suggesting shorter-horizon momentum is not fully confirmed. In contrast, longer horizons remain notably stronger, with a 6-Monthly rank #1 and Yearly rank #21, indicating MISHTANN has historically aligned with favorable long-run behavior in the model. Technically, the 18-signal confluence score is 0.111 (Neutral) and the overall blended technical score is 0.250 (Neutral), reflecting mixed signal agreement: Bull 8 / Bear 6 / Neutral 4. Key decision zones are clearly defined at Support ~4.2617 and Resistance ~5.0367, while broad news sentiment registers 0.000 with a predominantly neutral distribution.
Key Takeaways
- Short / Mid / Long stance: Neutral / Neutral / Bullish (per KGNAI term view)
- Technical confluence label: Neutral (18-signal confluence 0.111; blended technical score 0.250)
- Key levels: Support ~ 4.2617 | Resistance ~ 5.0367
- News sentiment bias: Neutral (avg 0.000; 19% positive / 63% neutral / 19% negative)
- Confirmation / invalidation: A sustained move above 5.0367 supports continuation conditions; a close below 4.2617 increases deterioration risk
What KGNAI Measures
KGNAI ranks instruments relatively within large universes, combining multiple tests that evaluate positioning, trend/momentum structure, and cross-signal agreement. Outputs are designed to behave probabilistically across regimes and avoid single-indicator dependency. The result is a comparative view of where MISHTANN sits versus peers at multiple horizons.
How to Read This Report
- Ranks are comparative within the stated universe, not absolute forecasts
- Confluence summarizes agreement across indicators (divergence lowers conviction)
- Support/resistance are decision zones, not precise turning points
- Sentiment adds context; it does not override price/volume structure
KGNAI Signal + Technical Snapshot + News Sentiment Digest
As of: 15-Feb-2026
Ticker: MISHTANN
1) KGNAI AI Analysis
Region: INDIA
Total universe size: 1214 ranked instruments
- Daily rank: #456 out of 1214 — Neutral
- Weekly rank: #630 out of 1214 — Neutral
- Monthly rank: #884 out of 1214 — Neutral
- 3-Monthly rank: #244 out of 1214 — Neutral
- 6-Monthly rank: #1 out of 1214 — Bullish
- Yearly rank: #21 out of 1214 — Bullish
KGNAI ranks each instrument across large universes using multiple proprietary AI tests and statistical models (millions of data points). Lower ranks generally indicate stronger probability of favorable performance behavior, while higher ranks indicate weaker probability and more bearish positioning.
Cross-horizon alignment: neutral near-term, bullish long-term
The ranking curve shows a clear split: shorter horizons lean neutral (e.g., #456 daily and #630 weekly), while longer horizons are materially stronger (notably #1 at 6-month and #21 yearly). This pattern is commonly associated with trend persistence at higher timeframes alongside short-term consolidation or re-rating pressure.
The 3-Monthly rank #244 adds an intermediate anchor that is better than the daily/weekly but still not as extreme as the 6-month and yearly readings. Taken together, the model is not treating MISHTANN as a short-horizon momentum leader; rather, it is flagging a structure where timeframe selection matters. In this type of profile, confirmation typically comes from price reclaiming key resistance while breadth/volume indicators stabilize; absent that, short-horizon ranks can remain range-bound even when long-horizon ranks stay constructive.
Term view: Short-term: Neutral. Mid-term: Neutral. Long-term: Bullish.
Want the full universe and complete rank tables? Unlock full access on KGNAI: https://www.kgnai.com/pricing
2) Price & trend overview
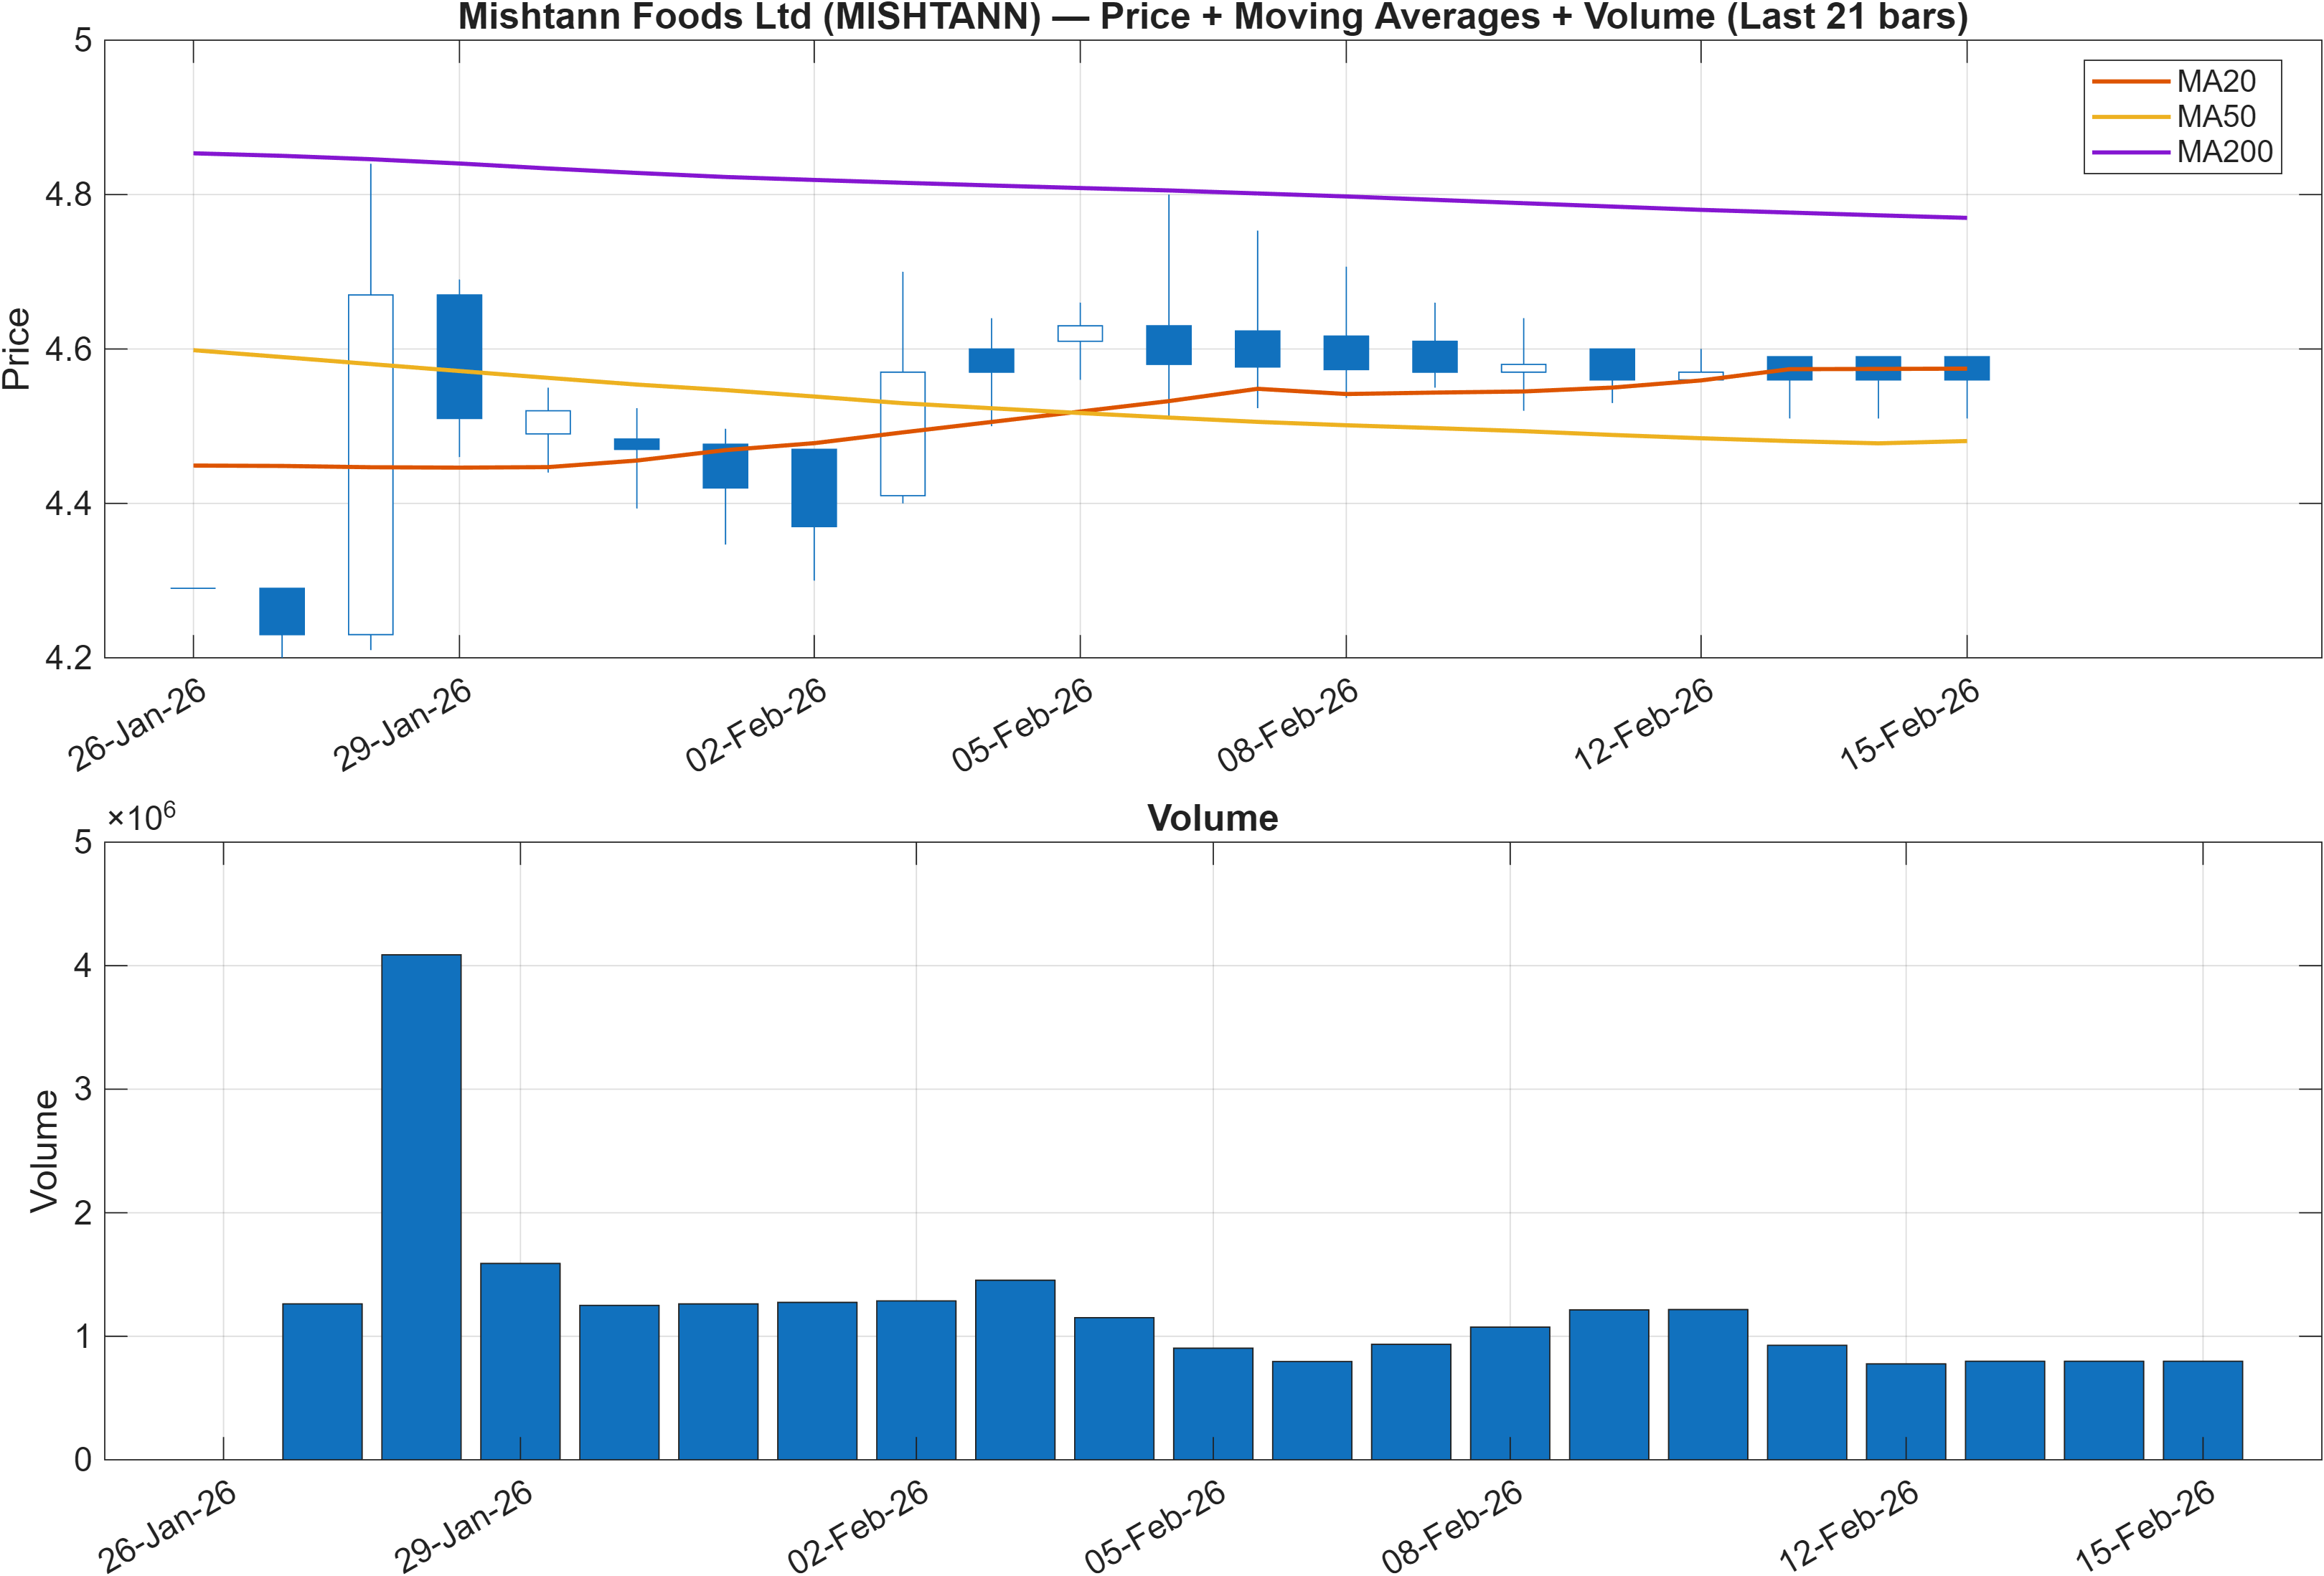
Interpretation: Close vs MA50 = Bullish, MA50 vs MA200 = Bearish.
Trend state: short-term strength, longer-term friction
MISHTANN’s trend read is explicitly mixed: Close vs MA50 = Bullish points to near-term price behavior holding above a commonly watched intermediate average, but MA50 vs MA200 = Bearish suggests the longer moving-average structure has not fully repaired. This combination often coincides with a recovery phase where price is improving but the broader trend filter remains cautious.
From a market-structure perspective, this is a regime where follow-through typically depends on whether price can sustain strength into overhead supply zones. That framing matches the nearby level map used later in this report (Resistance ~5.0367), where a decisive reclaim can support continuation conditions. On the other hand, if the move above the MA50 proves temporary, risk tends to express first through a drift back toward the nearest support decision band (Support ~4.2617).
The rank curve reinforces this trend interpretation: shorter-horizon ranks remain neutral (Daily #456, Weekly #630), consistent with a chart that has improved but is still working through longer-term constraints. This creates a practical “wait-for-resolution” setup where trend confirmation is more likely to come from level acceptance (holding above resistance) rather than from a single-day impulse.
3) Momentum & volatility dashboard
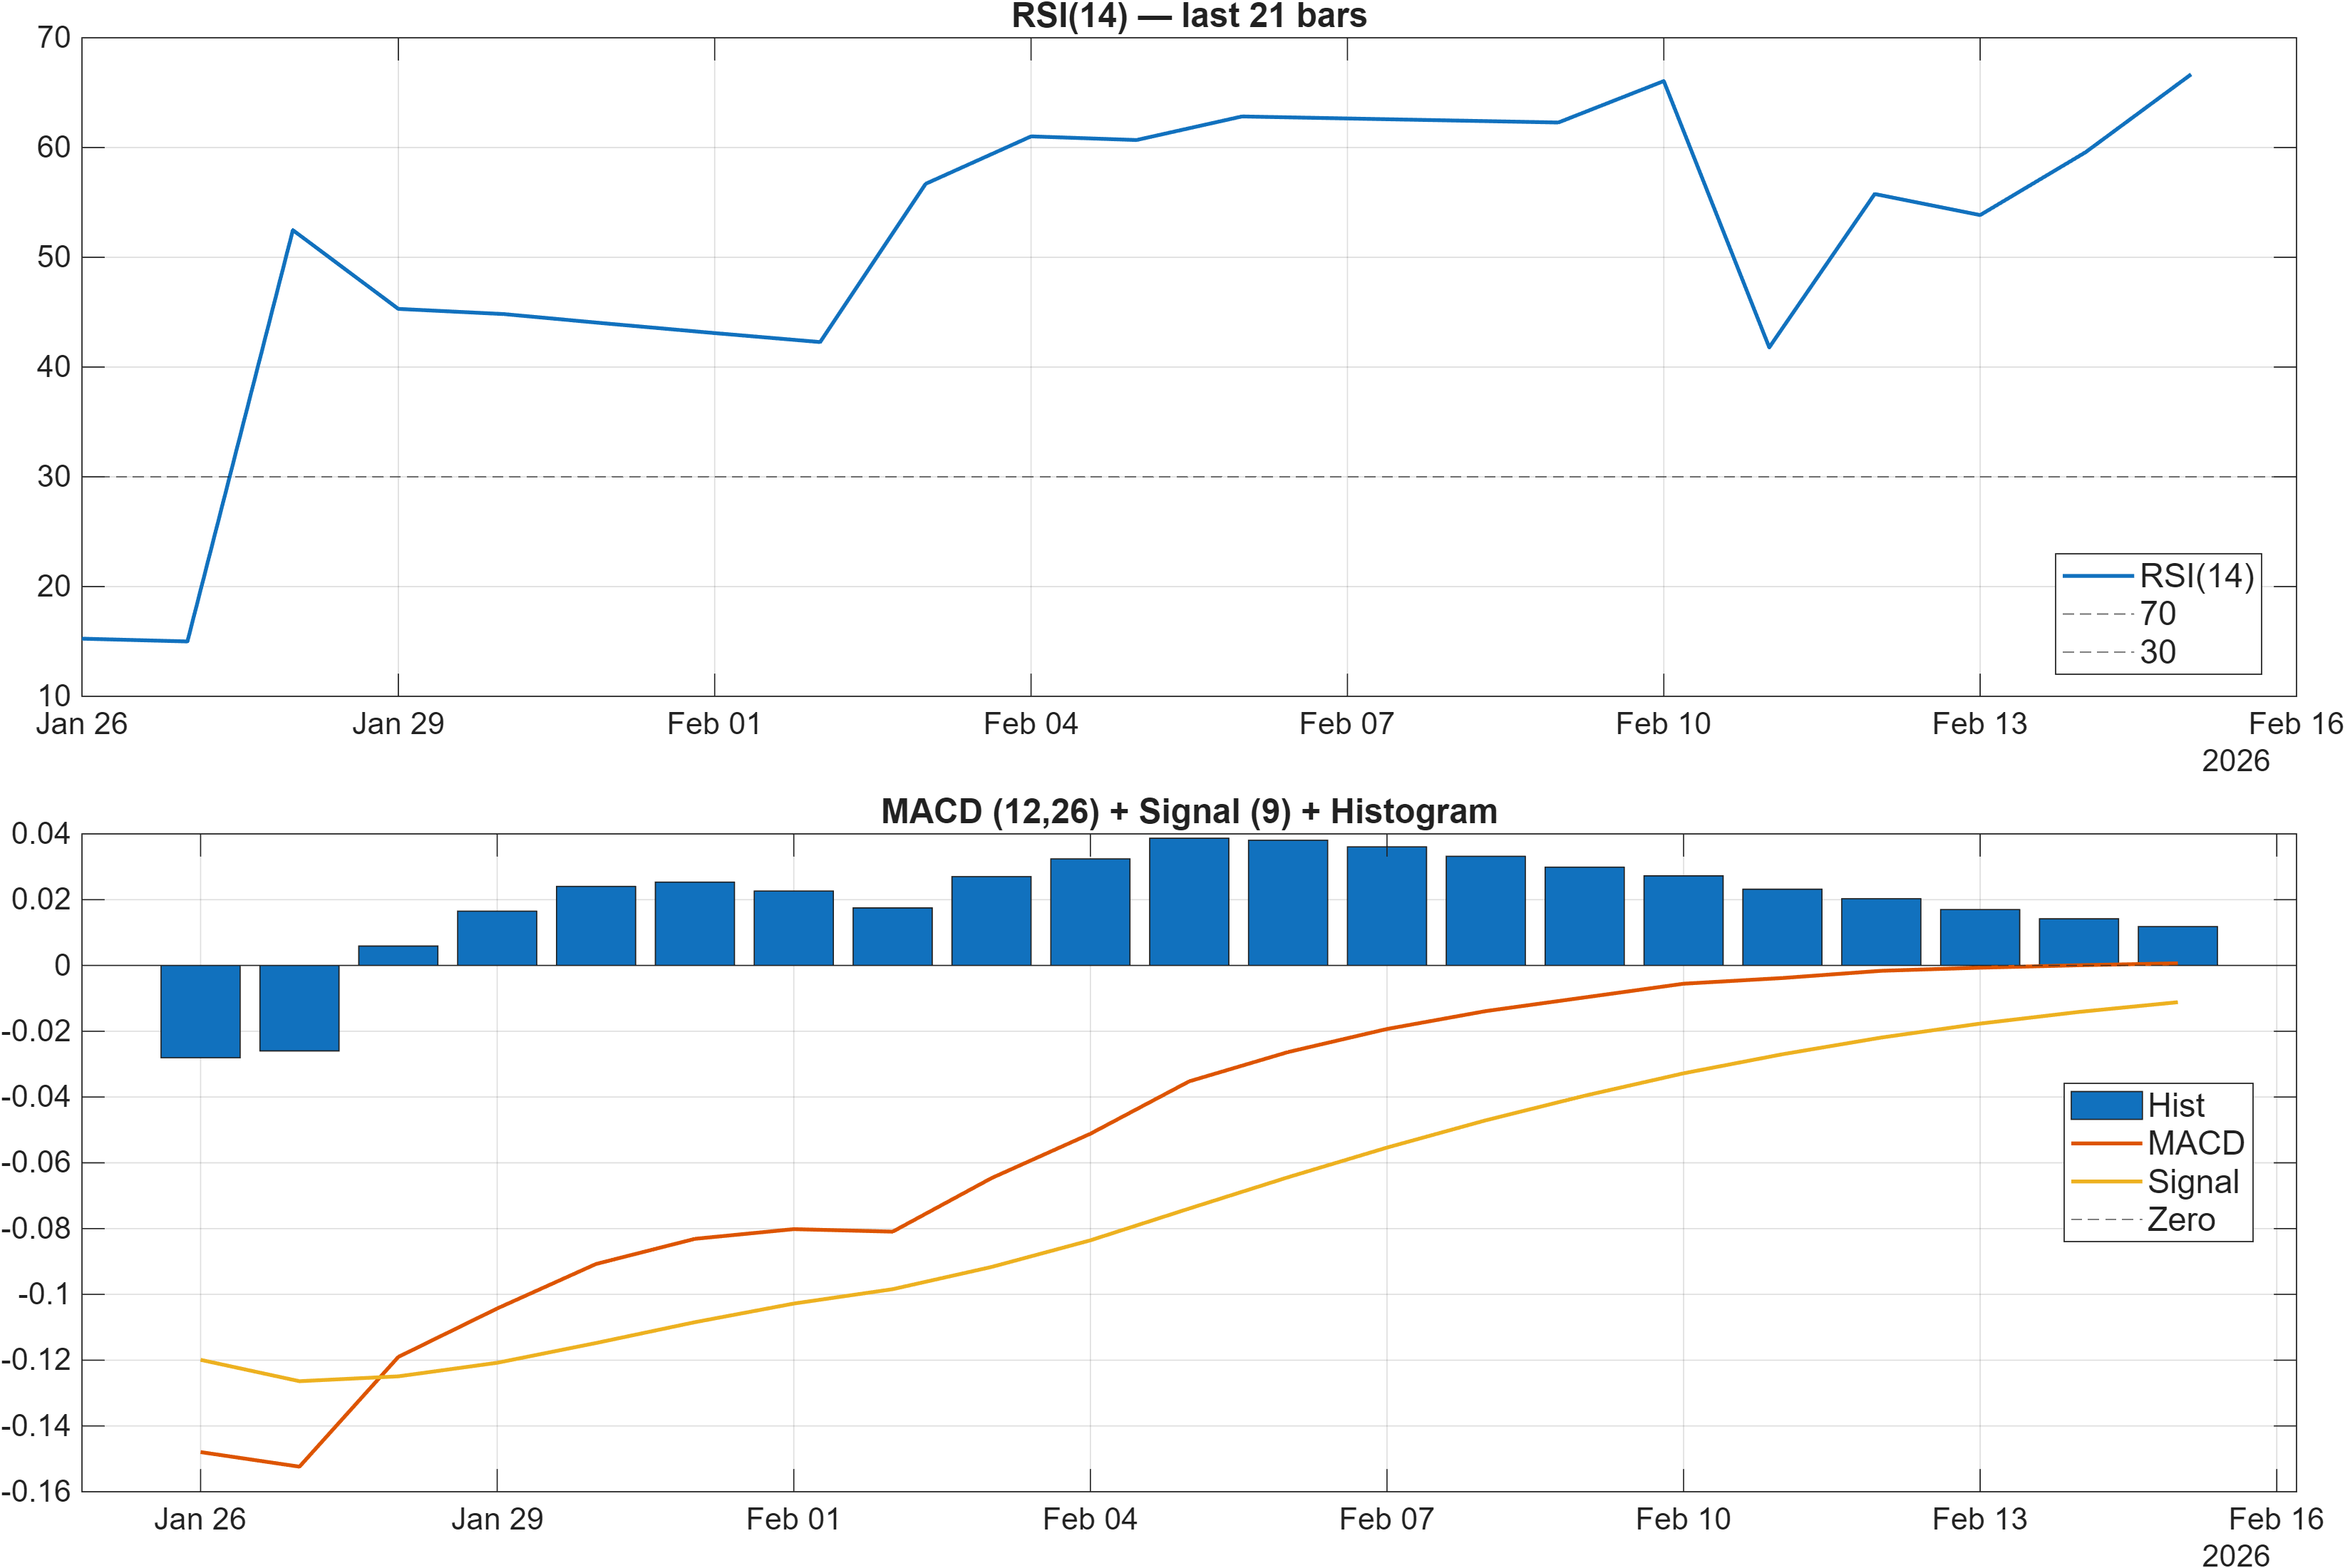
Interpretation: RSI bias = Bullish, MACD hist = 0.0118.
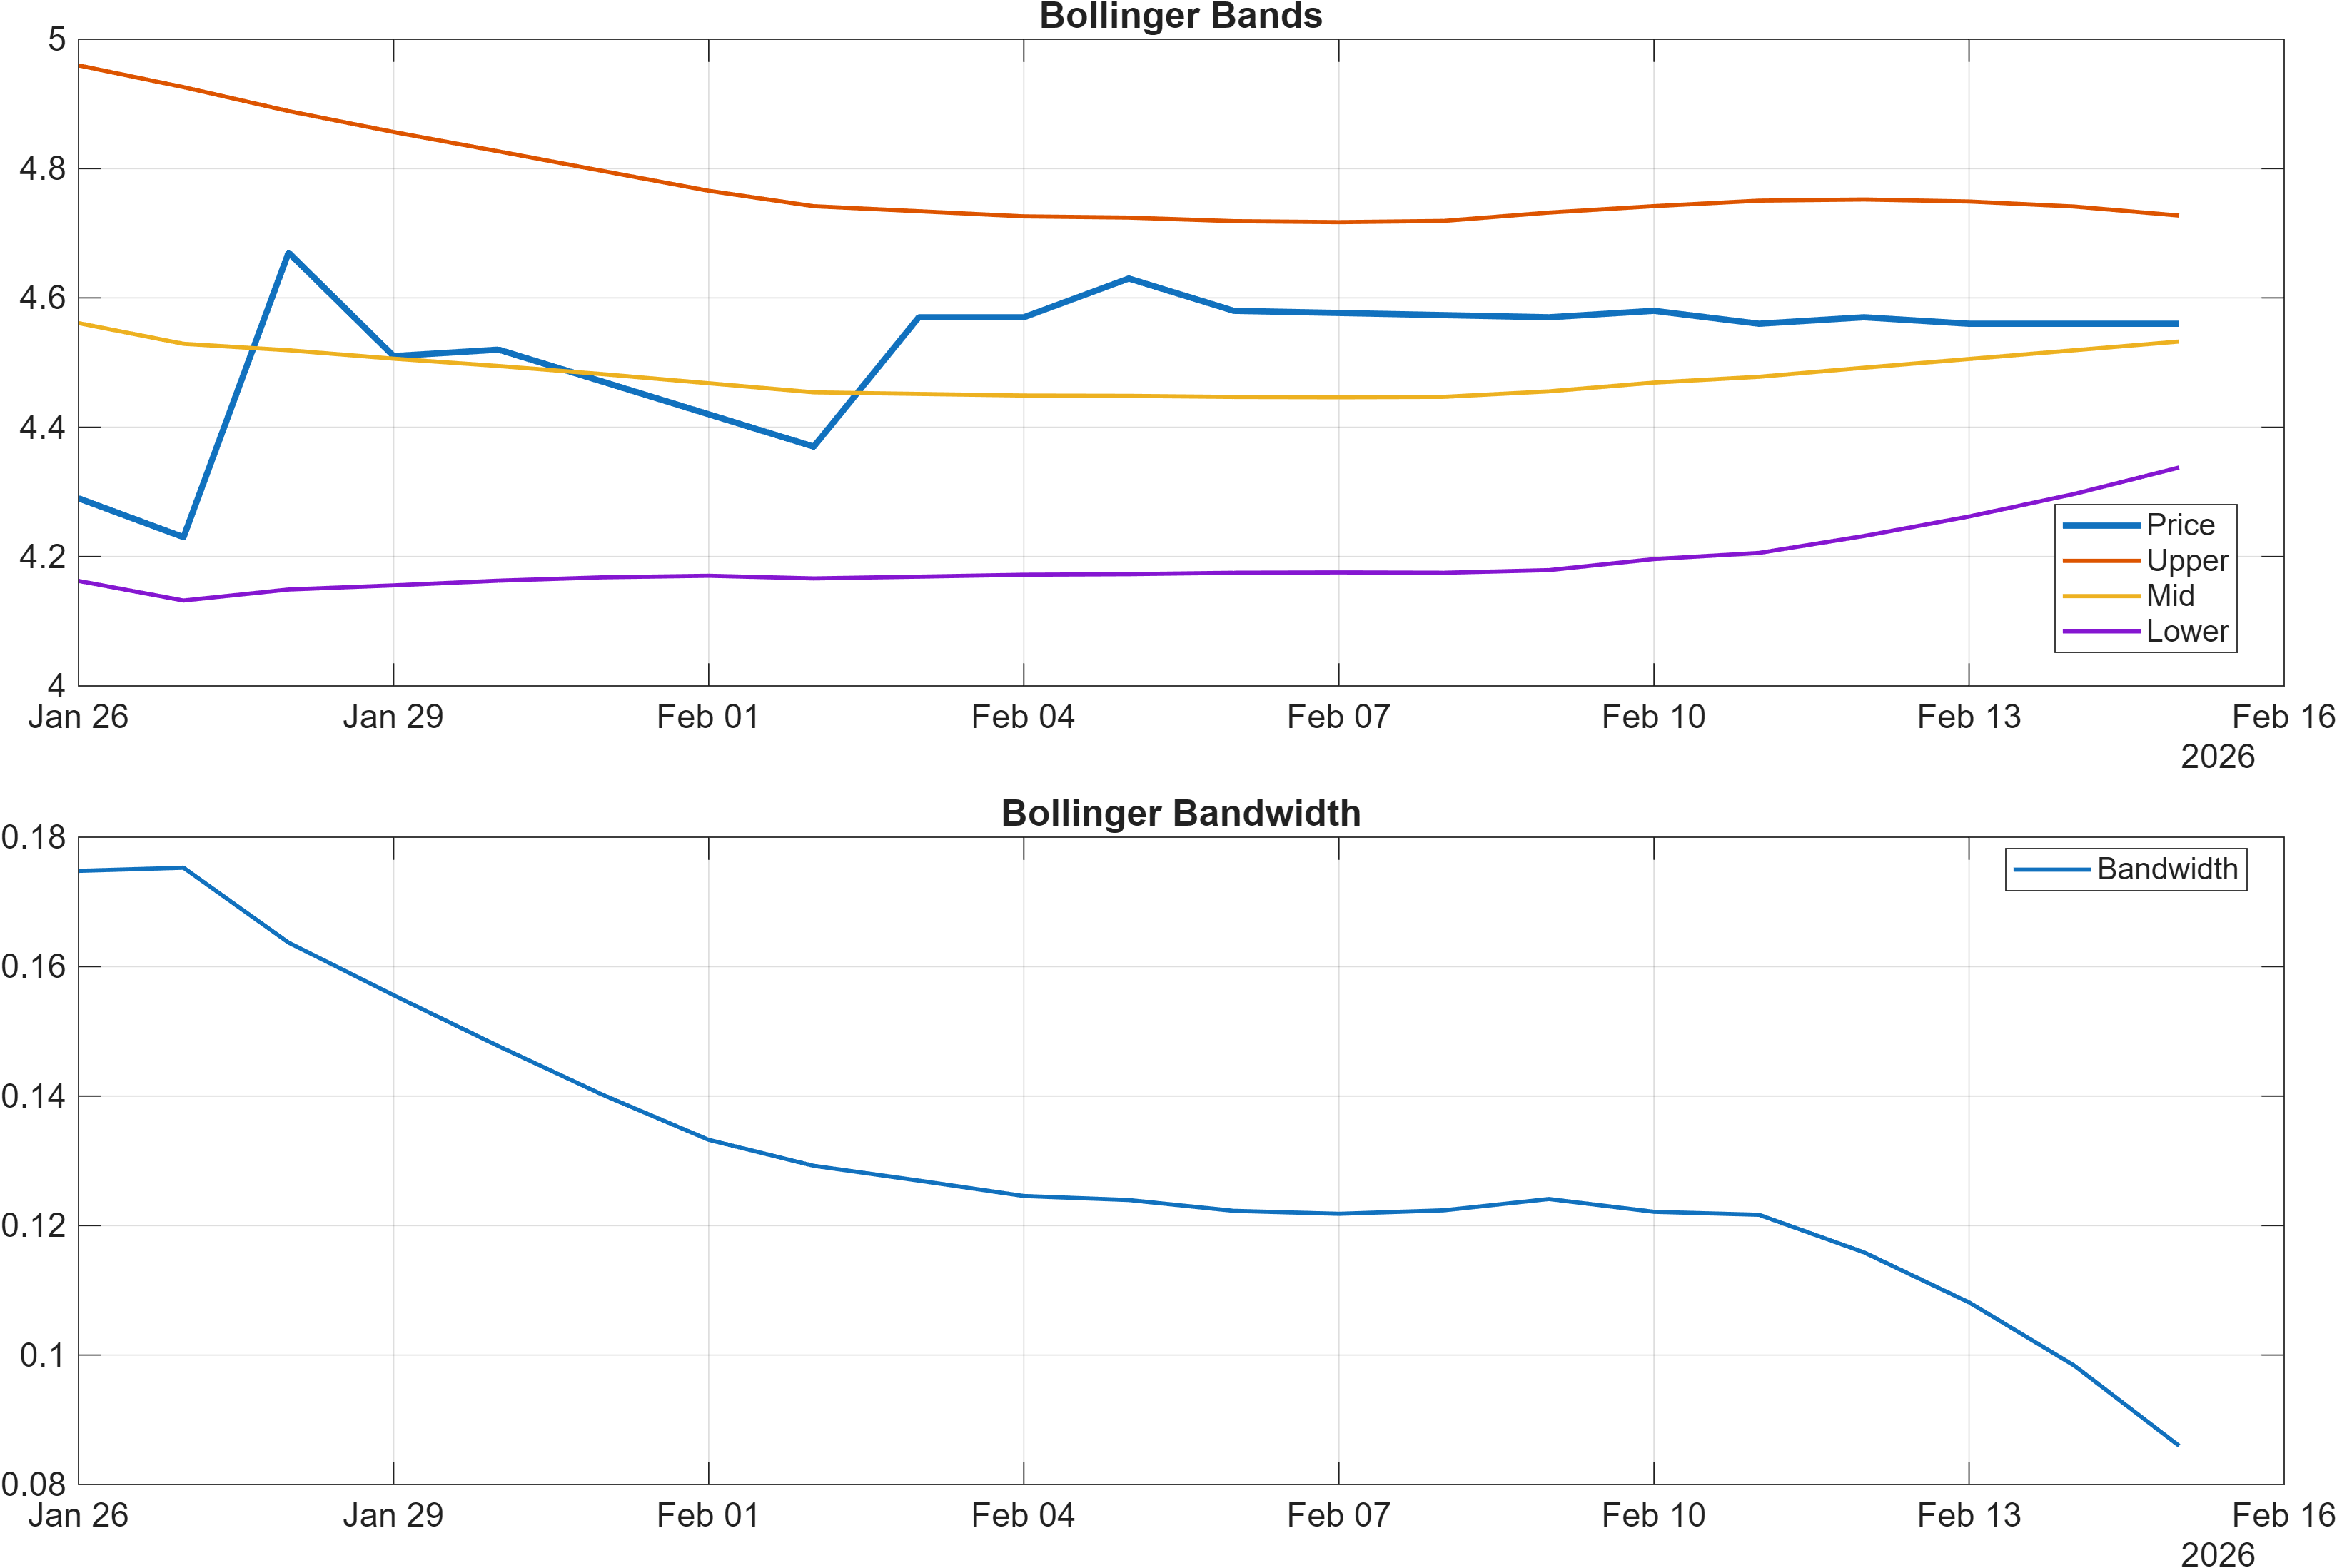
Interpretation: Bandwidth (volatility regime) latest = 0.0860.
Momentum: constructive readings, but confirmation is selective
Momentum indicators lean supportive. The dashboard flags RSI bias = Bullish and a positive MACD histogram of 0.0118, a pairing that typically reflects improving impulse rather than fading pressure. In the signal stack shown later, the underlying RSI(14) is 66.67 and ROC(20) is 7.801, both consistent with a constructive momentum tilt.
That said, volatility conditions are comparatively contained. The Bollinger bandwidth is 0.0860 (with BB Width also reading 0.08598 in the signal table), which often corresponds to a market that can drift in a range until a catalyst produces expansion. Range-like volatility can keep ranks neutral even when momentum improves, which aligns with the neutral confluence outcomes (0.111) despite several bullish momentum signals.
Practically, this mix argues for differentiating between momentum direction and momentum durability. Positive MACD/RSI can coexist with a hesitant price structure if participation and volatility do not confirm. This is why the next section’s decision zones—and whether price can accept above resistance or fails back into support—become the more decisive filter for whether momentum is translating into sustained trend progress.
4) Support / Resistance zones
Support ~ 4.2617 | Resistance ~ 5.0367
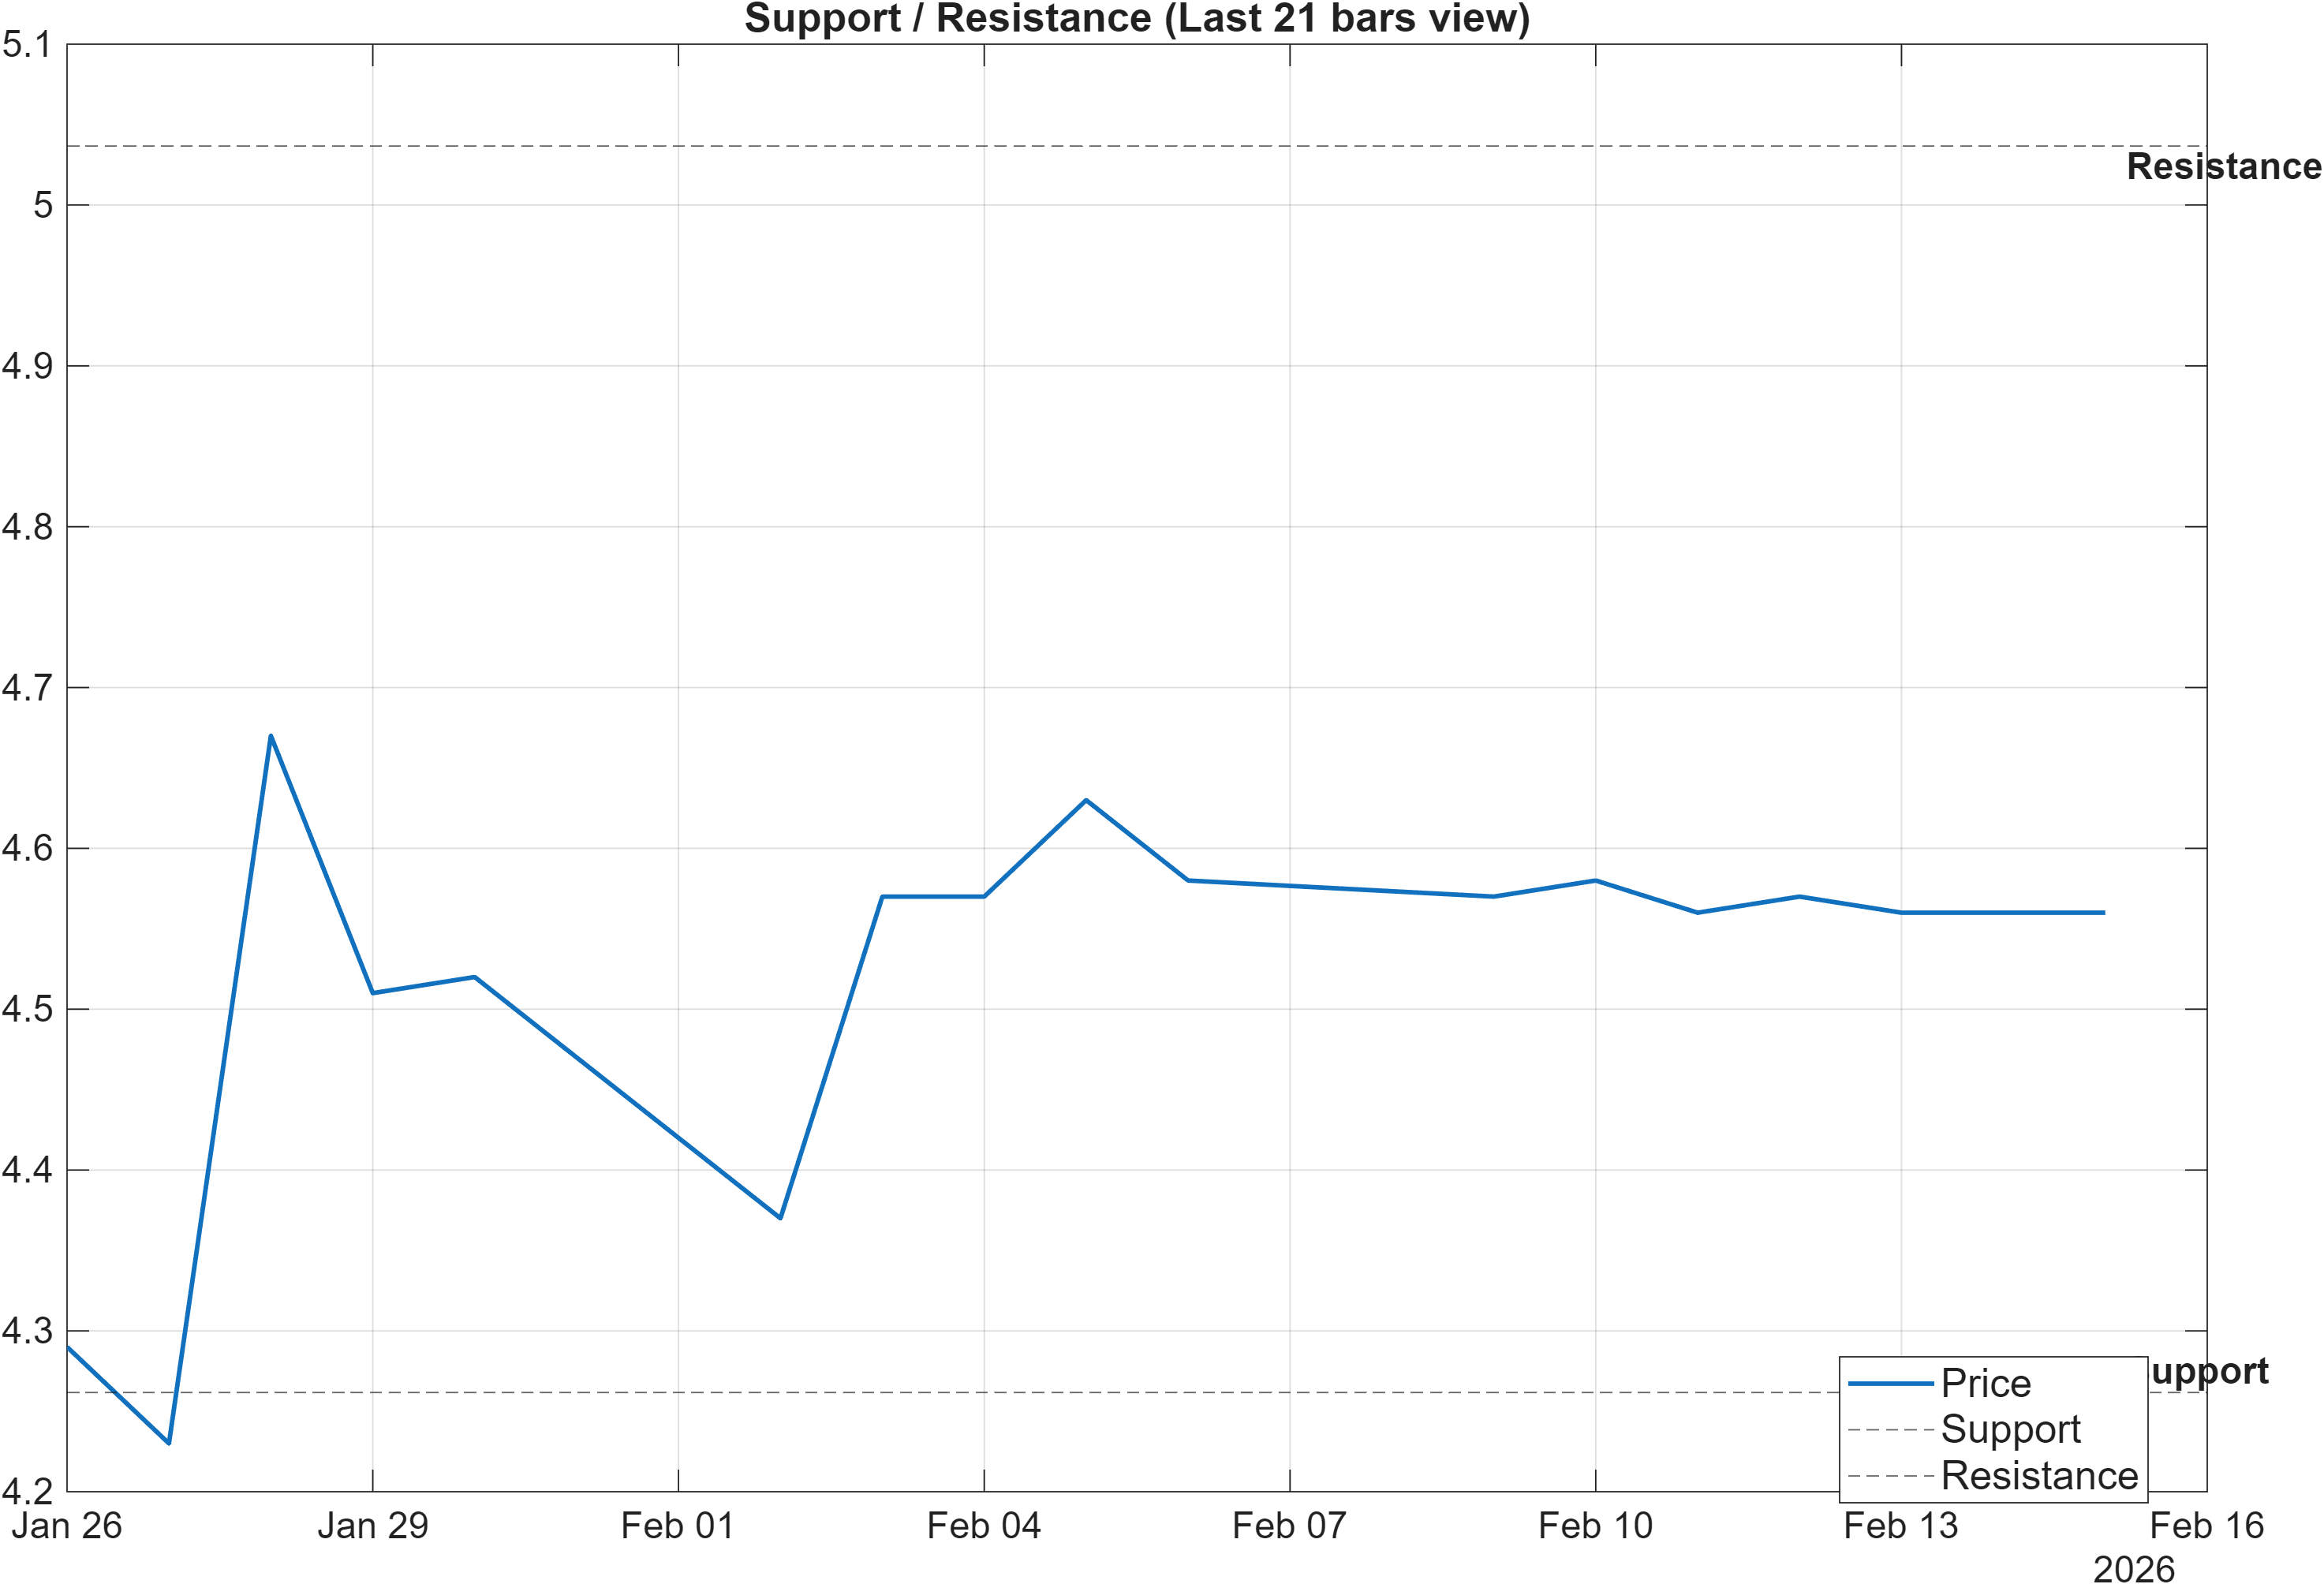
Scenario view: Break above resistance with volume → continuation. Close below support → signal deterioration risk.
Decision zones: where neutral confluence resolves
The level map is clean: Support ~4.2617 defines the primary downside decision area, while Resistance ~5.0367 caps the nearest upside inflection. With the broader signal blend sitting neutral (overall technical score 0.250), these zones become more informative than incremental indicator shifts. Neutral regimes tend to resolve through acceptance beyond a boundary rather than through gradual oscillations.
On strength, a break above 5.0367 is the natural confirmation point described in the scenario view—particularly if it coincides with participation metrics stabilizing (several volume/accumulation slopes are currently bearish in the signal table). On weakness, a close below 4.2617 increases deterioration risk and would be directionally consistent with the weaker Monthly rank #884, which already places the monthly horizon in the lower portion of the universe.
A useful nuance is that MISHTANN’s longer-horizon ranks (#1 at 6-month; #21 yearly) remain strong despite near-term neutrality. That combination often makes support behavior especially relevant: constructive longer-term profiles frequently “defend” key supports, while failure at those levels can signal a regime transition. In short, the price response at 4.2617 and 5.0367 is likely to define whether the current neutral confluence converts into continuation or reverts into a weaker state.
5) Quant Technical Dashboard (18 Signals)
KGNAI AI Technical Analysis Score (Deep Reinforcement Learning): Rank #259 out of 1214 (Rank 1 represents the strongest technical positioning and a higher probability of favorable price behavior. As ranks increase toward the maximum, the probability of favorable outcomes weakens and bearish positioning becomes more dominant.) | Label: Neutral | Score: 0.573
18-Signal Technical Confluence Score: 0.111 (Neutral)
Overall Technical Score (18-signal confluence + DRL rank blend): 0.250 (Neutral)
Note: The blended score reflects signal strength weighted against broader AI technical ranking, which may temporarily diverge.
Blended technical score breakdown: 0.250 (Neutral | Bull 8 / Bear 6 / Neutral 4)
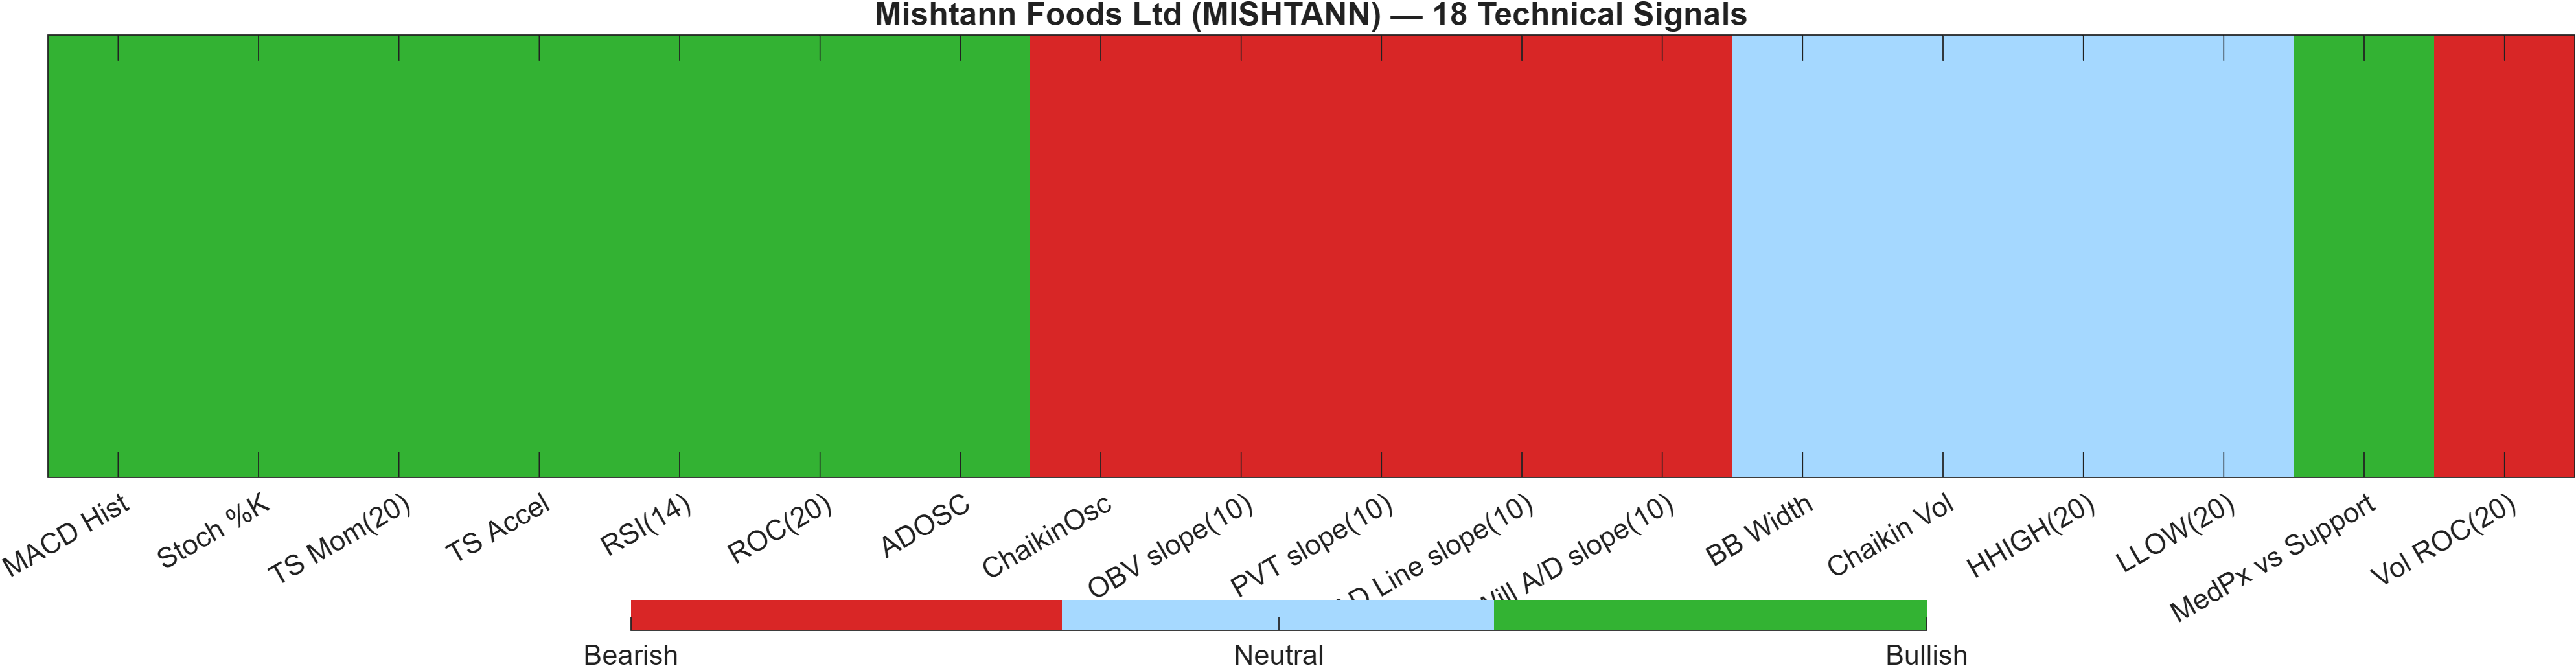
Signal table (Bull/Bear/Neutral)
| Indicator | Value | Signal |
|---|---|---|
| MACD Hist | 0.01182 | Bullish |
| Stoch %K | 17.24 | Bullish |
| TS Mom(20) | 0.33 | Bullish |
| TS Accel | 0.97 | Bullish |
| RSI(14) | 66.67 | Bullish |
| ROC(20) | 7.801 | Bullish |
| ADOSC | 31.25 | Bullish |
| ChaikinOsc | -3.349e+05 | Bearish |
| OBV slope(10) | -3.75e+06 | Bearish |
| PVT slope(10) | -1.237e+04 | Bearish |
| AD Line slope(10) | -2.218e+06 | Bearish |
| Will A/D slope(10) | -0.62 | Bearish |
| BB Width | 0.08598 | Neutral |
| Chaikin Vol | -43.91 | Neutral |
| HHIGH(20) | 4.84 | Neutral |
| LLOW(20) | 4.2 | Neutral |
| MedPx vs Support | 0.2883 | Bullish |
| Vol ROC(20) | -36.79 | Bearish |
Interpretation: Indicator-level signals form the base confluence, which is then adjusted using a separate AI-driven technical ranking model. The final technical score summarizes this combined view.
Confluence mechanics: bullish momentum vs bearish participation
The technical stack is best read as a two-sided tape. Momentum and rate-of-change are supportive: MACD Hist 0.01182, RSI(14) 66.67, and ROC(20) 7.801 all land bullish. Even the stochastic component (Stoch %K 17.24) is flagged bullish in this ruleset, indicating the model is interpreting recent positioning as constructive rather than purely oversold noise.
The counterweight is participation and volume/accumulation slope behavior. Several measures are bearish, including OBV slope(10) -3.75e+06, ChaikinOsc -3.349e+05, and Vol ROC(20) -36.79. This pattern can occur when price improves but the “fuel” behind the move is not consistently expanding—often producing neutral blended outcomes even with visibly bullish momentum.
That tension is reflected in the aggregates: 18-signal confluence 0.111 (Neutral) and overall technical score 0.250 (Neutral), while the DRL technical rank sits #259 (upper part of the universe, but not a leadership extreme) with a score of 0.573. The practical implication is that continuation risk/reward remains sensitive to whether participation metrics stop deteriorating as price tests the 5.0367 resistance zone.
6) News sentiment + extractive gist
Note: Instrument-specific news matches were not found, so the digest includes broader market/sector headlines. Links are provided for verification.
Sentiment score (avg): 0.000 | Positive: 19% | Neutral: 63% | Negative: 19%
KGNAI AI News Sentiment Score (normalized -1 to +1): Not available (as of —) | Label: Not available | Overall news score: 0.00
Positive Developments
Recent coverage across major financial outlets indicates a constructive backdrop in select pockets of Indian equities, with attention on capital formation, market participation, and longer-horizon growth narratives. Some commentary has highlighted investor engagement around primary market activity and allocation decisions, which can support broader risk appetite even when individual names lack direct coverage. In parallel, policy and trade-related discussions have emphasized competitiveness and integration themes, which can be interpreted as a supportive macro narrative for domestically listed companies over longer cycles. For MISHTANN specifically, the relevance is indirect: the signal is less about company-specific catalysts and more about whether the surrounding market tone stays sufficiently stable for technical setups to resolve upward. With MISHTANN’s long-horizon KGNAI ranks strong (6-Monthly #1; Yearly #21), a mildly constructive macro-media tone can reduce friction for continuation—provided price confirms above key resistance.
Neutral / Mixed Developments
The dominant sentiment share is neutral (63%), consistent with market reporting that oscillates between rotation, index-level push-pull, and policy process updates rather than clear directional conviction. Broad index commentary can coincide with “two-way” tape where leadership changes frequently and short-horizon signals become less reliable—an environment that often maps to neutral technical confluence readings such as MISHTANN’s 0.111. Additionally, policy-administration narratives tend to be incremental: they shape expectations slowly and do not necessarily produce immediate price impacts at the single-stock level. For this report, the neutral media tone reinforces a level-driven approach—watching how MISHTANN behaves around 4.2617 and 5.0367—instead of expecting sentiment to act as a primary driver.
Negative / Risk Signals
Risk-oriented coverage has included caution around market drawdowns, volatility upticks, and episodes of broad-based selling pressure. Such messaging can weigh on marginal demand, particularly for smaller or less-followed instruments, even if their internal momentum indicators remain constructive. For MISHTANN, this matters because the technical stack already shows a participation/volume mismatch: several accumulation and volume slopes are bearish (e.g., OBV slope(10) -3.75e+06 and Vol ROC(20) -36.79). In a risk-off or fragile tape, those weaknesses can become more consequential, increasing the probability that price fails to hold key zones or that breakouts lack follow-through. A close below 4.2617 would align with this risk framing by indicating deterioration in the market’s willingness to defend the nearest support.
- Whether price can accept above 5.0367 as participation indicators stabilize
- Any shift in broad risk tone that coincides with a volatility expansion from 0.0860
- Downside response quality if price revisits 4.2617
Sources referenced: Reuters, Bloomberg, Yahoo Finance, MarketWatch, Investing.com
Snapshot: AI Rank (Short–Mid–Long): Mixed (Neutral–Neutral–Bullish) · Technical Confluence: Neutral · Key Levels: Support ~4.26 | Resistance ~5.04 · News Sentiment: Neutral
7) Sources
- Not available in the provided data.
You may also like: How KGNAI AI ranks instruments across global markets
Disclaimer: KGNAI provides AI-generated analytics and educational market commentary only. This is not financial advice. Markets involve risk. Always do your own research.