
Apple Inc (AAPL) Technical & Rank Outlook — 13-Feb-2026 Neutral Bias with Two-Sided Setup
KGNAI Signal + Technical Snapshot + News Sentiment Digest
As of: 13-Feb-2026
Ticker: AAPL
Apple Inc (AAPL) currently screens as Neutral across KGNAI’s short-, mid-, and long-horizon ranks, with positioning that is neither decisively risk-on nor risk-off relative to the 2077-instrument USA universe. Technically, the picture is mixed: price action sits below the MA50 and the MA50 is below the MA200 (bearish trend structure), while momentum and mean-reversion measures are more balanced (RSI bias neutral and Stoch %K extremely low at 7.477). Volatility remains comparatively contained (Bollinger bandwidth 0.1283), which can amplify the importance of defined decision levels. KGNAI’s confluence blend stays neutral (overall technical score -0.067; 7 bull / 7 bear / 4 neutral), while news sentiment prints bullish on the normalized model (0.86) despite a near-flat average sentiment score (0.035). The result is a two-sided setup focused on confirmation at 248.1217 support and 278.5750 resistance.
- Short / Mid / Long rank stance: Neutral / Neutral / Neutral (daily #504, weekly #1134, yearly #526 out of 2077)
- Technical confluence label: Neutral (18-signal confluence 0.000; overall technical score -0.067)
- Key levels: Support ~ 248.1217 | Resistance ~ 278.5750
- News sentiment bias: Bullish normalized score 0.86 (avg sentiment 0.035; 24% positive / 67% neutral / 10% negative)
- Confirmation / invalidation: A break above 278.5750 with volume supports continuation; a close below 248.1217 increases deterioration risk
KGNAI evaluates instruments by combining relative positioning (ranks across a broad universe) with independent technical confirmations that test trend, momentum, volatility, and volume flow. Results are comparative and probabilistic, designed to remain consistent across thousands of instruments. Strength is recognized when multiple signals align rather than from any single indicator.
- Ranks are comparative within the 2077-instrument universe, not absolute “buy/sell” calls.
- Confluence reflects signal agreement; mixed dashboards tend to be range-bound until confirmation.
- Support/resistance levels define decision zones where follow-through matters more than intraday noise.
- Sentiment offers contextual bias and may diverge from price when positioning is in transition.
1) KGNAI AI Analysis
- Daily rank: #504 out of 2077 — Neutral
- Weekly rank: #1134 out of 2077 — Neutral
- Monthly rank: #471 out of 2077 — Neutral
- 3-Monthly rank: #578 out of 2077 — Neutral
- 6-Monthly rank: #723 out of 2077 — Neutral
- Yearly rank: #526 out of 2077 — Neutral
AAPL’s rank profile is consistently middle-of-the-pack across horizons—daily rank #504, monthly rank #471, and yearly rank #526 out of 2077. This type of clustering typically signals an equilibrium regime: the instrument is not screening as an extreme leader nor an obvious laggard versus peers. The weakest relative read is the weekly rank at #1134, which sits in the lower half of the universe and can be consistent with near-term uncertainty or churn. By contrast, the monthly reading near #471 is closer to the median, suggesting the broader one-to-three month behavior has not broken down decisively.
The practical implication for a neutral rank stack is that subsequent sections (trend, momentum, volatility, and levels) carry more weight: confirmation at key technical zones can quickly shift an otherwise balanced probabilistic base. When ranks remain neutral across multiple windows (including 3-month #578 and 6-month #723), it also implies the system is seeing offsetting forces—often a blend of trend pressure and counter-trend momentum—rather than a single dominant regime.
KGNAI ranks each instrument across large universes using multiple proprietary AI tests and statistical models (millions of data points). Lower ranks generally indicate stronger probability of favorable performance behavior, while higher ranks indicate weaker probability and more bearish positioning.
Want the full universe and complete rank tables? Unlock full access on KGNAI: https://www.kgnai.com/pricing
2) Price & trend overview
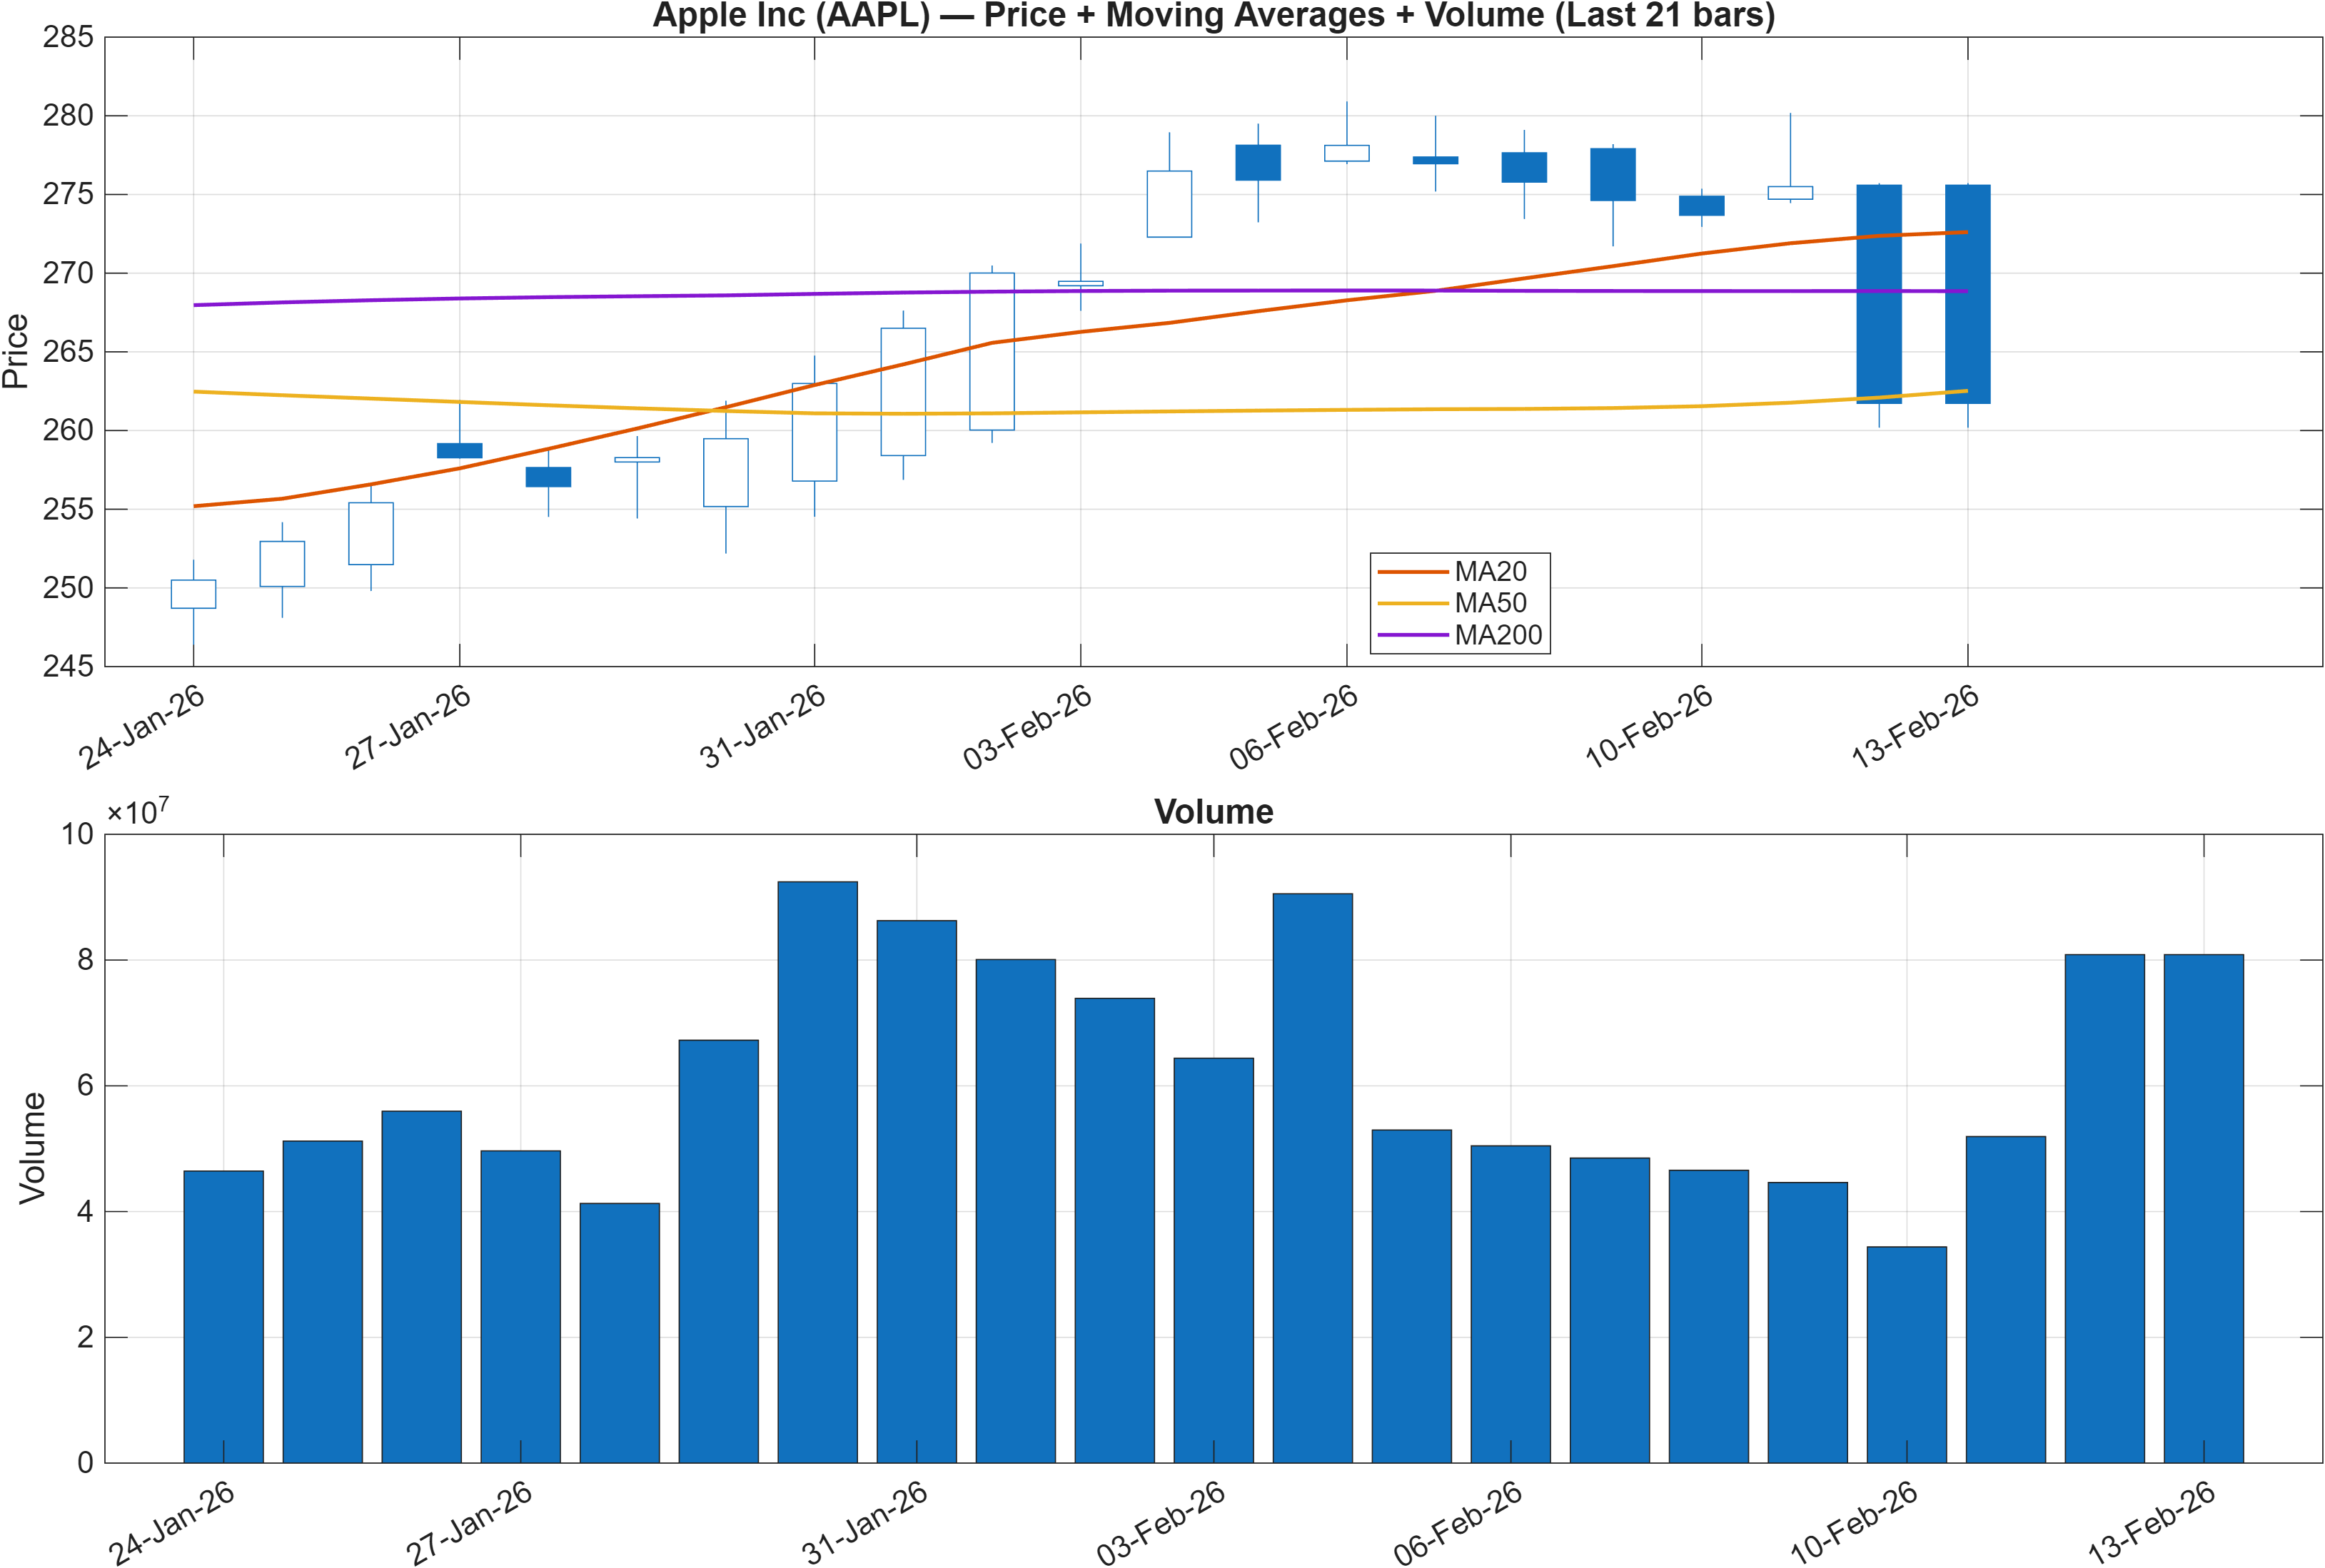
Trend structure is currently the clearest directional signal in the dashboard: the close remains below the MA50 and the MA50 is below the MA200, a configuration that typically characterizes a bearish intermediate regime. In these setups, rallies often need stronger confirmation (breadth and volume persistence) to shift the burden of proof away from sellers. This matters because several other modules are less directional: ranks are neutral (e.g., daily #504 and monthly #471 out of 2077), and momentum is not deeply oversold on RSI (RSI(14) 53.07, neutral). The combination can produce a “grind” market: trend pressure exists, but mean-reversion can still generate counter-moves.
The most actionable takeaway is how trend interacts with predefined levels. The 20-day low in the signal set is 248.1 and the model’s primary support sits at 248.1217, which makes that zone a high-sensitivity area for trend validation. If price stays above that region while volatility remains contained (Bollinger bandwidth 0.1283), trend weakness can persist without immediate breakdown. Conversely, if price acceptance falls below that level, the MA stack can transition from “headwind” to “accelerant,” because trailing measures often lag but then reinforce.
With a neutral blended technical score (-0.067) and a perfectly balanced bull/bear split (7/7), the moving-average picture becomes a primary anchor: it describes the prevailing path of least resistance even as shorter-term indicators probe for reversals.
3) Momentum & volatility dashboard
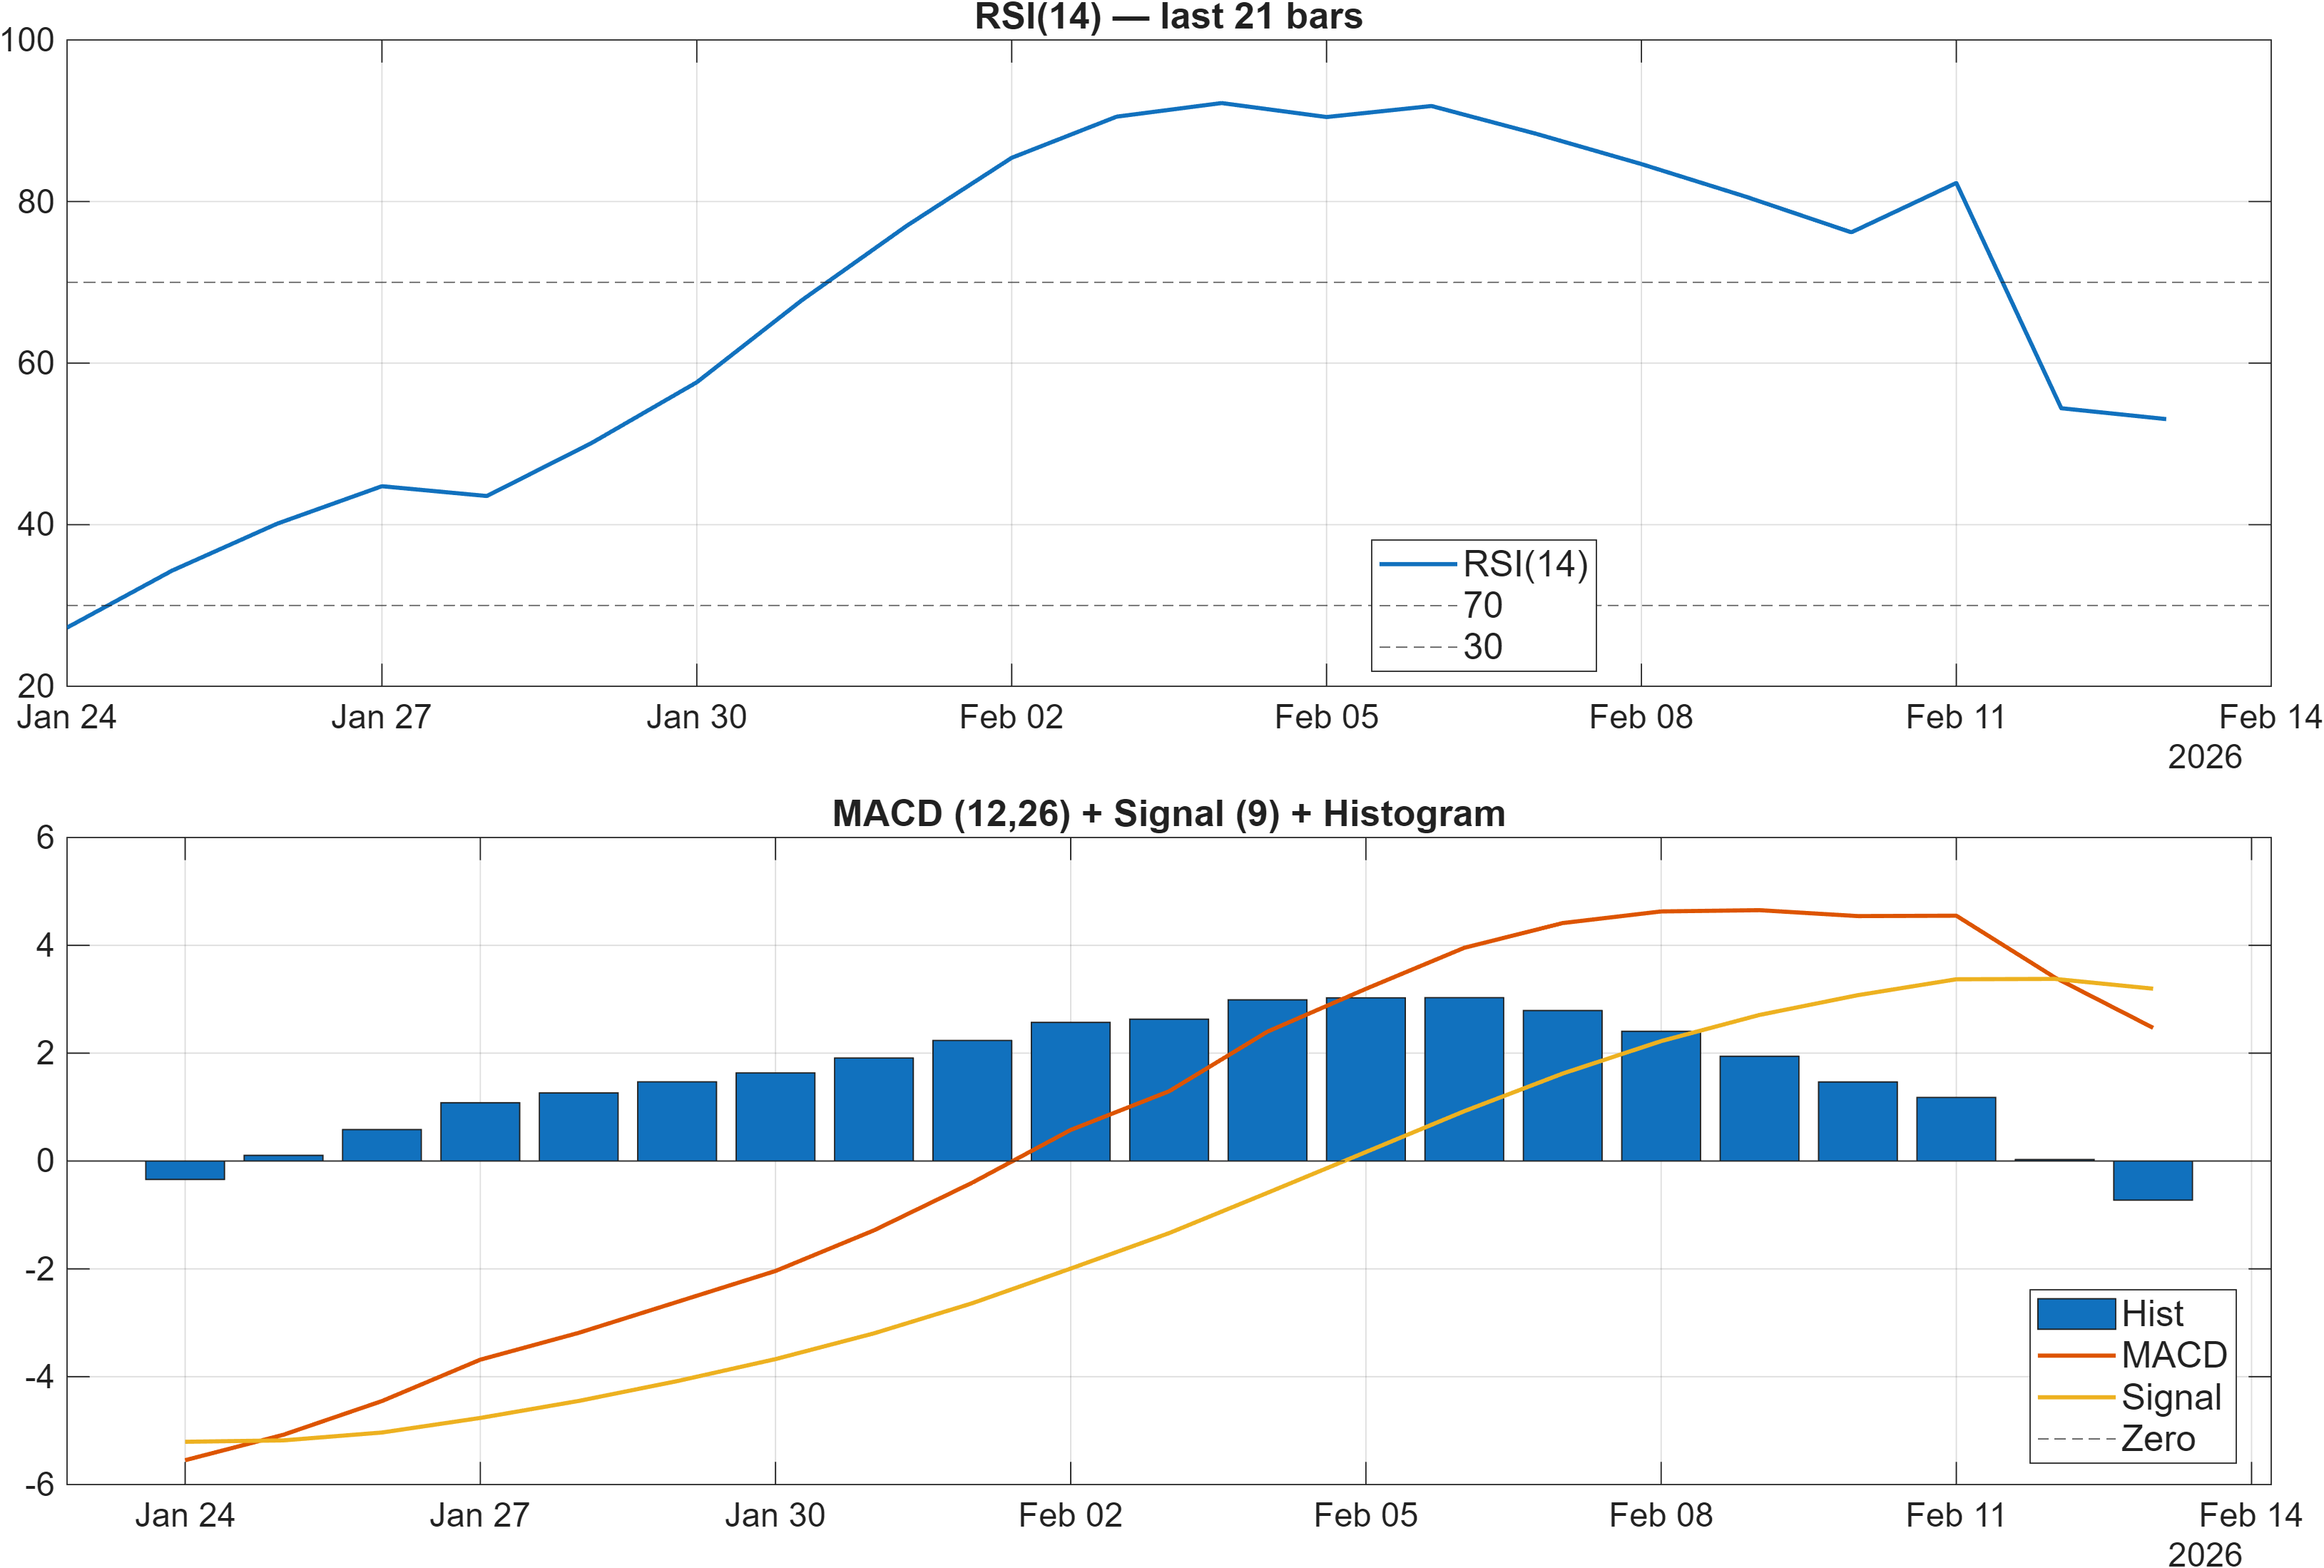
Momentum signals are internally split, which helps explain why higher-level outputs remain neutral. RSI(14) at 53.07 indicates neither a stretched oversold condition nor an overheated momentum state; it is consistent with range behavior where price can move in both directions without forcing a regime shift. By contrast, MACD histogram at -0.7263 retains a bearish tone, suggesting that medium-term momentum is still leaning negative even if spot momentum has stabilized.
Shorter-horizon oscillators point to a different risk profile. Stoch %K at 7.477 is classified bullish in the signal table, which typically occurs when the market is compressed near local lows and becomes susceptible to rebounds. That message is reinforced by positive trend-statistics momentum: TS Mom(20) at 8.777 and TS Accel at 18.18 both register bullish, implying improving impulse even while the MACD lens stays cautious.
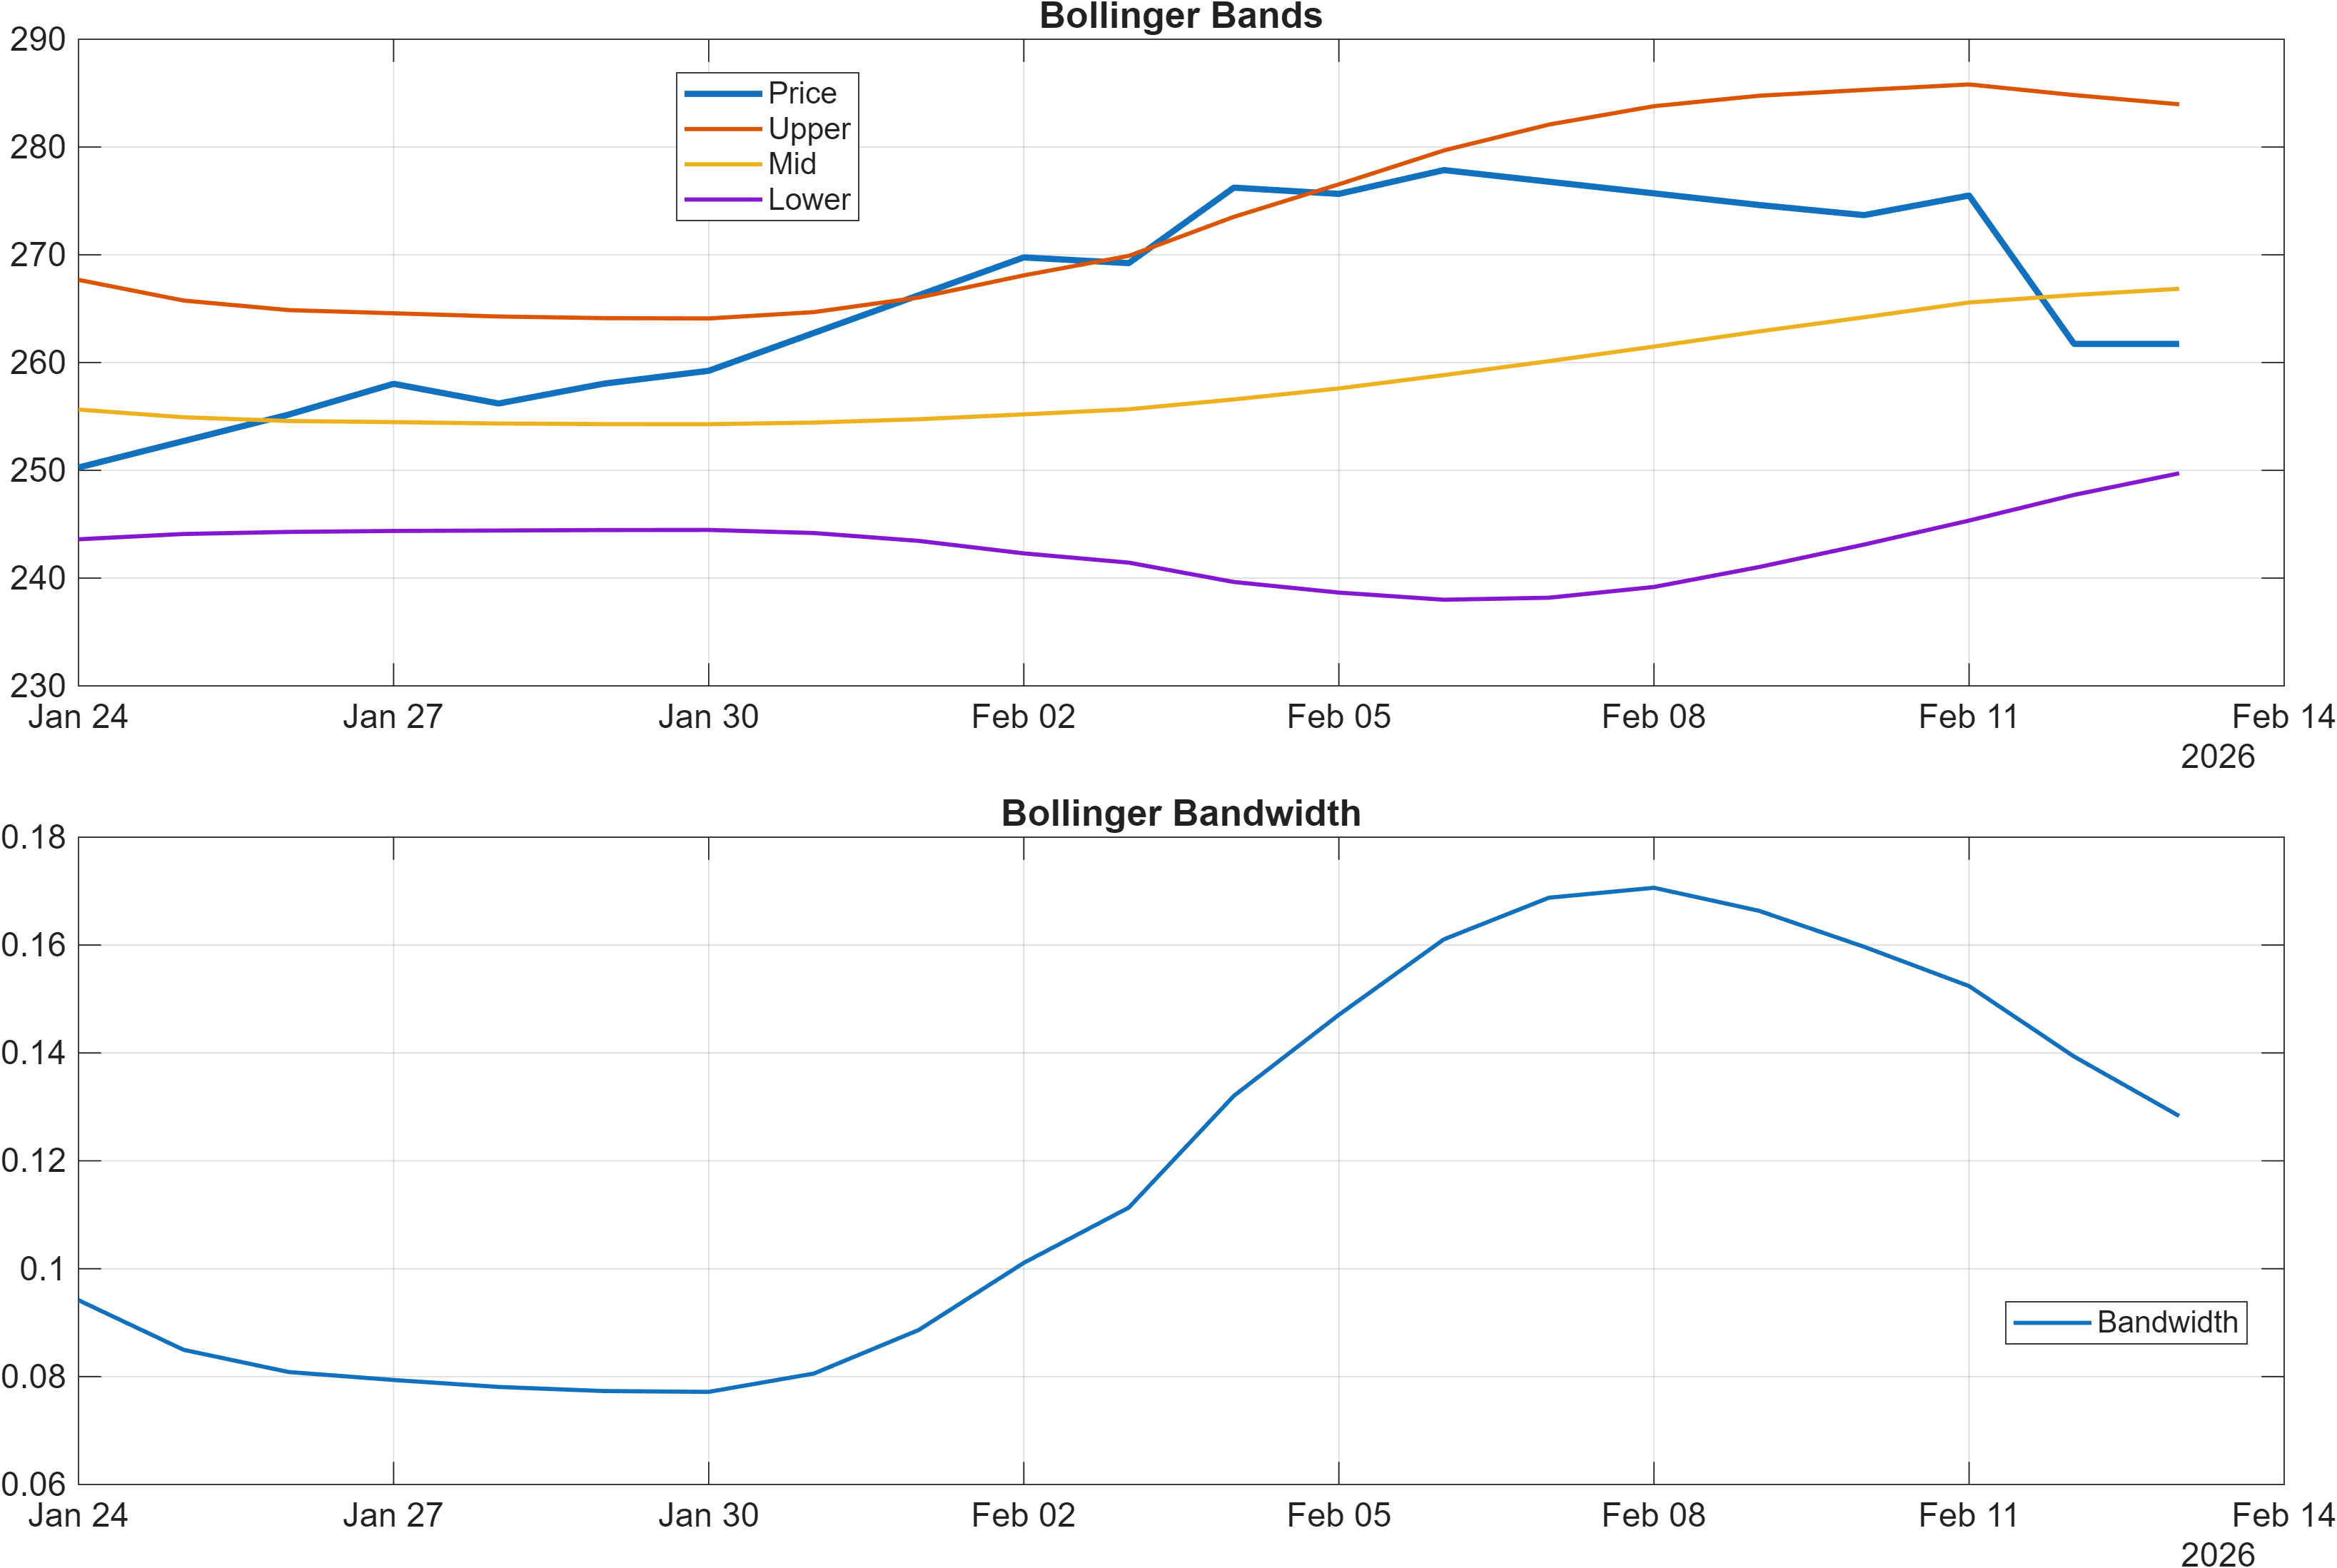
Volatility is an important tie-breaker here. Bollinger bandwidth at 0.1283 is tagged neutral, reflecting a relatively contained volatility regime rather than expansion. In these regimes, price can “store” pressure; resolution often occurs when price approaches defined boundaries (support/resistance) and volume/flow indicators decide whether the move is accepted. This is consistent with the overall confluence balance (bull 7 / bear 7 / neutral 4) and the blended technical score of -0.067, where small shifts in a few indicators can flip the interpretation.
4) Support / Resistance zones
Support ~ 248.1217 | Resistance ~ 278.5750
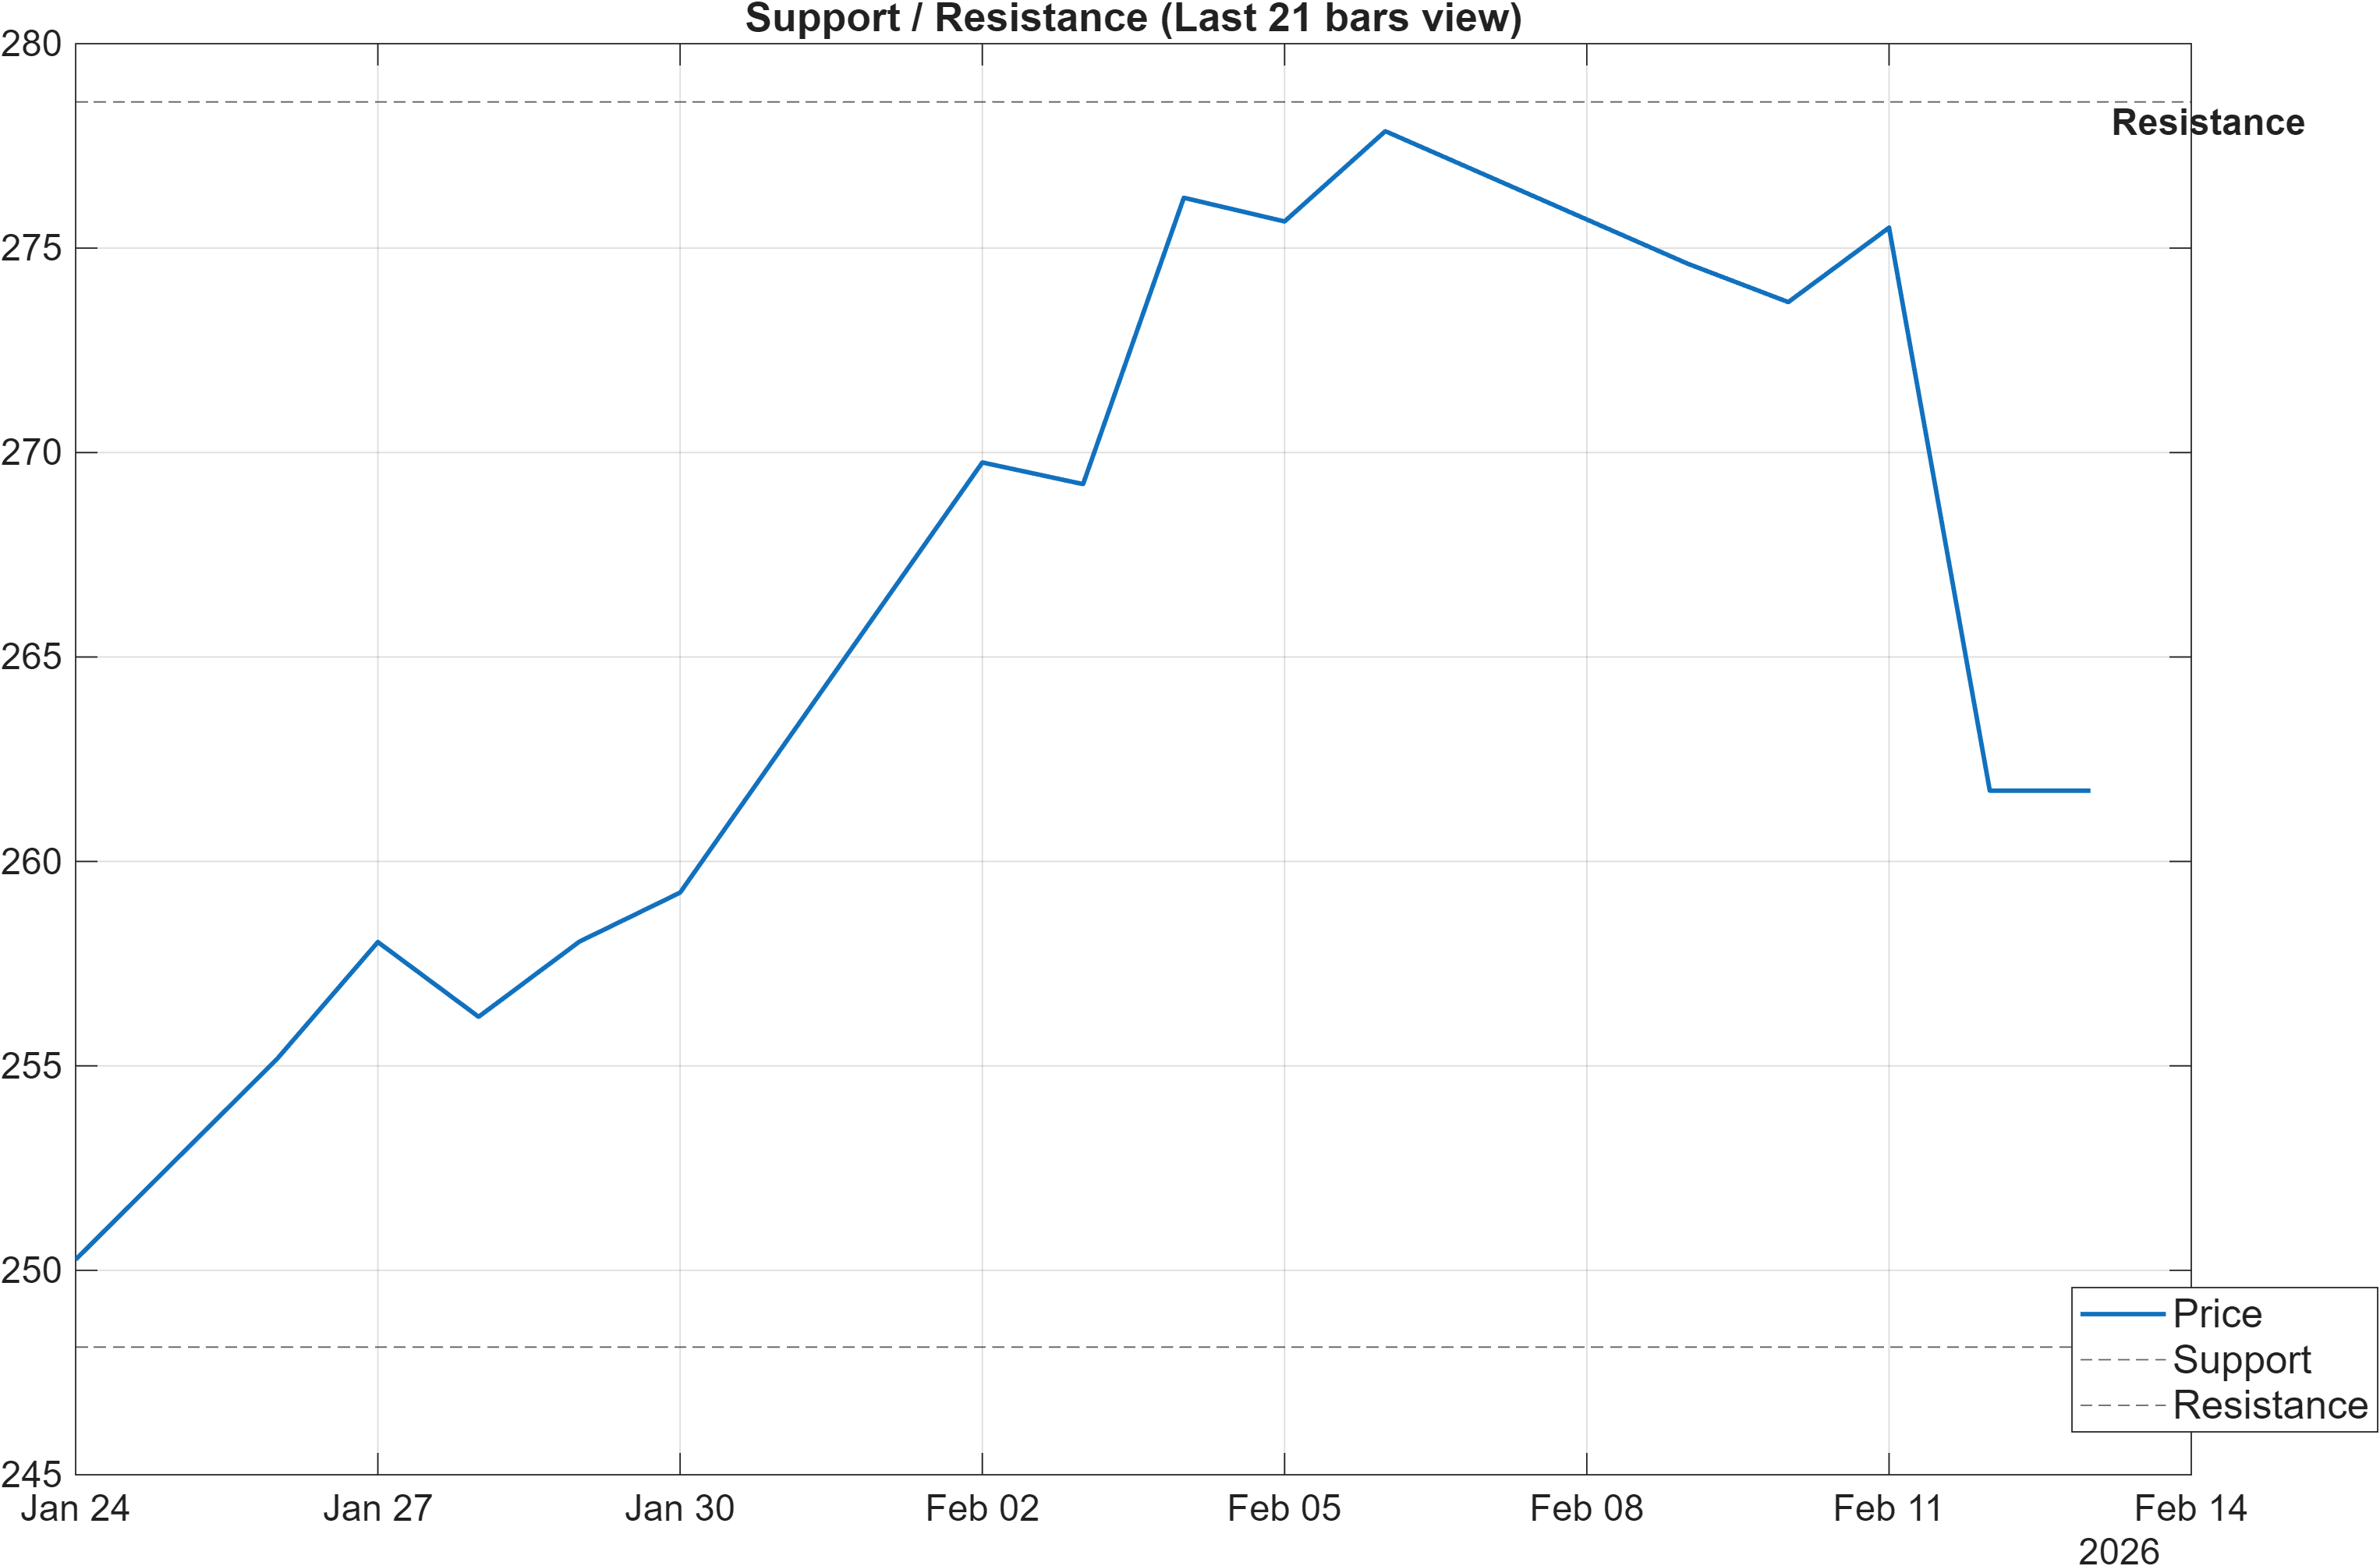
The level map is clean and relatively wide, with primary support at 248.1217 and resistance at 278.5750. This aligns closely with the 20-day low and high references in the signal set (LLOW(20) 248.1 and HHIGH(20) 280.9), which makes the zones structurally important rather than arbitrary. When multiple independent modules converge on similar boundaries, those areas often become the market’s decision points: reactions tend to be more informative than mid-range fluctuations.
The scenario framing in the dataset emphasizes confirmation. A break above resistance with volume supports continuation, while a close below support flags deterioration risk. This logic is reinforced by the moving-average structure (close below MA50 and MA50 below MA200), which can cause failed rallies near resistance to roll over quickly. At the same time, the presence of bullish short-term readings—Stoch %K 7.477 and Vol ROC(20) 57.92—suggests that tests of resistance, if they occur, may be accompanied by episodic bursts of activity rather than a smooth trend.
With Bollinger bandwidth at 0.1283 (neutral), the support/resistance band can be viewed as the operating range for the current regime. Inside the band, mixed confluence (overall technical score -0.067) can persist. Outside it, follow-through becomes the key variable: acceptance above 278.5750 would reduce the weight of bearish trend structure, whereas acceptance below 248.1217 would likely align more indicators toward downside continuation.
5) Quant Technical Dashboard (18 Signals)
KGNAI AI Technical Analysis Score (Deep Reinforcement Learning): Rank #1271 out of 2077 (Rank 1 represents the strongest technical positioning and a higher probability of favorable price behavior. As ranks increase toward the maximum, the probability of favorable outcomes weakens and bearish positioning becomes more dominant.) | Label: Neutral | Score: -0.224
18-Signal Technical Confluence Score: 0.000 (Neutral)
Overall Technical Score (18-signal confluence + DRL rank blend): -0.067 (Neutral)
Note: The blended score reflects signal strength weighted against broader AI technical ranking, which may temporarily diverge.
Blended technical score breakdown: -0.067 (Neutral | Bull 7 / Bear 7 / Neutral 4)
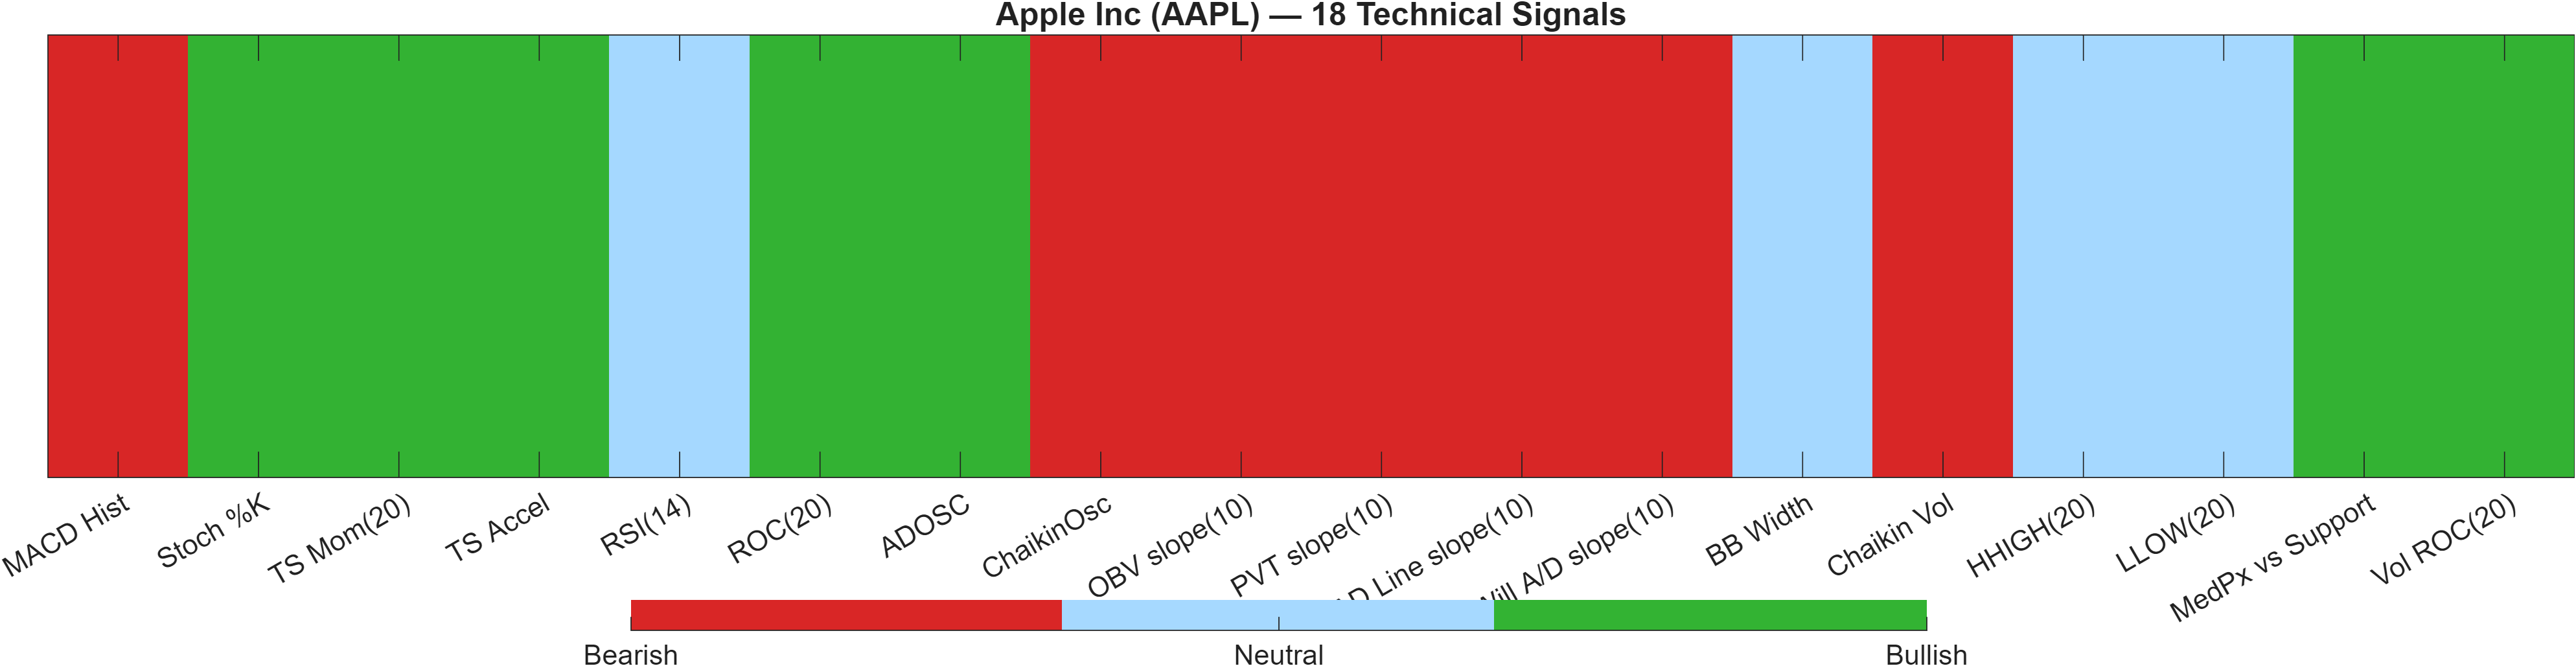
Signal table (Bull/Bear/Neutral)
| Indicator | Value | Signal |
|---|---|---|
| MACD Hist | -0.7263 | Bearish |
| Stoch %K | 7.477 | Bullish |
| TS Mom(20) | 8.777 | Bullish |
| TS Accel | 18.18 | Bullish |
| RSI(14) | 53.07 | Neutral |
| ROC(20) | 3.567 | Bullish |
| ADOSC | 5.405 | Bullish |
| ChaikinOsc | -5.973e+07 | Bearish |
| OBV slope(10) | -1.15e+08 | Bearish |
| PVT slope(10) | -1.754e+06 | Bearish |
| AD Line slope(10) | -2.056e+08 | Bearish |
| Will A/D slope(10) | -18.18 | Bearish |
| BB Width | 0.1283 | Neutral |
| Chaikin Vol | 20.21 | Bearish |
| HHIGH(20) | 280.9 | Neutral |
| LLOW(20) | 248.1 | Neutral |
| MedPx vs Support | 19.83 | Bullish |
| Vol ROC(20) | 57.92 | Bullish |
The dashboard’s central message is compression through disagreement. The 18-signal confluence score is exactly 0.000 (neutral), while the blended technical score is -0.067 (neutral). Even the composition is symmetric: Bull 7 / Bear 7 / Neutral 4. This balance tends to appear when different “families” of indicators argue with each other—often trend and distribution leaning bearish while selected oscillators and price-vs-level measures lean bullish.
On the bearish side, multiple volume/flow slopes point negative: OBV slope(10) -1.15e+08, AD Line slope(10) -2.056e+08, and PVT slope(10) -1.754e+06. Alongside MACD histogram at -0.7263 and Chaikin Vol at 20.21 (bearish), these readings can indicate that participation and distribution dynamics are not fully supportive of a sustained upside move—consistent with the bearish MA structure noted earlier.
On the bullish side, the model is simultaneously detecting rebound potential and stabilization: Stoch %K 7.477 (bullish), ROC(20) 3.567 (bullish), and Vol ROC(20) 57.92 (bullish). The DRL technical rank at #1271 out of 2077 with score -0.224 remains neutral, suggesting the AI model is not yet seeing a high-confidence technical edge despite pockets of improving momentum. In this configuration, level confirmation (support 248.1217 / resistance 278.5750) typically matters more than incremental indicator fluctuations.
Interpretation: Indicator-level signals form the base confluence, which is then adjusted using a separate AI-driven technical ranking model. The final technical score summarizes this combined view.
6) News sentiment + extractive gist
Sentiment score (avg): 0.035 | Positive: 24% | Neutral: 67% | Negative: 10%
KGNAI AI News Sentiment Score (normalized -1 to +1): 0.86 (as of 2026-02-13) | Label: Bullish | Overall news score: 0.81
Positive Developments
Recent coverage across major financial outlets indicates a constructive tone around Apple, with discussion emphasizing product-cycle momentum and AI-related software/hardware updates. The positive skew in the normalized model (0.86) is consistent with narratives that highlight demand strength and continued ecosystem resilience, even as the broader signal stack remains neutral. Notably, the sentiment distribution shows 24% positive and 67% neutral, suggesting optimism is present but not overwhelming. In a market where the technical state is balanced (18-signal confluence 0.000), supportive news flow can act as a catalyst—especially if it coincides with price approaching the upper decision zone near 278.5750. The key analytical point is not the content of any single article, but the aggregate effect: positive framing may reduce downside follow-through while the market tests whether trend headwinds (close below MA50; MA50 below MA200) can be overcome.
Neutral / Mixed Developments
The dominant tone is still informational rather than directional: with 67% of items tagged neutral, much of the coverage appears to be positioning-related, interpretive, or focused on market mechanics around Apple exposure rather than a single decisive company-specific driver. This “high neutral share” often aligns with a price regime where indicators disagree—RSI(14) at 53.07 (neutral) while MACD histogram is -0.7263 (bearish). In such contexts, news flow can add context without resolving the trade-off between trend pressure and rebound signals. For readers, this means sentiment may stay supportive in the background while price remains bounded by levels, with the most informative developments being those that coincide with confirmation above resistance or deterioration below support.
Negative / Risk Signals
Risk-oriented coverage clusters around broader tech-sector drawdowns, margin sensitivity, and the possibility of large-holder flows influencing near-term price behavior. Even though the negative share is relatively low at 10%, these themes can matter when technical participation signals are already mixed-to-weak (e.g., OBV slope(10) -1.15e+08 and AD Line slope(10) -2.056e+08 both bearish). In a low-to-neutral volatility regime (bandwidth 0.1283), downside narratives can become more impactful if price starts accepting below 248.1217, because they can accelerate risk aversion and reinforce the bearish moving-average configuration. The practical risk is not that negative items dominate today, but that they may align with technical deterioration to produce asymmetric downside follow-through.
- Whether sentiment stays constructive if price repeatedly rejects near 278.5750.
- Any shift in tone concurrent with a close below 248.1217 (support acceptance vs quick reclaim).
- Whether broader tech risk-off coverage coincides with weakening volume/flow signals already flagged as bearish.
Snapshot: AI Rank (Short–Mid–Long): Neutral (Neutral–Neutral–Neutral) · Technical Confluence: Neutral · Key Levels: Support ~248.12 | Resistance ~278.57 · News Sentiment: Neutral
Sources referenced: Reuters, Bloomberg, Yahoo Finance, MarketWatch, Investing.com
7) Sources
Source links are not included in this publication view. Not available in the provided data.
You may also like: How KGNAI AI ranks instruments across global markets
Disclaimer: KGNAI provides AI-generated analytics and educational market commentary only. This is not financial advice. Markets involve risk. Always do your own research.