
TDG (Transdigm Group Incorporated) Technical & Rank Review — 15-Feb-2026 | Bullish ranks with neutral technical confluence
Transdigm Group Incorporated (TDG) screens as a Bullish-ranked name across multiple KGNAI horizons as of 15-Feb-2026, with the strongest relative placement in longer windows (notably #6 on the 3-month view and #12 on the 6-month view, out of 2075). The near-term tape is less clean: price vs the MA50 is flagged Bearish while the MA50 vs MA200 remains Bullish, implying trend support exists but may be under short-term pressure. Momentum indicators lean defensive (RSI(14) 23.65; MACD histogram -3.9386), while volatility is moderate with Bollinger bandwidth at 0.2016. The 18-signal blend holds at -0.249 (Neutral), suggesting the market is at a decision zone where confirmation matters. Key levels are well-defined: support ~1268.2183 and resistance ~1453.1250. News sentiment is mildly positive on balance (avg 0.092; 0% negative).
- Rank stance (Short / Mid / Long): Bullish / Bullish / Bullish (daily #35, weekly #46, yearly #46 out of 2075).
- Technical confluence: Neutral (18-signal score -0.056; overall technical -0.249).
- Key levels: Support 1268.2183 | Resistance 1453.1250.
- News sentiment bias: Slightly positive/neutral (avg 0.092; Positive 35%, Neutral 65%, Negative 0%).
- Confirmation / invalidation: A break above 1453.1250 with volume supports continuation; a close below 1268.2183 increases deterioration risk.
What KGNAI Measures
KGNAI ranks instruments by relative positioning across a large, standardized universe using multiple AI tests and statistical models. The goal is to evaluate signal alignment and probabilistic performance behavior rather than reacting to a single indicator. Outputs are designed to remain conservative when confirmation is limited.
How to Read This Report
- Ranks are comparative across the 2075-instrument universe, not absolute return forecasts.
- Confluence summarizes agreement across 18 indicators plus an AI technical rank blend.
- Support/resistance are decision zones where follow-through or failure often becomes visible.
- Sentiment provides contextual bias that can amplify or conflict with price/technicals.
1) KGNAI AI Analysis
Region: USA
Total universe size: 2075 ranked instruments
- Daily rank: #35 out of 2075 — Bullish
- Weekly rank: #46 out of 2075 — Bullish
- Monthly rank: #121 out of 2075 — Bullish
- 3-Monthly rank: #6 out of 2075 — Bullish
- 6-Monthly rank: #12 out of 2075 — Bullish
- Yearly rank: #46 out of 2075 — Bullish
TDG’s rank profile is consistently strong across timeframes, with the 3-month rank at #6 and 6-month rank at #12 placing it in the top decile of the 2075-instrument universe. Even the faster horizons remain elevated (daily #35, weekly #46), supporting a constructive relative stance despite near-term technical frictions visible elsewhere in the report.
The practical implication is not that the path is linear, but that TDG has recently exhibited favorable statistical behavior versus peers when evaluated across KGNAI’s standardized tests. When long-horizon ranks are this strong, short-term weakness (e.g., momentum compression) often matters most as a timing and risk-management issue rather than a full regime reversal—unless key levels fail.
Term view: Short-term: Bullish. Mid-term: Bullish. Long-term: Bullish. The main analytical tension in this report is the gap between these bullish ranks and the more muted technical blend (overall technical -0.249, Neutral). That divergence typically elevates the importance of confirmation from price behavior around 1268.2183 (support) and 1453.1250 (resistance).
Want the full universe and complete rank tables? Unlock full access on KGNAI: https://www.kgnai.com/pricing
2) Price & trend overview
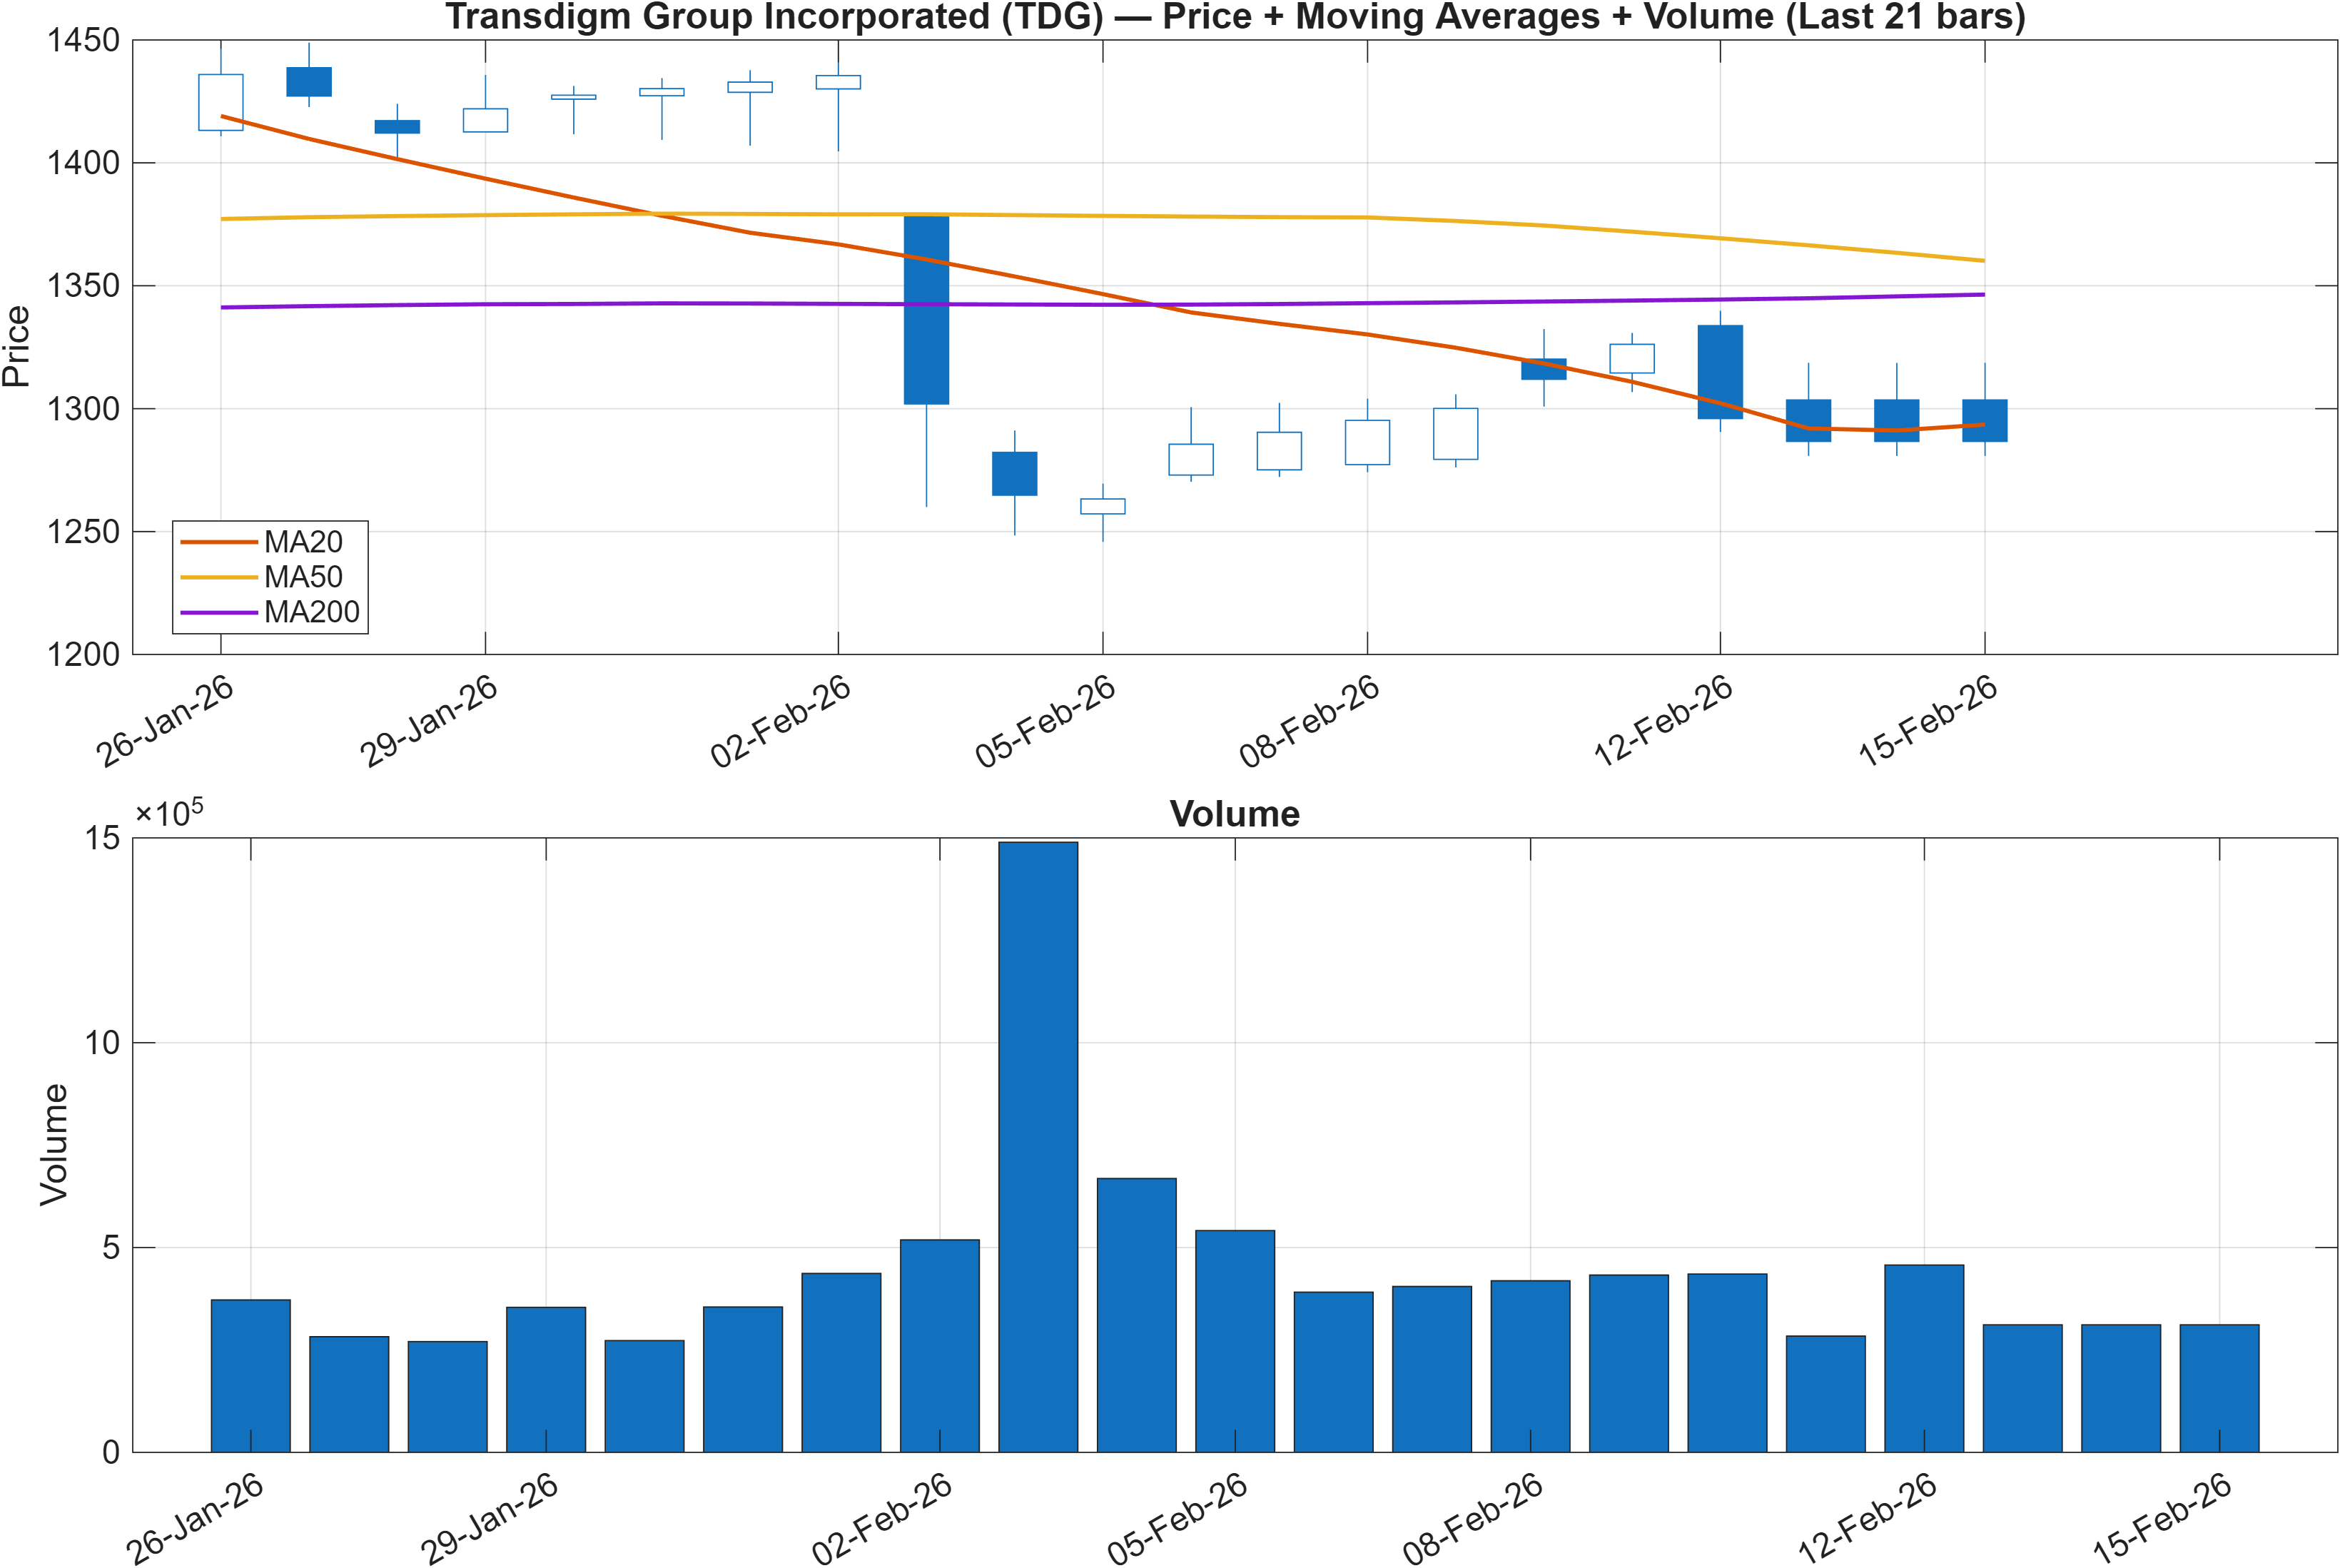
Interpretation: Close vs MA50 = Bearish, MA50 vs MA200 = Bullish.
The moving-average stack presents a mixed trend state. A Bearish close versus the MA50 often reflects near-term pressure or a pullback phase, while a Bullish MA50 versus MA200 typically aligns with a still-positive intermediate trend foundation. This is a common configuration when a broader uptrend is intact but the market is testing conviction after an extended move.
In this context, trend assessment benefits from blending ranks and levels: TDG’s longer-horizon ranks (3-month #6, 6-month #12) argue that the instrument has remained relatively strong within the broader universe even as the price/MA50 relationship deteriorated. That pattern often shifts attention from “trend vs no trend” toward trend persistence vs temporary mean reversion.
The decision boundary is clearer when mapped to the report’s defined zones. A market that cannot reclaim trend control frequently begins by losing structurally relevant support; here, that reference is 1268.2183. Conversely, re-assertion of upside trend typically shows up first as sustained trade through overhead supply; here, the pivotal marker is 1453.1250. Until one of those areas is resolved, the MA signals suggest a market transitioning between regimes rather than firmly trending in one direction.
3) Momentum & volatility dashboard
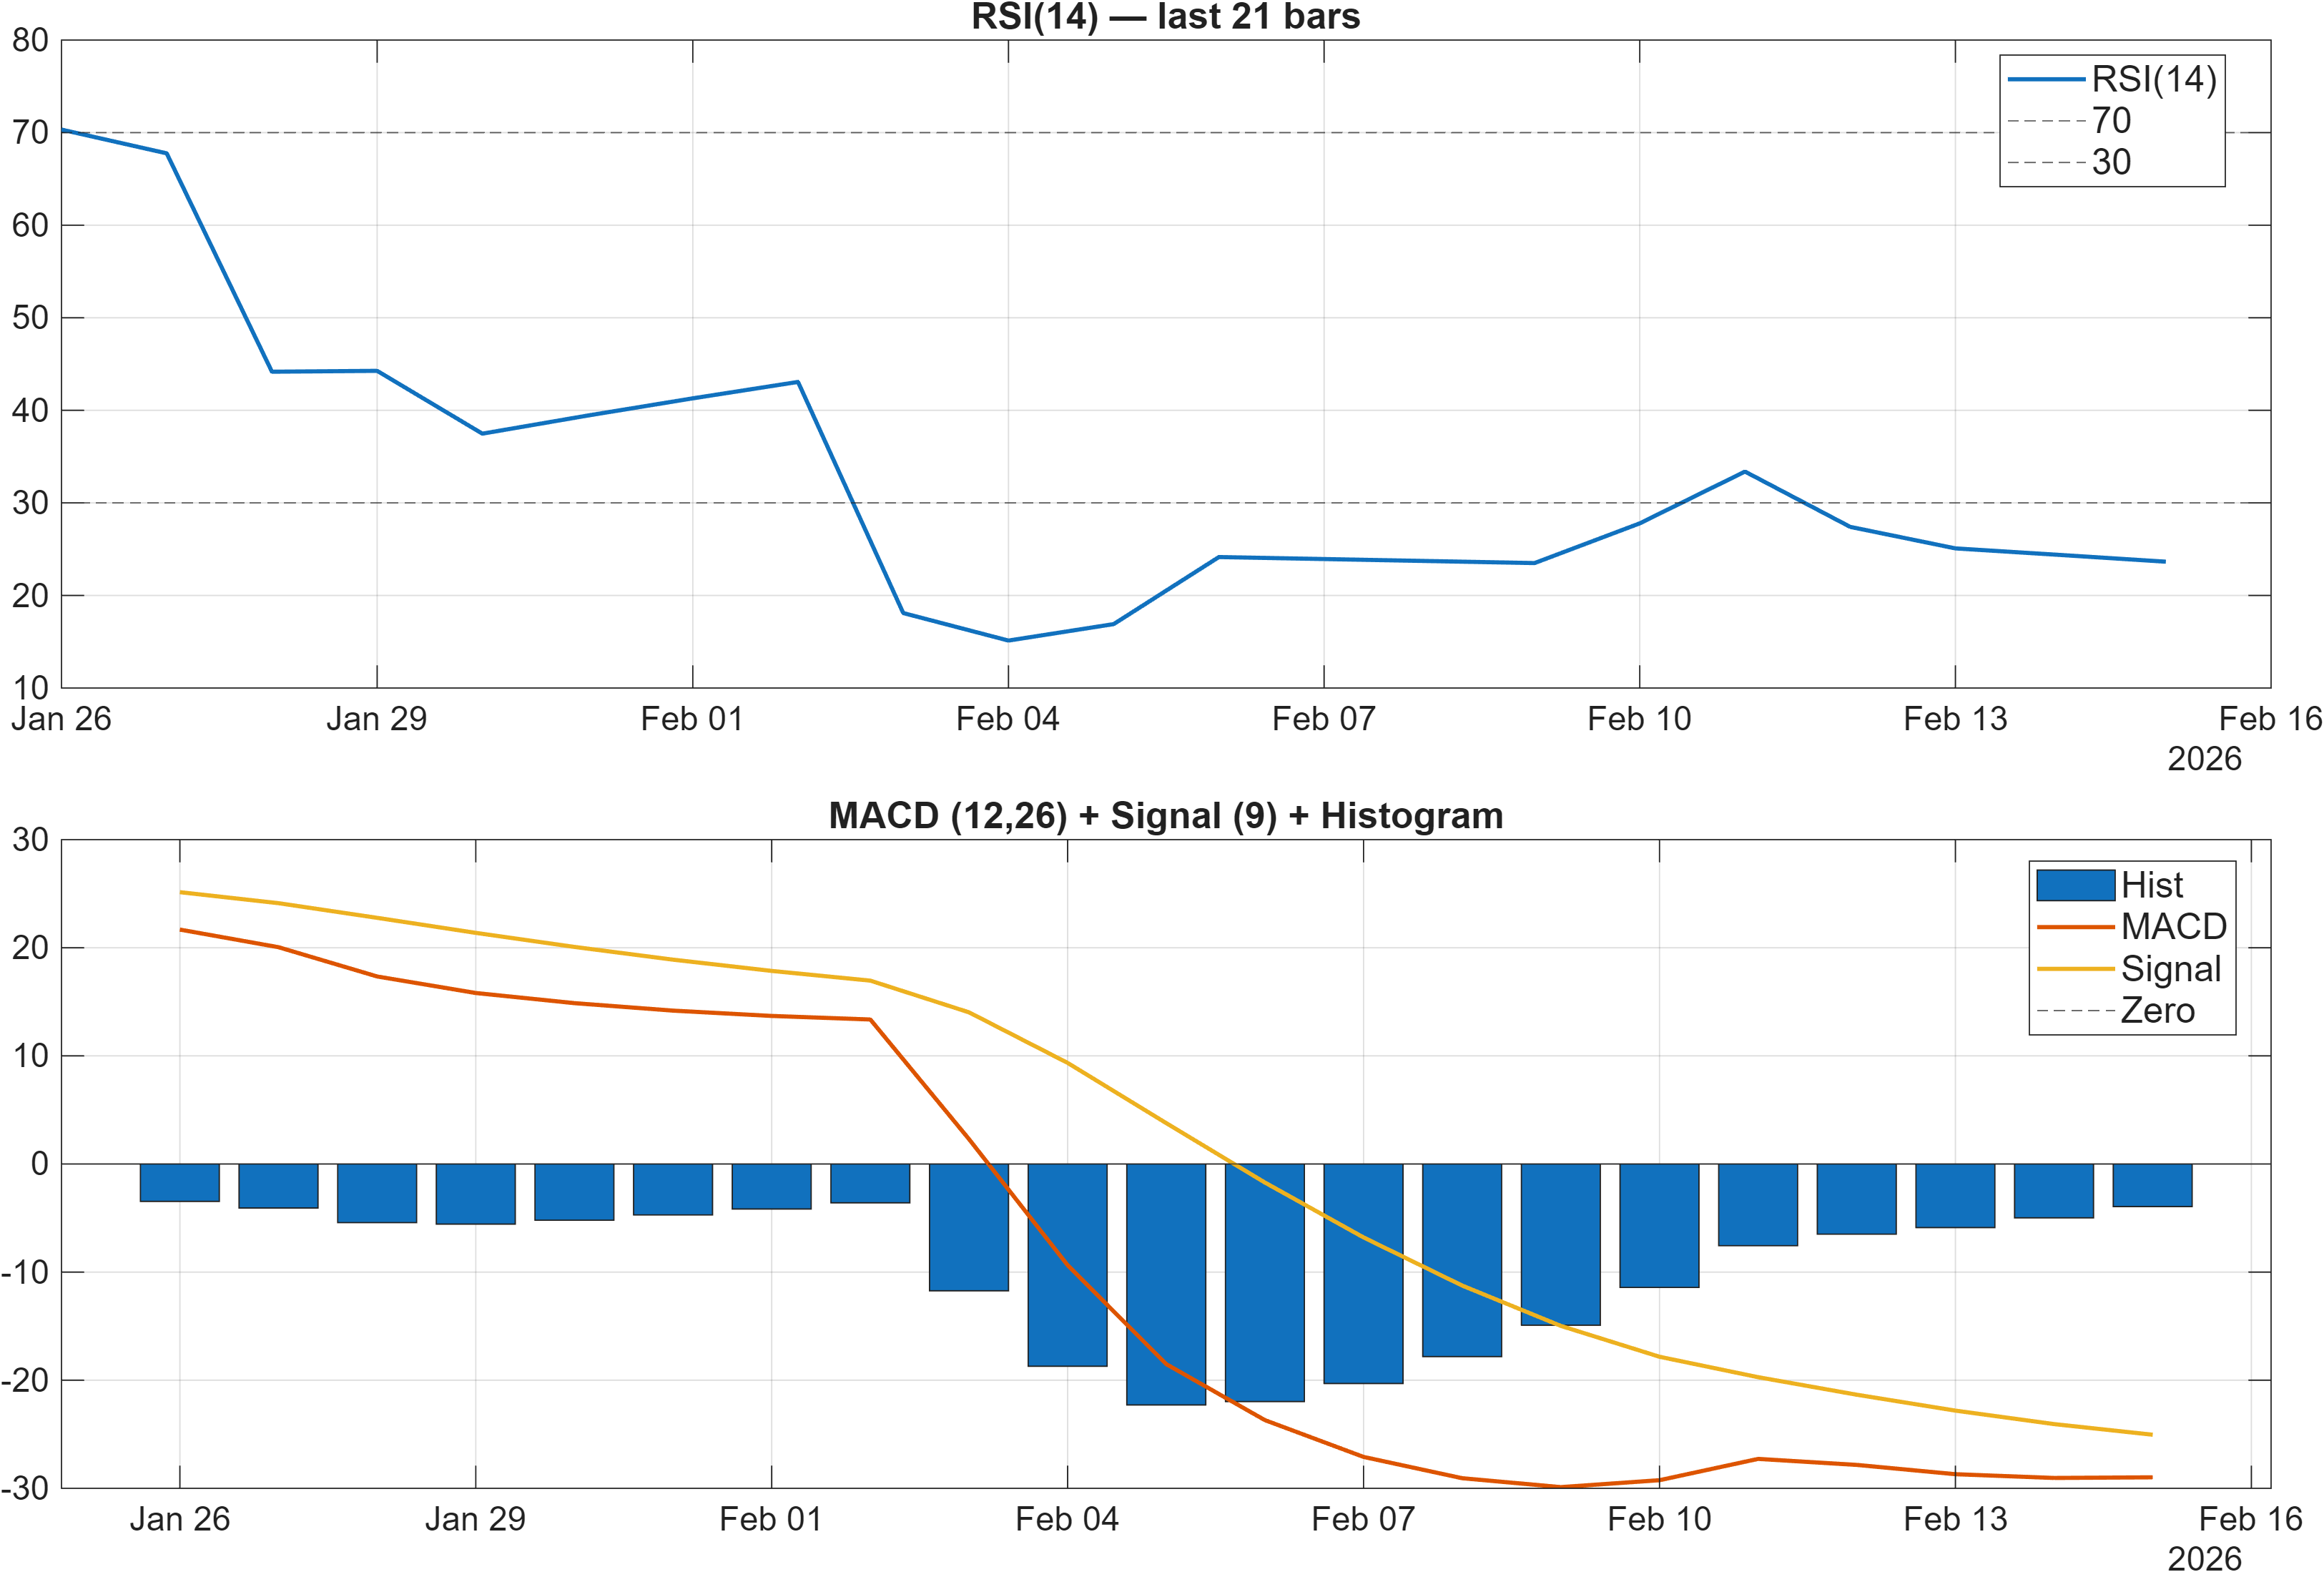
Interpretation: RSI bias = Bearish, MACD hist = -3.9386.
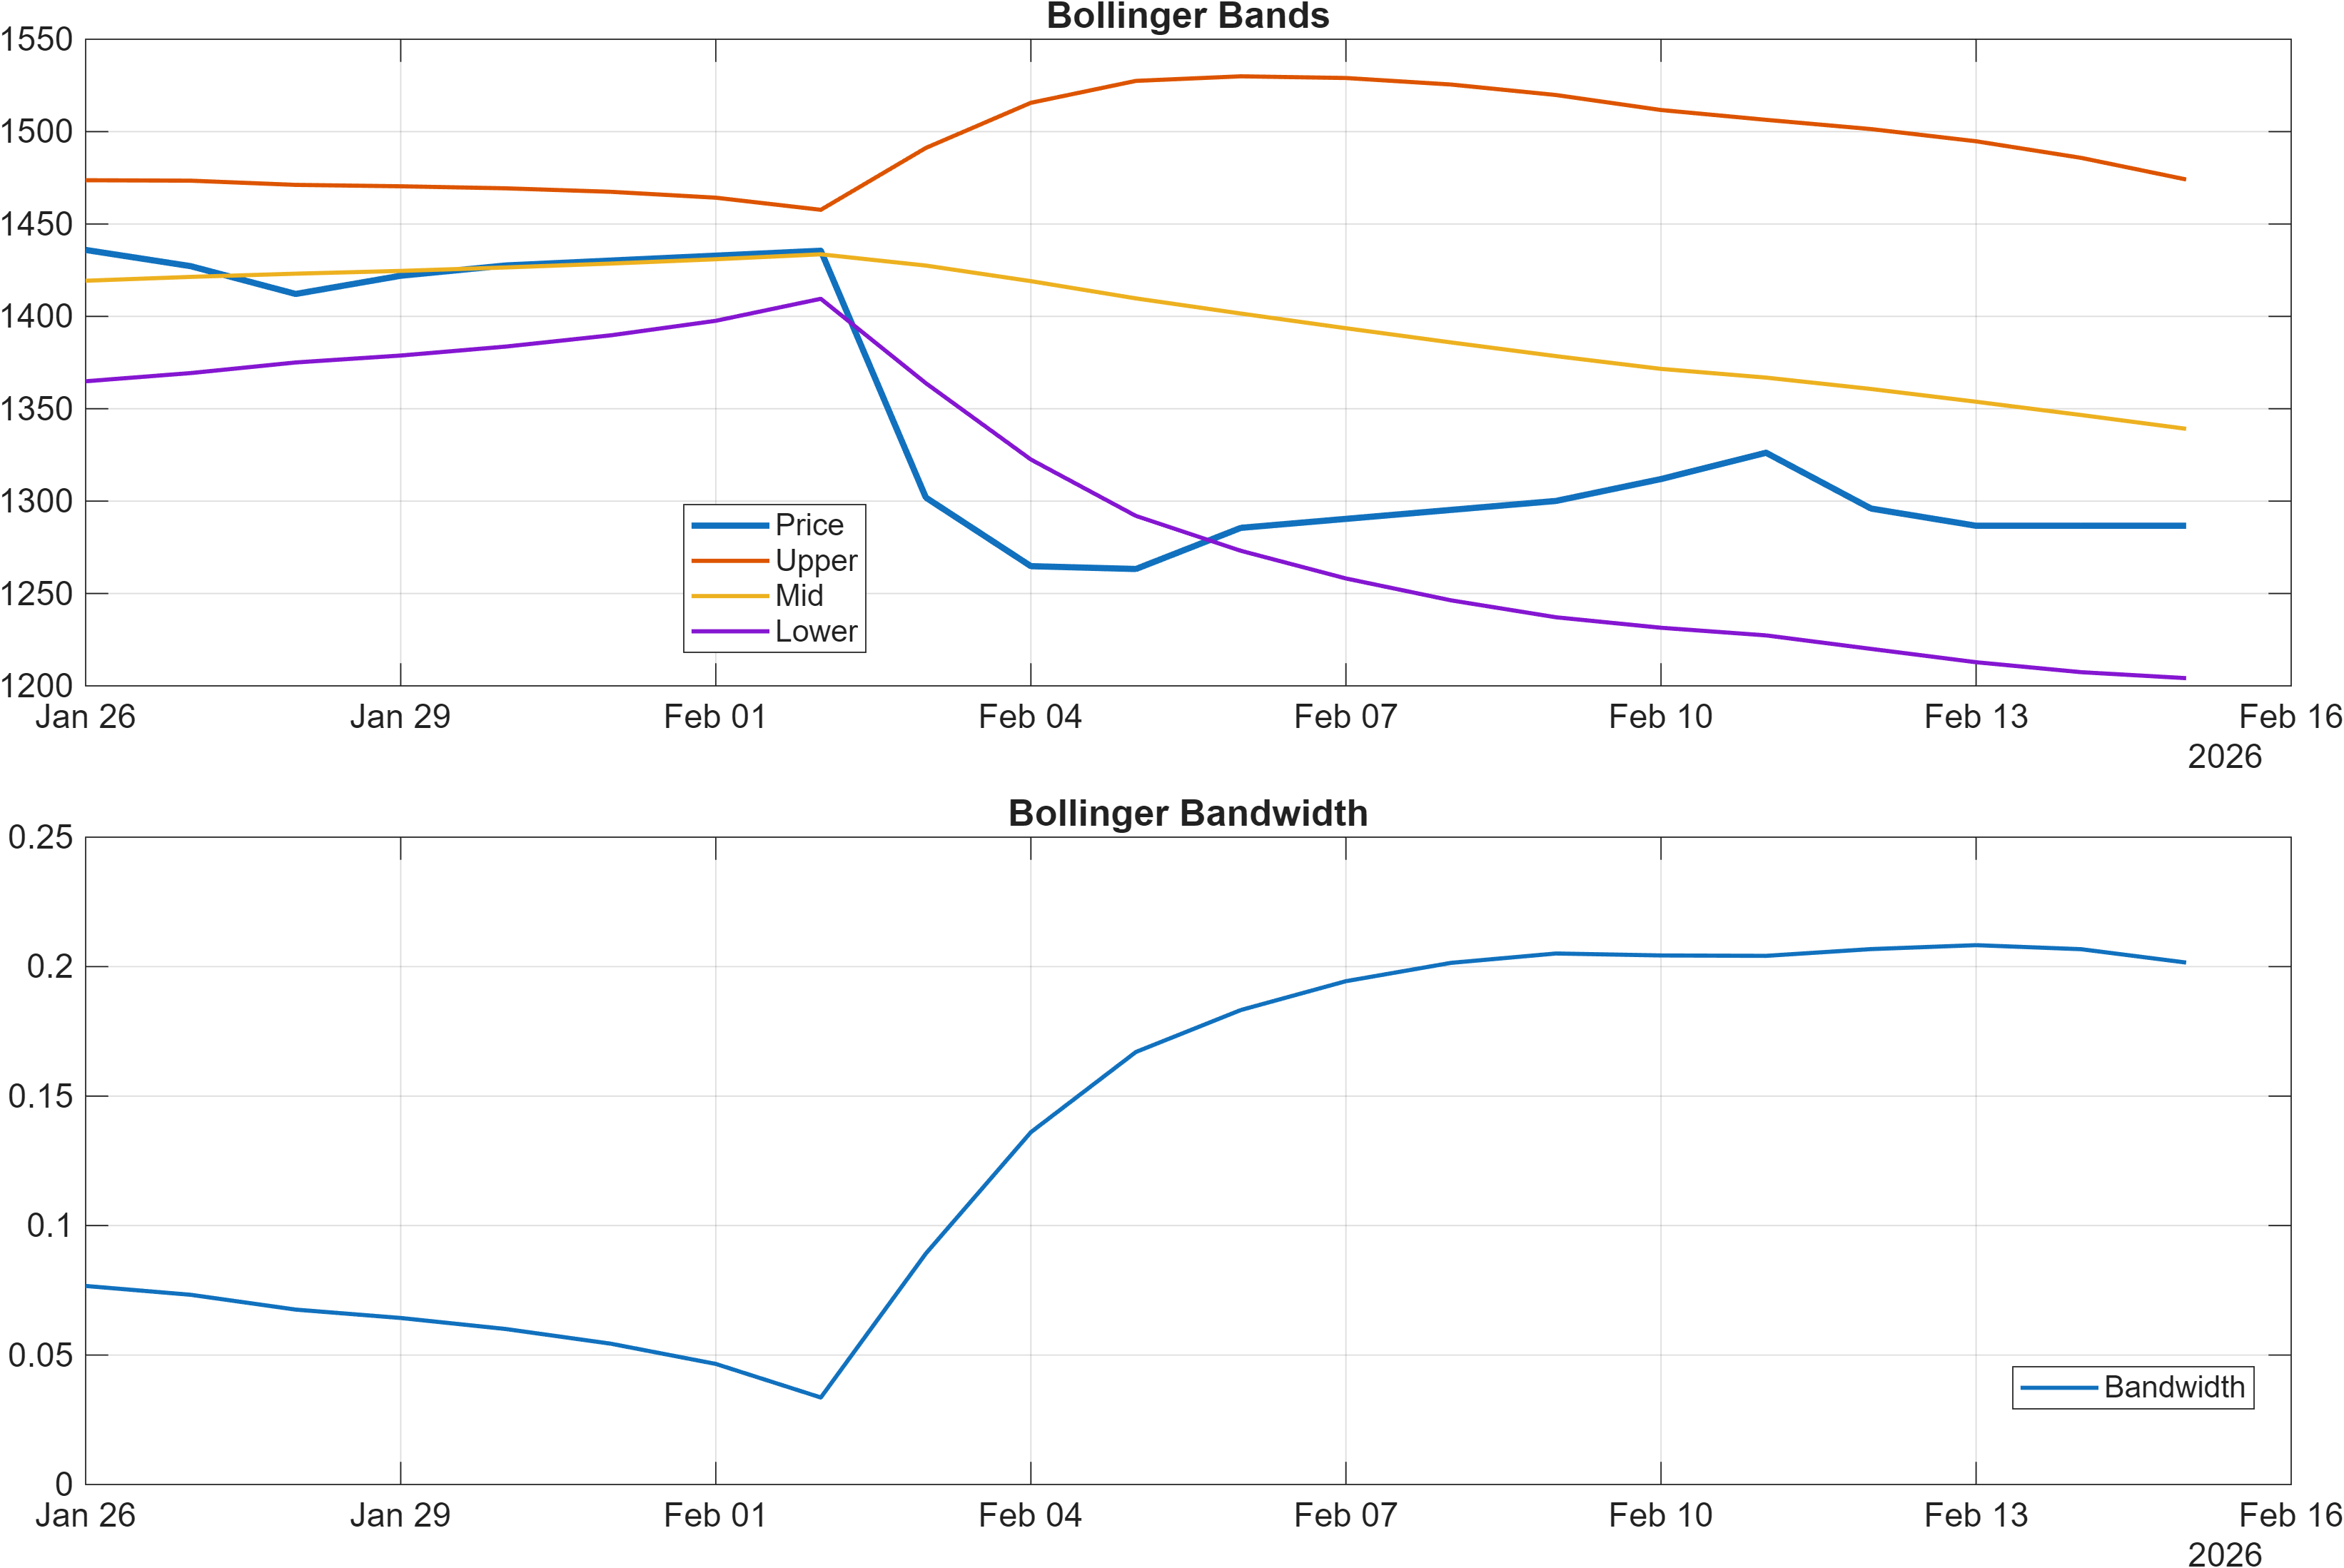
Interpretation: Bandwidth (volatility regime) latest = 0.2016.
Momentum is currently the most cautionary part of TDG’s technical picture. RSI(14) at 23.65 and a Bearish RSI bias indicate a heavily compressed momentum state, while the MACD histogram at -3.9386 reinforces that downside impulse has recently dominated. In isolation, those readings can be associated with exhaustion; however, the report’s broader scoring keeps the net technical stance Neutral, implying that other components are offsetting the momentum drag rather than fully confirming a downside trend.
Volatility context matters for interpreting signal reliability. Bollinger bandwidth at 0.2016 suggests a moderate regime rather than a clear volatility expansion spike. When momentum weakens without a sharp volatility blowout, markets can shift into range negotiation rather than immediate capitulation—especially when long-horizon ranks remain strong (e.g., #6 on the 3-month horizon).
From a trading-structure perspective, the key question is whether momentum begins to recover before price reaches support. A stabilization in momentum alongside a defense of 1268.2183 would better align with the bullish rank profile. Conversely, persistent negative momentum while approaching that level raises the probability that support becomes a high-activity test rather than a clean floor, increasing the importance of confirmation from volume behavior and follow-through.
4) Support / Resistance zones
Support ~ 1268.2183 | Resistance ~ 1453.1250
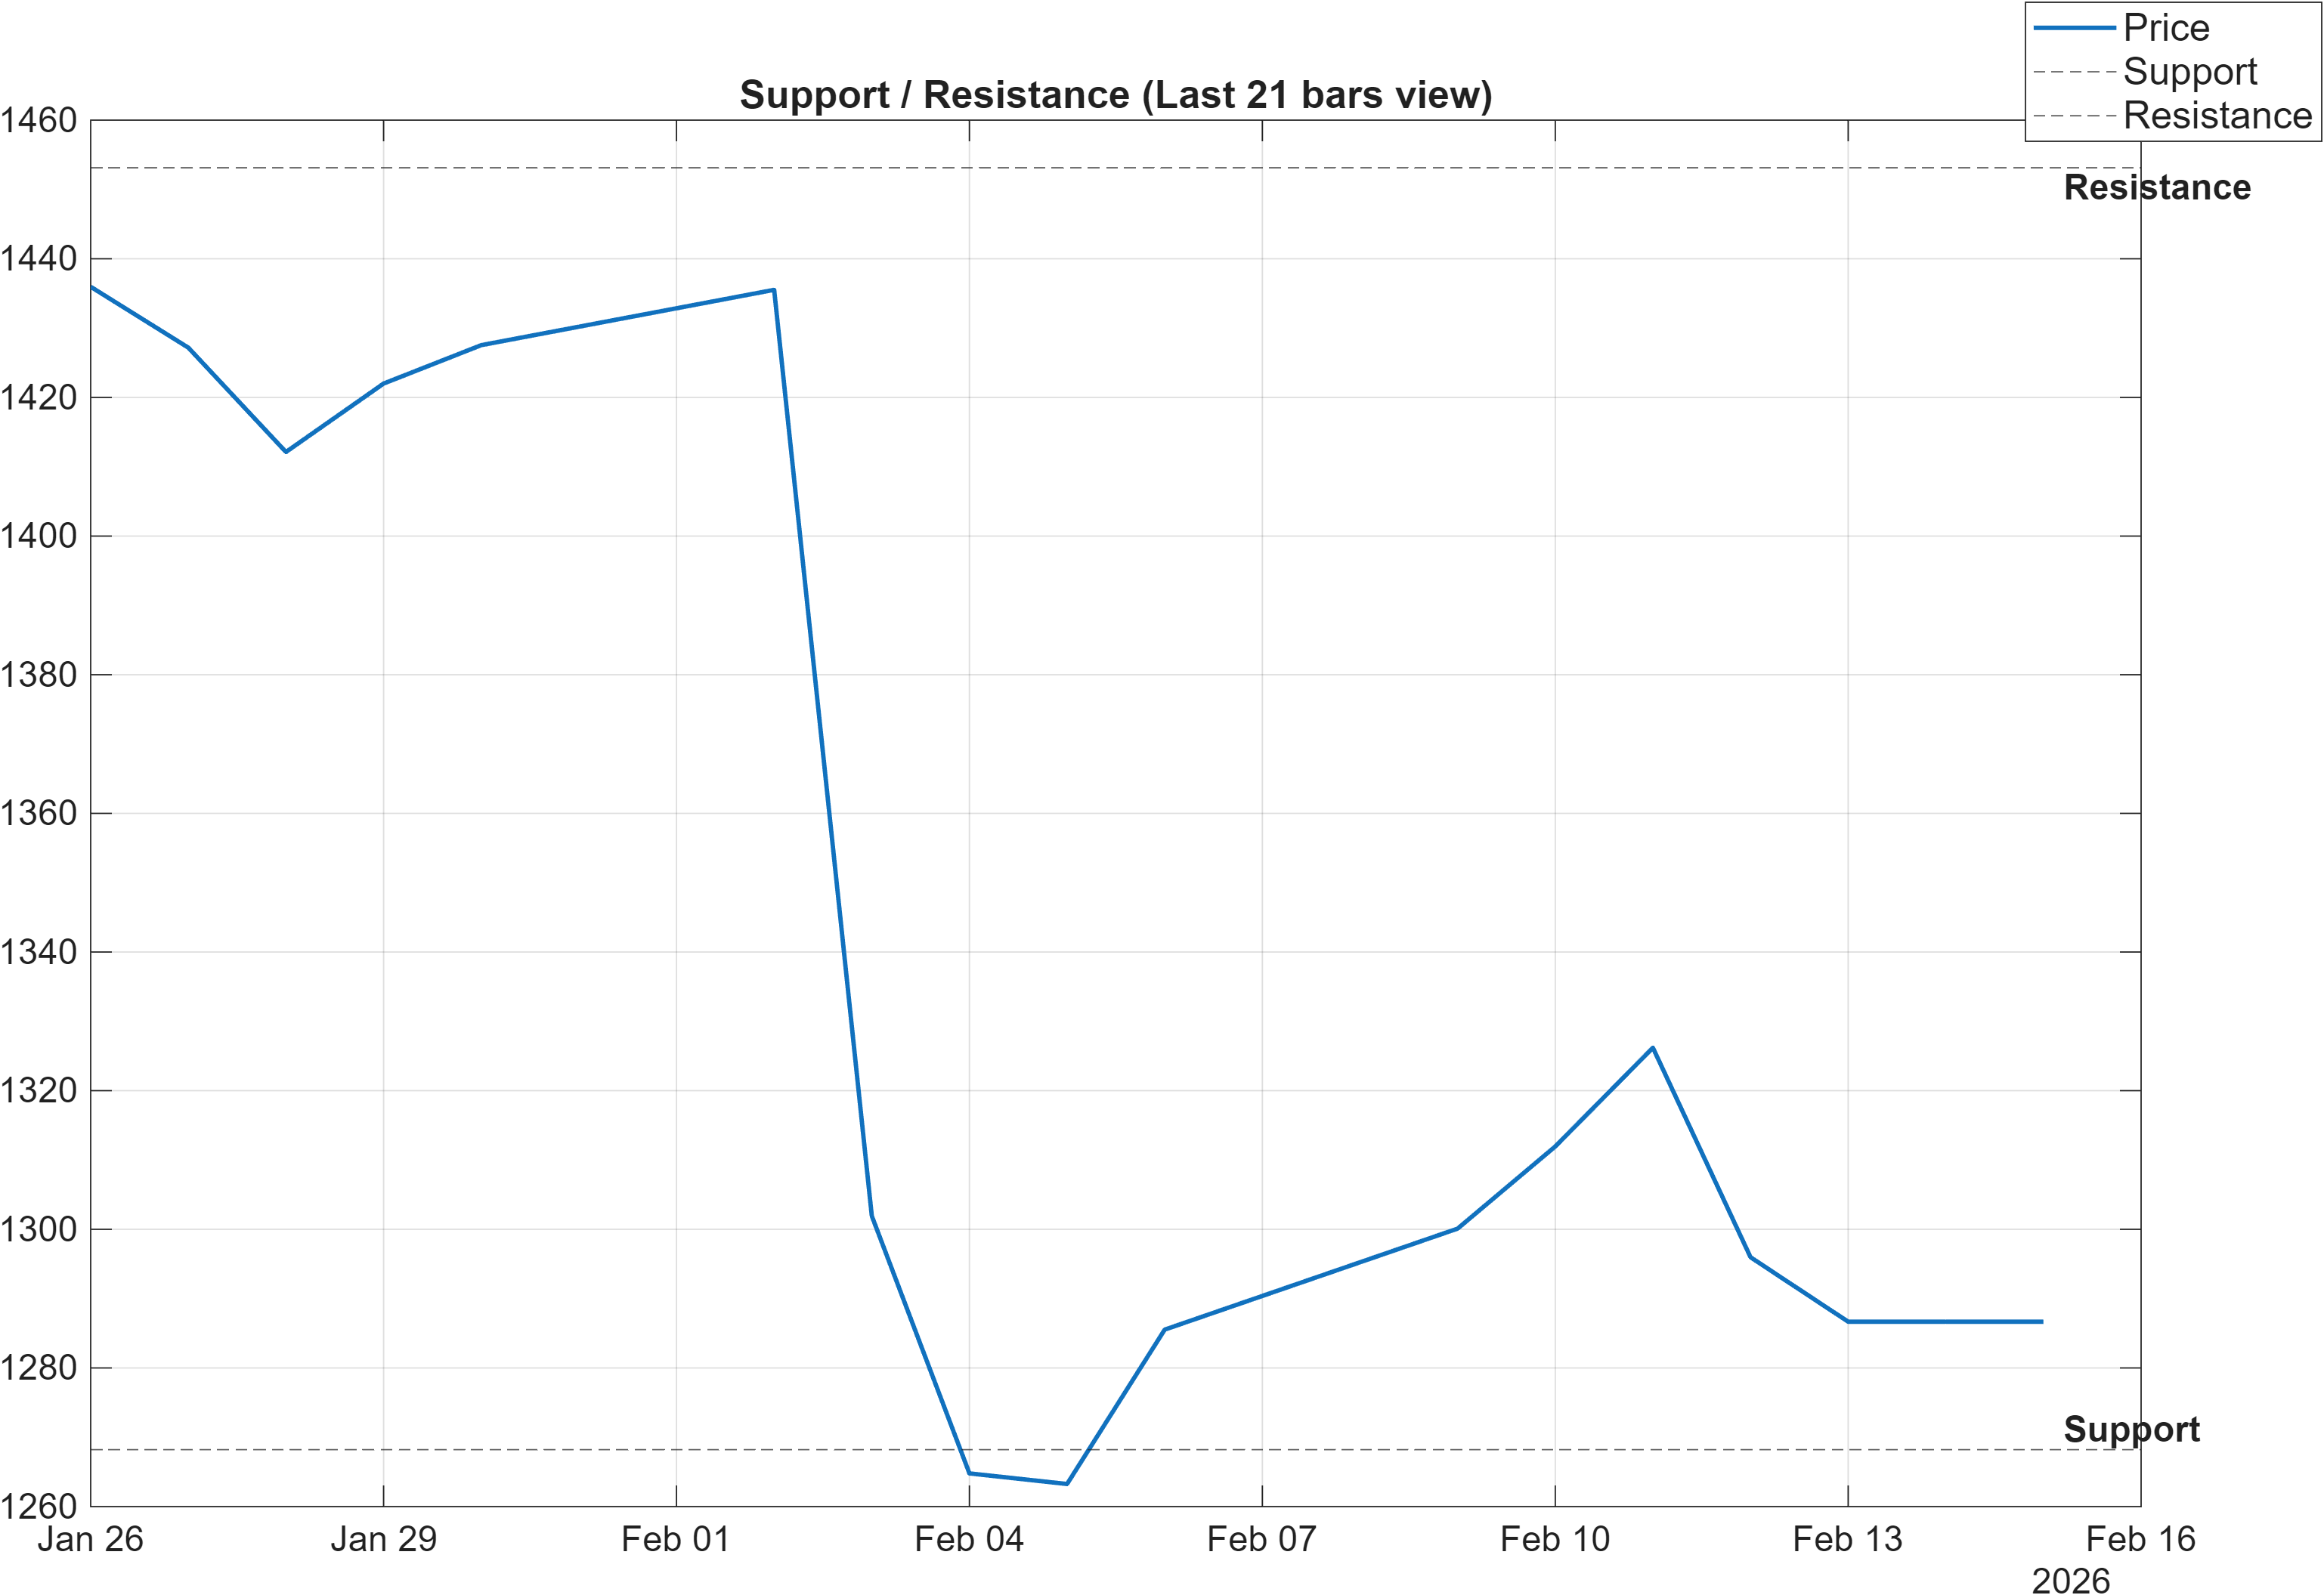
Scenario view: Break above resistance with volume → continuation. Close below support → signal deterioration risk.
TDG’s technical narrative compresses cleanly into two price-defined decision zones: 1268.2183 (support) and 1453.1250 (resistance). With momentum readings depressed (RSI(14) 23.65; MACD histogram -3.9386), these levels become more than reference points—they define where the market either converts weakness into a durable base or extends weakness into a broader deterioration.
The rank backdrop remains constructive (daily #35, 3-month #6 out of 2075), so a support defense would fit the idea that the current move is a pullback within a stronger relative trend. In that scenario, the next analytical hurdle is not simply “bounce,” but whether price can reclaim enough upside control to challenge 1453.1250 and absorb supply with participation.
On the other side, the report explicitly flags a close below 1268.2183 as deterioration risk. Given the overall technical score is -0.249 (Neutral) rather than bullish, a failure at support would also reduce the benefit of the doubt granted by the strong ranks and could bring the longer-horizon signal alignment into question. Until either boundary is resolved, TDG is best treated as a market negotiating between structural support and overhead resistance rather than one offering a single-direction technical message.
5) Quant Technical Dashboard (18 Signals)
KGNAI AI Technical Analysis Score (Deep Reinforcement Learning): Rank #1765 out of 2075 (Rank 1 represents the strongest technical positioning and a higher probability of favorable price behavior. As ranks increase toward the maximum, the probability of favorable outcomes weakens and bearish positioning becomes more dominant.) | Label: Bearish | Score: -0.701
18-Signal Technical Confluence Score: -0.056 (Neutral)
Overall Technical Score (18-signal confluence + DRL rank blend): -0.249 (Neutral)
Note: The blended score reflects signal strength weighted against broader AI technical ranking, which may temporarily diverge.
Blended technical score breakdown: -0.249 (Neutral | Bull 6 / Bear 7 / Neutral 5)
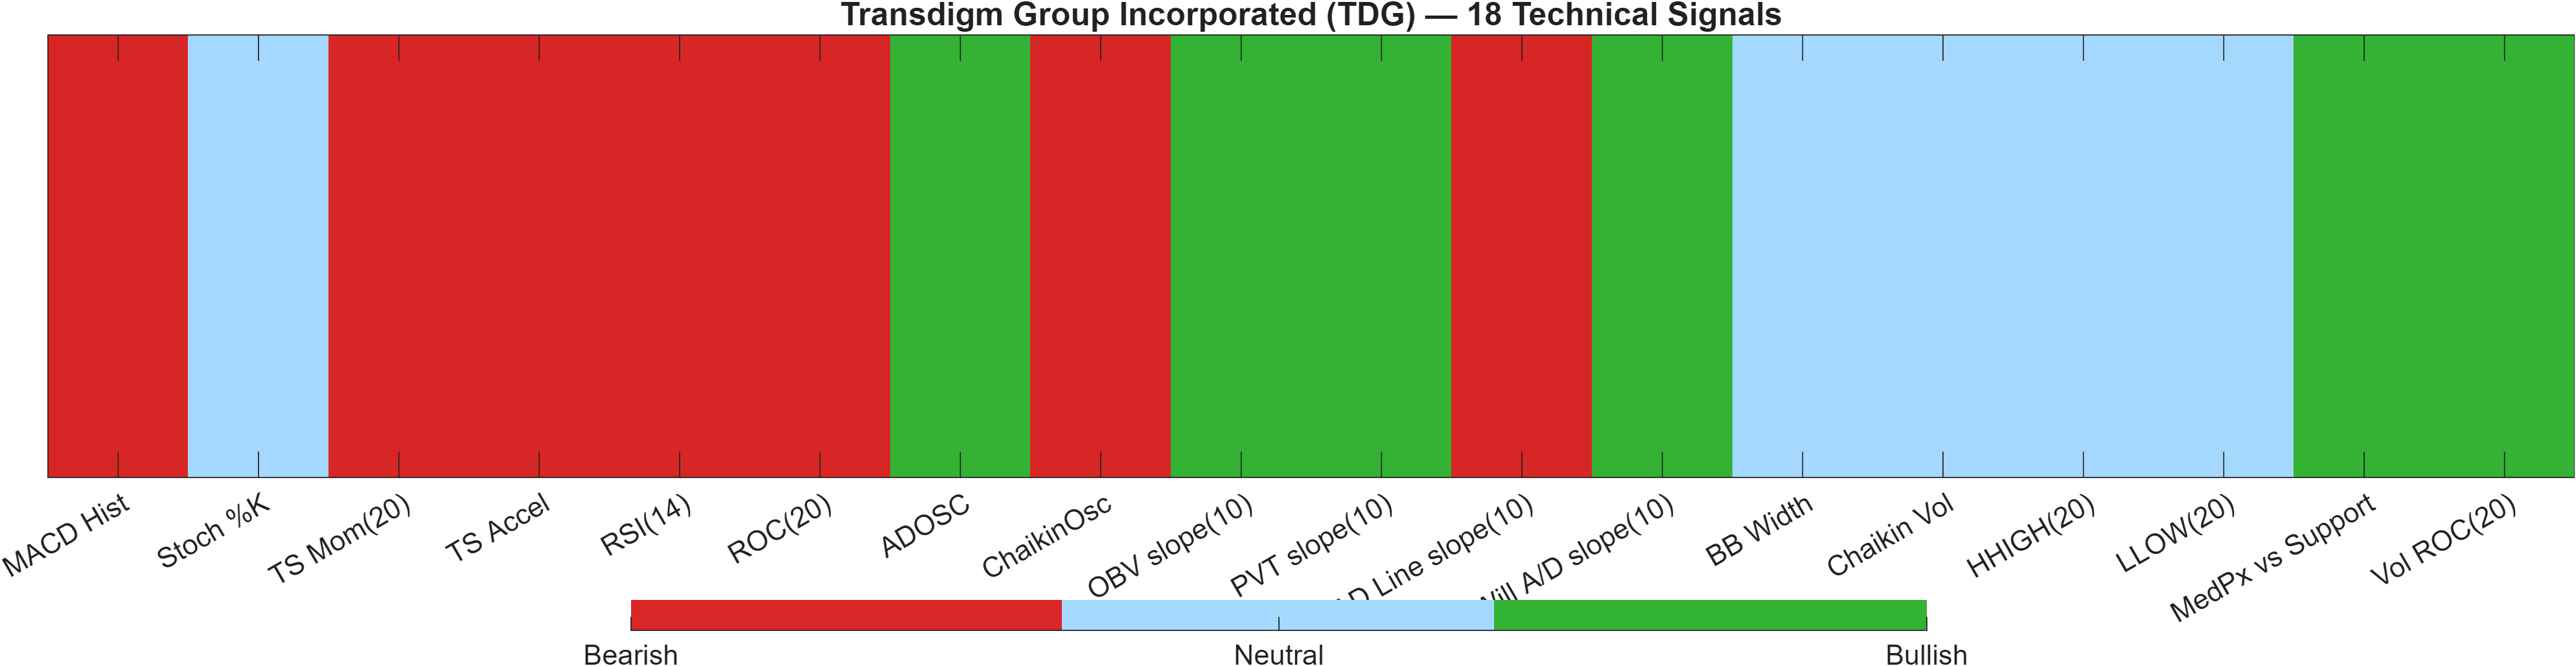
Signal table (Bull/Bear/Neutral)
| Indicator | Value | Signal |
|---|---|---|
| MACD Hist | -3.939 | Bearish |
| Stoch %K | 23.58 | Neutral |
| TS Mom(20) | -140.5 | Bearish |
| TS Accel | -190.3 | Bearish |
| RSI(14) | 23.65 | Bearish |
| ROC(20) | -9.845 | Bearish |
| ADOSC | 27.74 | Bullish |
| ChaikinOsc | -2.189e+05 | Bearish |
| OBV slope(10) | 1.598e+06 | Bullish |
| PVT slope(10) | 6018 | Bullish |
| AD Line slope(10) | -4.311e+05 | Bearish |
| Will A/D slope(10) | 40.97 | Bullish |
| BB Width | 0.2016 | Neutral |
| Chaikin Vol | -6.54 | Neutral |
| HHIGH(20) | 1449 | Neutral |
| LLOW(20) | 1246 | Neutral |
| MedPx vs Support | 31.5 | Bullish |
| Vol ROC(20) | 10.27 | Bullish |
Interpretation: Indicator-level signals form the base confluence, which is then adjusted using a separate AI-driven technical ranking model. The final technical score summarizes this combined view.
The quant dashboard highlights a two-layer divergence. On one layer, the 18-signal confluence is nearly flat at -0.056 (Neutral), reflecting a mixed signal stack (Bull 6 / Bear 7 / Neutral 5). On the second layer, the separate DRL technical model is materially weaker: rank #1765 out of 2075, label Bearish, score -0.701. The blend of these two produces the overall technical score of -0.249 (Neutral), which is best read as “non-confirmation” rather than a bullish technical endorsement.
Within the signal set, momentum remains the main drag (RSI(14) 23.65, ROC(20) -9.845, TS Mom(20) -140.5). Yet several participation/flow proxies are constructive—ADOSC 27.74, OBV slope(10) 1.598e+06, and PVT slope(10) 6018 are each flagged Bullish. That split can occur when selling pressure is fading but price has not yet re-established upside traction.
The implication is a market where confirmation should be sought through price acceptance around the defined levels rather than through a single oscillator turning. If TDG can stabilize while maintaining respect for 1268.2183, the bullish longer-horizon ranks have room to reassert. If not, the DRL model’s bearish posture becomes more relevant as a regime-warning overlay.
6) News sentiment + extractive gist
Sentiment score (avg): 0.092 | Positive: 35% | Neutral: 65% | Negative: 0%
KGNAI AI News Sentiment Score (normalized -1 to +1): 1.00 (as of 2026-02-14) | Label: Bullish | Overall news score: 0.97
Positive Developments
Recent coverage across major financial outlets indicates a broadly constructive tone around TDG, with the aggregated news mix showing 35% positive items and 0% negative items, consistent with an average sentiment score of 0.092. Commentary has emphasized company updates around operating performance narratives and the market’s continued focus on aftermarket dynamics, which tends to be a recurring discussion point for the name. In the KGNAI normalization, the news sentiment signal reads 1.00 (as of 2026-02-14) with an overall news score of 0.97, producing a Bullish label at the model level. Against the technical backdrop—overall technical -0.249 (Neutral)—this supportive sentiment acts more as a stabilizer than a standalone catalyst, and it places greater emphasis on whether price can defend 1268.2183 and rebuild toward 1453.1250.
Neutral / Mixed Developments
The neutral bucket remains dominant at 65%, implying that much of the discourse is informational rather than direction-setting. That distribution often coincides with a market waiting for price confirmation—particularly relevant here given the mixed trend read (close vs MA50 Bearish, MA50 vs MA200 Bullish) and depressed momentum signals such as RSI(14) 23.65. In this environment, neutral coverage can still matter by shaping expectations and reinforcing what investors are watching, but it does not necessarily resolve the technical decision currently framed by support ~1268.2183 and resistance ~1453.1250. With Bollinger bandwidth at 0.2016, the market does not appear to be in a high-volatility information shock; instead, the news mix looks consistent with incremental digestion of developments rather than a single dominating narrative.
Negative / Risk Signals
While the quantified news classification shows 0% negative items, risk framing still exists in the form of discussion around expectations, valuation sensitivity, and the implications of recent price weakness. This matters because the technical layer is not aligned as bullish: the DRL technical rank is #1765 out of 2075 (Bearish), and momentum gauges remain soft (MACD histogram -3.9386; ROC(20) -9.845). In other words, “no negative news” does not automatically remove market risk when price action is still negotiating trend control. The cleanest risk signal in this report remains structural: a close below 1268.2183 would increase deterioration odds, while failure to regain traction toward 1453.1250 keeps the rebound thesis unconfirmed.
- Price behavior around 1268.2183 (support) for acceptance vs breakdown.
- Follow-through and participation on any push toward 1453.1250 (resistance).
- Whether momentum (RSI(14) 23.65, MACD histogram -3.9386) stabilizes alongside steady volatility (BB width 0.2016).
Sources referenced: Reuters, Bloomberg, Yahoo Finance, MarketWatch, Investing.com
7) Sources
Not available in the provided data.
You may also like: How KGNAI AI ranks instruments across global markets
Disclaimer: KGNAI provides AI-generated analytics and educational market commentary only. This is not financial advice. Markets involve risk. Always do your own research.