
600015 (Hua Xia Bank Co Ltd) — 13-Mar-2026 Quant Signal Review with Neutral Ranks and Bullish Technical Confluence
Summary (as of 13-Mar-2026): Hua Xia Bank Co Ltd (600015) is currently characterized by a neutral cross-sectional rank profile across the short, mid, and long horizons, while the technical layer leans bullish on signal breadth. In the KGNAI universe of 1293 China-listed instruments, the daily rank (#278), weekly rank (#266), and monthly rank (#309) cluster in the upper portion of the distribution rather than the top decile—suggesting neither standout leadership nor broad weakness. By contrast, the 3-month rank (#87) sits materially stronger, pointing to an intermediate window where relative behavior has improved. Technically, the blended framework flags a Bullish confluence even as the deep-learning technical rank remains Neutral at #298, creating a useful “alignment check” between classical indicators (RSI/MACD/Bollinger structure) and broader cross-sectional regime scoring. Key decision zones remain clearly defined near 6.3300 (support) and 6.8950 (resistance), while news sentiment is mostly neutral (avg 0.013) and sector/broader-market oriented.
Key Takeaways
- Rank stance (Short / Mid / Long): Neutral / Neutral / Neutral (daily #278, monthly #309, yearly #295 out of 1293).
- Technical confluence: Bullish (18-signal confluence 0.444; blended technical 0.473).
- Key levels: Support ~ 6.3300 | Resistance ~ 6.8950.
- News sentiment bias: Neutral (avg 0.013; 81% neutral share).
- Confirmation / invalidation: Strength is better supported on a sustained push above 6.8950 with volume; deterioration risk increases on a close below 6.3300.
What KGNAI Measures
KGNAI evaluates assets using large cross-sectional datasets built from millions of structured data points. Inputs incorporate fundamental metrics, technical structures, and systematically processed news sentiment. Statistical models, machine learning, and AI frameworks are used to assess relative positioning, signal alignment, and probabilistic behavior across broad universes.
How to Read This Report
- Ranks are comparative across the tracked universe, not absolute price targets.
- Confluence reflects alignment among independent signal groups.
- Support/resistance levels are probabilistic decision zones, not guarantees.
- Sentiment provides contextual bias within the broader analytical framework.
1) KGNAI AI Analysis
Region: CHINA
Total universe size: 1293 ranked instruments
- Daily rank: #278 out of 1293 — Neutral
- Weekly rank: #266 out of 1293 — Neutral
- Monthly rank: #309 out of 1293 — Neutral
- 3-Monthly rank: #87 out of 1293 — Bullish
- 6-Monthly rank: #503 out of 1293 — Neutral
- Yearly rank: #295 out of 1293 — Neutral
Cross-horizon ranks are best read as relative positioning rather than directional conviction. Here, 600015 sits consistently neutral in the daily/weekly/monthly windows (e.g., #278, #266, #309), which typically corresponds to “market-like” behavior: neither persistent leadership nor structural underperformance versus peers in the 1293-instrument universe.
The notable exception is the 3-month rank (#87), which shifts the intermediate profile into a Bullish bracket. In cross-sectional terms, that places the instrument closer to the top decile than the median, signaling that—over this specific horizon—price behavior has been comparatively stronger. The 6-month rank (#503) returning to neutral reduces the likelihood that the 3-month strength is a clean, uninterrupted regime; instead, it fits a pattern where intermediate momentum can emerge while the broader window remains mixed.
From a process standpoint, the key analytical question is whether the intermediate improvement can “pull” the shorter horizons higher. If daily/weekly ranks remain anchored around the current band (mid-to-upper quartile), the most consistent interpretation is a range-bound relative profile with episodic bursts of strength. The term view provided remains Neutral across short, mid, and long horizons, reinforcing that the rank layer is not yet confirming a sustained leadership regime.
KGNAI ranks each instrument across large universes using multiple proprietary AI tests and statistical models (millions of data points). Lower ranks generally indicate stronger probability of favorable performance behavior, while higher ranks indicate weaker probability and more bearish positioning.
Term view: Short-term: Neutral. Mid-term: Neutral. Long-term: Neutral.
Want the full universe and complete rank tables? Unlock full access on KGNAI: https://www.kgnai.com/pricing
2) Price & trend overview
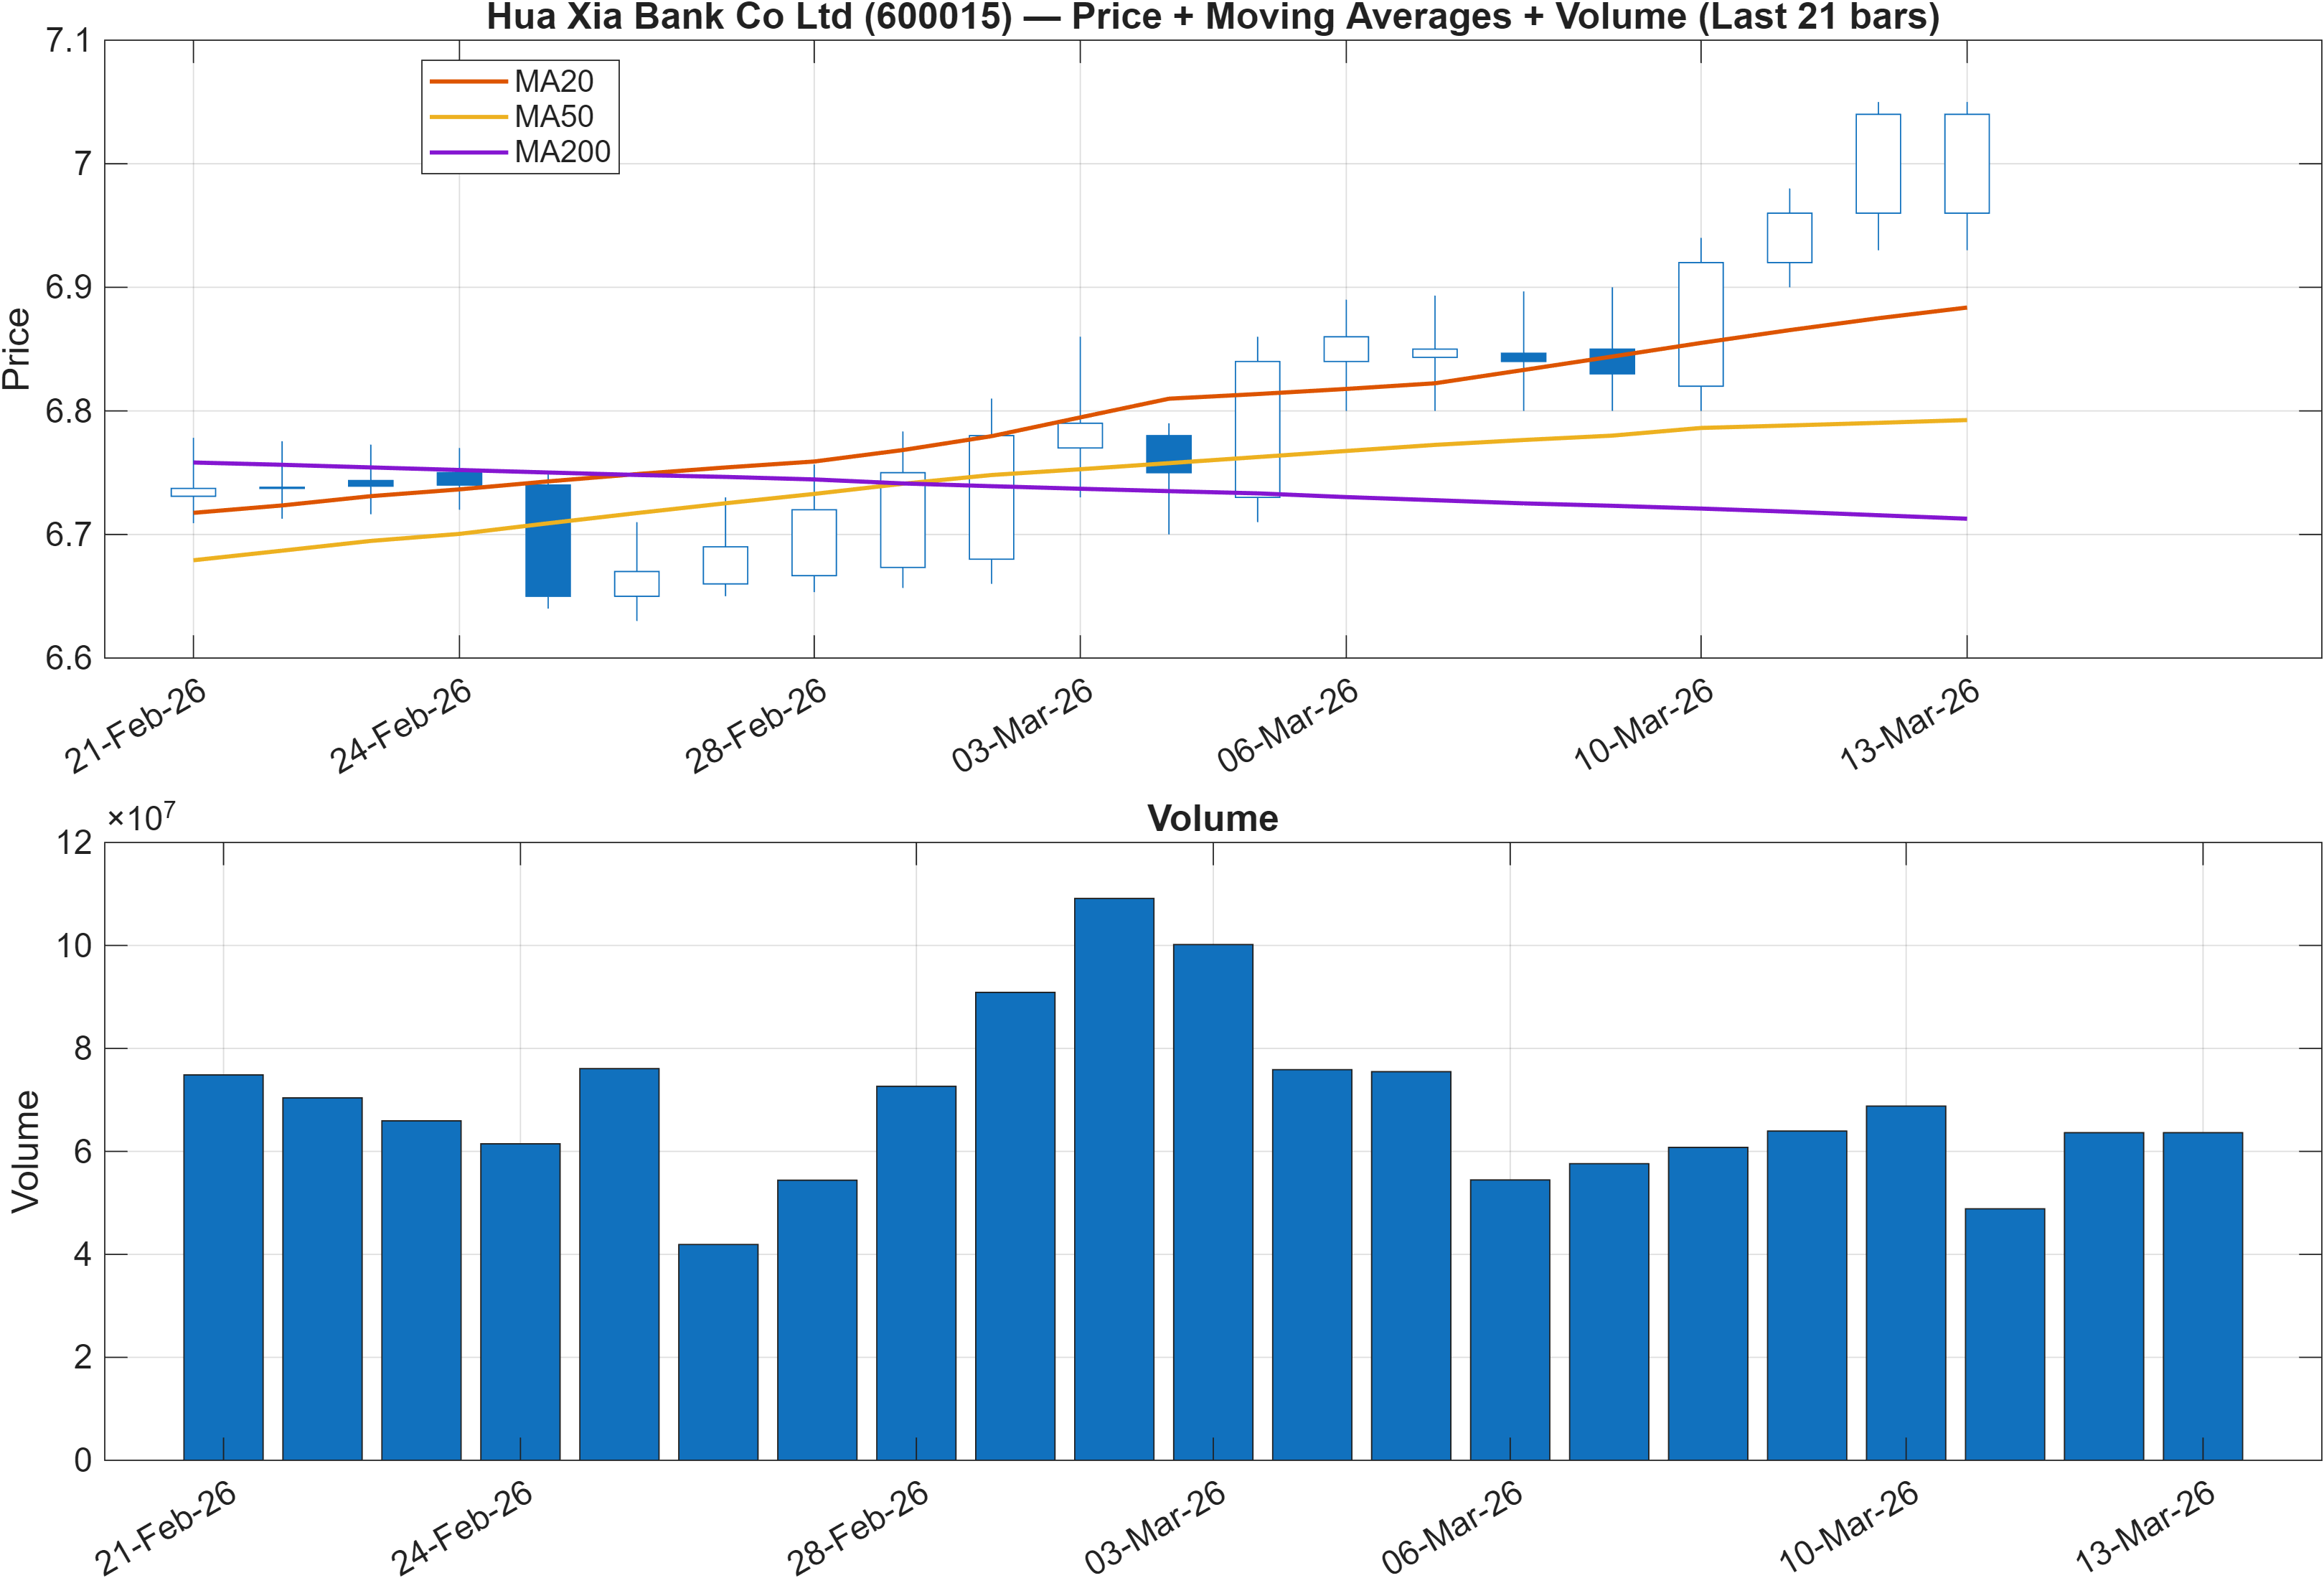
Interpretation: Close vs MA50 = Bullish, MA50 vs MA200 = Bullish.
The trend read from moving averages is constructive: the close is positioned above MA50 and MA50 above MA200, a configuration that typically signals trend persistence rather than mean-reversion dominance. However, ranks remain neutral (e.g., daily #278, monthly #309), which implies that—even with supportive trend structure—the instrument is not yet exhibiting standout cross-sectional strength versus peers.
This is a common “structure vs positioning” split: the chart can look technically orderly while the relative-rank layer stays moderate because other instruments in the same universe are also trending, or because volatility/participation is not differentiating. That interpretation is consistent with the volatility regime referenced elsewhere (Bollinger bandwidth 0.0657), which aligns more with controlled movement than expansionary breakouts.
In practical market-structure terms, price action that holds above key moving averages tends to attract systematic and discretionary demand on pullbacks, but it can also become susceptible to overextension resets if momentum indicators reach extreme territory (the RSI reading later at 85.71 is relevant). As a result, the moving-average configuration is best treated as a trend filter, while the higher-frequency oscillators and the 6.3300 / 6.8950 level map define the decision zones for continuation vs consolidation.
Net: the trend layer is supportive, but the neutral ranks suggest the market is still treating 600015 as a participating name rather than a clear leader. Confirmation would come from continued orderly structure plus improvement in shorter-horizon rank placement (e.g., daily/weekly moving toward the top decile rather than holding near current levels).
3) Momentum & volatility dashboard
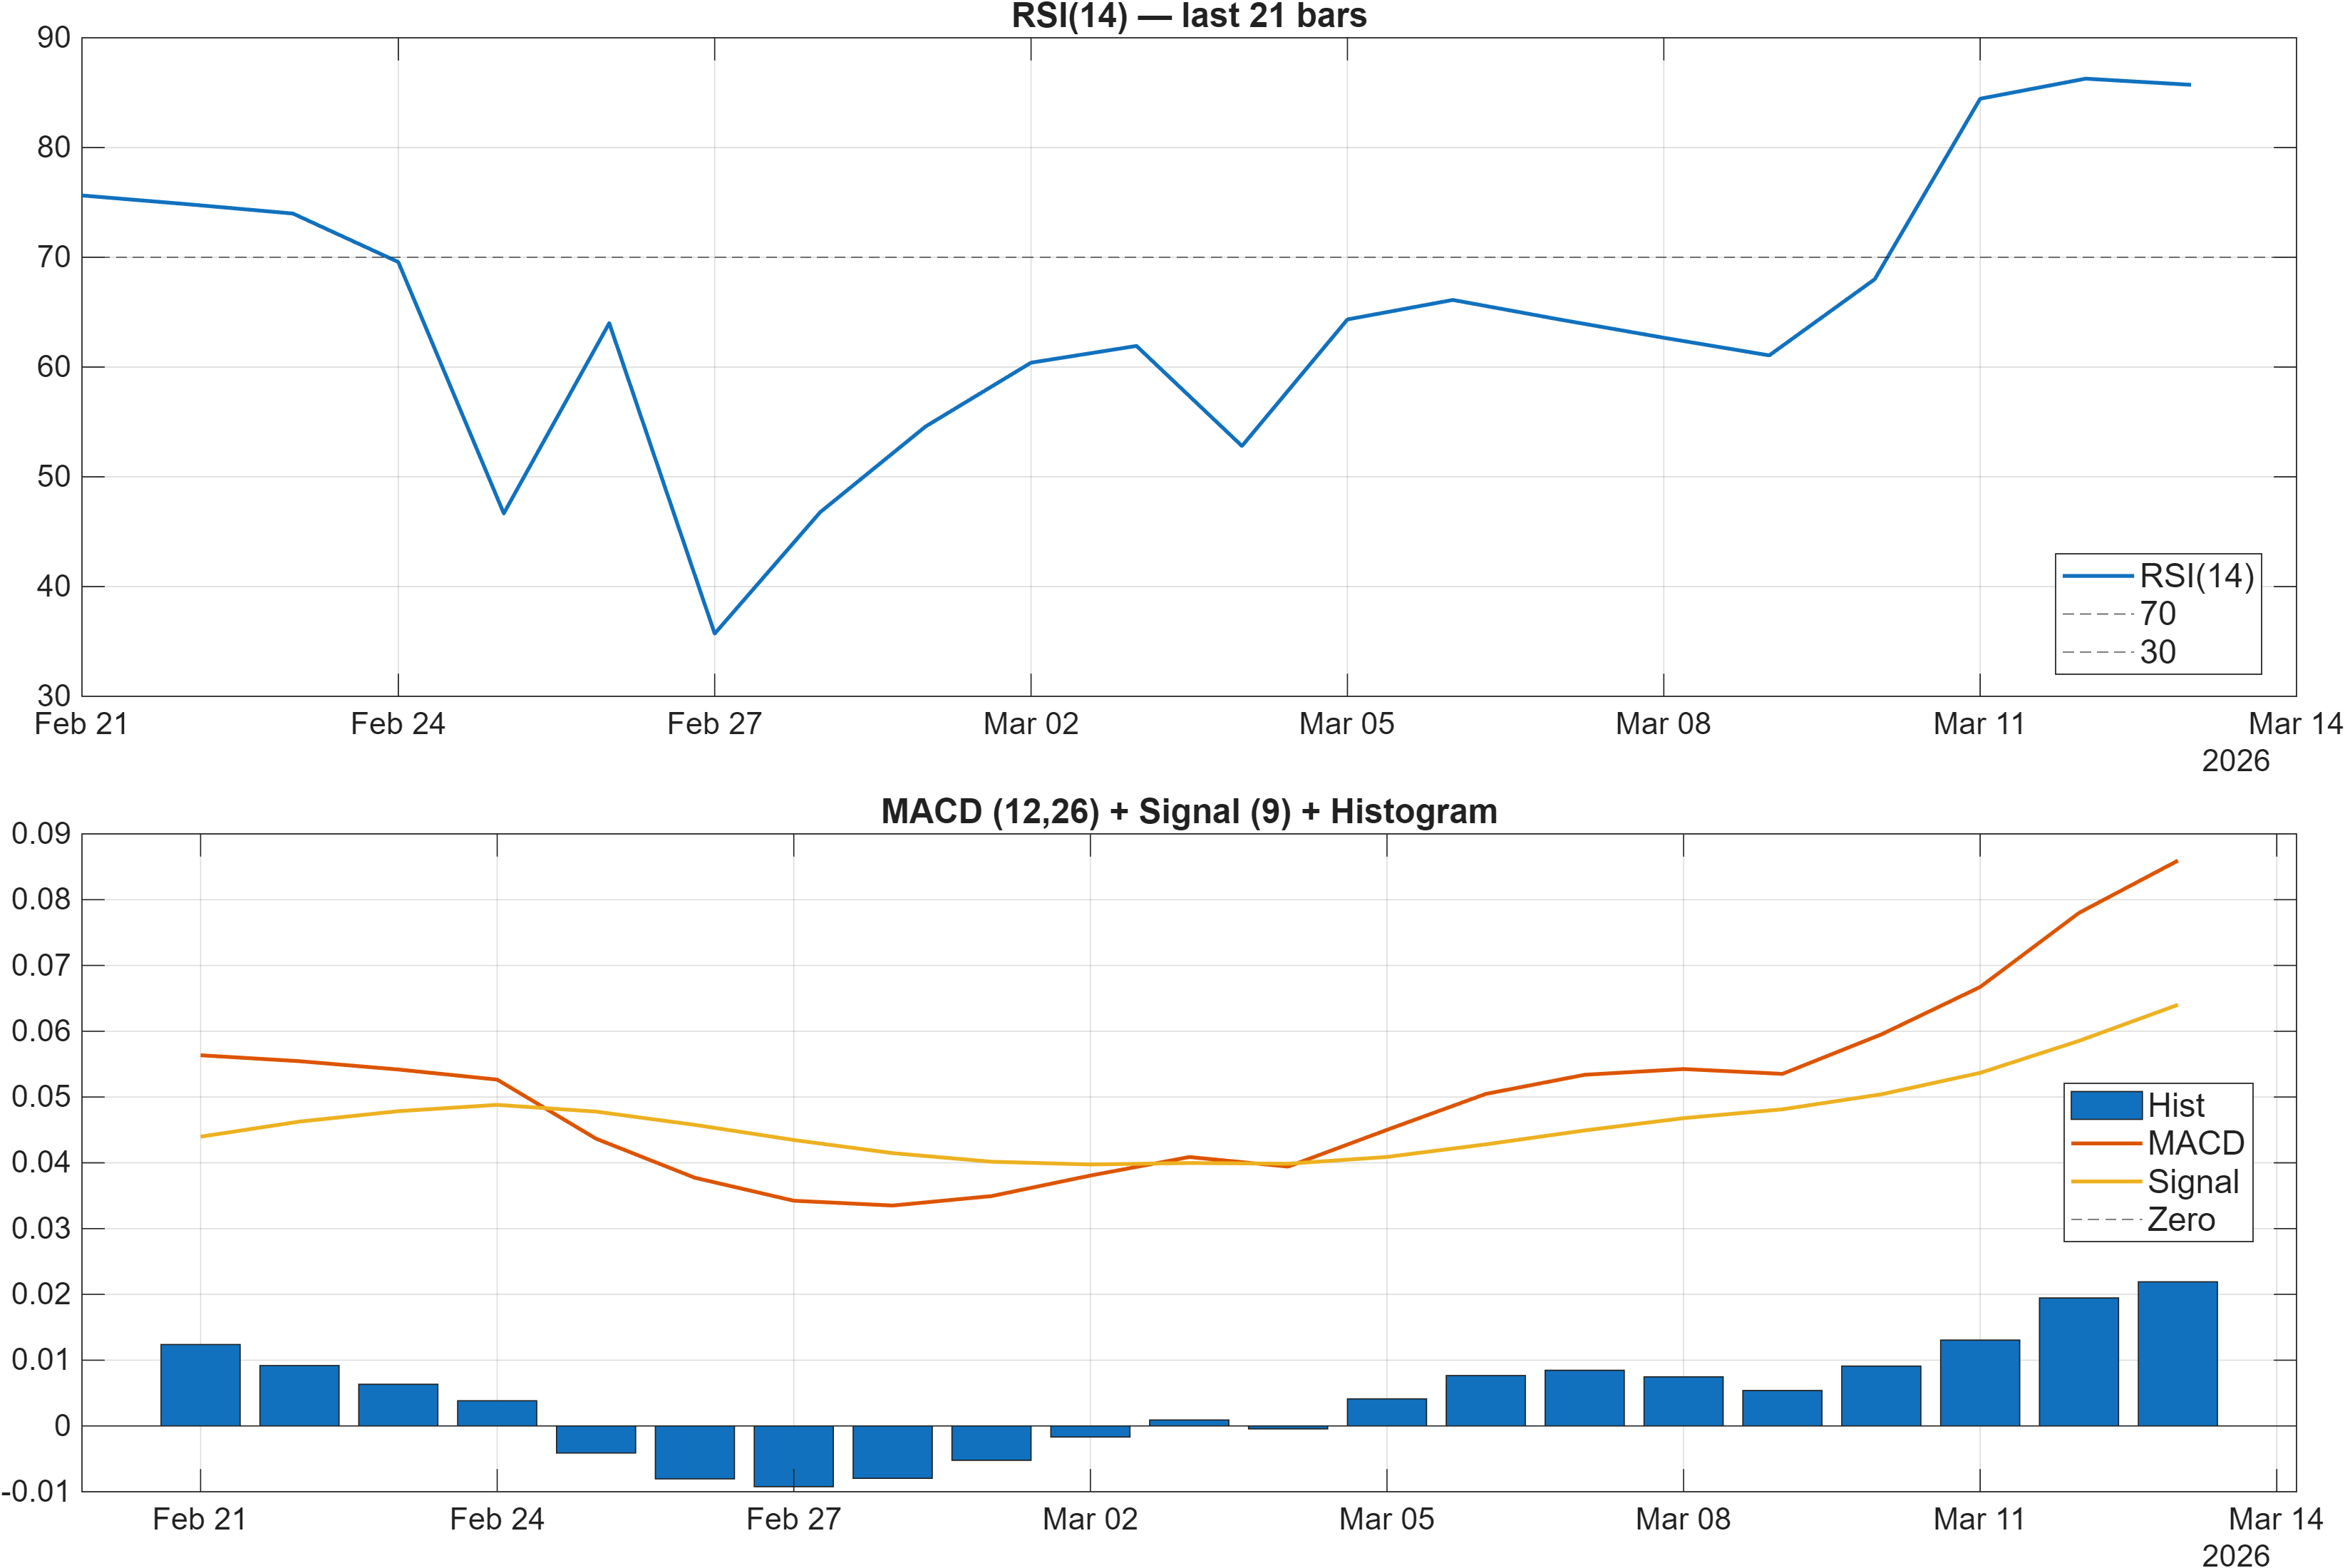
Interpretation: RSI bias = Bullish, MACD hist = 0.0219.
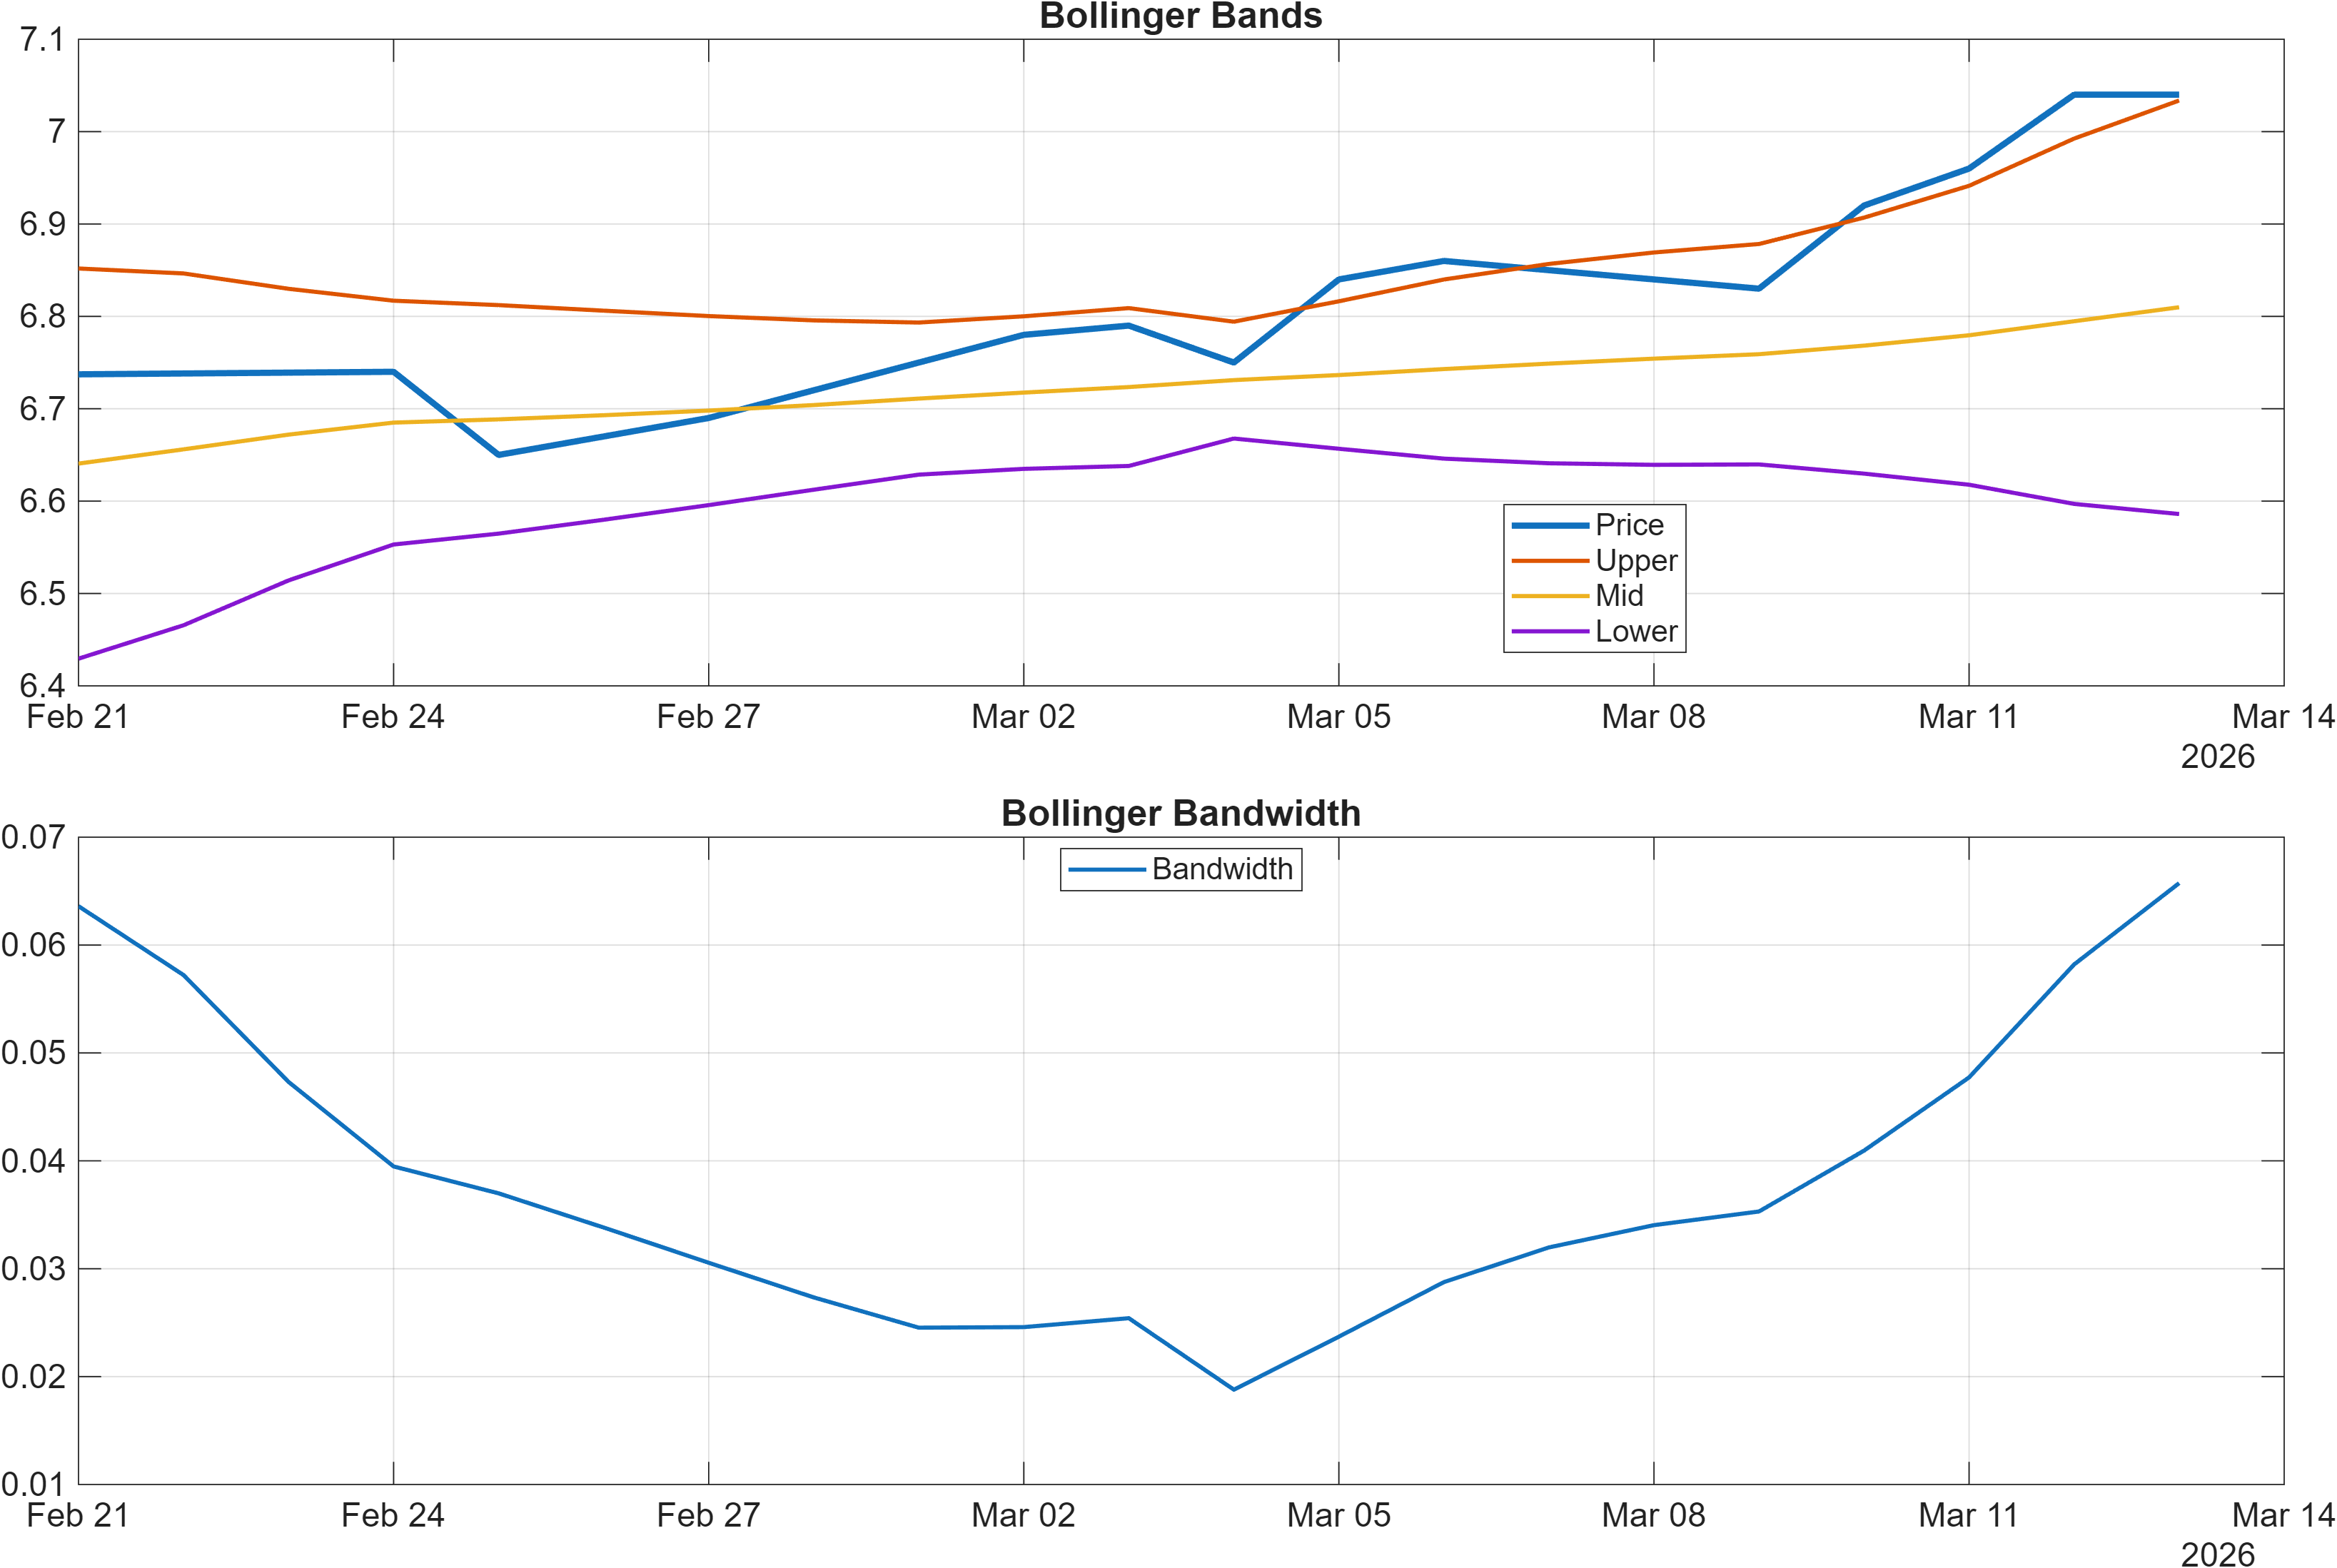
Interpretation: Bandwidth (volatility regime) latest = 0.0657.
Momentum indicators point to positive impulse, but with early signs of potential short-term saturation. The MACD histogram at 0.0219 is positive, supporting the view that upside momentum remains intact rather than fading into a bearish crossover regime. At the same time, RSI bias is bullish and the signal table shows RSI(14) at 85.71, which is typically associated with an overbought condition in classical technical analysis. Overbought does not imply immediate reversal; it more often flags that incremental upside may require either consolidation or continued strong participation.
Volatility context matters for interpreting that momentum. Bollinger bandwidth at 0.0657 suggests a relatively contained volatility regime rather than a high-dispersion breakout state. In contained regimes, extreme RSI readings can persist briefly, but follow-through is more dependent on whether price can grind higher without triggering rapid mean-reversion.
The internal consistency across indicators is mixed in a way that is analytically useful: positive MACD and bullish RSI argue for trend continuation, while the volatility backdrop implies the move may be occurring without broad volatility expansion. When momentum rises while bandwidth remains relatively compressed, continuation is often “incremental” rather than explosive; this aligns with the broader rank profile staying neutral (e.g., #278 daily) rather than migrating quickly into top-decile leadership.
For tactical interpretation, momentum strength is best evaluated against the nearby resistance map at 6.8950. If price challenges that zone while volatility remains compressed, the market is effectively testing whether a new regime (expansion) begins. If instead momentum cools while holding above support at 6.3300, the setup remains consistent with a bullish-to-neutral consolidation rather than a breakdown.
4) Support / Resistance zones
Support ~ 6.3300 | Resistance ~ 6.8950
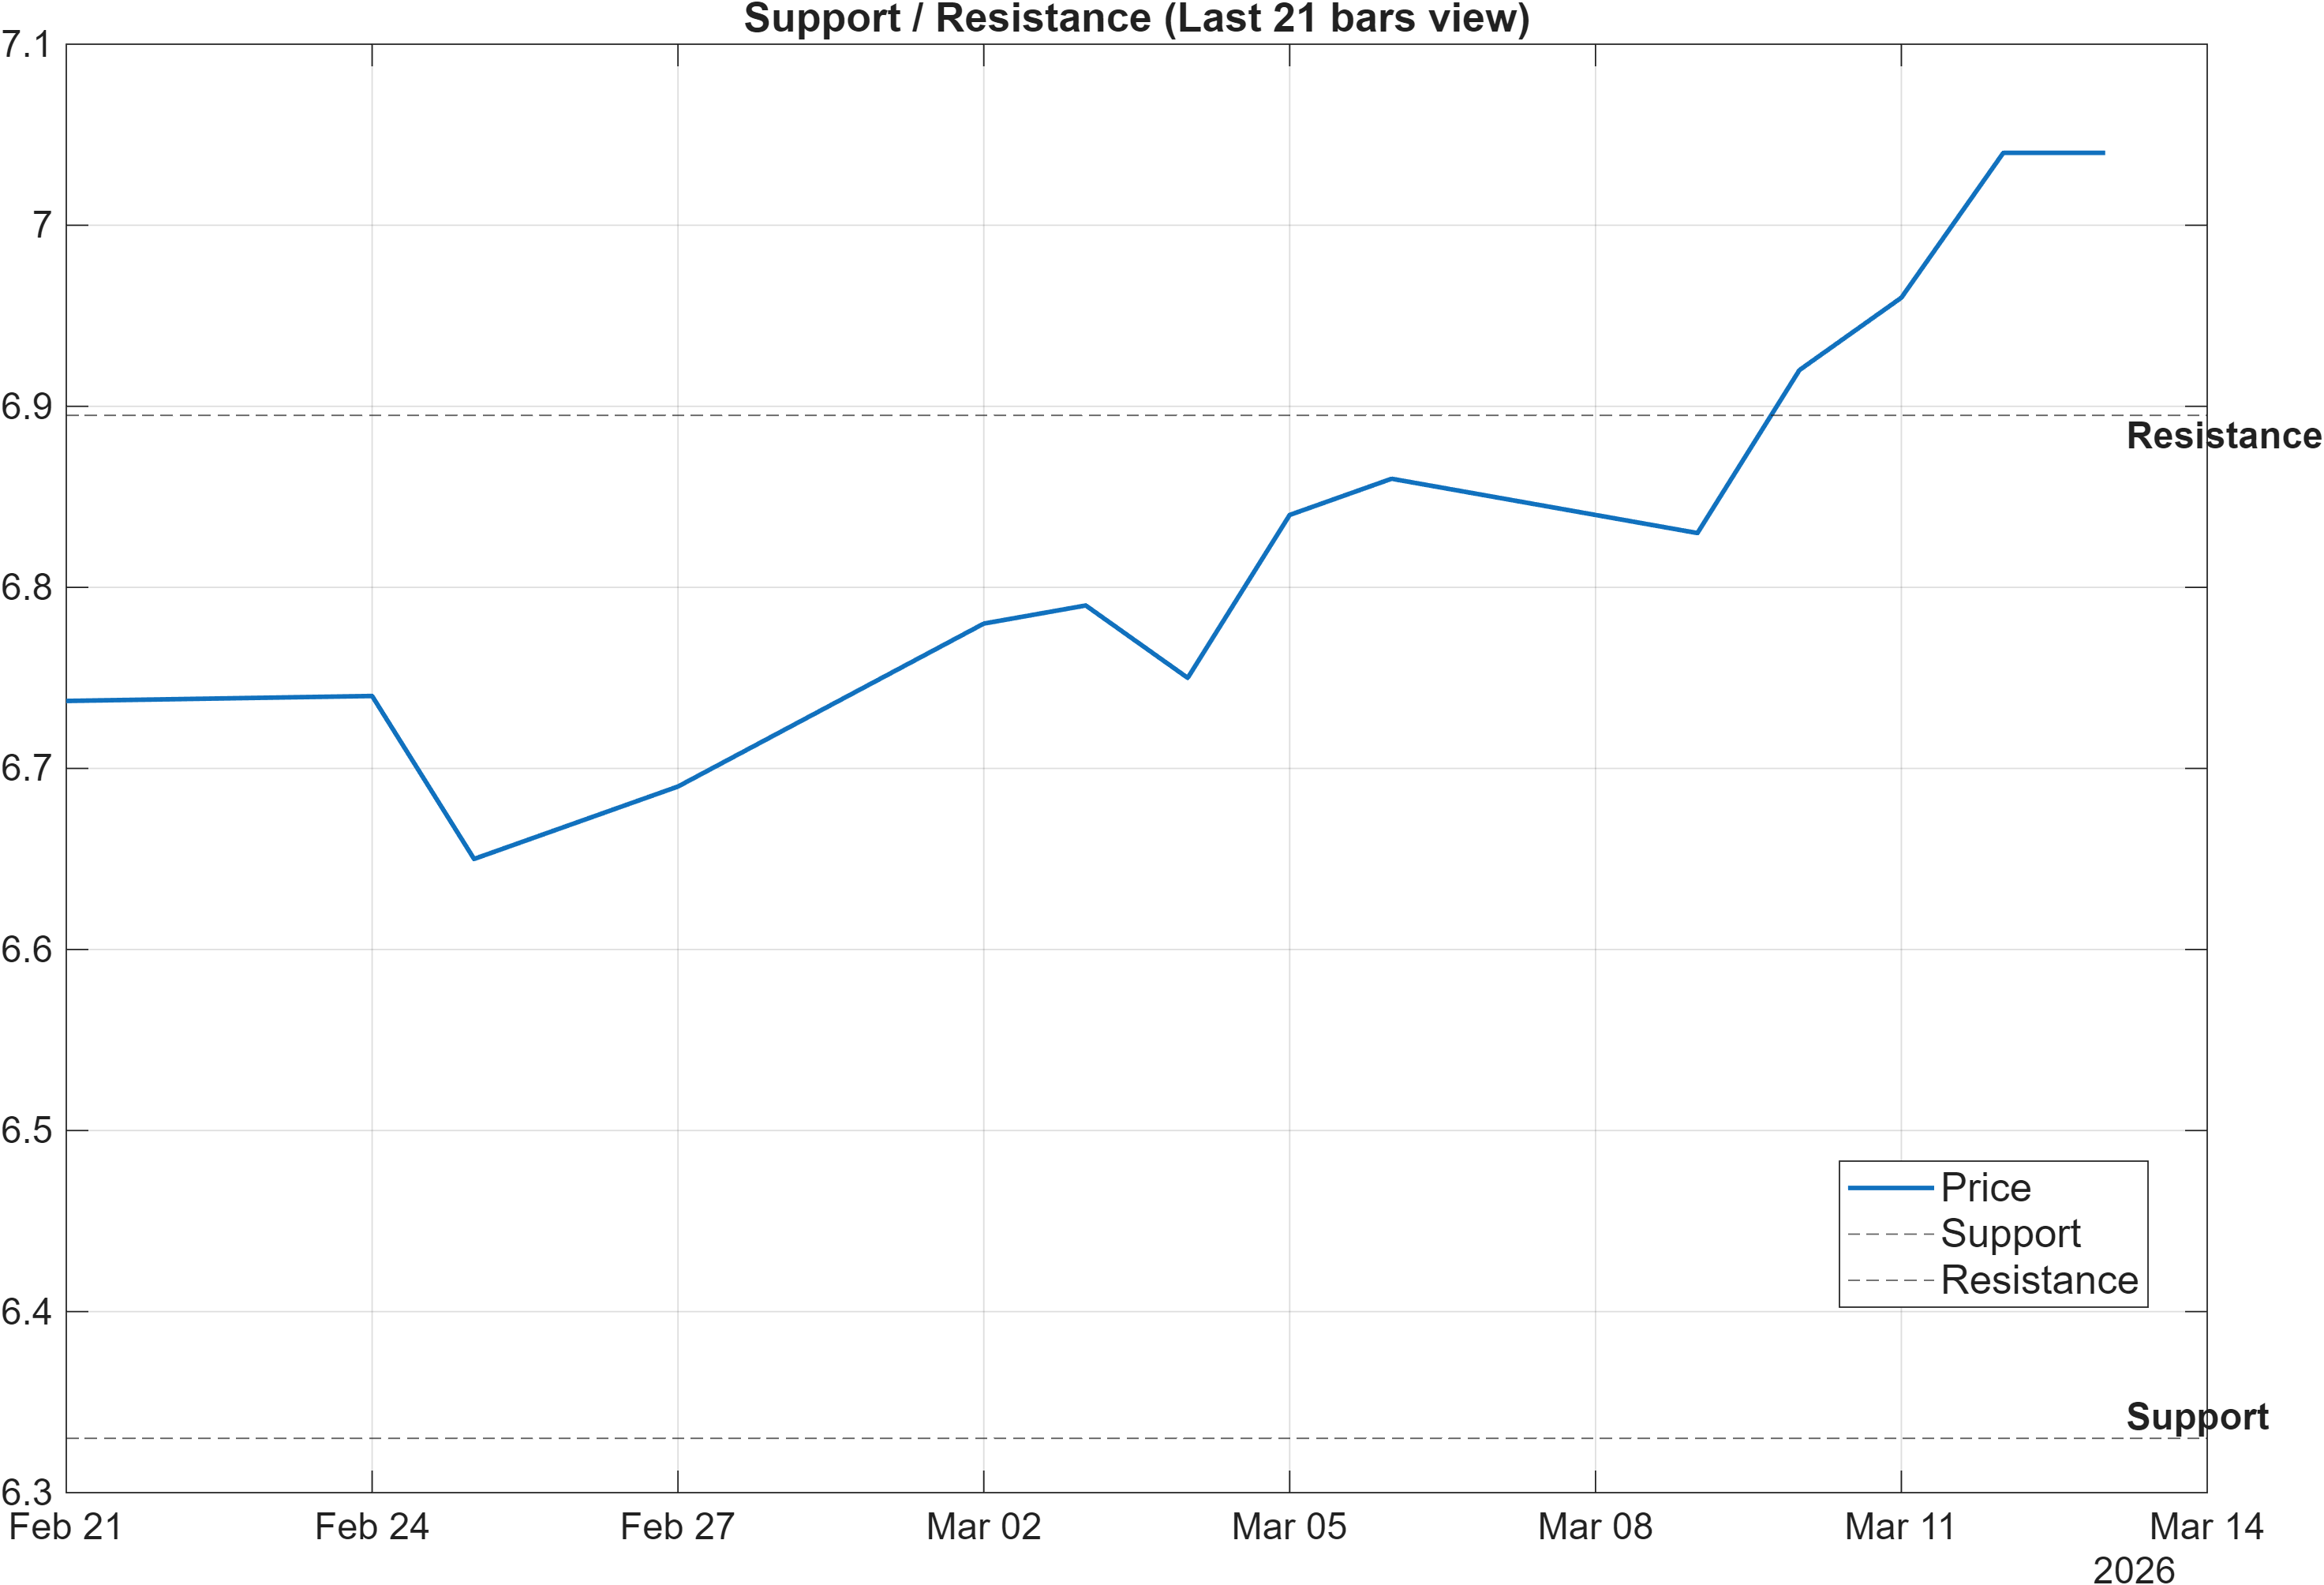
Scenario view: Break above resistance with volume → continuation. Close below support → signal deterioration risk.
The level structure is clean and binary: 6.3300 frames the primary support zone, while 6.8950 is the nearby resistance area that defines whether the current advance can transition from “controlled uptrend” into “continuation with confirmation.” This simplicity is helpful given the indicator mix: RSI is elevated (85.71) while MACD remains positive (0.0219), making it especially important to anchor decisions to levels rather than oscillator noise.
From a regime perspective, a sustained trade above 6.8950 would be consistent with the bullish moving-average structure (close vs MA50 bullish; MA50 vs MA200 bullish) and could help reconcile the current divergence between Bullish technical confluence and mostly Neutral ranks (e.g., monthly #309, yearly #295). In other words, a break/hold above resistance is the kind of observable behavior that often precedes rank improvement at shorter horizons.
Conversely, a close below 6.3300 would undermine the current bullish technical narrative and raise the probability that the elevated momentum readings were late-cycle rather than early-cycle. That downside invalidation matters more in this report because the broader AI ranking is not aggressively bullish: with a DRL technical rank at #298 and neutral short-term ranks, the model is not positioned as if strong downside is impossible.
Overall, these zones function as decision boundaries for distinguishing consolidation from regime change—particularly relevant when volatility (bandwidth 0.0657) has not yet expanded decisively.
5) Quant Technical Dashboard (18 Signals)
KGNAI AI Technical Analysis Score (Deep Reinforcement Learning): Rank #298 out of 1293 (Rank 1 represents the strongest technical positioning and a higher probability of favorable price behavior. As ranks increase toward the maximum, the probability of favorable outcomes weakens and bearish positioning becomes more dominant.) | Label: Neutral | Score: 0.539
18-Signal Technical Confluence Score: 0.444 (Bullish)
Overall Technical Score (18-signal confluence + DRL rank blend): 0.473 (Bullish)
Note: The blended score reflects signal strength weighted against broader AI technical ranking, which may temporarily diverge.
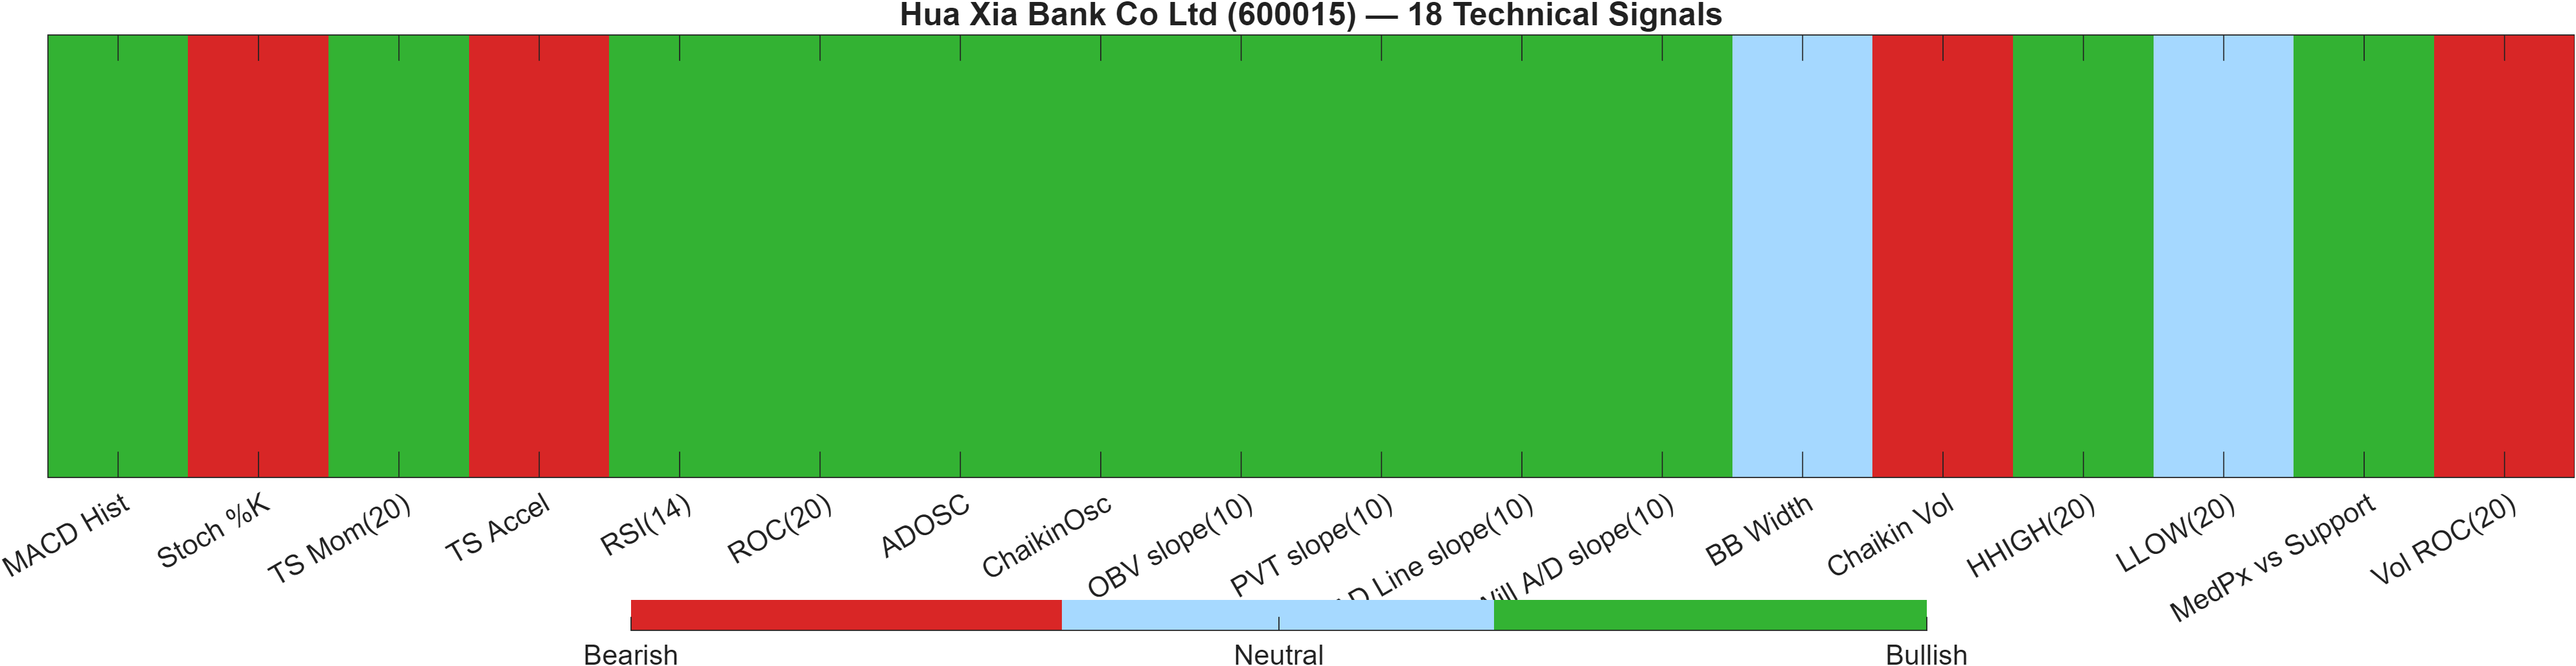
Blended technical score breakdown: 0.473 (Bullish | Bull 12 / Bear 4 / Neutral 2)
Signal-level alignment vs model-level neutrality
The technical layer is best summarized as breadth-positive but not fully regime-confirmed. The 18-signal confluence score is 0.444 (Bullish), and the blended overall technical score improves to 0.473 (Bullish) with Bull 12 / Bear 4 / Neutral 2. This indicates that many independent indicators are pointing in the same direction, which typically reduces the chance that the move is purely random noise.
However, the deep reinforcement learning technical rank remains Neutral at #298 (score 0.539). That divergence matters: it suggests the indicator stack is bullish locally, while the broader pattern classification across the universe is not identifying an unambiguous high-probability “leader” regime.
Within the signal mix, momentum is supportive (MACD histogram 0.02192 bullish; ROC(20) 4.479 bullish), but there are also “cooling” flags that often appear late in short-term pushes (Stoch %K 97.14 bearish; TS Accel -0.01636 bearish). Volatility remains relatively contained with BB Width 0.06574 neutral, and volume dynamics show a potential headwind with Vol ROC(20) -9.603 bearish.
The most decision-relevant conclusion: the signal stack supports the current advance, but the presence of bearish acceleration/volume components helps explain why the AI technical rank and the broader short-horizon ranks can remain neutral despite bullish confluence.
Signal table (Bull/Bear/Neutral)
| Indicator | Value | Signal |
|---|---|---|
| MACD Hist | 0.02192 | Bullish |
| Stoch %K | 97.14 | Bearish |
| TS Mom(20) | 0.3018 | Bullish |
| TS Accel | -0.01636 | Bearish |
| RSI(14) | 85.71 | Bullish |
| ROC(20) | 4.479 | Bullish |
| ADOSC | 83.33 | Bullish |
| ChaikinOsc | 7.715e+07 | Bullish |
| OBV slope(10) | 5.3e+07 | Bullish |
| PVT slope(10) | 2.373e+06 | Bullish |
| AD Line slope(10) | 2.296e+08 | Bullish |
| Will A/D slope(10) | 0.27 | Bullish |
| BB Width | 0.06574 | Neutral |
| Chaikin Vol | 5.182 | Bearish |
| HHIGH(20) | 7.05 | Bullish |
| LLOW(20) | 6.63 | Neutral |
| MedPx vs Support | 0.66 | Bullish |
| Vol ROC(20) | -9.603 | Bearish |
Interpretation: Indicator-level signals form the base confluence, which is then adjusted using a separate AI-driven technical ranking model. The final technical score summarizes this combined view.
6) News sentiment + extractive gist
Note: Instrument-specific news matches were not found, so the digest includes broader market/sector headlines. Links are provided for verification.
Sentiment score (avg): 0.013 | Positive: 12% | Neutral: 81% | Negative: 6%
KGNAI AI News Sentiment Score (normalized -1 to +1): Not available (as of —) | Label: Not available | Overall news score: 0.01
Positive Developments
Recent coverage across major financial outlets indicates a generally steady tone for macro and policy narratives influencing China’s financial sector backdrop, with a modest positive skew in the dataset (12% positive versus 6% negative). Themes characterized as constructive tend to emphasize policy intent around stabilizing growth and employment, alongside ongoing discussion of strategic priorities and their second-order effects on credit conditions and risk appetite. For 600015, this type of environment can be supportive primarily through risk-premium stabilization rather than idiosyncratic catalysts, which are not available in the provided data. Importantly, the overall news tone remains dominated by neutral items (81%), so “positive” should be read as a slight contextual tailwind rather than a standalone driver. The technical picture—bullish confluence (0.473 blended) with a neutral deep-learning rank (#298)—fits a market that may be improving incrementally without broad consensus conviction.
Neutral / Mixed Developments
The news mix is largely informational and cross-market in nature, consistent with the note that instrument-specific matches were not found. With an average sentiment score of 0.013, the dataset implies a near-flat bias—useful mainly as a context filter rather than a signal. In this type of regime, price action tends to lean more heavily on technical structure and positioning. That aligns with the report’s current setup: short-horizon ranks remain neutral (e.g., daily #278 and weekly #266), while intermediate rank strength (3-month #87) suggests the market is selectively rewarding certain exposures. The absence of a normalized KGNAI news sentiment score (Not available) further reinforces that sentiment should not be over-weighted in the decision stack for this timestamp.
Negative / Risk Signals
Risk-leaning coverage in the broader feed is present but limited in share (6% negative), and it appears more tied to market integrity and broader risk-off headlines than to Hua Xia Bank specifically. Even when not issuer-specific, these narratives can influence financials through sentiment spillover, tightening of risk budgets, or short-term volatility in correlated exposures. The technical indicators already show some tension that can amplify sensitivity to risk headlines: RSI(14) is elevated at 85.71, and volume momentum is flagged bearish via Vol ROC(20) at -9.603. In that context, downside narratives matter most if they coincide with level failures—particularly a close below 6.3300, which the report frames as deterioration risk. Conversely, holding above support while volatility remains contained (bandwidth 0.0657) would be more consistent with digestion than dislocation.
What to monitor next
- Whether price can sustain acceptance above 6.8950 alongside improving participation signals (watch for the bearish volume flag to stabilize).
- Whether the current overbought momentum profile (RSI(14) 85.71) cools via consolidation without breaking 6.3300.
- Whether short-horizon ranks (daily #278, weekly #266) begin converging toward the stronger intermediate profile (3-month #87).
Sources referenced: Reuters, Bloomberg, Yahoo Finance, MarketWatch, Investing.com
7) Sources
Not available in the provided data.
You may also like: How KGNAI AI ranks instruments across global markets
Disclaimer: KGNAI provides AI-generated analytics and educational market commentary only. This is not financial advice. Markets involve risk. Always do your own research.