
603345 (Fujian Anjoy Foods Co Ltd) Technical & Rank Review — 08-Mar-2026 | Neutral near-term, constructive longer-term
Fujian Anjoy Foods Co Ltd (603345) currently presents a split-profile: near-term ranks sit in neutral territory, while longer-horizon ranks remain strongly constructive within KGNAI’s cross-sectional universe of 1293 China-listed instruments. This divergence is consistent with a market state where trend structure can remain intact even as momentum oscillators cool or compress. Technically, the moving-average structure is supportive (close vs MA50 and MA50 vs MA200 are both bullish), while momentum readings show mixed nuance: RSI(14) at 64.28 maintains a bullish bias, but MACD histogram at -0.1665 flags a short-term drag. Volatility is not elevated, with Bollinger Bandwidth at 0.1450, leaving room for expansion if price resolves beyond key zones. The practical decision framework centers on the defined map: support ~84.7250 and resistance ~94.4300, with confirmation requiring price/volume follow-through rather than single-indicator triggers.
- Rank stance: Short Neutral / Mid Neutral / Long Bullish
- Technical confluence: Bullish (18-signal confluence supportive; blended score remains positive)
- Key levels: Support ~84.7250 | Resistance ~94.4300
- News sentiment bias: Neutral (avg -0.013; mostly neutral reads)
- Confirmation / invalidation: Continuation is better supported on a break above 94.4300 with volume; risk rises on a close below 84.7250.
What KGNAI Measures
KGNAI evaluates assets using large cross-sectional datasets built from millions of structured data points. Inputs incorporate fundamental metrics, technical structures, and systematically processed news sentiment. Statistical models, machine learning, and AI frameworks are used to assess relative positioning, signal alignment, and probabilistic behavior across broad universes.
How to Read This Report
- Ranks are comparative across the tracked universe, not absolute price targets.
- Confluence reflects alignment among independent signal groups.
- Support/resistance levels are probabilistic decision zones, not guarantees.
- Sentiment provides contextual bias within the broader analytical framework.
1) KGNAI AI Analysis
Region: CHINA
Total universe size: 1293 ranked instruments
- Daily rank: #900 out of 1293 — Neutral
- Weekly rank: #647 out of 1293 — Neutral
- Monthly rank: #600 out of 1293 — Neutral
- 3-Monthly rank: #20 out of 1293 — Bullish
- 6-Monthly rank: #22 out of 1293 — Bullish
- Yearly rank: #6 out of 1293 — Bullish
The rank curve shows a clear time-horizon divergence. On daily timing, 603345 is positioned in the lower third of the universe by favorability (daily rank #900), while the weekly and monthly frames remain neutral (#647 and #600). In contrast, the longer windows shift decisively into the upper tail: the 3-month and 6-month ranks (#20 and #22) sit in the top decile, and the yearly rank (#6) is near the very top of the entire set.
This configuration is most consistent with a market that has delivered strong longer-run behavior but is currently in a digestive/mean-reversion phase rather than an outright structural breakdown. In practice, that means short-horizon weakness can coexist with longer-horizon strength, particularly when price consolidates near decision levels and volatility compresses (a theme reinforced later by the Bollinger Bandwidth reading).
From an allocation standpoint, the key is the neutral short/mid vs bullish long split: short-term ranks suggest lower confidence in immediate follow-through, while long-horizon ranks indicate that the instrument has remained competitively strong relative to peers over extended windows. That makes confirmation criteria (trend and level validation) more informative than attempting to force a single “directional” conclusion from the rank stack.
2) Price & trend overview
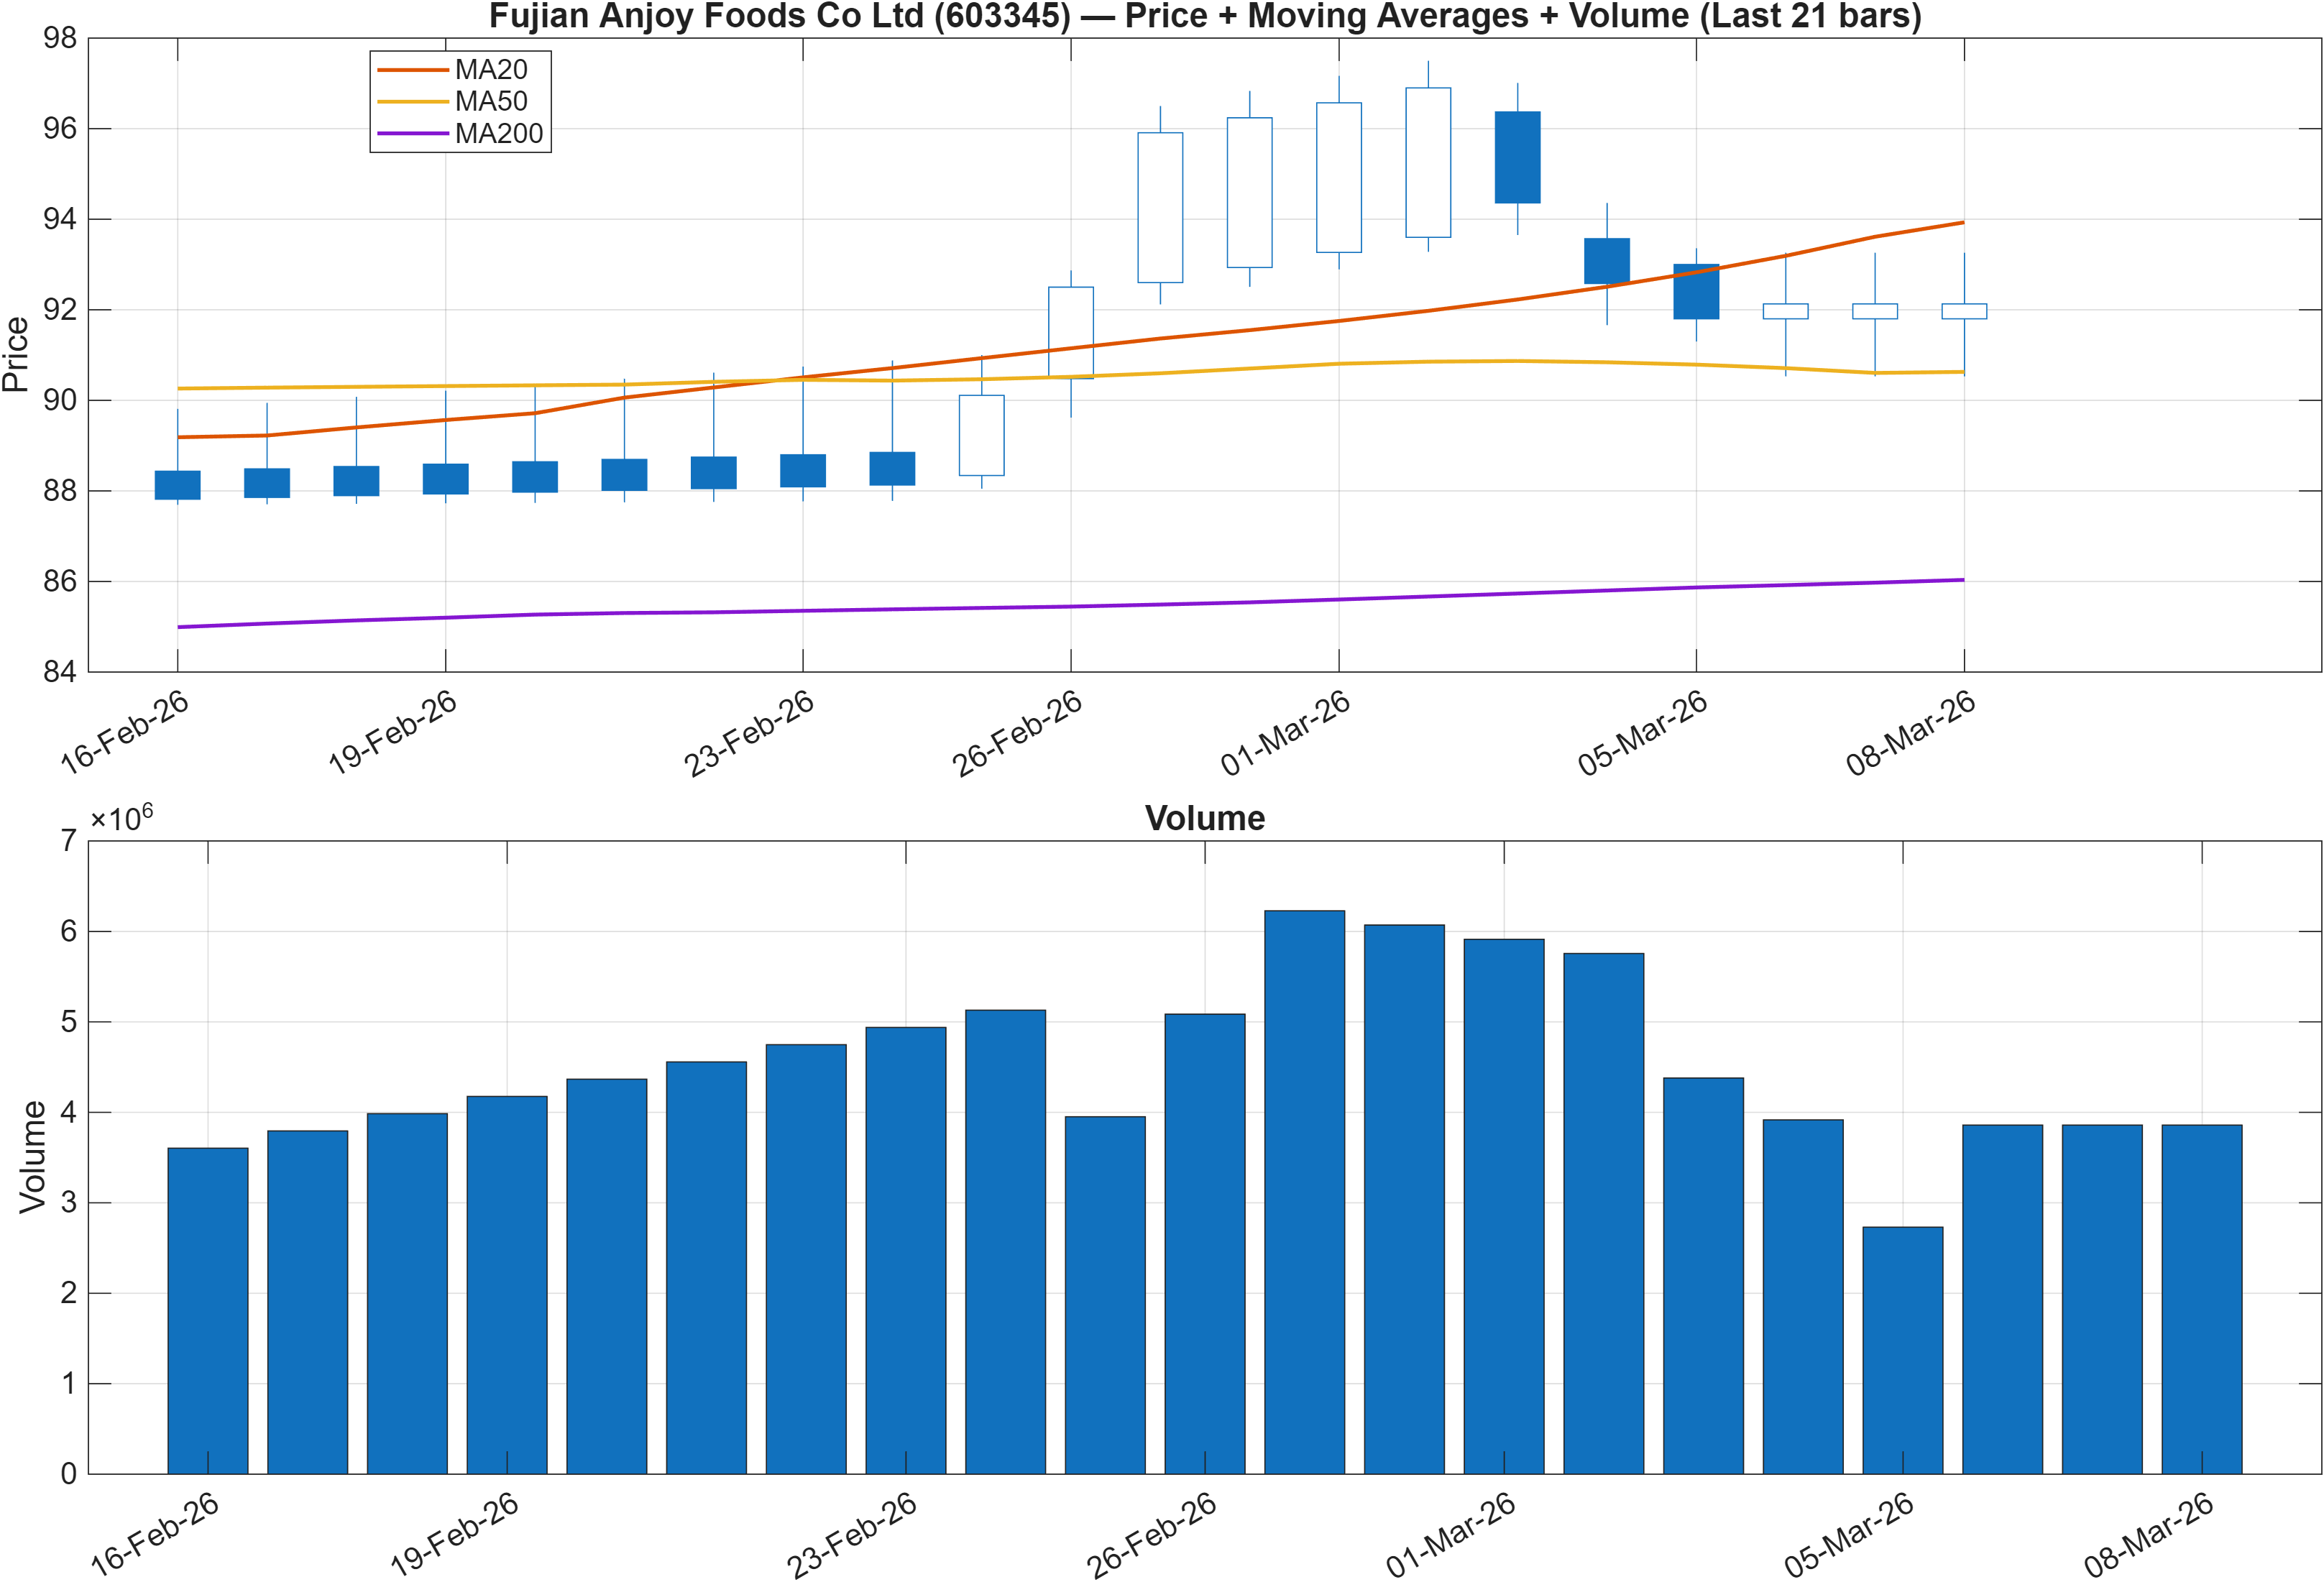
Trend structure remains constructive on the moving-average stack: close vs MA50 is Bullish, and MA50 vs MA200 is Bullish. That combination typically aligns with an established uptrend regime where pullbacks are evaluated for trend integrity rather than assumed reversals. However, given the neutral daily and weekly ranks (#900 and #647), the more relevant question is not whether the trend existed, but whether it is currently re-accelerating or simply holding.
Trend persistence vs. near-term hesitation
When the long-horizon rank is as strong as the yearly reading (#6), trend persistence is the baseline assumption—but only while price stays consistent with the level map and internal participation measures. The nearby resistance at 94.4300 functions as a practical “trend validation” checkpoint: reclaiming and holding above that zone improves the odds that the bullish MA configuration is translating into new range expansion rather than sideways compression.
Volume as the arbiter of continuation
The scenario guidance in the level section explicitly conditions continuation on a break above resistance with volume. That constraint matters because an uptrend can remain technically intact while failing to produce new highs if participation softens. In other words, the moving averages define the regime, but the next leg typically requires a visible pickup in activity. Conversely, a loss of the defined support at 84.7250 would undermine the constructive interpretation by shifting the market into a more defensive posture where the long-horizon rank advantage can compress quickly.
3) Momentum & volatility dashboard
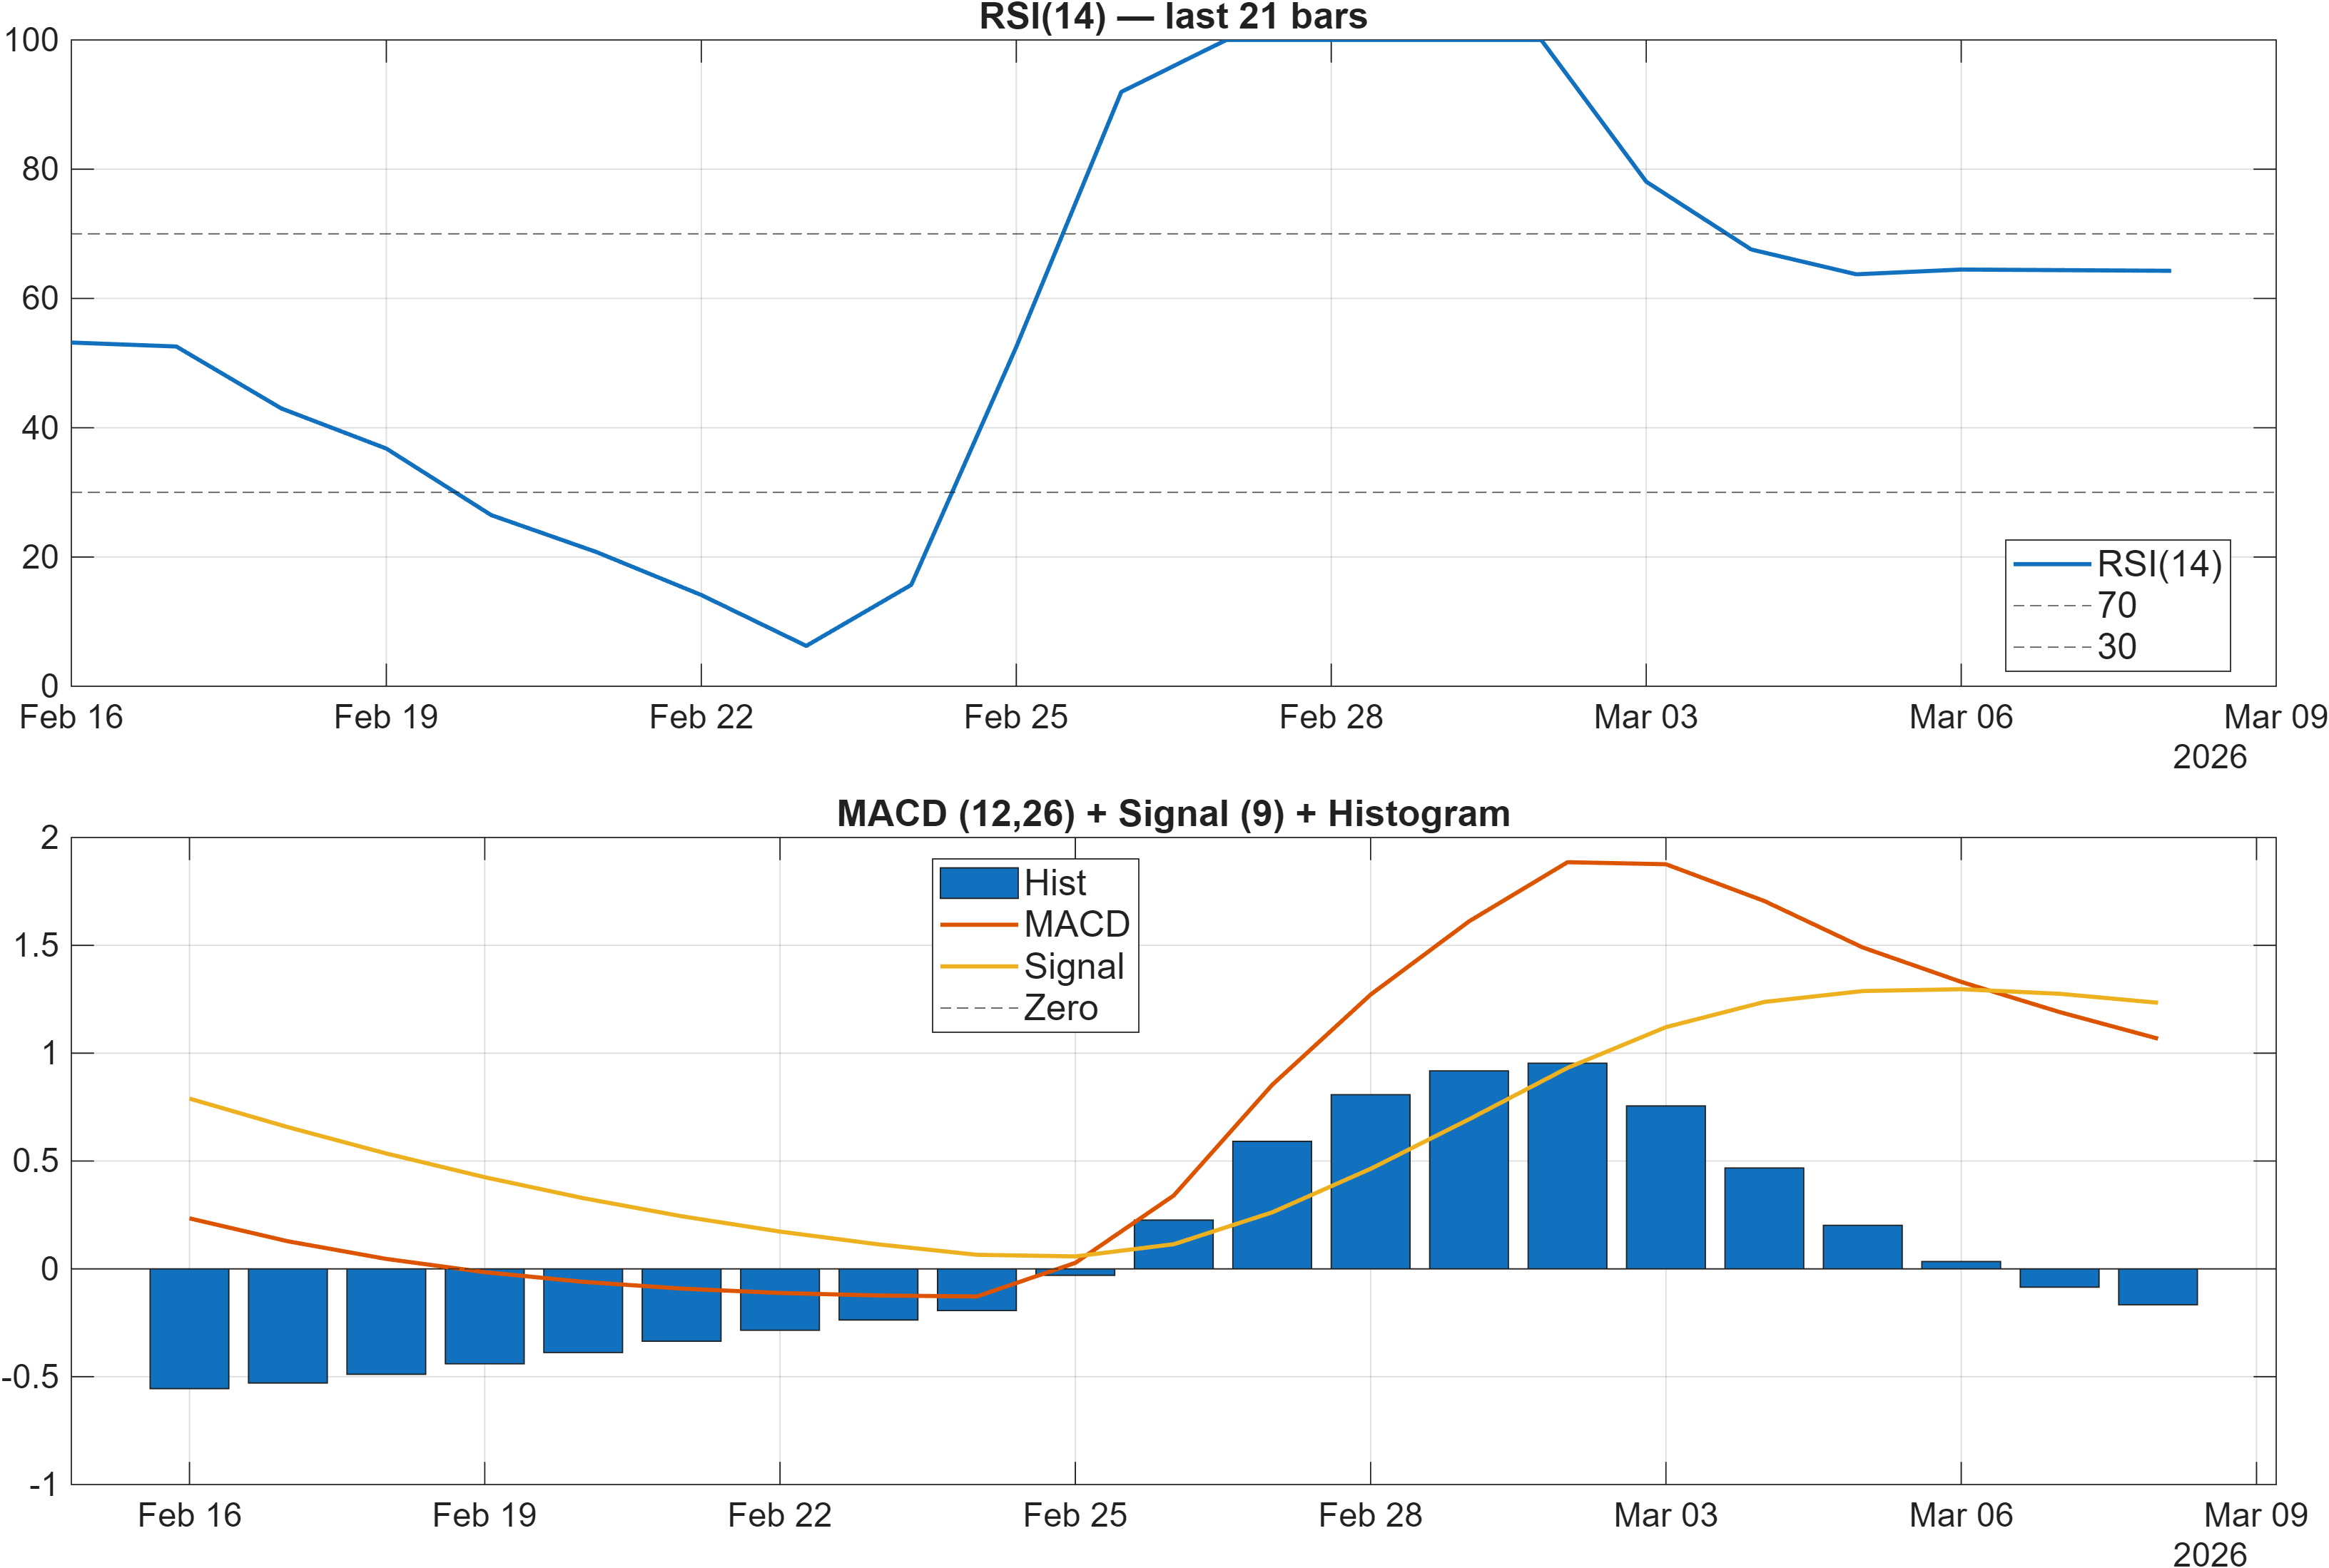
Momentum is best described as supportive but not fully synchronized. RSI bias is Bullish, with RSI(14) at 64.28, a level consistent with constructive demand conditions and a market that is not displaying obvious downside momentum. In contrast, the MACD histogram at -0.1665 reflects a short-term negative impulse—often observed when price is consolidating after a prior advance, or when an uptrend pauses and the faster moving average loses slope.
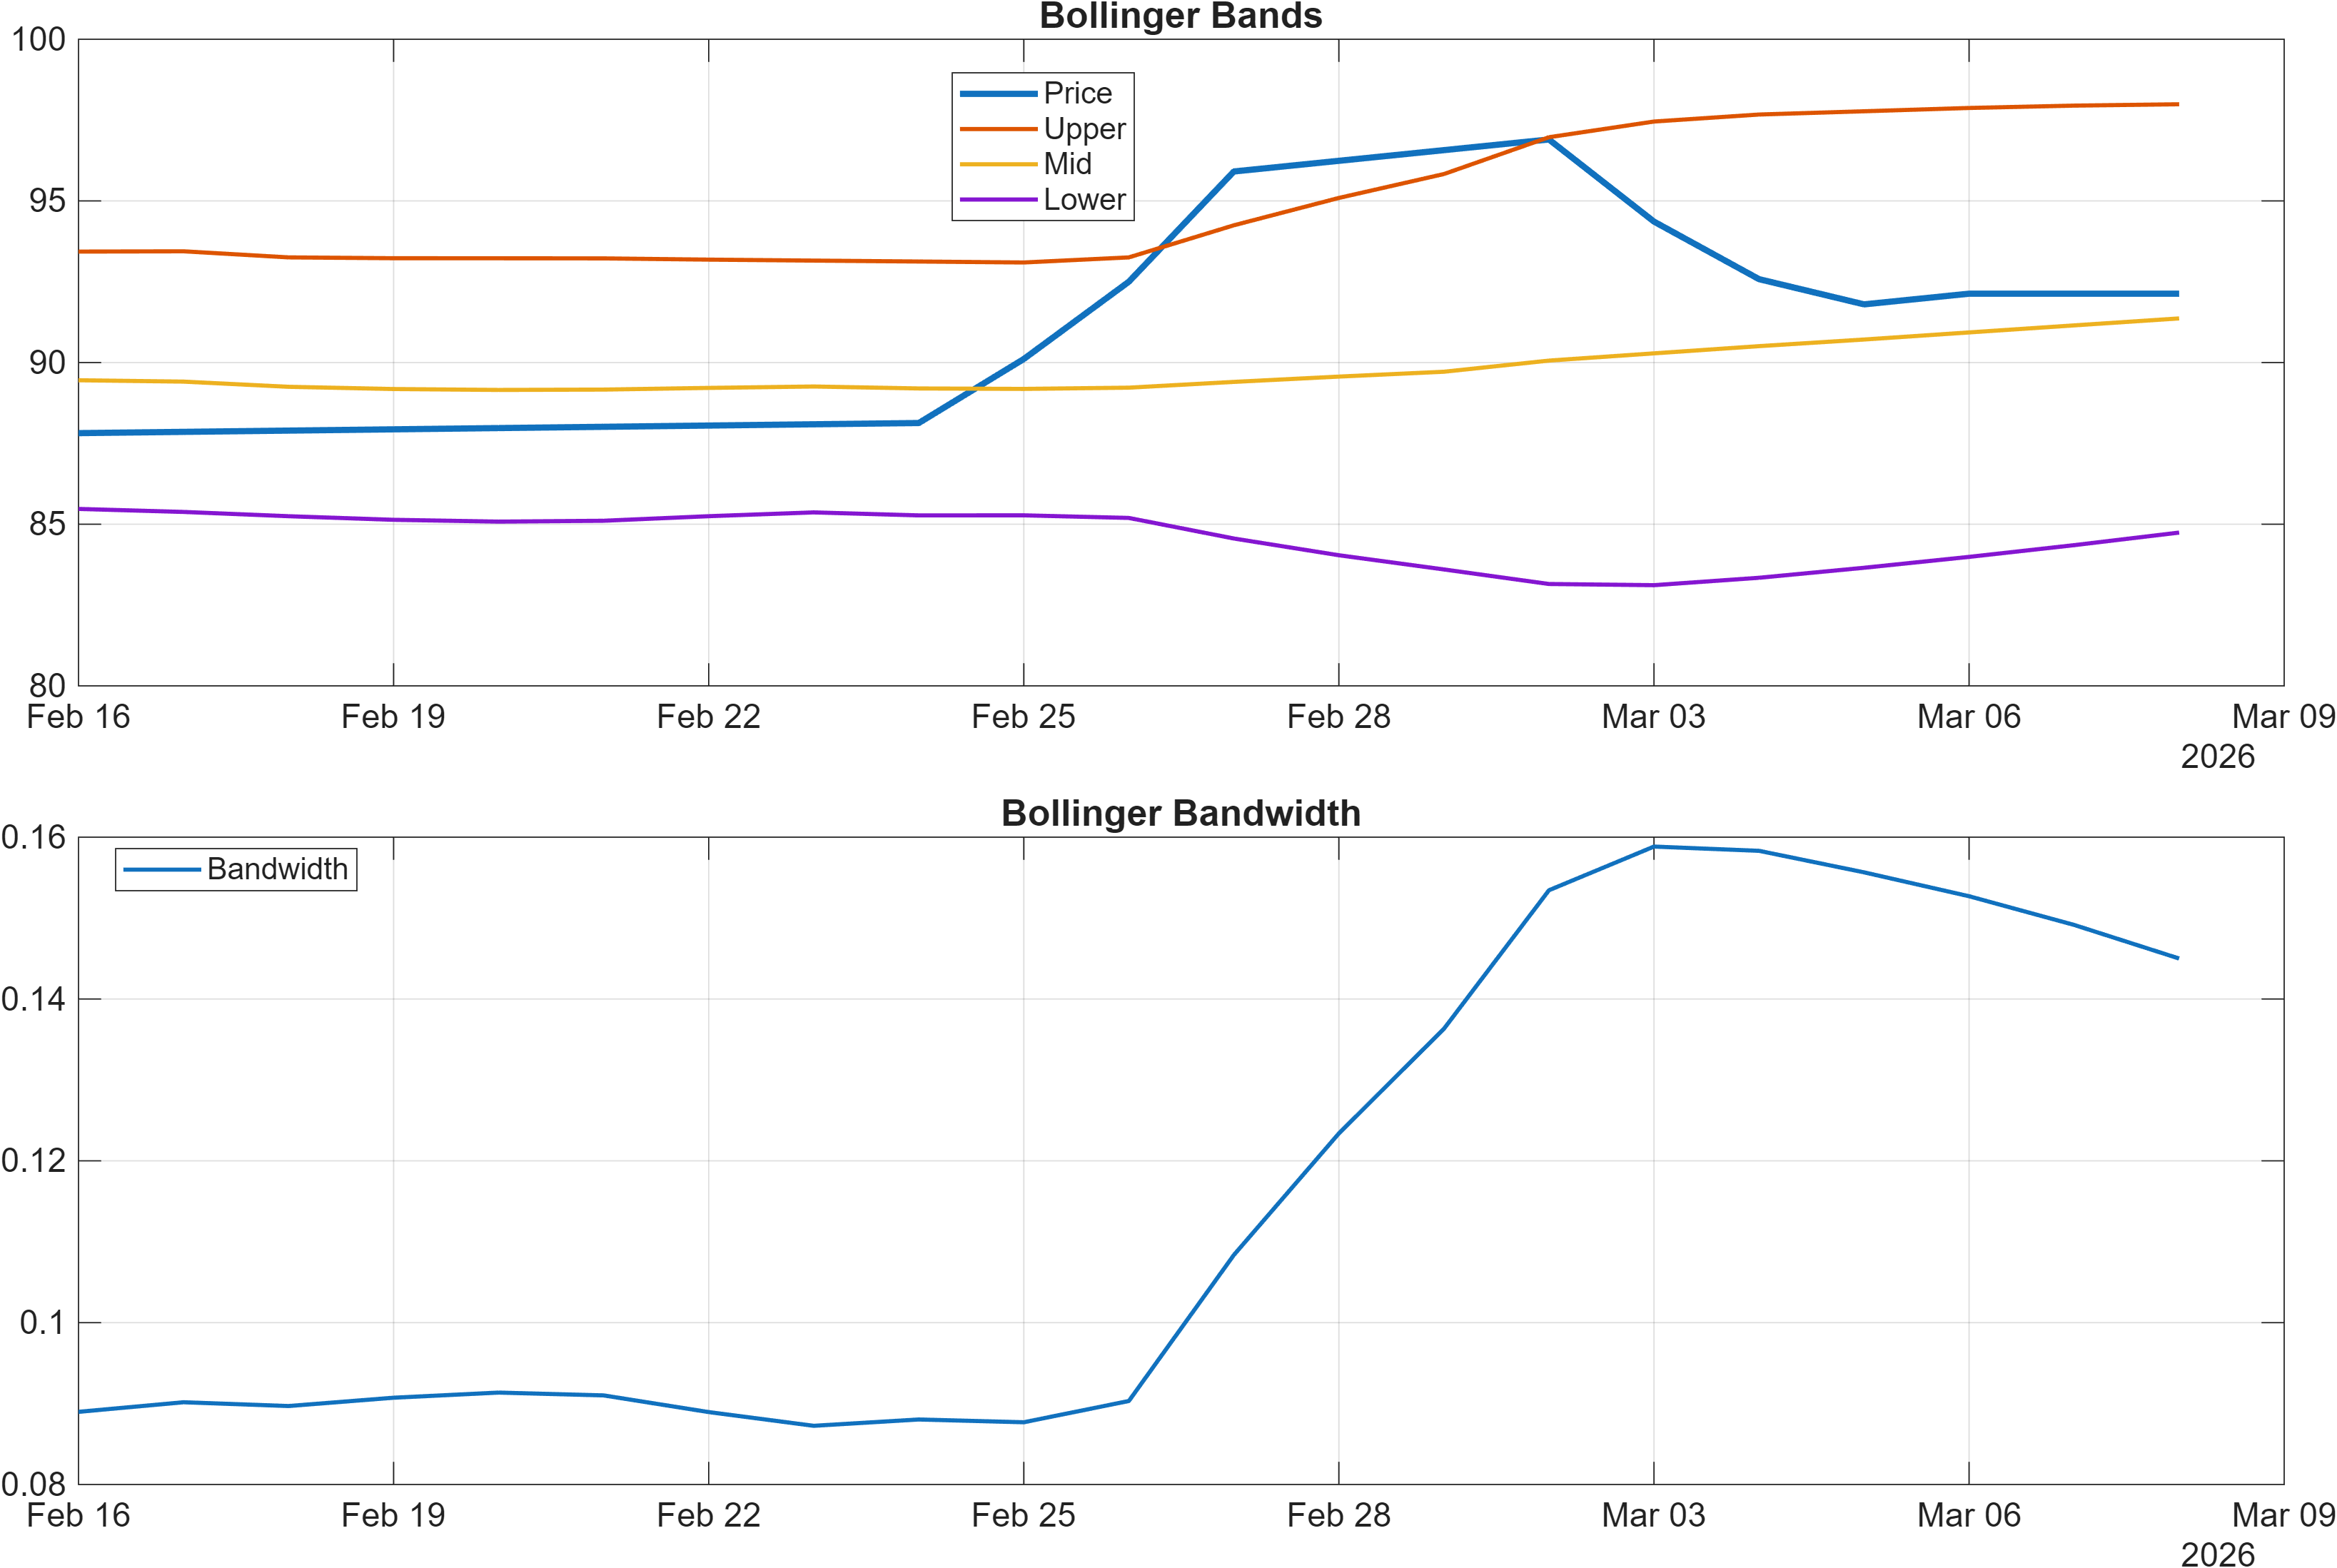
Volatility conditions appear contained. The latest Bollinger Bandwidth is 0.1450, indicating a comparatively tighter regime than is typically associated with sustained trending bursts. That matters because compressed volatility tends to raise the importance of level-based confirmation: when ranges are tight, breakouts (or breakdowns) can travel further before mean-reversion forces reassert.
Signal compression vs. expansion risk
The RSI/MACD split can be read as a “compression” signature: RSI remains elevated while MACD is slightly negative, suggesting the market is holding up but not accelerating. In that state, the next expansion leg is more likely to be resolved by price action around the key zones (84.7250 and 94.4300) than by incremental oscillator changes. A breakout above 94.4300 would reduce the weight of the negative MACD histogram; a slip toward or below 84.7250 would make the histogram weakness more consequential.
4) Support / Resistance zones
Support ~ 84.7250 | Resistance ~ 94.4300
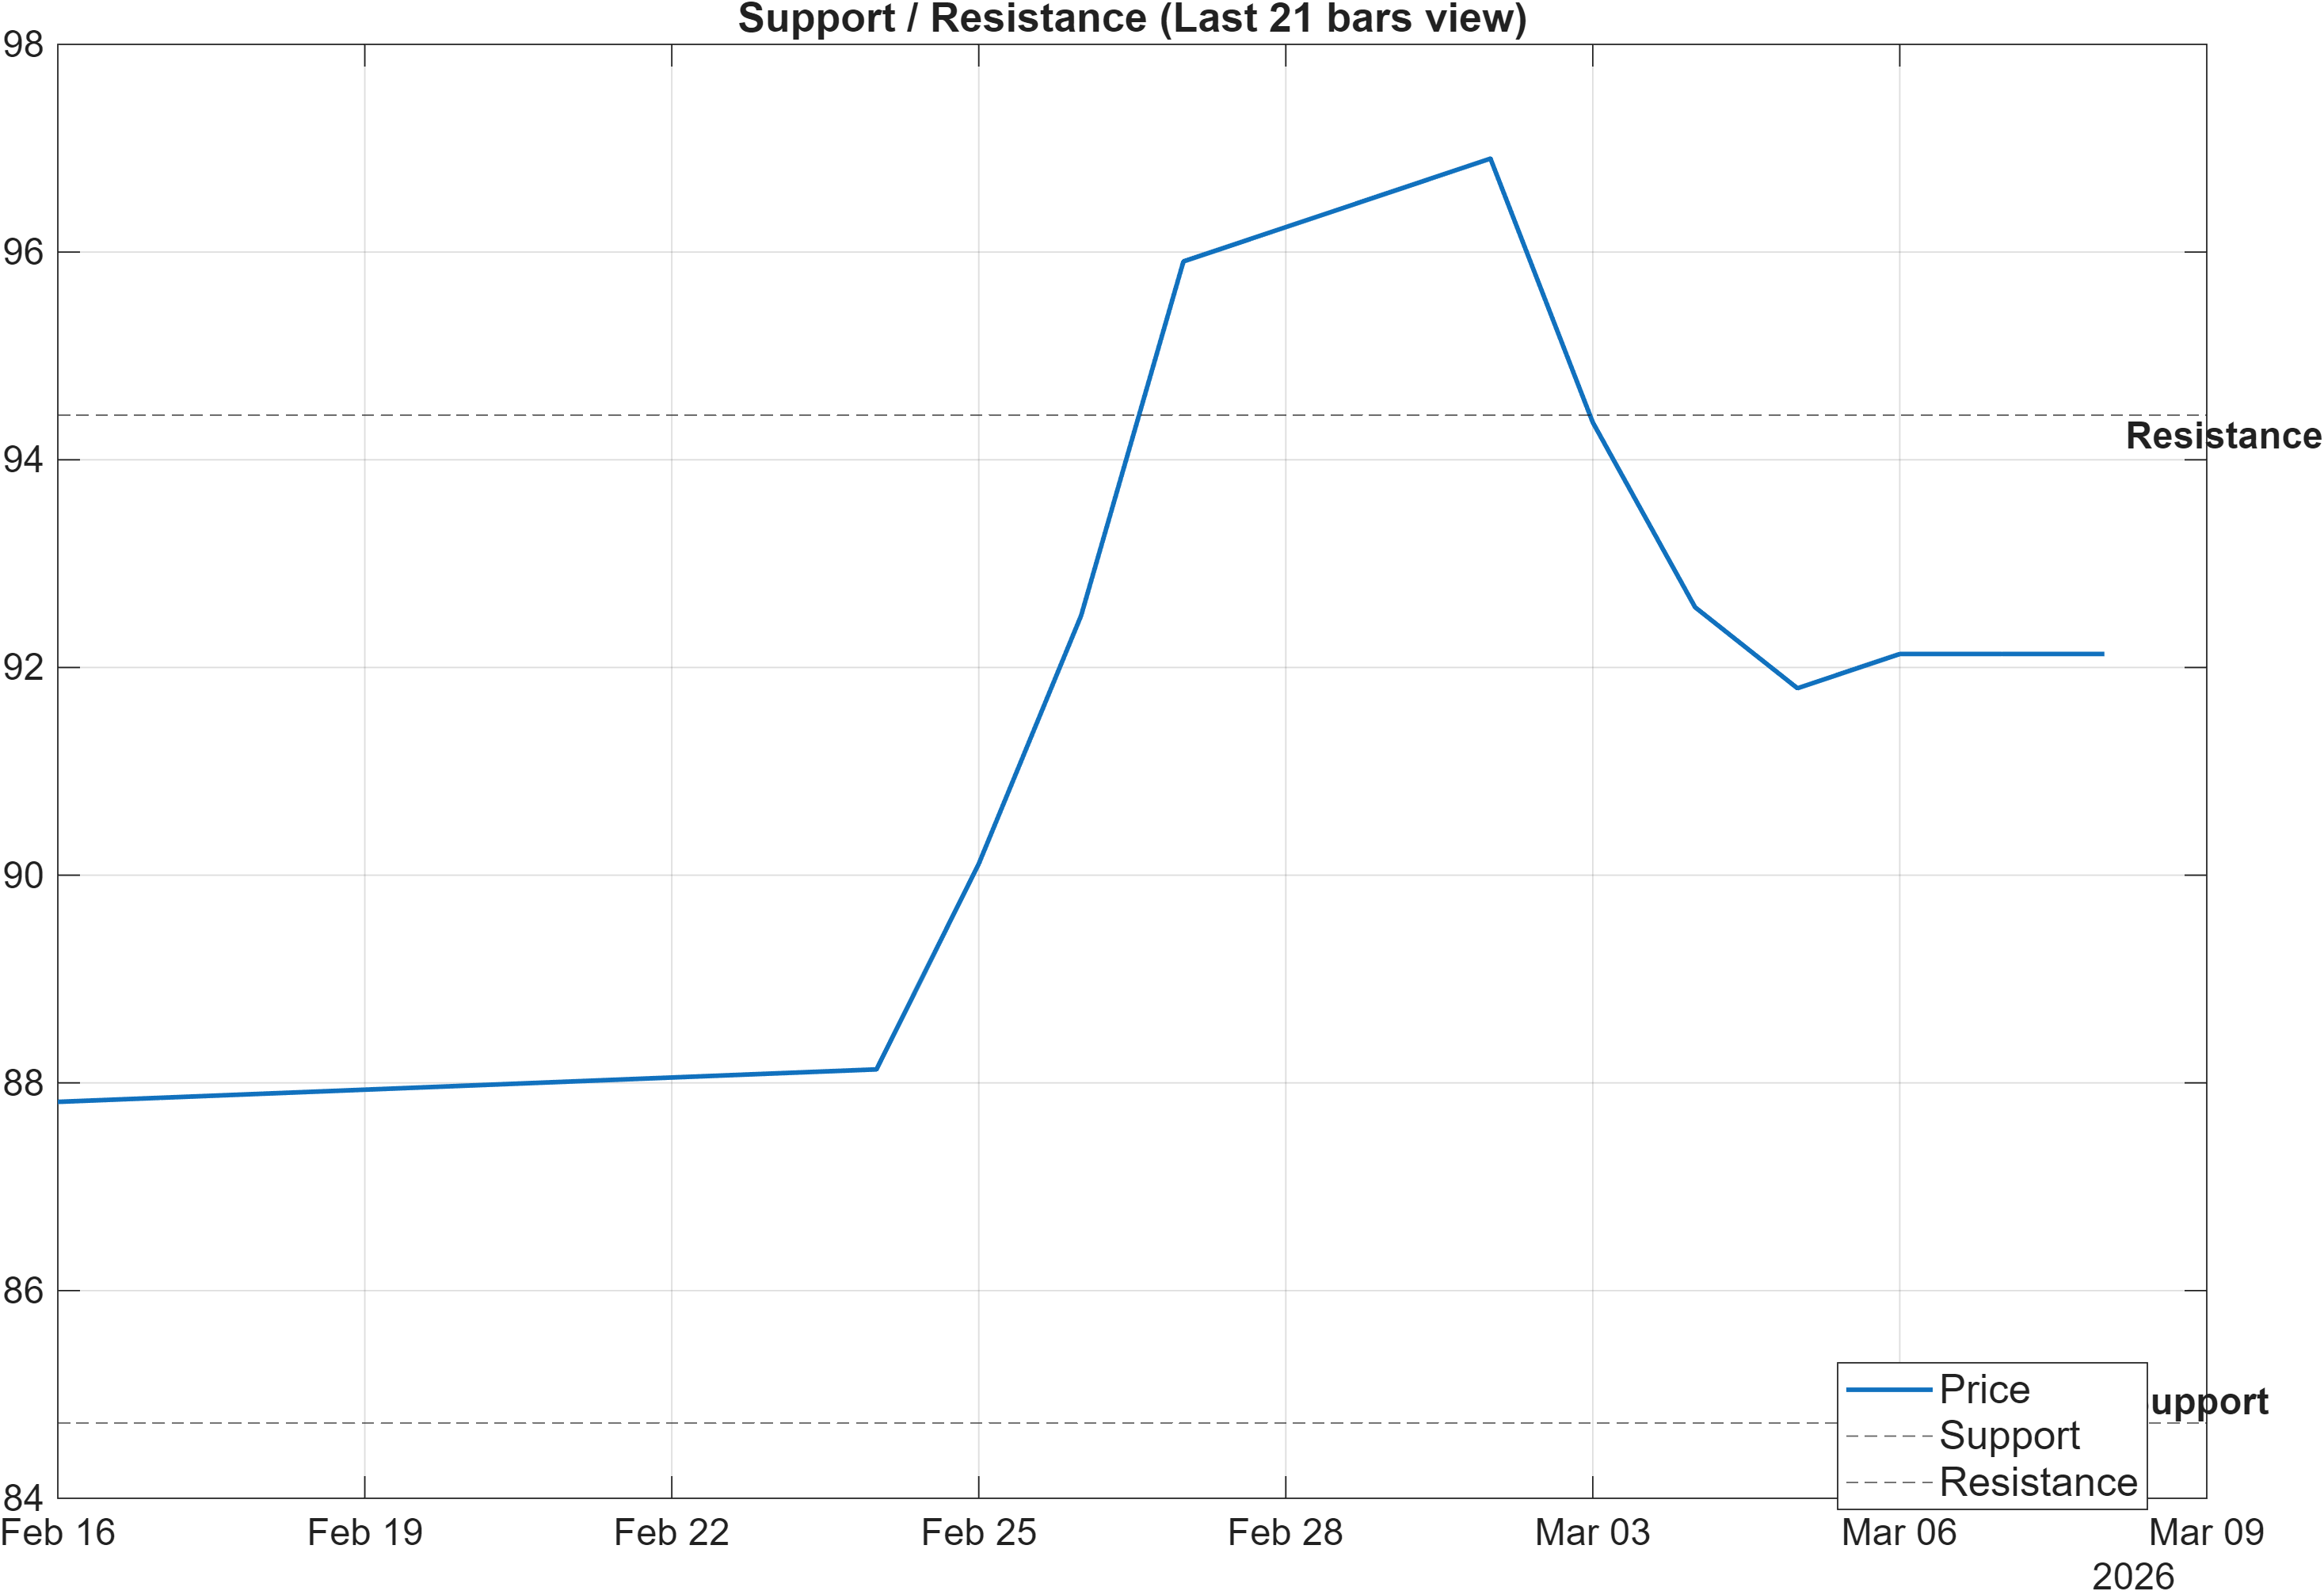
The current trading map is defined by a clean, two-sided framework: 84.7250 as support and 94.4300 as resistance. With volatility relatively contained (0.1450 bandwidth), these zones take on outsized analytical importance because the market is more likely to transition regimes via level breaks than via gradual drift.
Continuation requires level acceptance, not a momentary spike
The scenario guidance specifies “break above resistance with volume → continuation.” In practical analytical terms, that is a two-factor confirmation: price must exceed 94.4300 and participation must corroborate. This aligns with the broader signal stack: long-horizon ranks (yearly #6) argue for structural strength, but the neutral short-term rank (daily #900) argues against assuming immediate follow-through without confirmation.
Deterioration risk is defined and testable
On the downside, “close below support → signal deterioration risk” is an explicit invalidation boundary. A close below 84.7250 would introduce a regime change risk where bullish longer-horizon positioning can unwind faster than moving averages adjust. That would also likely pull momentum metrics into clearer alignment with the negative MACD histogram (-0.1665), shifting the analysis from “pause within trend” toward “trend stress.”
5) Quant Technical Dashboard (18 Signals)
KGNAI AI Technical Analysis Score (Deep Reinforcement Learning): Rank #520 out of 1293 (Rank 1 represents the strongest technical positioning and a higher probability of favorable price behavior. As ranks increase toward the maximum, the probability of favorable outcomes weakens and bearish positioning becomes more dominant.) | Label: Neutral | Score: 0.196
18-Signal Technical Confluence Score: 0.611 (Bullish)
Overall Technical Score (18-signal confluence + DRL rank blend): 0.486 (Bullish)
Note: The blended score reflects signal strength weighted against broader AI technical ranking, which may temporarily diverge.
Blended technical score breakdown: 0.486 (Bullish | Bull 12 / Bear 1 / Neutral 5)
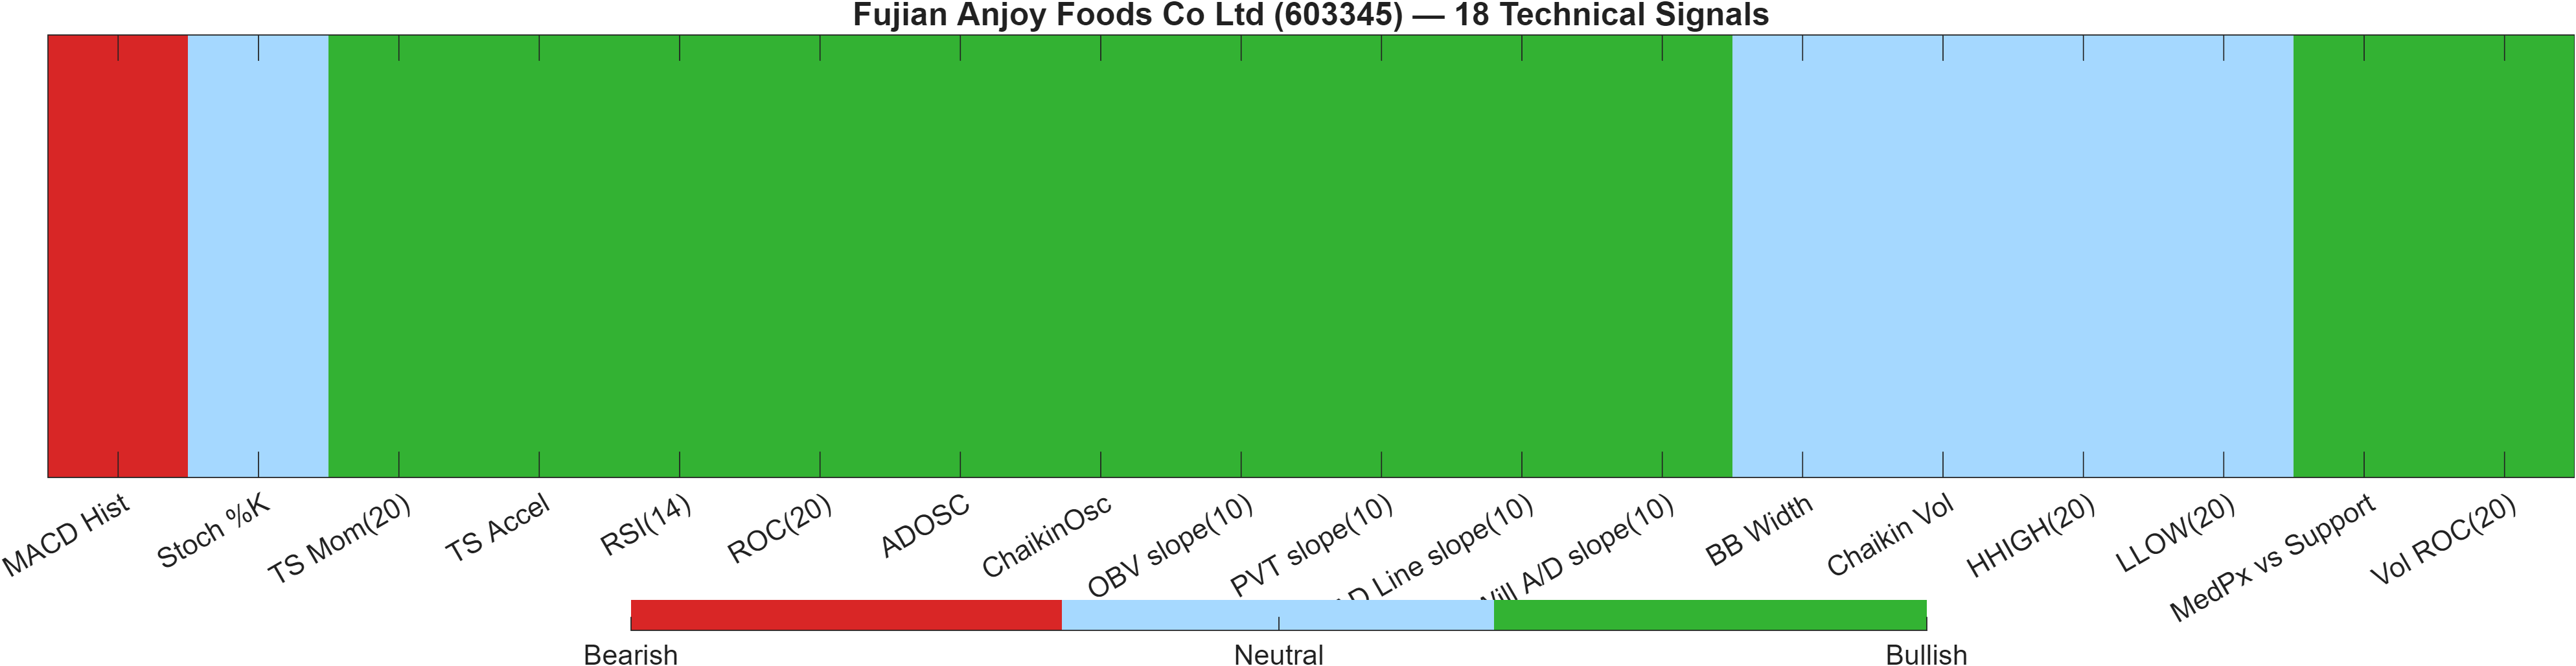
The dashboard highlights a constructive confluence that is stronger than the model-rank overlay. The 18-signal confluence score is 0.611 (Bullish), and the blended overall technical score remains Bullish at 0.486. However, the Deep Reinforcement Learning technical rank is #520 (Neutral) with a score of 0.196, signaling that while indicator alignment is favorable, the broader learned pattern-recognition layer is not confirming an outright “high-conviction” technical regime.
Alignment vs. divergence inside the technical stack
Internally, the blend is supported by the signal distribution (Bull 12 / Bear 1 / Neutral 5), but there is an important nuance: the lone bearish flag comes from MACD histogram (-0.1665), which matches the momentum dashboard’s short-term drag. Meanwhile, the momentum bias from RSI(14) at 64.28 remains supportive, helping explain why the confluence score stays bullish despite a negative MACD impulse.
Why a bullish confluence can coexist with a neutral AI technical rank
A neutral DRL rank alongside bullish confluence commonly appears when markets are strong but not clean—for example, when trend is intact (consistent with the bullish MA structure) yet price behavior is choppier or more range-bound than the strongest-ranked cohort. The current volatility backdrop (BB Width 0.145) supports this interpretation: lower volatility can lift confluence readings while keeping learned “breakout persistence” patterns less prominent. The decision framework remains level-driven: bullish confluence becomes more actionable if price accepts above 94.4300; it becomes more fragile if price violates 84.7250.
Signal table (Bull/Bear/Neutral)
| Indicator | Value | Signal |
|---|---|---|
| MACD Hist | -0.1665 | Bearish |
| Stoch %K | 22.96 | Neutral |
| TS Mom(20) | 4.274 | Bullish |
| TS Accel | 7.517 | Bullish |
| RSI(14) | 64.28 | Bullish |
| ROC(20) | 4.864 | Bullish |
| ADOSC | 56.04 | Bullish |
| ChaikinOsc | 1.434e+06 | Bullish |
| OBV slope(10) | 1.68e+07 | Bullish |
| PVT slope(10) | 9.26e+04 | Bullish |
| AD Line slope(10) | 1.415e+07 | Bullish |
| Will A/D slope(10) | 10.43 | Bullish |
| BB Width | 0.145 | Neutral |
| Chaikin Vol | -4.772 | Neutral |
| HHIGH(20) | 97.5 | Neutral |
| LLOW(20) | 87.7 | Neutral |
| MedPx vs Support | 7.17 | Bullish |
| Vol ROC(20) | 1.696 | Bullish |
Indicator-level signals form the base confluence, then the DRL model provides a separate, pattern-based overlay. When these differ (as they do here), the cleanest resolution usually comes from price behavior at the mapped levels, particularly in lower-volatility regimes.
6) News sentiment + extractive gist
Note: Instrument-specific news matches were not found, so the digest includes broader market/sector headlines. Links are provided for verification.
Sentiment score (avg): -0.013 | Positive: 0% | Neutral: 94% | Negative: 6%
KGNAI AI News Sentiment Score (normalized -1 to +1): Not available (as of —) | Label: Not available | Overall news score: -0.01
Positive Developments
Recent coverage across major financial outlets is not strongly skewed toward company-specific catalysts for 603345, but the broader tone captured by the dataset remains largely non-alarming. With 94% of items classified as neutral and an average sentiment of -0.013, the flow reads more like background narrative than a directional driver. In that context, “positive” is best interpreted as absence of persistent negative pressure rather than a surge of constructive catalysts. For a stock showing long-horizon strength (yearly rank #6), a neutral news backdrop can be supportive insofar as it allows technical structure—trend and support/resistance behavior—to remain the primary determinant of positioning. The key analytical takeaway is that sentiment is not providing a strong counter-signal against the bullish longer-term rank profile, leaving market participants more dependent on price confirmation near 94.4300 and the integrity of 84.7250.
Neutral / Mixed Developments
The news mix is dominated by generalized macro and cross-market narratives rather than instrument-level updates, which limits the usefulness of headline parsing for near-term trade selection. That aligns with the platform flag that instrument-specific matches were not found. As a result, the sentiment readings function primarily as a contextual bias: neutral overall, with the aggregate news score near flat (-0.01) and no normalized AI news score available (Not available). In markets where volatility is contained (Bollinger Bandwidth 0.1450), such a neutral backdrop often coincides with technically driven ranges where confirmation comes from level resolution rather than narrative re-rating. Put differently, the absence of a strong sentiment impulse makes the support/resistance framework comparatively more influential for timing.
Negative / Risk Signals
The dataset does include a small negative slice (6%) and a slightly negative average (-0.013), which should be treated as a mild headwind rather than a dominant risk factor—especially given the lack of instrument-specific coverage. The more relevant “risk signal” is analytical: when company-level news is sparse, markets can be more sensitive to technical breaks because there is less narrative buffering against momentum-driven repositioning. This matters given the mixed momentum state—bullish RSI (64.28) alongside a negative MACD histogram (-0.1665). If price were to lose 84.7250 on a closing basis, the absence of countervailing constructive news flow could amplify technical deterioration through positioning mechanics rather than fundamental repricing (fundamental detail is not available in the provided data).
- Whether price can reclaim and hold above 94.4300 with observable participation (volume confirmation).
- Whether 84.7250 holds on a closing basis during any pullback.
- Whether the momentum split resolves (RSI staying constructive while MACD hist improves from -0.1665, or instead rolls over).
Sources referenced: Reuters, Bloomberg, Yahoo Finance, MarketWatch, Investing.com
Snapshot: AI Rank (Short–Mid–Long): Mixed (Neutral–Neutral–Bullish) · Technical Confluence: Bullish · Key Levels: Support ~84.72 | Resistance ~94.43 · News Sentiment: Neutral
7) Sources
Instrument-specific news matches were not found in the provided dataset; the original source list contained general market/sector items and is intentionally compressed here per publication format.
You may also like: How KGNAI AI ranks instruments across global markets
Disclaimer: KGNAI provides AI-generated analytics and educational market commentary only. This is not financial advice. Markets involve risk. Always do your own research.