
603605 (Proya Cosmetics Co Ltd Class A) — 15-Mar-2026 Neutral technicals with bullish multi-horizon ranks
Proya Cosmetics Co Ltd Class A (603605) presents a mixed but constructive cross-horizon profile as of 15-Mar-2026. KGNAI’s ranking stack is strongest beyond the very short term: weekly (#26), 3-monthly (#28), 6-monthly (#22), and yearly (#12) positioning all sit in the upper slice of the 1293-instrument China universe, while the daily rank (#367) is comparatively weaker and reads neutral. Technically, the picture is more restrained: the price-to-moving-average relationship flags bearish near-term structure (close vs MA50 bearish; MA50 vs MA200 bearish), yet momentum is not uniformly negative—MACD histogram is positive (0.1030) even as RSI(14) remains bearish at 36.25. Volatility is relatively contained with Bollinger bandwidth at 0.0911, which can amplify reactions once price approaches key levels. Structurally, the report centers on support ~67.2100 and resistance ~76.3867 as decision zones, with neutral news sentiment (-0.013) offering limited directional bias.
- Rank stance: Short-term Neutral; Mid-term Bullish; Long-term Bullish
- Technical confluence: Neutral (18-signal score 0.056; overall technical score 0.044; DRL technical rank #636)
- Key levels: Support ~67.2100 | Resistance ~76.3867
- News sentiment bias: Neutral (avg -0.013; 94% neutral, 6% negative)
- Confirmation / invalidation: A break above 76.3867 with volume supports continuation, while a close below 67.2100 increases deterioration risk.
KGNAI evaluates assets using large cross-sectional datasets built from millions of structured data points. Inputs incorporate fundamental metrics, technical structures, and systematically processed news sentiment. Statistical models, machine learning, and AI frameworks are used to assess relative positioning, signal alignment, and probabilistic behavior across broad universes.
- Ranks are comparative across the tracked universe, not absolute price targets.
- Confluence reflects alignment among independent signal groups.
- Support/resistance levels are probabilistic decision zones, not guarantees.
- Sentiment provides contextual bias within the broader analytical framework.
1) KGNAI AI Analysis
Region: CHINA
Total universe size: 1293 ranked instruments
- Daily rank: #367 out of 1293 — Neutral
- Weekly rank: #26 out of 1293 — Bullish
- Monthly rank: #94 out of 1293 — Bullish
- 3-Monthly rank: #28 out of 1293 — Bullish
- 6-Monthly rank: #22 out of 1293 — Bullish
- Yearly rank: #12 out of 1293 — Bullish
The ranking term structure is the primary differentiator in this report: 603605’s yearly rank (#12) places it in the top percentile of the tracked China universe, with additional strength persisting through the weekly (#26) and 6-monthly (#22) windows. That persistence across multiple horizons typically signals that the asset has been scoring well on cross-sectional tests beyond a single-period spike.
By contrast, the daily rank (#367) is materially weaker and labeled neutral, creating a clear short-term vs longer-term divergence. In practical market-structure terms, this combination often corresponds to one of two states: (1) a longer-horizon uptrend or relative-strength phase that is undergoing a near-term pullback, or (2) a longer-horizon score that remains elevated while price-based signals temporarily lag.
KGNAI’s framework treats this as a timing problem rather than a directional certainty. When the long-horizon ranks (3-monthly #28 and yearly #12) remain strong while the daily rank softens, confirmation generally comes from subsequent stabilization in the technical layer and/or reclaiming key resistance zones. Until that occurs, the signal posture is best described as Neutral short-term with a Bullish bias in the mid-to-long horizon.
Term view: Short-term: Neutral. Mid-term: Bullish. Long-term: Bullish.
Want the full universe and complete rank tables? Unlock full access on KGNAI: https://www.kgnai.com/pricing
2) Price & trend overview
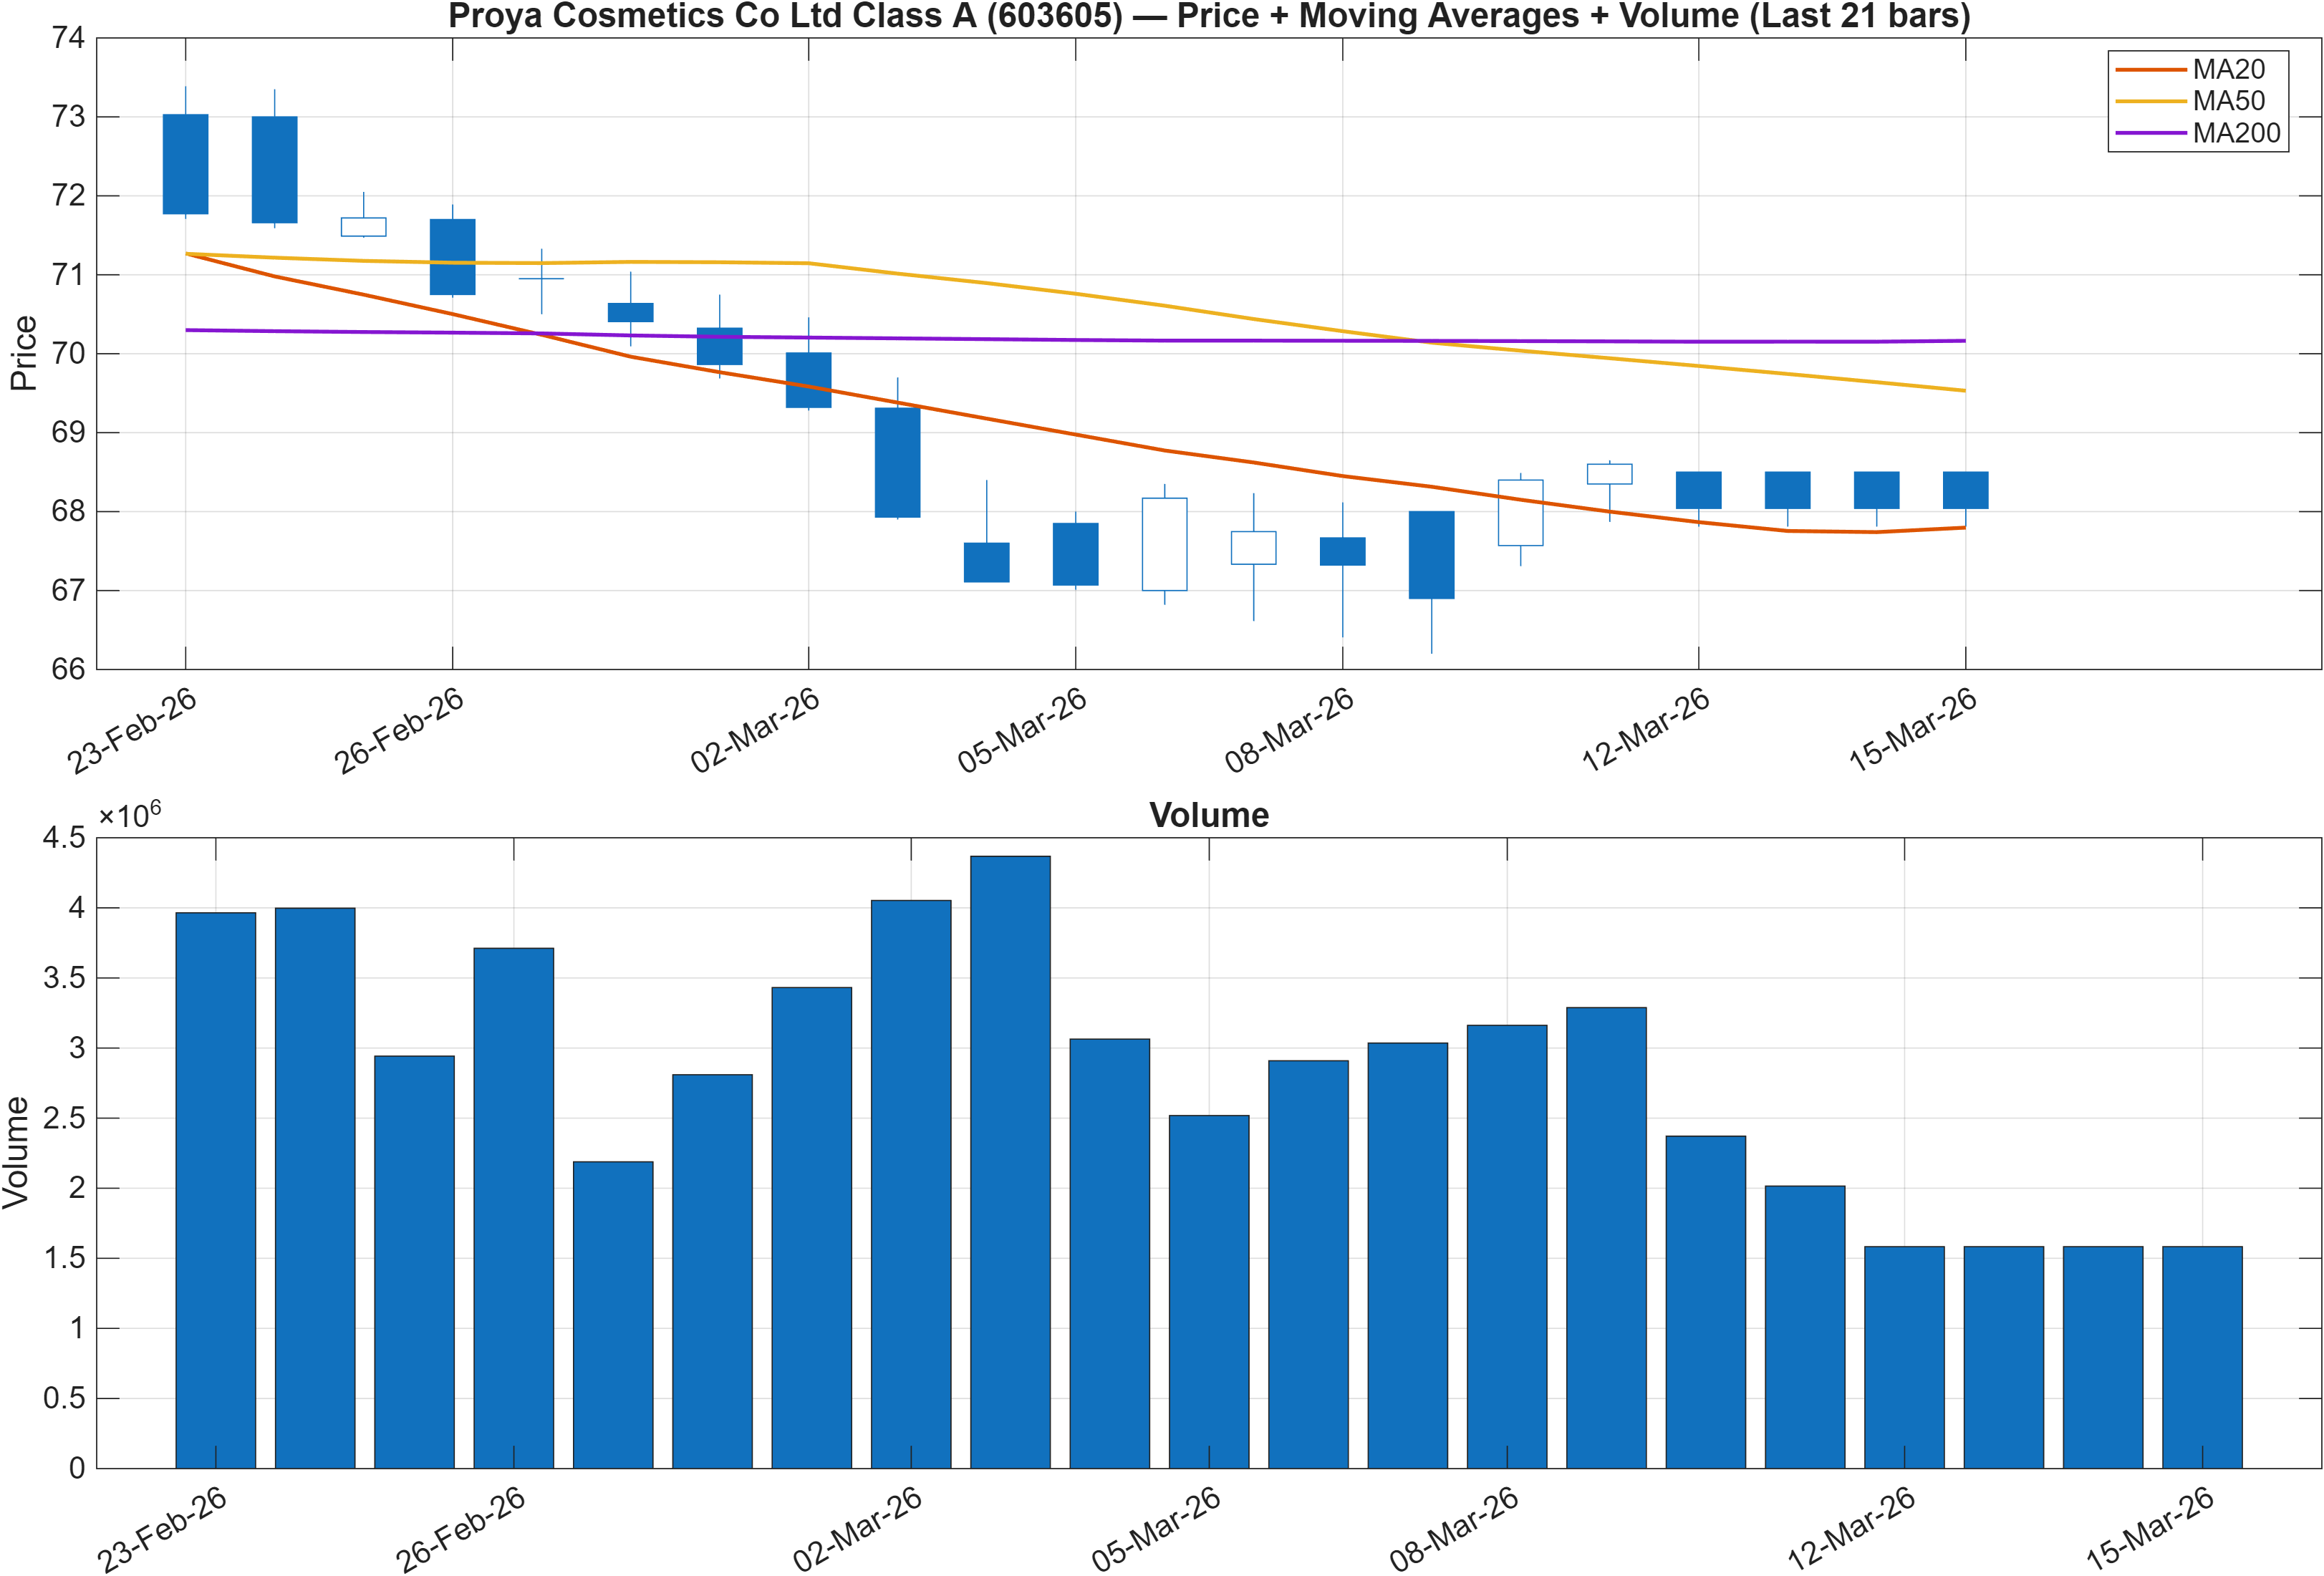
The trend layer is currently defined by a bearish moving-average configuration: close vs MA50 is bearish and MA50 vs MA200 is bearish. This matters because it sets the baseline for how to interpret improvements in momentum—positive oscillators can appear during counter-trend rebounds, but the broader trend filter remains cautious until the moving-average relationships start to repair.
Against the ranking backdrop, this creates a notable alignment gap: the longer-horizon KGNAI ranks (e.g., 6-monthly #22 and yearly #12) are materially stronger than what a bearish MA stack would normally imply. When this occurs, the most informative question becomes whether price is transitioning out of a drawdown phase (where ranks remain strong cross-sectionally) or whether the rank advantage is early and still awaiting technical confirmation.
The most actionable way to frame the price structure is via nearby decision zones discussed later (support ~67.2100; resistance ~76.3867). With moving averages bearish, trend continuation typically requires price to reclaim and hold above intermediate resistance while volume behavior supports the move; without that, rebounds can remain tactical rather than structural.
In that context, the report should be read as a risk-reward setup that is conditional: cross-sectional strength is present, but the trend filter is still restrictive. Any shift in momentum signals (MACD histogram 0.1030) needs to be assessed relative to this bearish MA backdrop rather than in isolation.
3) Momentum & volatility dashboard
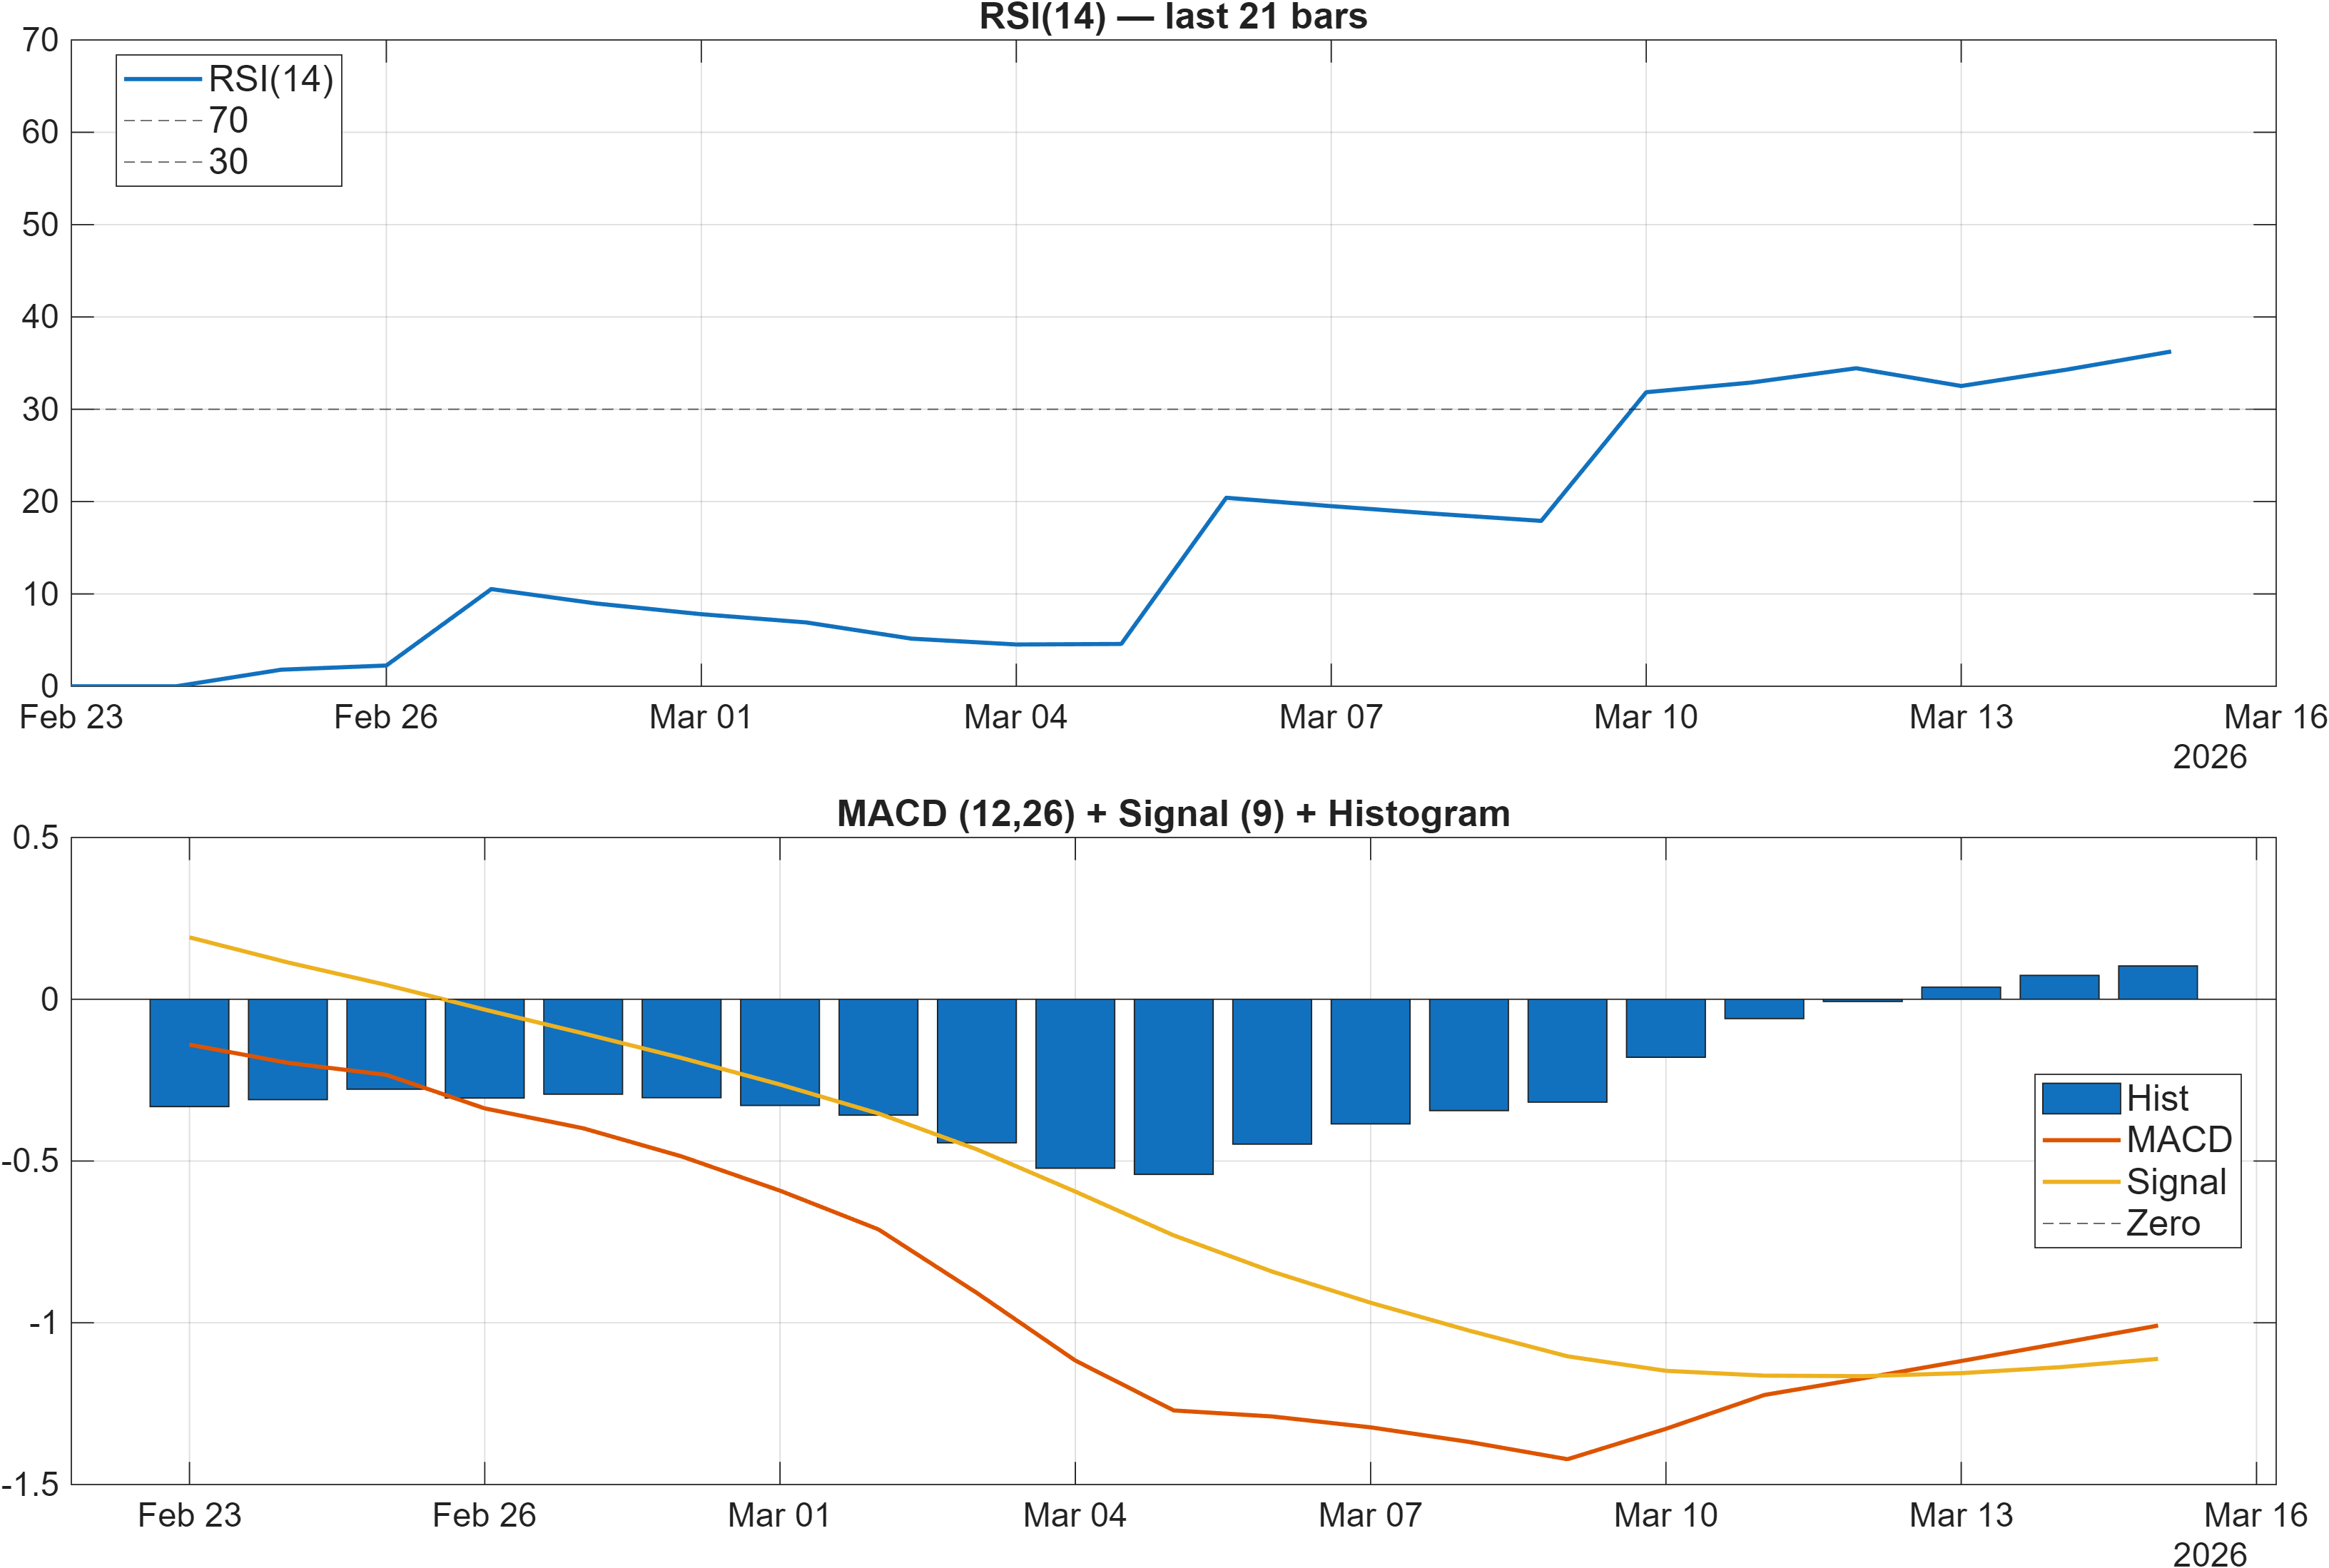
Momentum is split between oversold-leaning pressure and a modest improvement in the MACD complex. RSI(14) at 36.25 is labeled bearish, consistent with a market that has not yet re-established upside impulse. At the same time, the MACD histogram is 0.1030, which indicates positive momentum on that specific measure even while the broader RSI bias remains weak.
This RSI–MACD mismatch can be read as compression rather than confirmation: MACD histogram positivity can emerge early in basing or rebound attempts, while RSI remains below stronger regime thresholds until participation broadens. The signal table reinforces that “early turn” interpretation—TS Accel is bullish at 0.87, yet TS Mom(20) is bearish at -3.62 and ROC(20) is bearish at -5.47, highlighting that short-horizon speed is improving but the recent performance window is still negative.
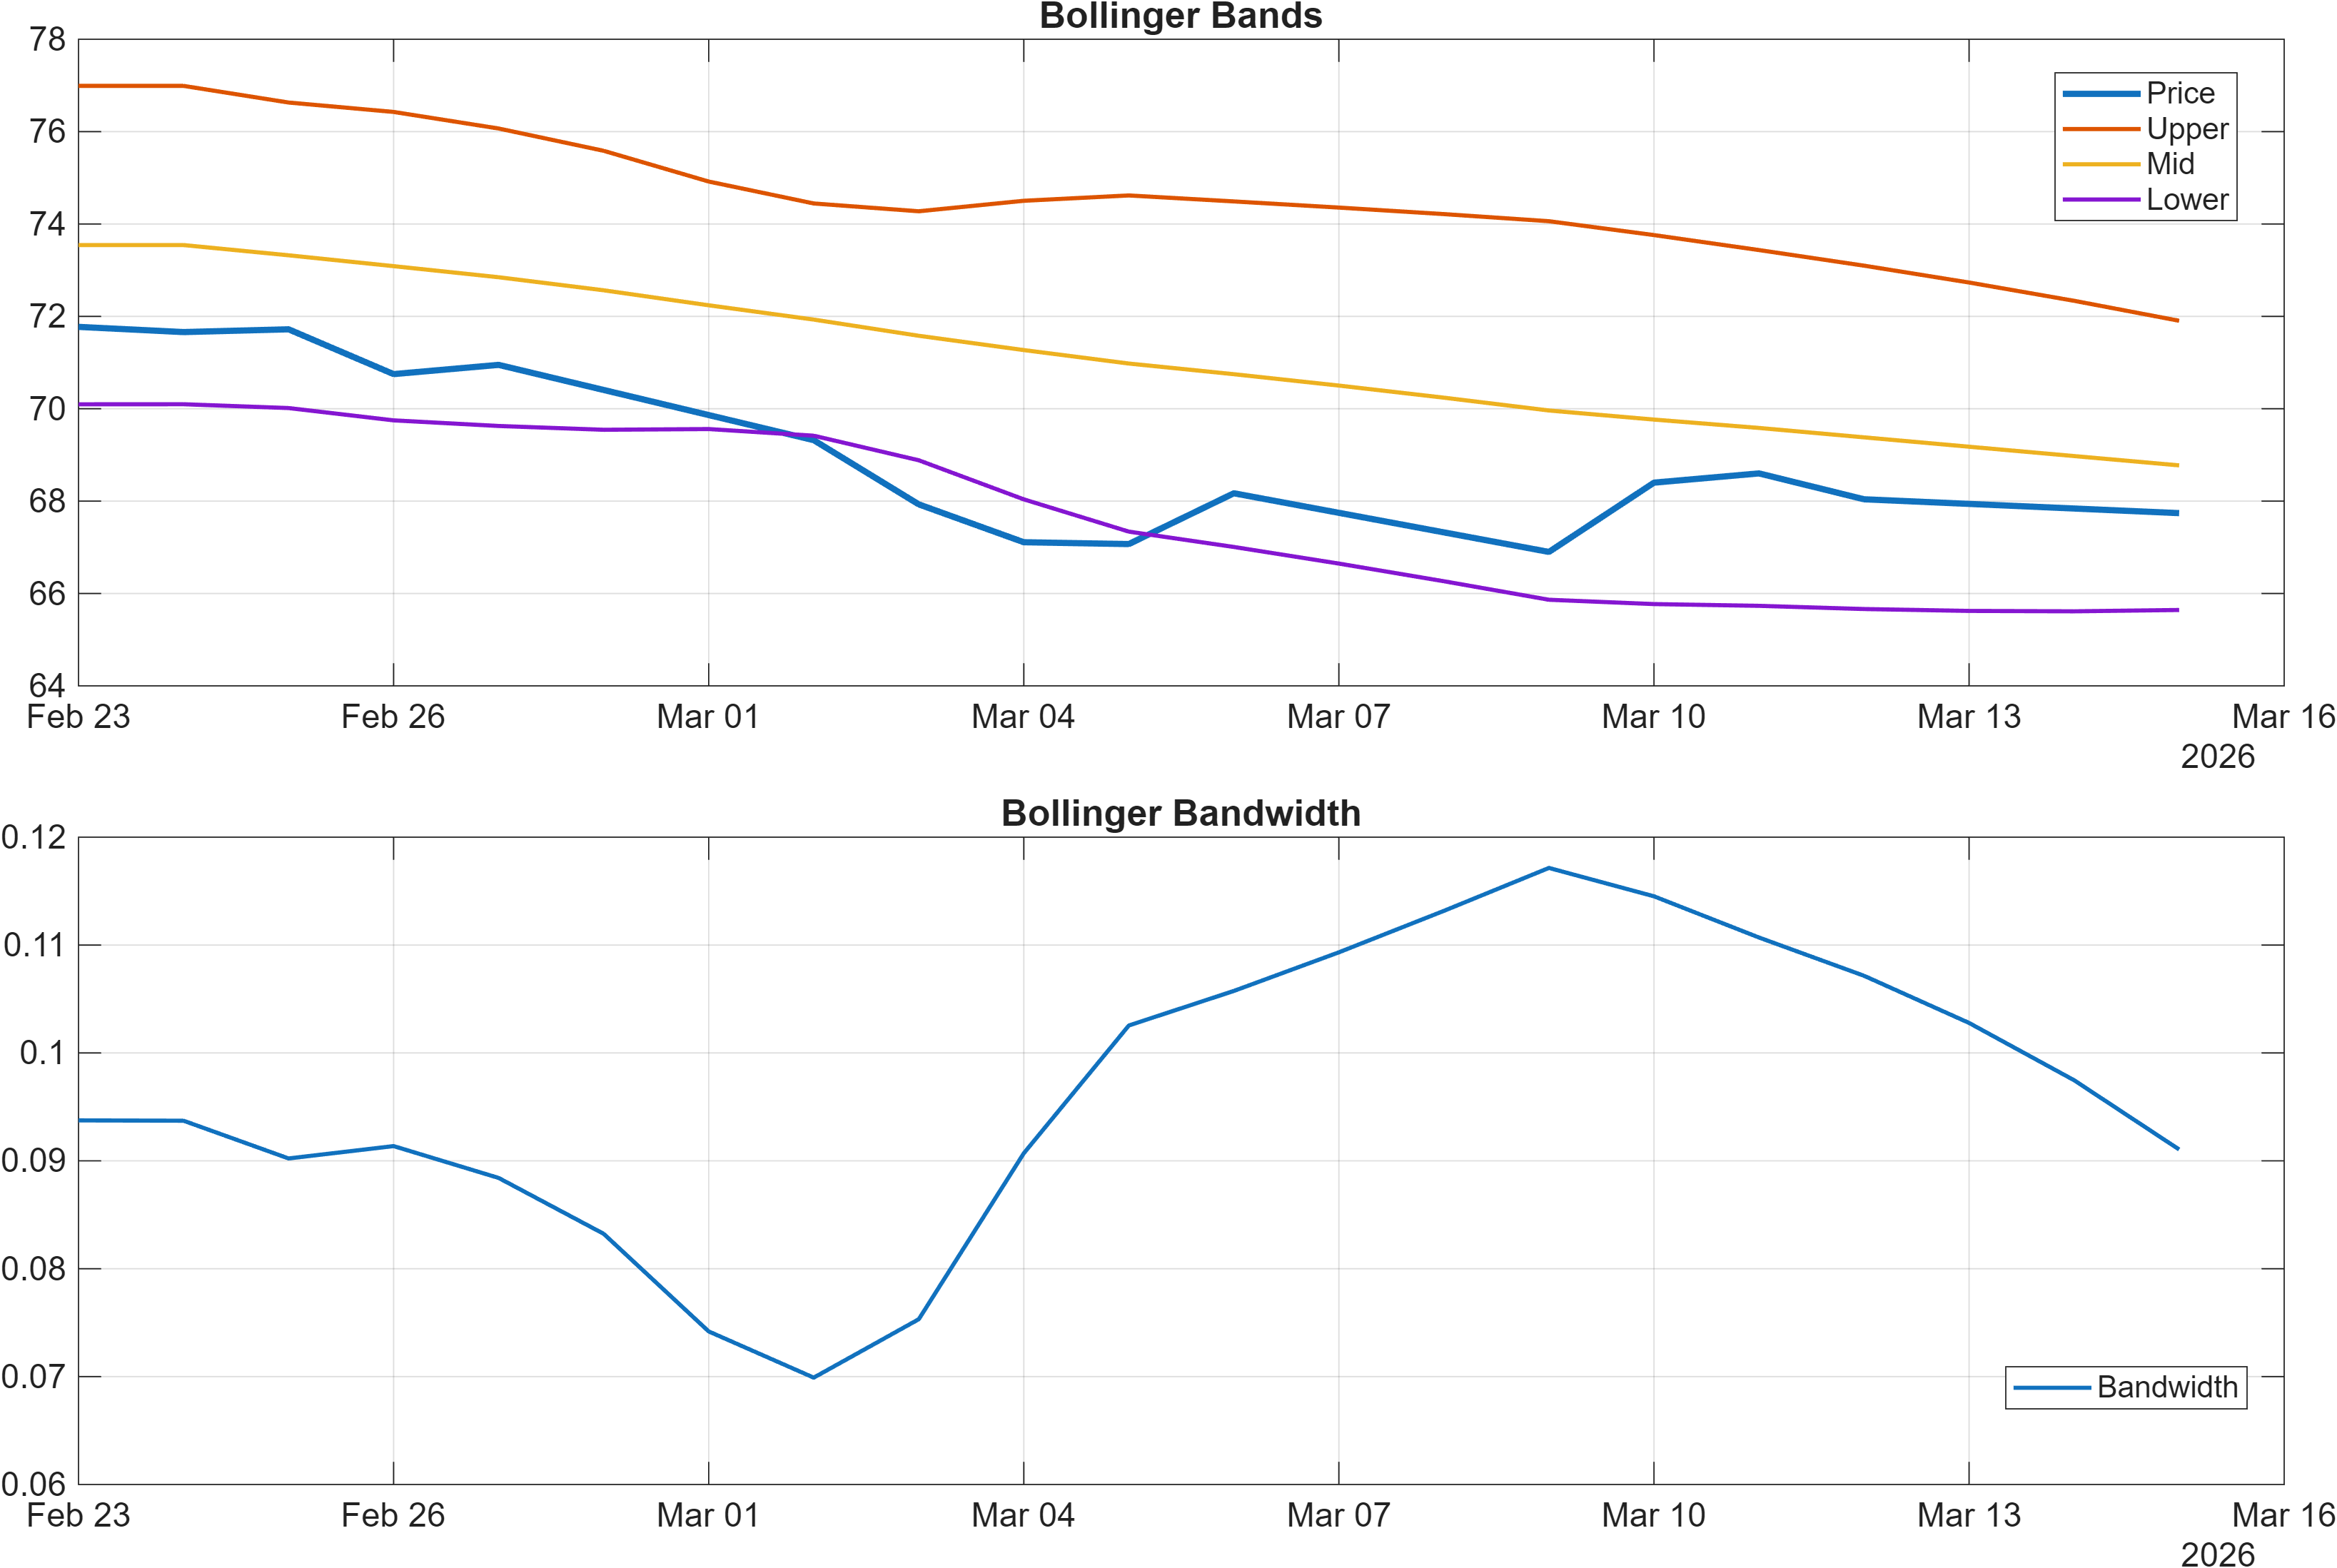
Volatility is relatively contained with Bollinger bandwidth at 0.0911. A tighter bandwidth regime often coincides with range formation and makes subsequent level breaks more informative: if price approaches resistance (~76.3867) with expanding volatility and supportive volume, it strengthens the case for regime improvement; if volatility expands to the downside and price loses support (~67.2100), it validates deterioration risk.
4) Support / Resistance zones
Support ~ 67.2100 | Resistance ~ 76.3867
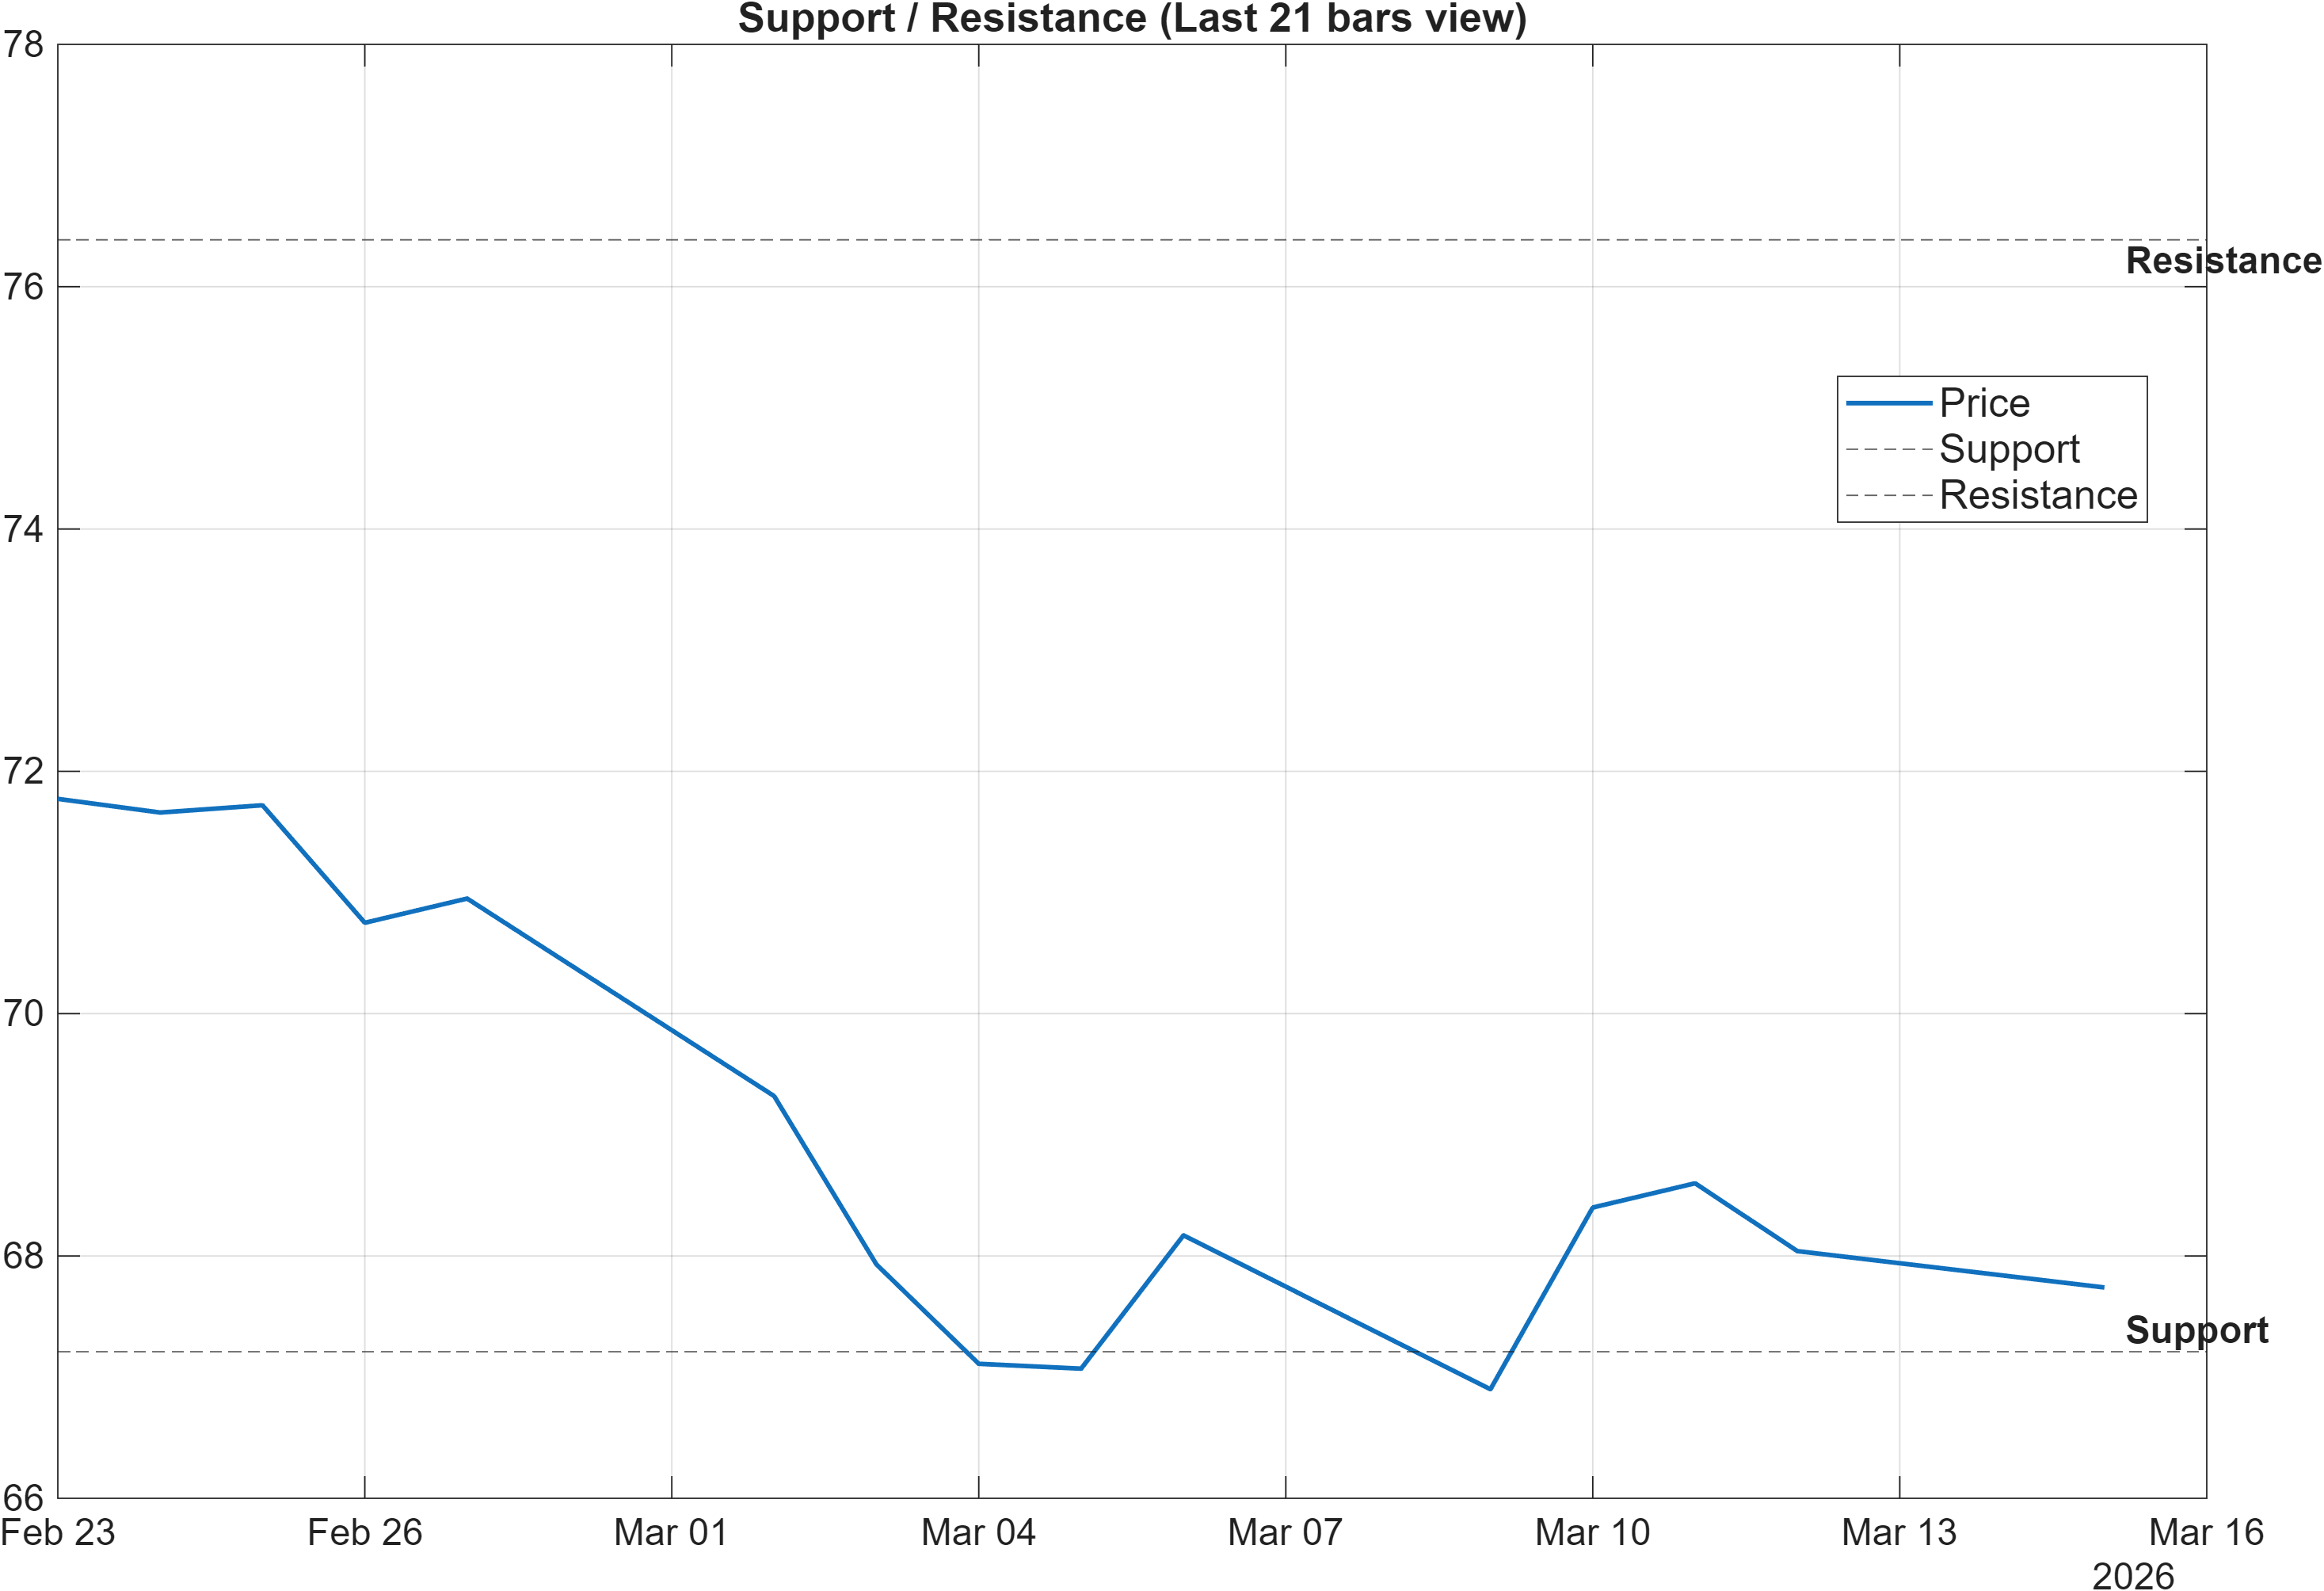
The support/resistance map frames the report’s core decision structure. With moving averages bearish, the resistance zone near 76.3867 functions as a practical test of whether momentum improvements can translate into trend repair. A break above resistance “with volume,” as the scenario note states, is a higher-quality confirmation condition because it couples price acceptance with participation—particularly important when the MA50 vs MA200 relationship is still bearish.
On the downside, support near 67.2100 is the key boundary separating a controlled pullback from a deeper drawdown. This level takes on added weight given bearish RSI bias (36.25) and negative rate-of-change characteristics (ROC(20) -5.47; TS Mom(20) -3.62). If price closes below support, the technical layer would be more likely to align with the weaker daily rank (#367), tightening the window for long-horizon ranks (e.g., yearly #12) to “stay ahead” of price.
This is also where volatility regime matters: bandwidth at 0.0911 suggests the market is not currently in an expanded-volatility state. If volatility expands while price is near either boundary, level behavior can become more decisive—support breaks are less likely to be immediately mean-reverting in rising-volatility conditions, while resistance breaks can transition into persistent trends if follow-through remains intact.
Overall, the level structure supports a conditional continuation framework: resistance is the gateway to improving structure; support is the line where deterioration risk becomes dominant.
5) Quant Technical Dashboard (18 Signals)
KGNAI AI Technical Analysis Score (Deep Reinforcement Learning): Rank #636 out of 1293 (Rank 1 represents the strongest technical positioning and a higher probability of favorable price behavior. As ranks increase toward the maximum, the probability of favorable outcomes weakens and bearish positioning becomes more dominant.) | Label: Neutral | Score: 0.016
18-Signal Technical Confluence Score: 0.056 (Neutral)
Overall Technical Score (18-signal confluence + DRL rank blend): 0.044 (Neutral)
Note: The blended score reflects signal strength weighted against broader AI technical ranking, which may temporarily diverge.
Blended technical score breakdown: 0.044 (Neutral | Bull 7 / Bear 6 / Neutral 5)
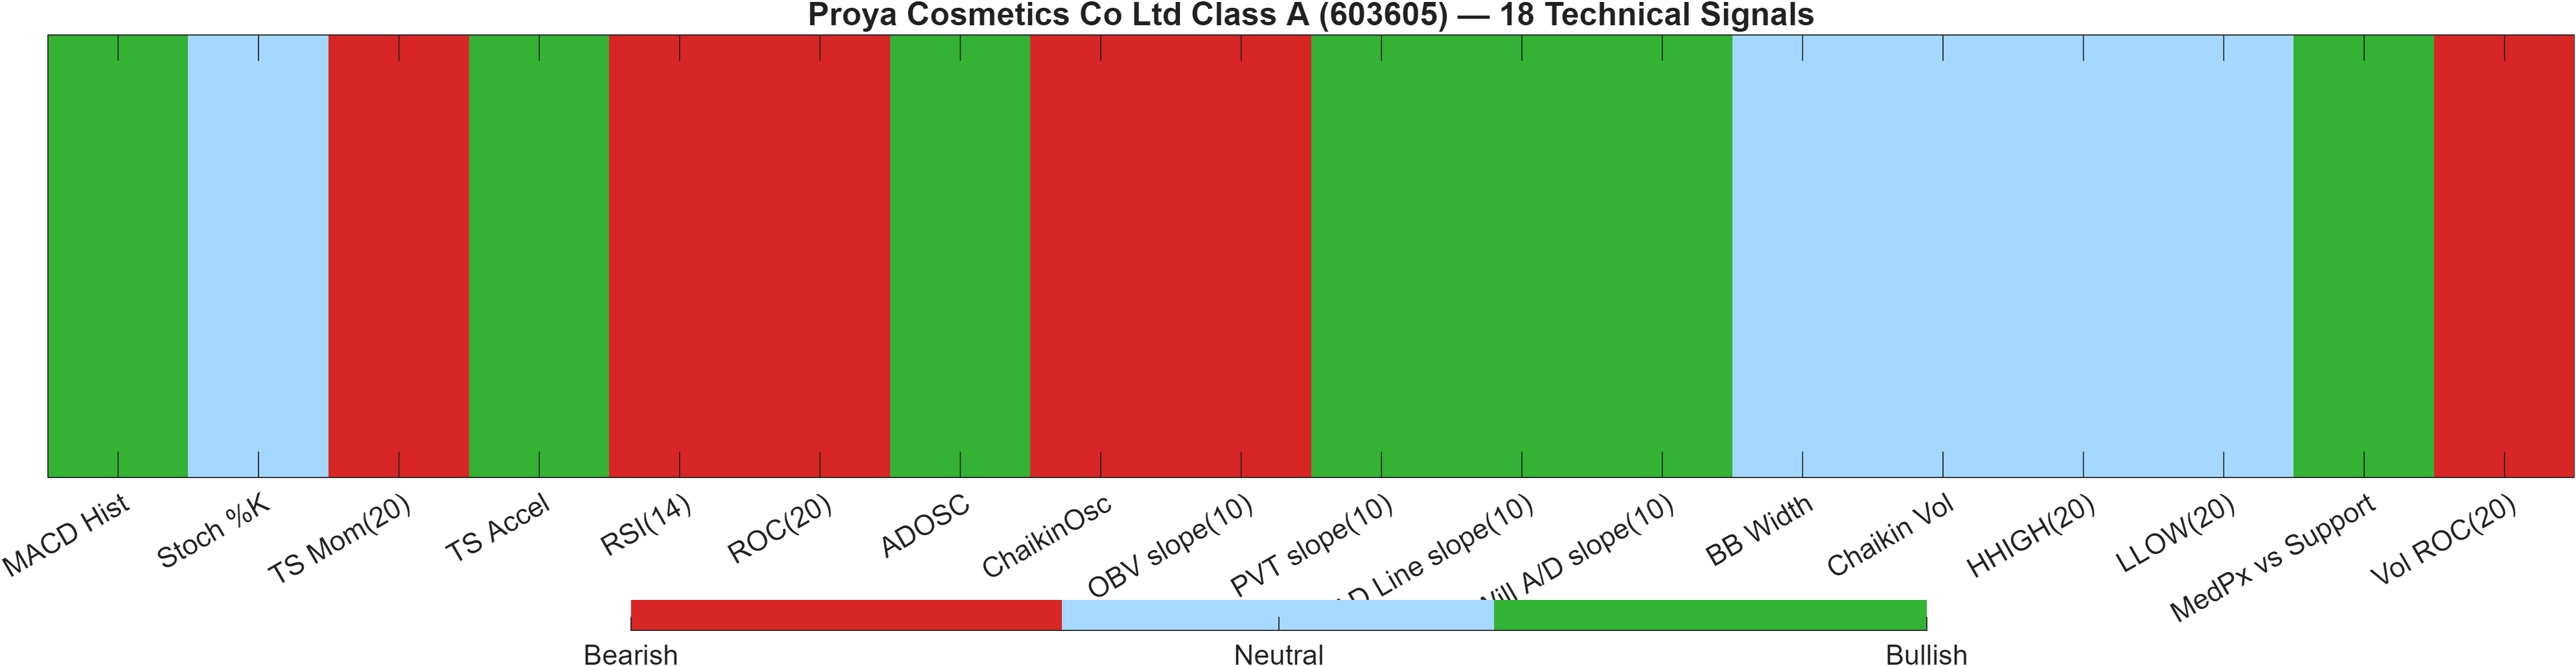
The technical dashboard consolidates multiple independent signals into a single confluence framework, then contextualizes it with a separate AI technical ranking model. Here, both layers land in Neutral: the 18-signal confluence score is 0.056, the overall technical score is 0.044, and the DRL technical model places 603605 at #636 out of 1293 with a score of 0.016.
Importantly, neutrality here is not “no information”—it reflects offsetting forces. Momentum readings are mixed (MACD Hist bullish at 0.103 while RSI(14) bearish at 36.25). Participation/volume signals are also split: ADOSC is bullish at 16.67 while Vol ROC(20) is bearish at -60.39, suggesting that accumulation/distribution dynamics are not uniformly supported by recent volume change.
The bull/bear count (Bull 7 / Bear 6 / Neutral 5) indicates a narrowly balanced internal state. In that kind of configuration, levels and regime filters tend to dominate decision-making: a clean reclaim of resistance (~76.3867) can flip several borderline signals simultaneously, while a breakdown below support (~67.2100) can cause neutral readings (e.g., BB Width 0.09105) to shift into a higher-risk posture as volatility expands.
Signal table (Bull/Bear/Neutral)
| Indicator | Value | Signal |
|---|---|---|
| MACD Hist | 0.103 | Bullish |
| Stoch %K | 75.1 | Neutral |
| TS Mom(20) | -3.62 | Bearish |
| TS Accel | 0.87 | Bullish |
| RSI(14) | 36.25 | Bearish |
| ROC(20) | -5.47 | Bearish |
| ADOSC | 16.67 | Bullish |
| ChaikinOsc | -9.166e+05 | Bearish |
| OBV slope(10) | -3.773e+06 | Bearish |
| PVT slope(10) | 3.457e+04 | Bullish |
| AD Line slope(10) | 4.59e+06 | Bullish |
| Will A/D slope(10) | 0.64 | Bullish |
| BB Width | 0.09105 | Neutral |
| Chaikin Vol | -24.71 | Neutral |
| HHIGH(20) | 73.35 | Neutral |
| LLOW(20) | 66.2 | Neutral |
| MedPx vs Support | 0.945 | Bullish |
| Vol ROC(20) | -60.39 | Bearish |
Interpretation: Indicator-level signals form the base confluence, which is then adjusted using a separate AI-driven technical ranking model. The final technical score summarizes this combined view.
6) News sentiment + extractive gist
Note: Instrument-specific news matches were not found, so the digest includes broader market/sector headlines. Links are provided for verification.
Sentiment score (avg): -0.013 | Positive: 0% | Neutral: 94% | Negative: 6%
KGNAI AI News Sentiment Score (normalized -1 to +1): Not available (as of —) | Label: Not available | Overall news score: -0.01
Positive Developments
Recent coverage across major financial outlets is largely non-instrument-specific for 603605 in the provided feed, which is consistent with the sentiment mix showing 94% neutral items and 0% positive classification. Still, the small negative average (-0.013) suggests the aggregate news backdrop has not been strongly constructive, and any “positive” contribution is better interpreted as absence of incremental stress rather than a catalyst. For tactical positioning, this kind of news environment tends to shift attention back to price discovery and liquidity behavior: with MACD histogram positive (0.1030) but RSI(14) bearish (36.25), investors may rely more on whether the tape can absorb supply near resistance (~76.3867) than on narrative follow-through. In short, the constructive element is the lack of concentrated instrument shocks in the dataset, leaving the technical and rank framework as the dominant decision lens.
Neutral / Mixed Developments
The digest is dominated by broad geopolitical and market-structure themes rather than company-specific developments, which aligns with the report’s “Not available” instrument-level sentiment score and the neutral-heavy distribution. Neutral news flow tends to act as contextual noise unless it transmits into volatility or risk appetite. With Bollinger bandwidth at 0.0911, the market is not currently signaling a high-volatility regime, so mixed headlines may remain background factors unless they coincide with a decisive interaction at structural levels. As a result, interpretation should remain conditional: level behavior around 67.2100 and 76.3867 is likely to be more informative than generalized news tone.
Negative / Risk Signals
The negative slice is small (6%) but directionally relevant because the average score is slightly below zero (-0.013) and the overall news score is -0.01. With no instrument-specific matches, “risk” in this section is best treated as macro and sentiment spillover risk rather than company-event risk. This matters more when technicals are already neutral-to-fragile: RSI(14) at 36.25 and bearish moving-average relationships can make the price more sensitive to risk-off impulses, particularly if volume re-accelerates in the wrong direction (Vol ROC(20) -60.39). From a portfolio construction standpoint, the key issue is whether broader negative tone coincides with a close below 67.2100, which would shift the market’s interpretation from consolidation to deterioration.
- Whether sentiment remains predominantly neutral (near the current 94%) or shifts toward a higher negative share.
- Any volatility pickup (relative to bandwidth 0.0911) occurring near 67.2100 or 76.3867.
- Whether momentum stabilizes (MACD hist 0.1030) while RSI(14) lifts from 36.25.
Sources referenced: Reuters, Bloomberg, Yahoo Finance, MarketWatch, Investing.com
Snapshot: AI Rank (Short–Mid–Long): Mixed (Bullish tilt) (Neutral–Bullish–Bullish) · Technical Confluence: Neutral · Key Levels: Support ~67.21 | Resistance ~76.39 · News Sentiment: Neutral
7) Sources
Not available in the provided data.
You may also like: How KGNAI AI ranks instruments across global markets
Disclaimer: KGNAI provides AI-generated analytics and educational market commentary only. This is not financial advice. Markets involve risk. Always do your own research.