
600019 — Baoshan Iron & Steel Co Ltd (08-May-2026) | Neutral ranks with bearish trend structure
Baoshan Iron & Steel Co Ltd (600019) is currently positioned in a neutral cross-sectional rank regime across short and medium horizons, while the longer lookback shows comparatively stronger relative standing. The immediate technical backdrop is more conflicted: price is below the MA50 and the MA50 is below the MA200, a configuration that typically reflects a softer trend structure even when momentum measures are attempting to stabilize. Momentum indicators are not extreme—RSI(14) at 46.67 suggests neither overbought nor oversold conditions—while MACD histogram at 0.0064 indicates marginal positive impulse rather than a decisive turn. Volatility remains contained with Bollinger bandwidth at 0.0294, which can precede sharper directional movement once price tests key levels. For tactical framing, the market’s main decision zone is bounded by support ~6.2633 and resistance ~7.0750, with confirmation likely requiring a level break accompanied by participation.
Key Takeaways
- Rank stance: Short-term Neutral | Mid-term Neutral | Long-term Neutral (Yearly rank shows a comparatively stronger relative position at #165/1292).
- Technical confluence: Neutral (18-signal confluence 0.222; overall technical score 0.085).
- Key levels: Support ~6.2633 | Resistance ~7.0750.
- News sentiment bias: Neutral (avg 0.000; 88% neutral).
- Confirmation / invalidation: A break above 7.0750 with volume supports continuation; a close below 6.2633 increases deterioration risk.
What KGNAI Measures
KGNAI evaluates assets using large cross-sectional datasets built from millions of structured data points. Inputs incorporate fundamental metrics, technical structures, and systematically processed news sentiment. Statistical models, machine learning, and AI frameworks are used to assess relative positioning, signal alignment, and probabilistic behavior across broad universes.
How to Read This Report
- Ranks are comparative across the tracked universe, not absolute price targets.
- Confluence reflects alignment among independent signal groups.
- Support/resistance levels are probabilistic decision zones, not guarantees.
- Sentiment provides contextual bias within the broader analytical framework.
1) KGNAI AI Analysis
Region: CHINA
Total universe size: 1292 ranked instruments
- Daily rank: #533 out of 1292 — Neutral
- Weekly rank: #462 out of 1292 — Neutral
- Monthly rank: #379 out of 1292 — Neutral
- 3-Monthly rank: #376 out of 1292 — Neutral
- 6-Monthly rank: #420 out of 1292 — Neutral
- Yearly rank: #165 out of 1292 — Bullish
Cross-horizon ranking places 600019 in the middle of the universe for most short-to-intermediate windows, while the yearly rank is meaningfully stronger. The daily rank at #533/1292 and weekly rank at #462/1292 imply the model is not currently rewarding near-term behavior relative to peers; the monthly and 3-month ranks (#379 and #376) improve but remain broadly neutral rather than leadership. Against that backdrop, the yearly rank at #165/1292 sits closer to the upper cohort, suggesting that longer-window behavior has been more resilient than recent tape would imply.
This is a classic timeframe divergence: long-horizon relative stability coexisting with muted short-horizon positioning. In practice, this often corresponds to a market that has not broken down structurally but has lost momentum versus faster-moving comparables. The stated term view remains Neutral across short-, mid-, and long-term, which fits the idea that the model is not seeing sufficient confirmation to upgrade trend-following confidence, nor enough deterioration to move into a bearish regime.
For readers using ranks as a risk filter, the key nuance is that the long-horizon improvement does not automatically “override” weaker short windows—rather, it increases the importance of price confirmation around the key levels cited later (6.2633 and 7.0750). Until a break clarifies direction, the rank stack argues for patience and selective exposure sizing.
Term view: Short-term: Neutral. Mid-term: Neutral. Long-term: Neutral.
Want the full universe and complete rank tables? Unlock full access on KGNAI: https://www.kgnai.com/pricing
2) Price & trend overview
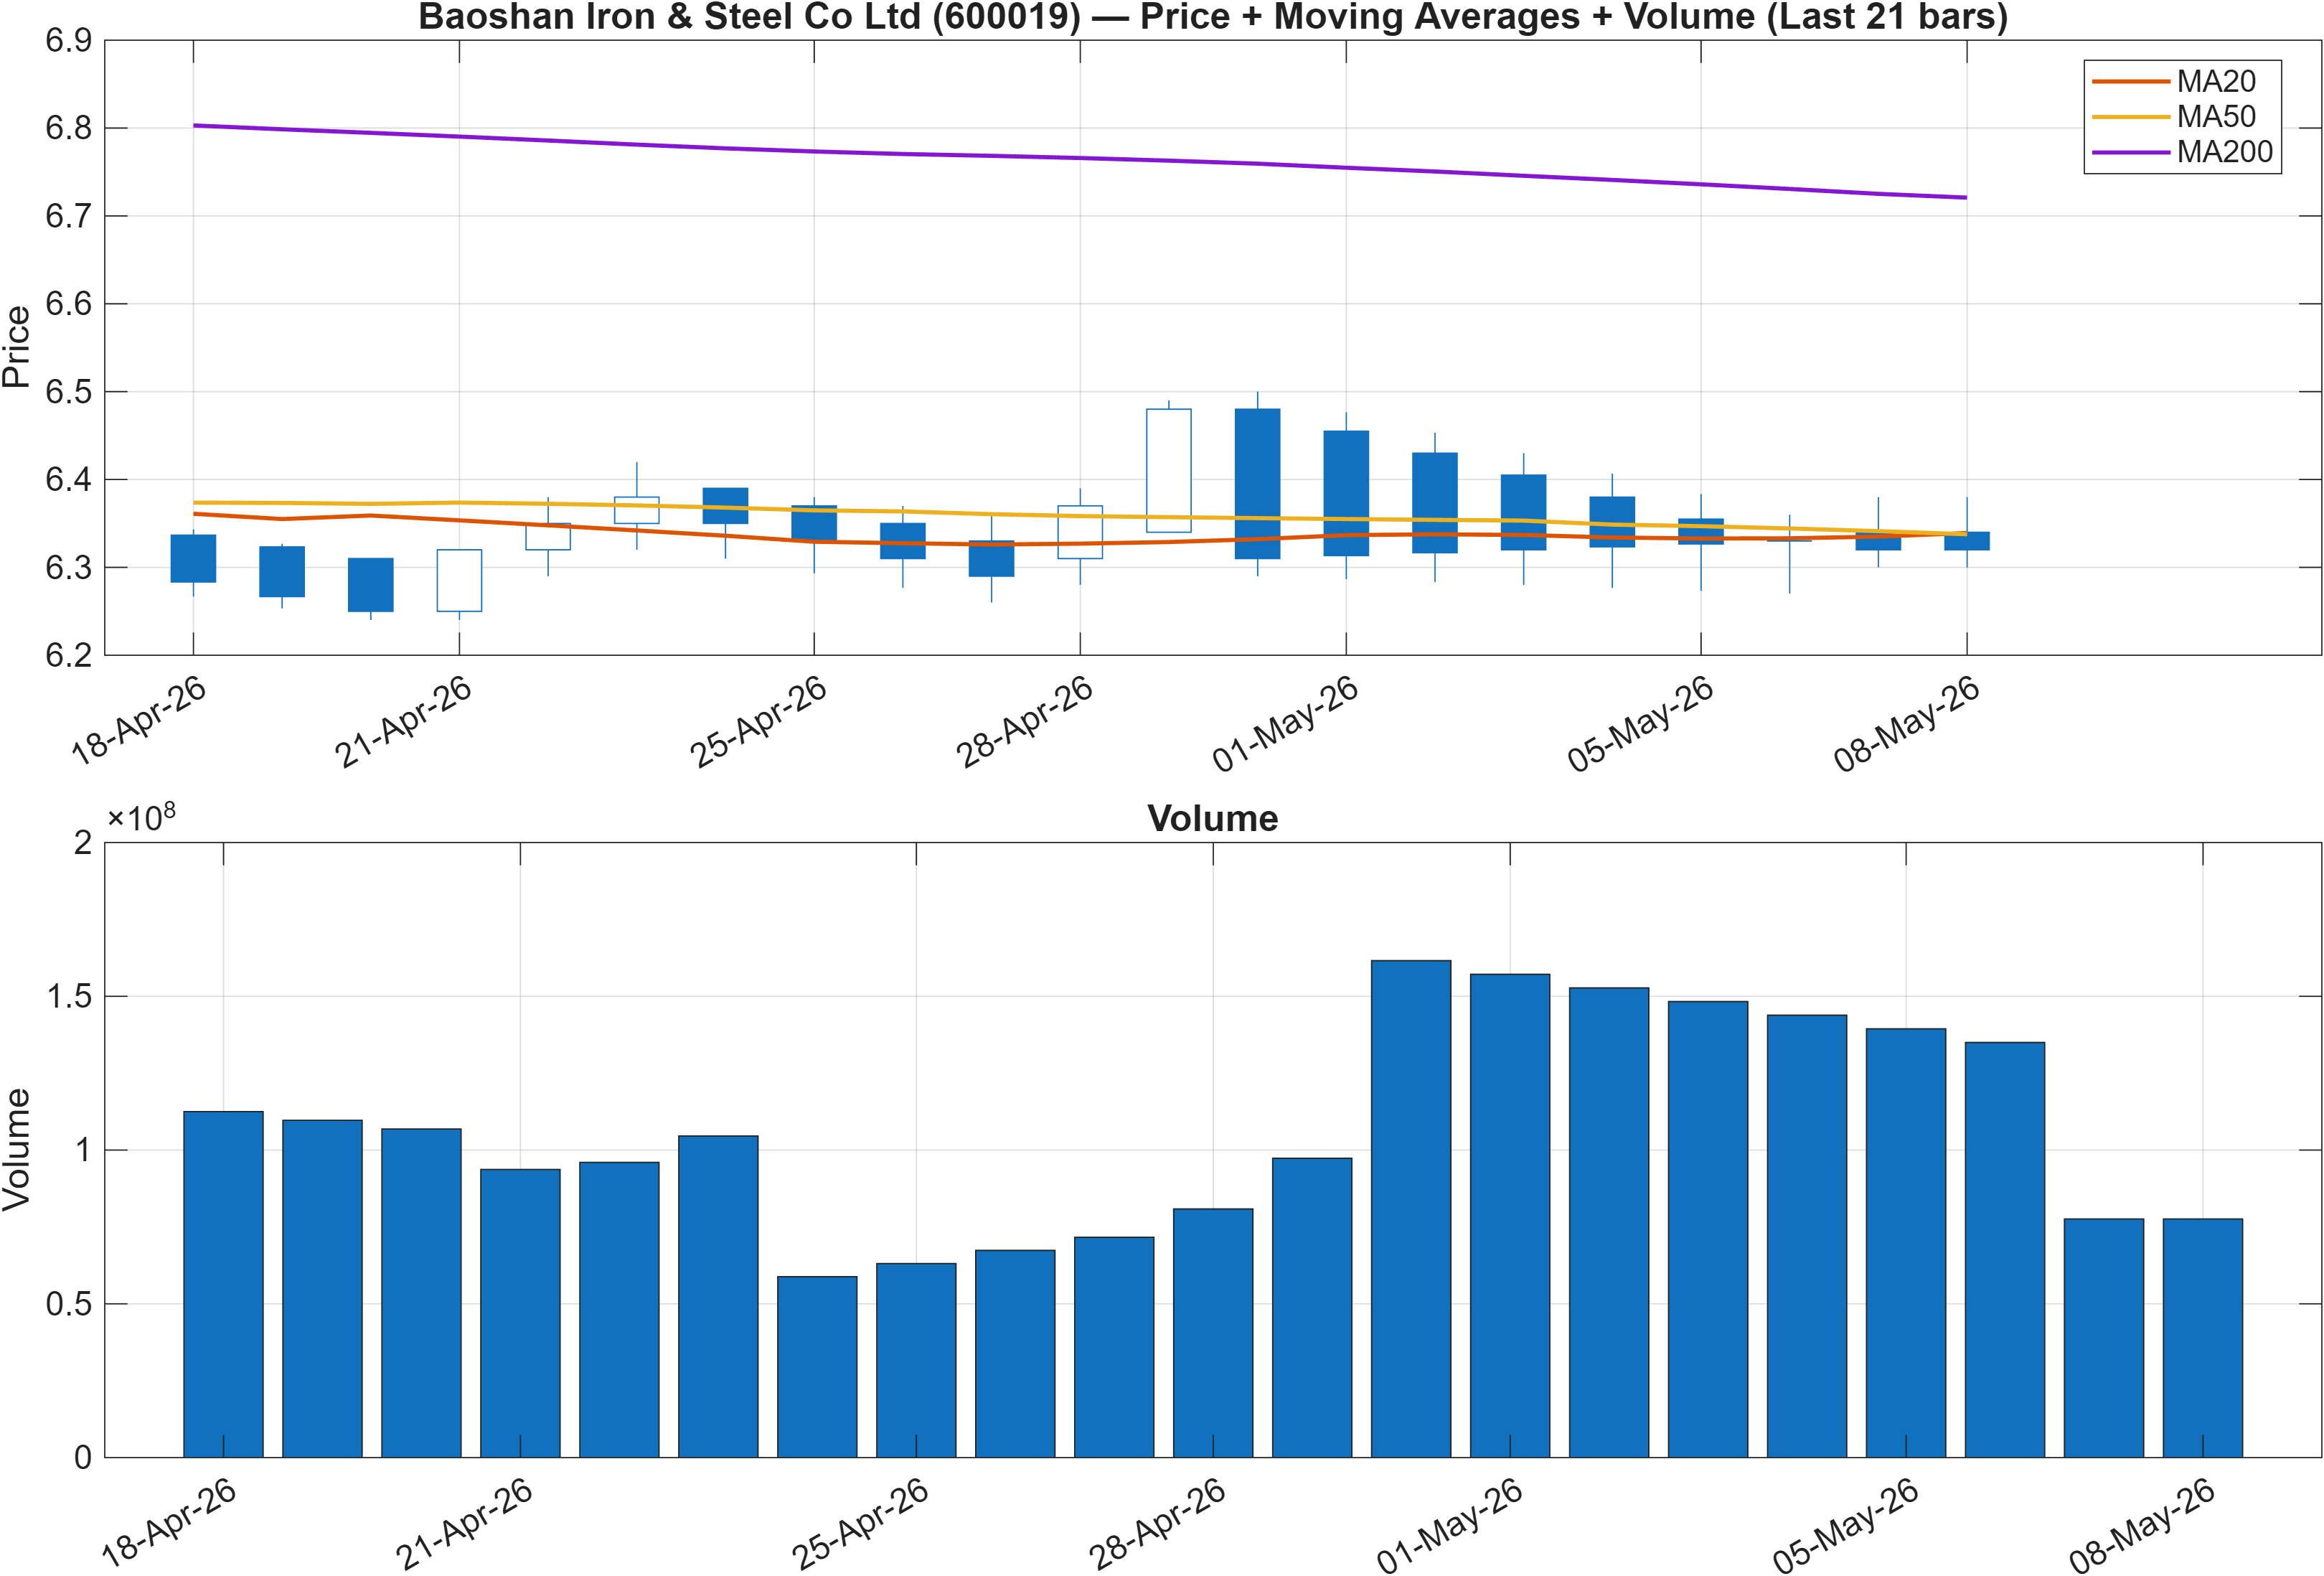
Interpretation: Close vs MA50 = Bearish, MA50 vs MA200 = Bearish.
The moving-average stack frames the current regime as trend-fragile. With the close below the MA50 and the MA50 below the MA200, the structure implies that recent price action has not yet reclaimed intermediate trend control and that the longer-term baseline remains tilted to the downside. This configuration tends to penalize rallies that lack follow-through, especially when price approaches overhead supply near resistance.
What makes this setup more nuanced is the broader context provided elsewhere in the report: the yearly rank is #165/1292 while the blended technical score remains 0.085 (Neutral). That combination often appears when the market is attempting to stabilize after a softer phase, but evidence of renewed leadership is still incomplete. Put differently, trend metrics are bearish, but cross-sectional and confluence readouts are not confirming a high-conviction breakdown.
The practical implication is that trend confirmation should be treated as conditional rather than assumed. A move that starts to hold above the resistance zone at 7.0750 would be the first step toward repairing the moving-average picture over time; conversely, pressure that pushes price below the support zone at 6.2633 would reinforce the bearish moving-average state and likely pull the medium-window ranks back toward weaker territory.
Until one of those level events occurs, the price/MA configuration argues for emphasizing process (level-driven confirmation) over interpretation of small fluctuations, particularly given the tight volatility regime noted in the Bollinger bandwidth.
3) Momentum & volatility dashboard
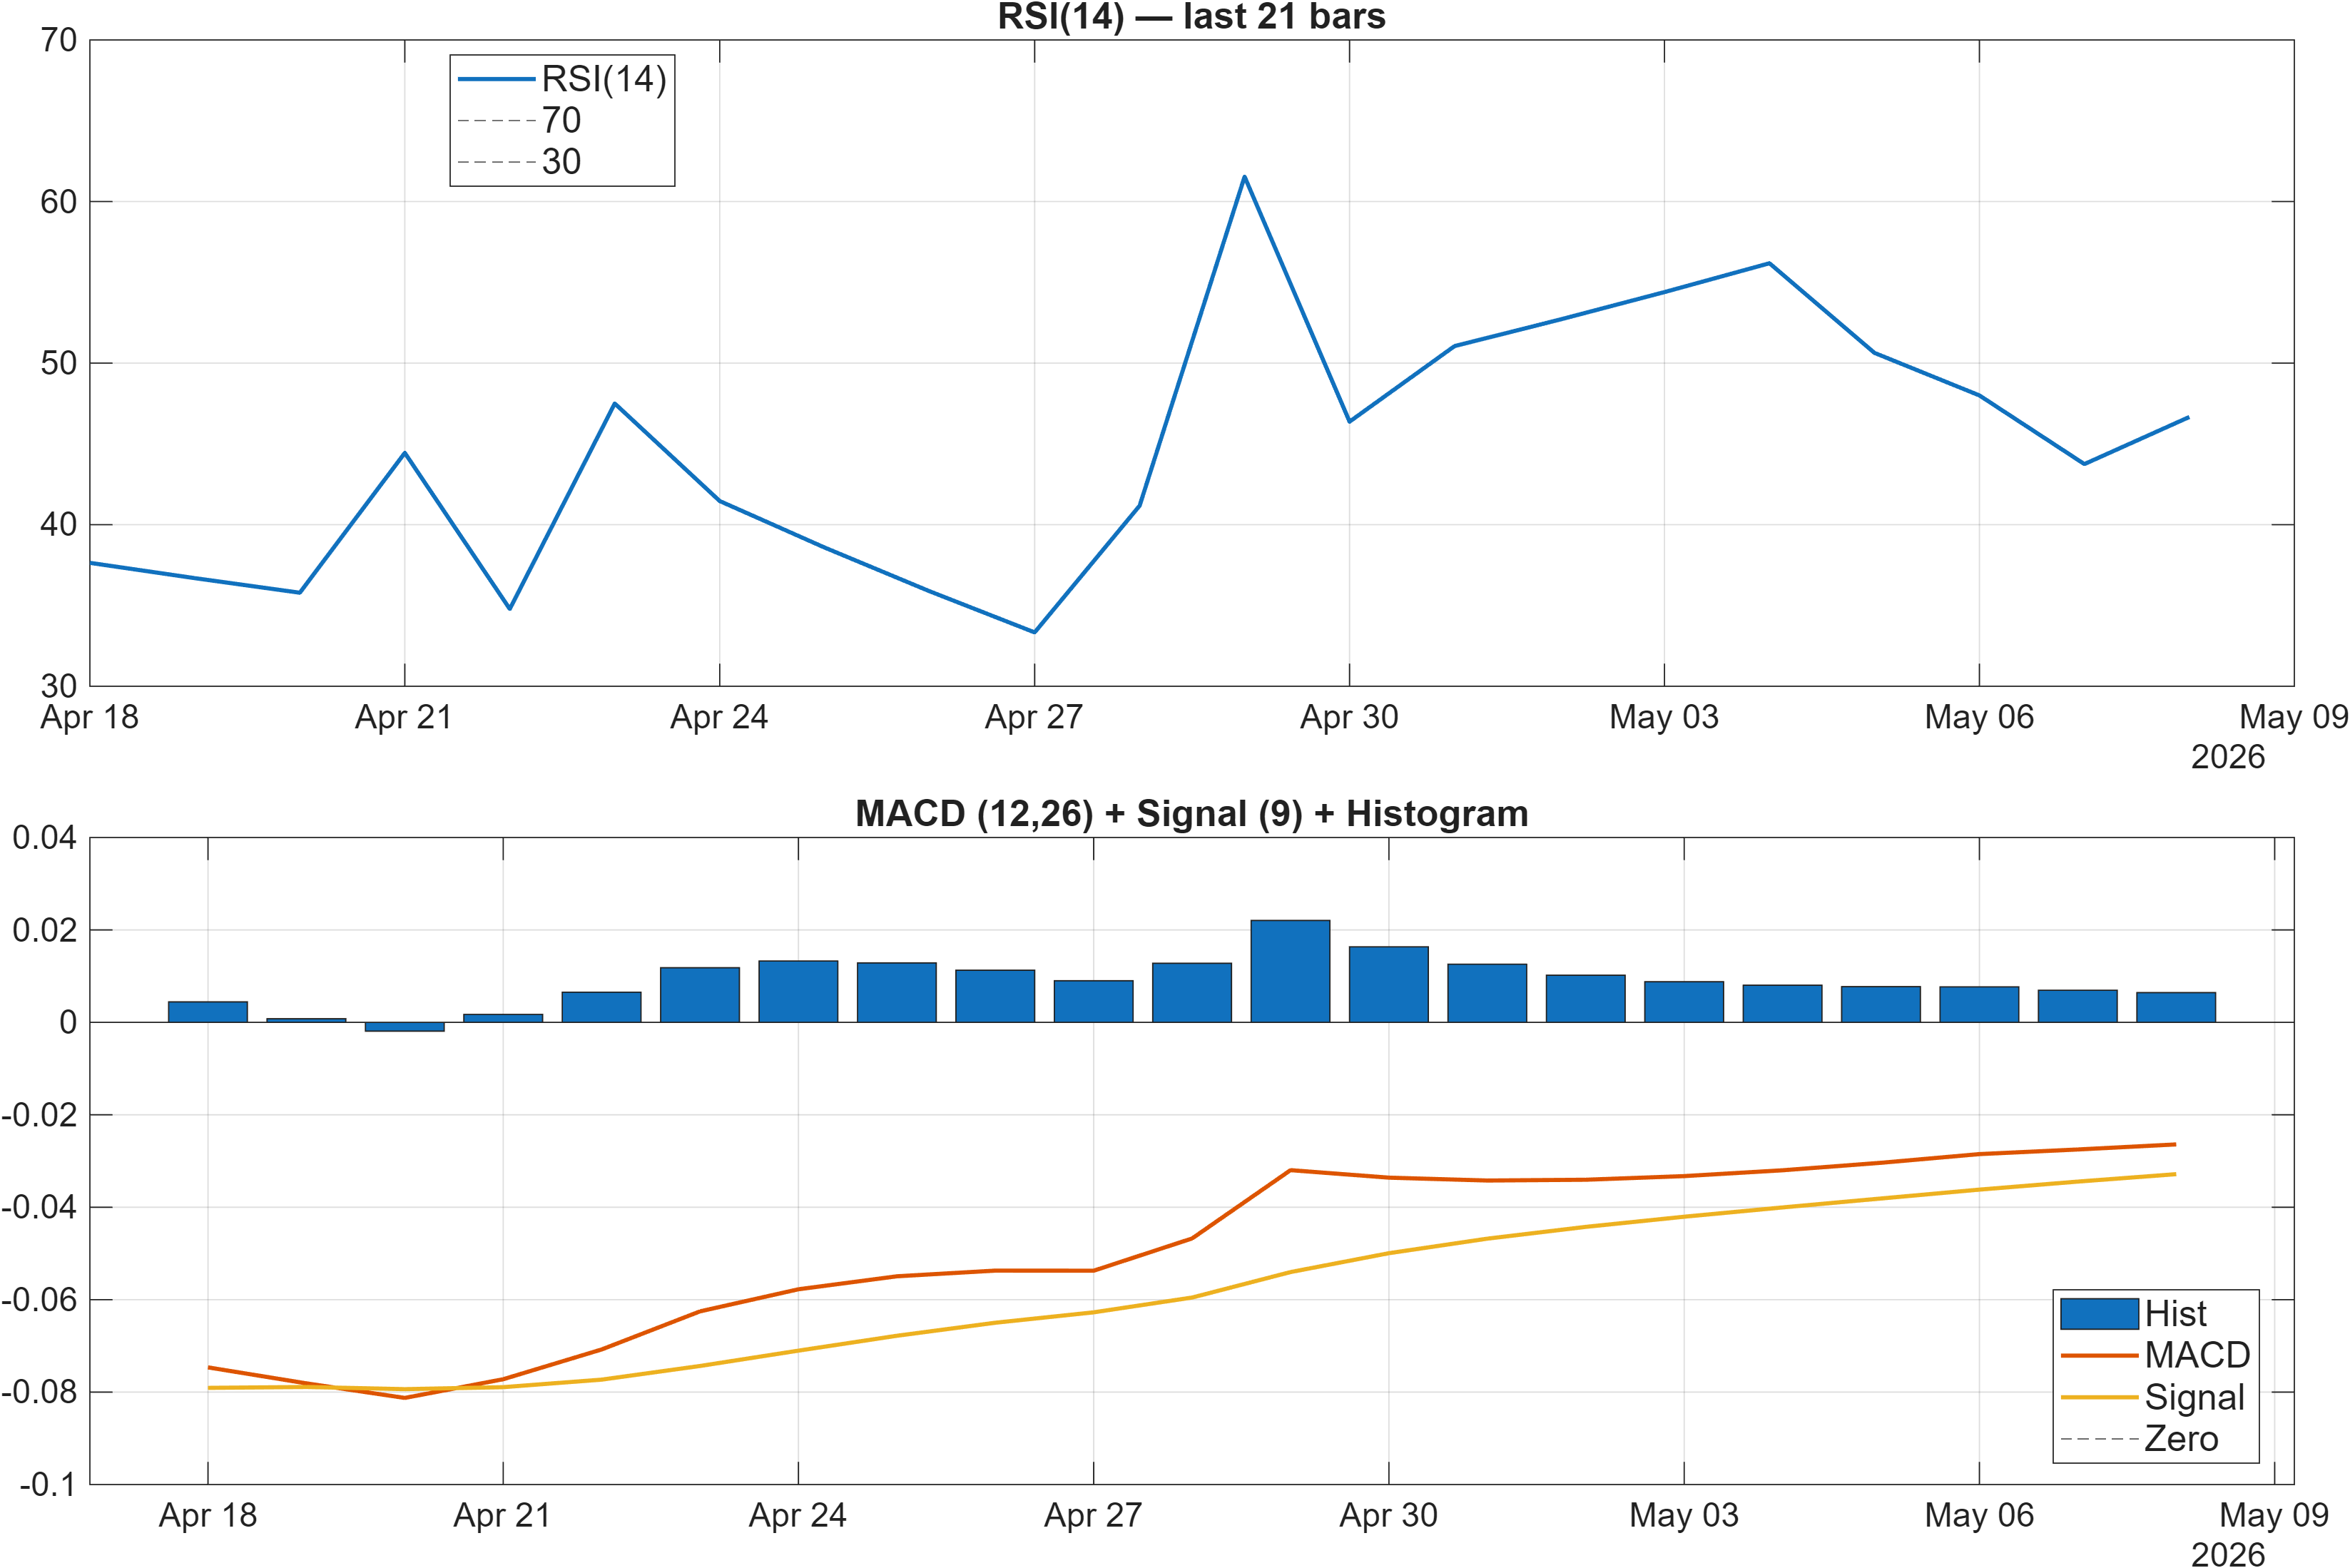
Interpretation: RSI bias = Neutral, MACD hist = 0.0064.
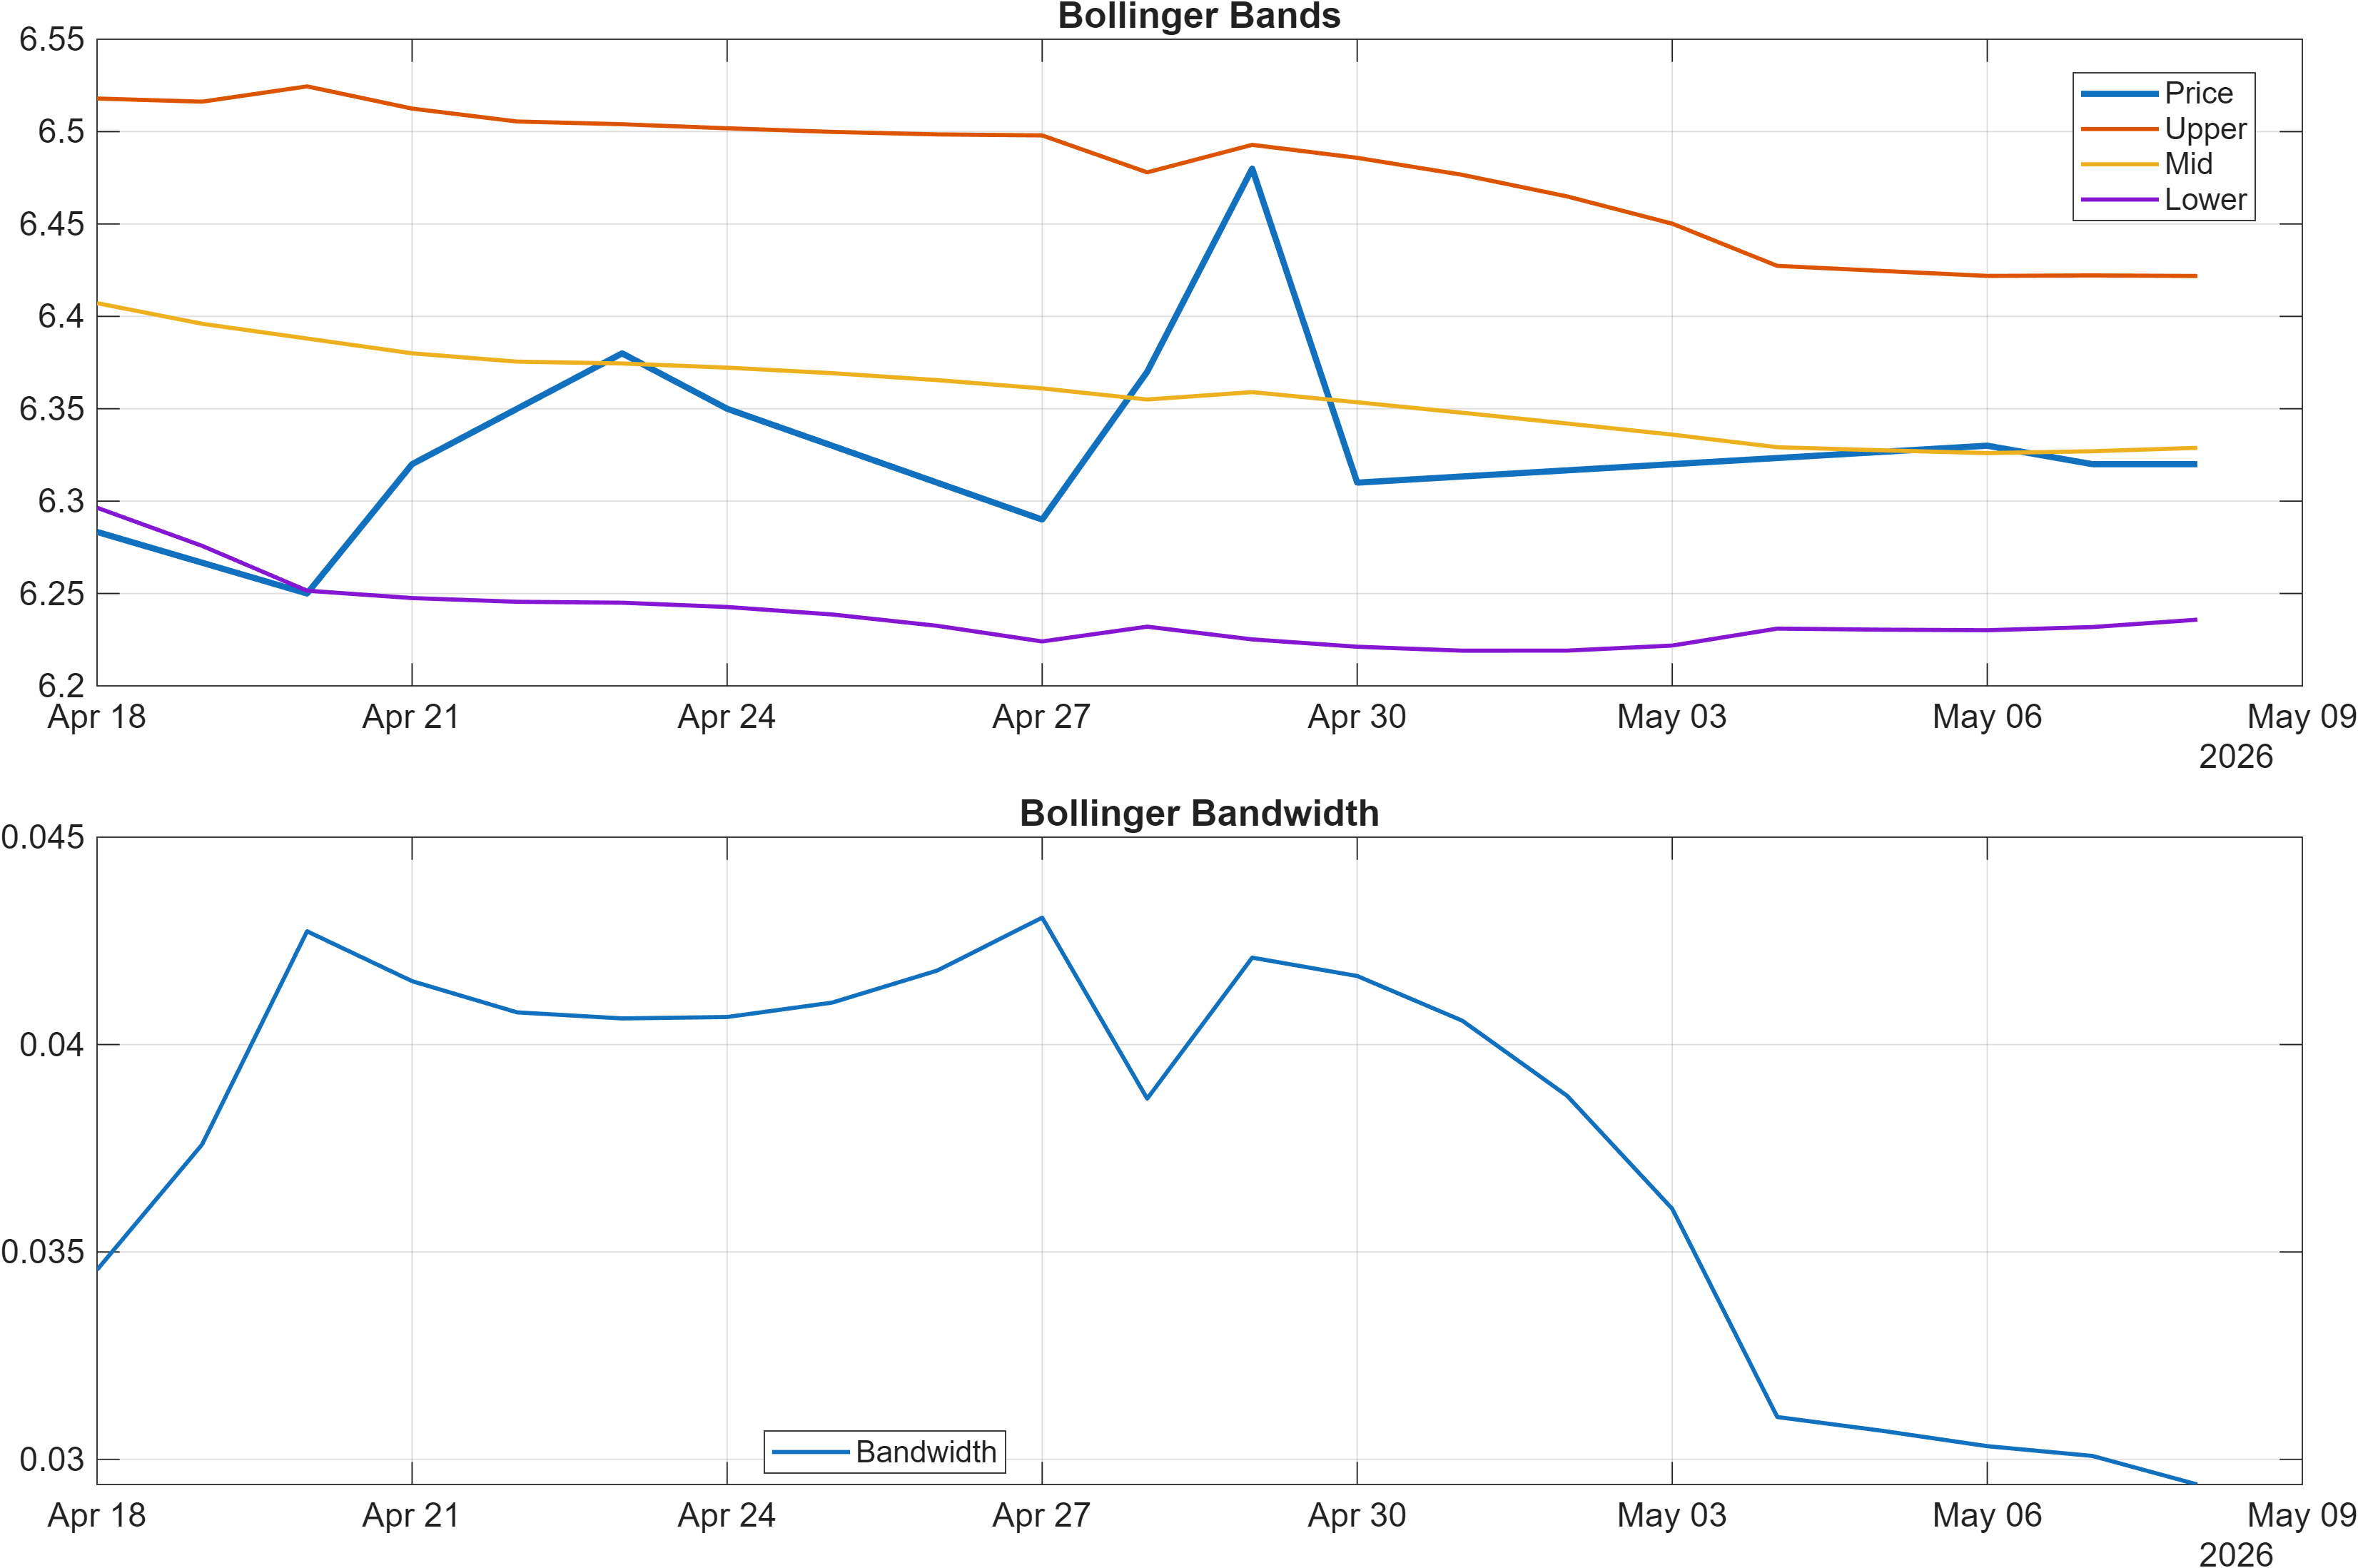
Interpretation: Bandwidth (volatility regime) latest = 0.0294.
Momentum and volatility signals point to a market that is not stretched yet also not decisively re-accelerating. The RSI(14) at 46.67 sits slightly below the midline, consistent with a neutral-to-soft bias rather than capitulation. Meanwhile, the MACD histogram at 0.0064 is marginally positive, indicating that downside momentum has eased, but the magnitude is small enough to interpret as early stabilization rather than a confirmed trend reversal.
Volatility is the second key dimension here. With Bollinger bandwidth at 0.0294, the regime is comparatively compressed, and compression regimes often increase sensitivity to level breaks. In other words, directional conviction can arrive quickly once price escapes a narrow range—making nearby support/resistance zones more informative than isolated oscillator prints.
The signal mix in the broader dashboard (covered later) reinforces this “stabilization without confirmation” narrative: a neutral confluence reading (0.222) alongside a neutral blended score (0.085) suggests that some momentum/price-action measures are improving, but not enough independent evidence is aligned to upgrade the state. This matters because moving averages remain bearish; for momentum to translate into trend repair, oscillators typically need to stay constructive during pullbacks rather than reverting to weaker prints.
Net: the momentum complex is consistent with a market seeking resolution under low volatility—an environment where confirmation is usually obtained through price behavior at clearly defined levels rather than through oscillator extremes.
4) Support / Resistance zones
Support ~ 6.2633 | Resistance ~ 7.0750
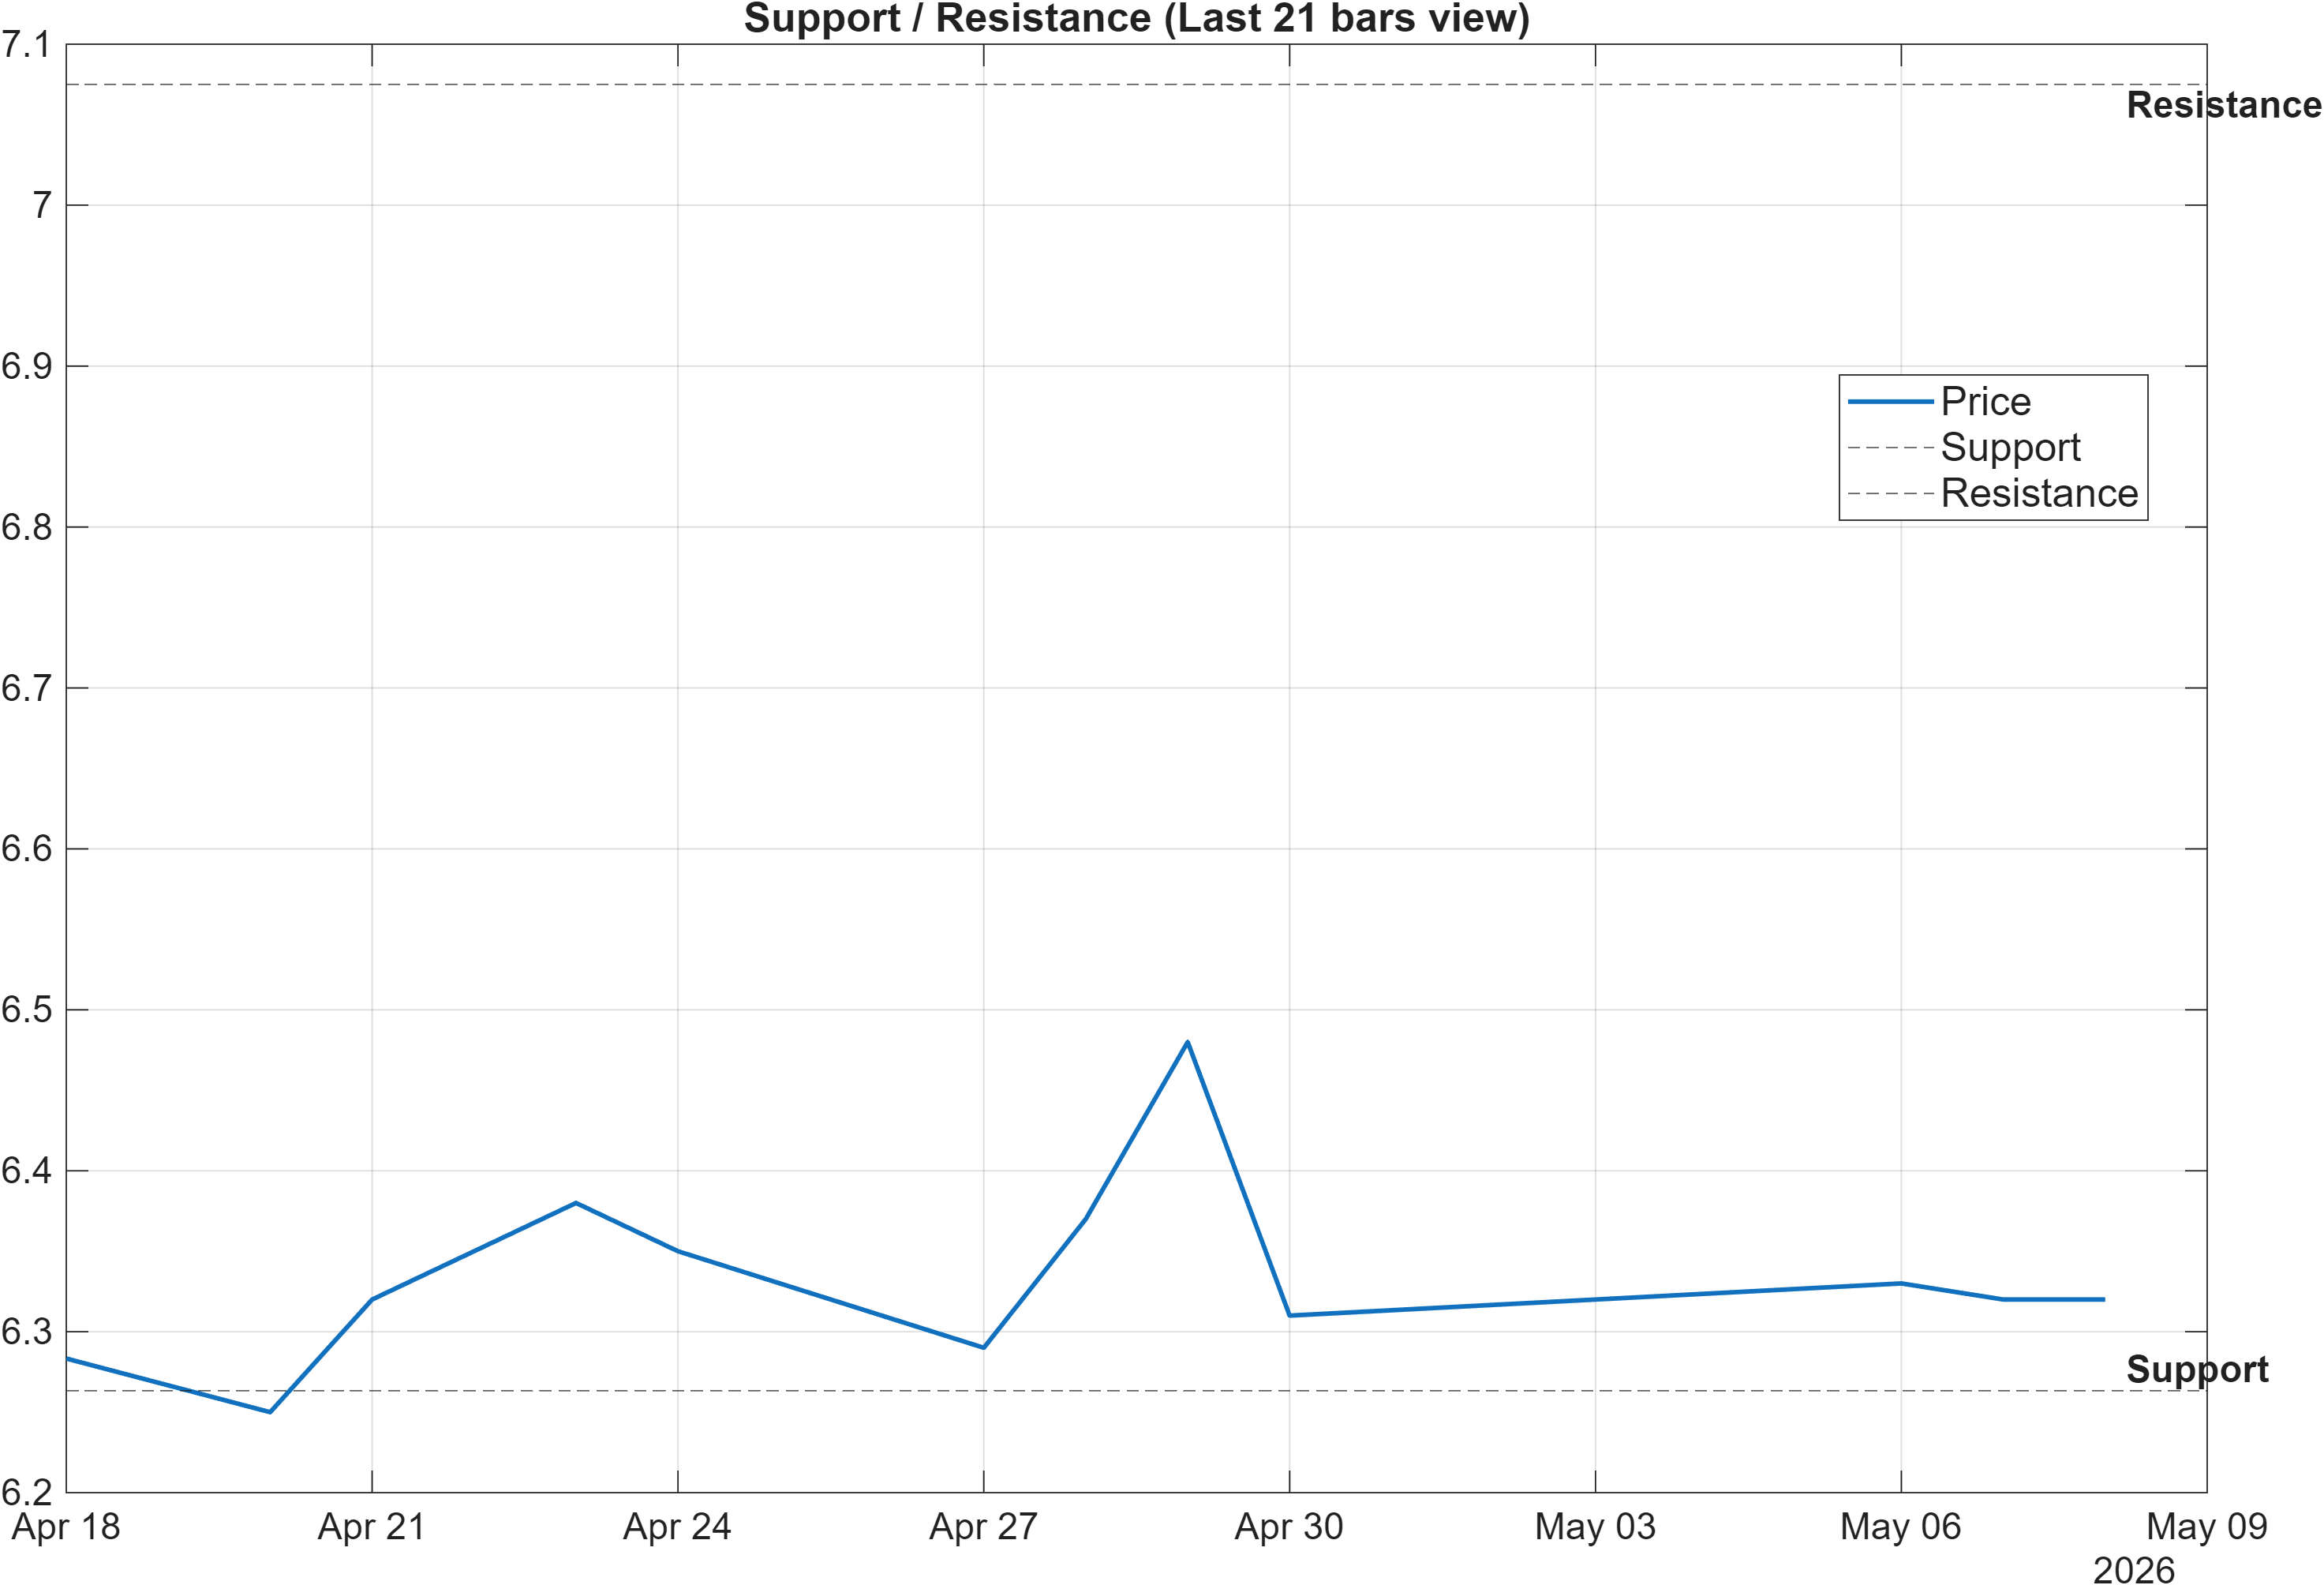
Scenario view: Break above resistance with volume → continuation. Close below support → signal deterioration risk.
The current map is defined by a relatively tight decision corridor between 6.2633 and 7.0750. In a low-volatility context (bandwidth 0.0294), these zones carry added informational value because mean-reverting price action can persist until a catalyst—technical or flow-driven—pushes price outside the range with sufficient participation.
From an alignment perspective, the levels also bridge otherwise mixed signals. Trend structure (close vs MA50 bearish; MA50 vs MA200 bearish) argues that the market has overhead work to do; momentum, however, is not decisively negative, with a neutral RSI (46.67) and a slightly positive MACD histogram (0.0064). That combination often results in repeated tests: resistance becomes the line where improving momentum must “prove itself,” while support becomes the line where neutral momentum must avoid slipping into renewed downside acceleration.
The report’s scenario framing is appropriately conditional: a break above 7.0750 with volume is treated as continuation confirmation, while a close below 6.2633 is treated as deterioration risk. Importantly, because the technical confluence is neutral (0.222) and the overall technical score is neutral (0.085), level breaks should be assessed for follow-through rather than treated as standalone events—particularly in instruments that can exhibit false breaks during compressed volatility regimes.
For positioning discipline, these zones function less as precise turning points and more as probabilistic decision areas that determine whether the current stabilization attempt develops into trend repair—or reverts into the prevailing bearish moving-average structure.
5) Quant Technical Dashboard (18 Signals)
KGNAI AI Technical Analysis Score (Deep Reinforcement Learning): Rank #797 out of 1292 (Rank 1 represents the strongest technical positioning and a higher probability of favorable price behavior. As ranks increase toward the maximum, the probability of favorable outcomes weakens and bearish positioning becomes more dominant.) | Label: Neutral | Score: -0.234
18-Signal Technical Confluence Score: 0.222 (Neutral)
Overall Technical Score (18-signal confluence + DRL rank blend): 0.085 (Neutral)
Note: The blended score reflects signal strength weighted against broader AI technical ranking, which may temporarily diverge.
Blended technical score breakdown: 0.085 (Neutral | Bull 9 / Bear 5 / Neutral 4)
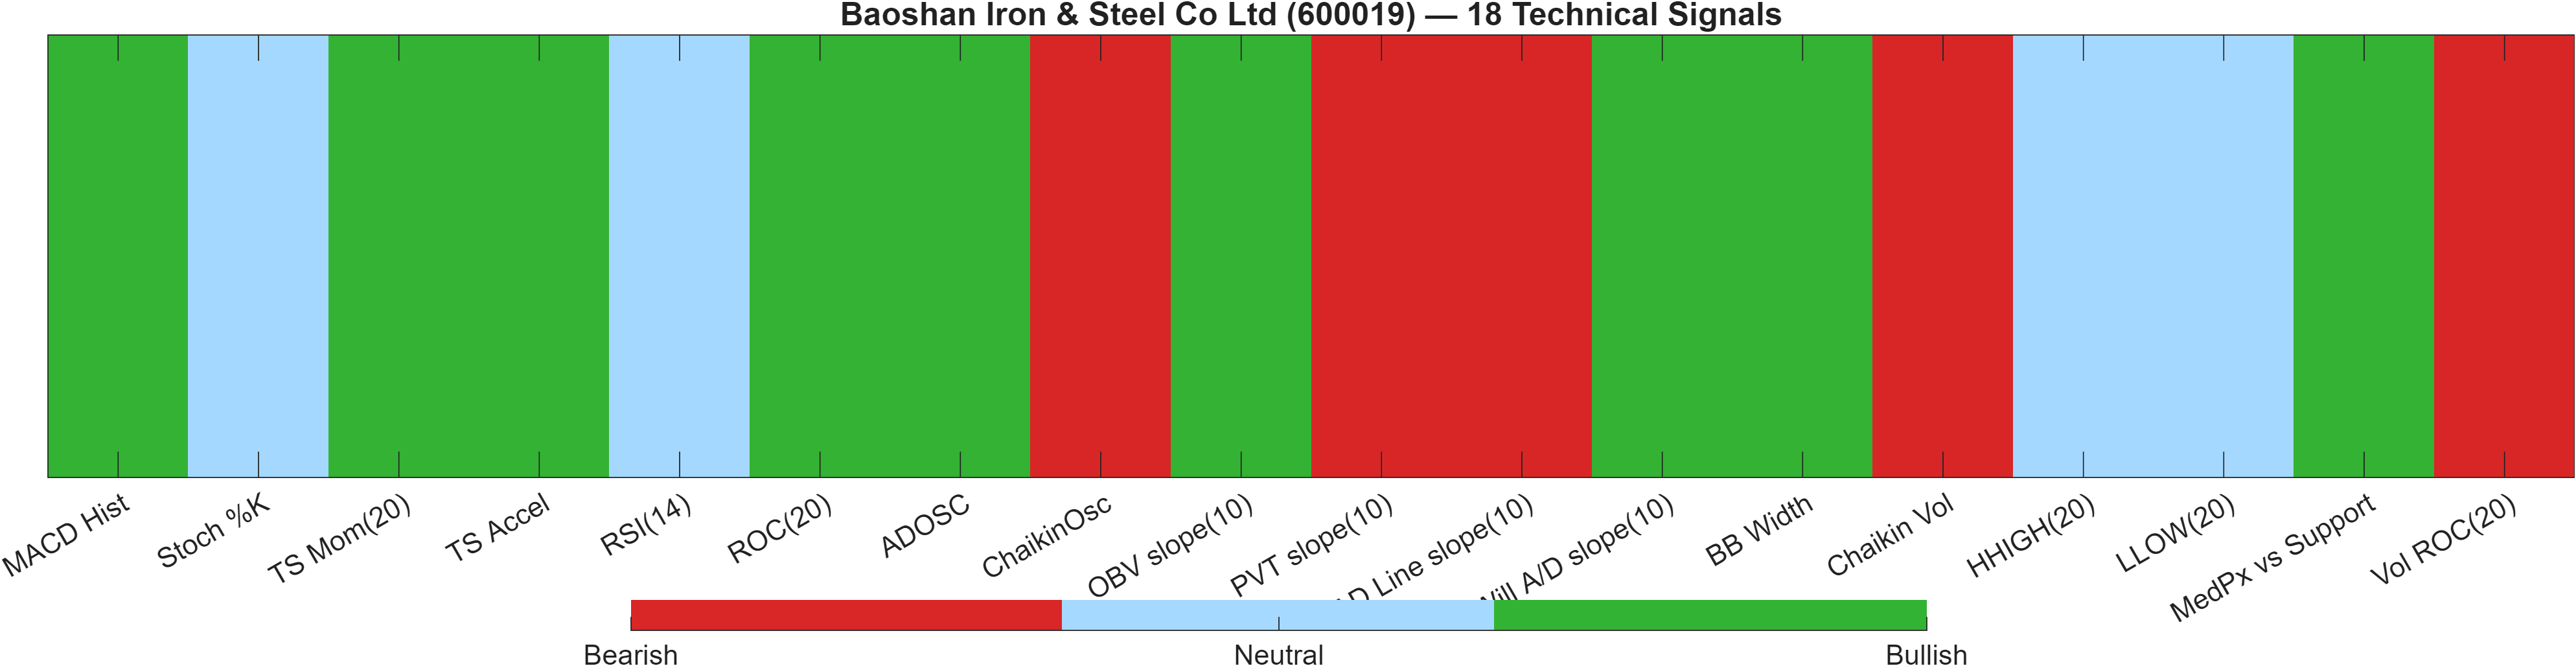
Signal integration: confluence vs model rank
The technical dashboard is best read as a two-layer system: (1) indicator confluence across 18 signals and (2) an AI technical rank from a Deep Reinforcement Learning model that contextualizes those signals against the broader universe. Here, confluence is 0.222 (Neutral) and the blended outcome is 0.085 (Neutral), while the DRL technical rank sits at #797/1292 with a score of -0.234. The spread between a neutral confluence and a weaker DRL rank is consistent with a market that shows pockets of improvement but still looks statistically less favorable versus peers when pattern history and broader-state features are considered.
The bull/bear/neutral composition—Bull 9 / Bear 5 / Neutral 4—also highlights internal disagreement rather than a clean regime. This matters because disagreements tend to amplify the importance of validation through price, especially near the defined corridor (6.2633–7.0750). In practical analytical terms, a neutral confluence can flip quickly when several correlated indicators (momentum, volatility expansion, participation) move together; the DRL rank acts as a brake on over-interpreting early shifts that historically have not produced durable follow-through.
Signal table (Bull/Bear/Neutral)
| Indicator | Value | Signal |
|---|---|---|
| MACD Hist | 0.006437 | Bullish |
| Stoch %K | 21.74 | Neutral |
| TS Mom(20) | 0.05333 | Bullish |
| TS Accel | 0.1967 | Bullish |
| RSI(14) | 46.67 | Neutral |
| ROC(20) | 0.8511 | Bullish |
| ADOSC | 37.5 | Bullish |
| ChaikinOsc | -9.797e+07 | Bearish |
| OBV slope(10) | 7.346e+08 | Bullish |
| PVT slope(10) | -2.219e+06 | Bearish |
| AD Line slope(10) | -3.989e+08 | Bearish |
| Will A/D slope(10) | 0.15 | Bullish |
| BB Width | 0.02939 | Bullish |
| Chaikin Vol | 8.375 | Bearish |
| HHIGH(20) | 6.5 | Neutral |
| LLOW(20) | 6.24 | Neutral |
| MedPx vs Support | 0.07667 | Bullish |
| Vol ROC(20) | -29.26 | Bearish |
Interpretation: Indicator-level signals form the base confluence, which is then adjusted using a separate AI-driven technical ranking model. The final technical score summarizes this combined view.
6) News sentiment + extractive gist
Note: Instrument-specific news matches were not found, so the digest includes broader market/sector headlines. Links are provided for verification.
Sentiment score (avg): 0.000 | Positive: 6% | Neutral: 88% | Negative: 6%
KGNAI AI News Sentiment Score (normalized -1 to +1): Not available (as of —) | Label: Not available | Overall news score: 0.00
Positive Developments
Recent coverage across major financial outlets is broadly low-signal for 600019 specifically, which is consistent with the dataset note that instrument-level matches were not found. Within the broader flow, the constructive element is the absence of company-targeted negative catalysts in the provided digest, aligning with the strongly neutral distribution (88% neutral) and a flat average sentiment reading (0.000). In this context, “positive” is best interpreted as reduced headline pressure rather than an explicit bullish driver. For a name already showing mixed technicals—neutral RSI bias with a slightly positive MACD histogram (0.0064)—a quieter news tape can allow price to respond more directly to technical levels such as 7.0750 without being continually interrupted by idiosyncratic shocks.
Neutral / Mixed Developments
The news mix is predominantly informational and cross-market in nature, which is reflected in the sentiment split (only 6% positive and 6% negative, with the remainder neutral). That profile typically contributes context rather than directional edge, especially when the normalized KGNAI news sentiment score is Not available in the provided data. For analysts, this makes technical evidence more central: volatility compression (bandwidth 0.0294) plus a neutral confluence score (0.222) often means that even modest shifts in attention can change short-term flows, but the baseline expectation remains range behavior until price confirms through support 6.2633 or resistance 7.0750.
Negative / Risk Signals
The principal risk signal in the provided digest is not a direct issuer risk but the presence of broader geopolitical and information-security narratives, which can raise macro-sentiment volatility for regionally linked risk assets even when a specific company is not the focus. With the average sentiment still at 0.000 and negative share at 6%, the data does not indicate a sustained negative press regime; however, in a market already showing bearish trend structure (close vs MA50 bearish; MA50 vs MA200 bearish), external risk headlines can reduce tolerance for technical failures. In practical terms, the support zone around 6.2633 becomes the key “stress test” area: a close below support would align technical deterioration with a less forgiving risk backdrop, even if sentiment metrics themselves remain mostly neutral.
What to monitor next
- Whether sentiment stays dominated by neutral coverage (88%) or begins skewing negative.
- Any emergence of instrument-specific news matches (currently not found in the provided data).
- Whether a volatility expansion accompanies a level break (support 6.2633 / resistance 7.0750).
Sources referenced: Reuters, Bloomberg, Yahoo Finance, MarketWatch, Investing.com
7) Sources
Not available in the provided data.
You may also like: How KGNAI AI ranks instruments across global markets
Disclaimer: KGNAI provides AI-generated analytics and educational market commentary only. This is not financial advice. Markets involve risk. Always do your own research.